1. Introduction
TO has always been a concern for many countries, especially developing countries (
Zahonogo 2016). This is because open economies often have faster growth rates than closed economies (
Grossman and Helpman 1991a;
Edwards 1993). When TO increases, production can be made more efficient and domestic technology is also improved; accordingly, productivity increases. In other words, TO can play an important role in stimulating EG. For this reason, in order to improve EG, TO is often a top priority for many countries. However, TO is not always as successful as expected (
Singh 2010). Indeed, if TO is not accompanied by macroeconomic stability and a favorable investment environment, it is difficult to promote its role in stimulating EG (
Newfarmer and Sztajerowska 2012).
In empirical studies, the impact of TO on EG is also a topic of great interest to many researchers; nevertheless, there are still conflicting views (
Zahonogo 2016). Indeed, some previous studies suggest that TO has a positive impact on EG—for example,
Chang et al. (
2009),
Kim (
2011), and
Jouini (
2015). In contrast,
Lucas (
1988),
Young (
1991),
Redding (
1999),
Kim and Lin (
2009), and
Herzer (
2013) have argued that TO could hinder EG in the long term if economic management policies are ineffective, as has been clearly shown in developing countries. Meanwhile, other studies point out that TO may not be related to EG (
Ulaşan 2015), or that TO may not be an important factor that stimulates EG (
Trejos and Barboza 2015).
Recently,
Zahonogo (
2016) stated that the impact of TO on EG is expressed through an inverted U-type curve, meaning that there is a threshold value of TO and an impact of TO on EG in positions before and after the threshold is different. To determine the threshold value of TO, this study used the analytical method on the quadratic function. Although the nonlinear impact of TO on EG has only been mentioned in a small number of recent studies, this is likely to occur in reality.
In general, the impact of TO on EG is not a new research topic. Despite this, there are still conflicting views about this impact in the existing literature. Recently,
Zahonogo (
2016) suggested that the impact of TO on EG is nonlinear. However, the number of empirical studies supporting this view is relatively limited. In particular, most of the existing literature uses the quadratic function method to examine the nonlinear impact between economic variables (
Haans et al. 2016). This method has the disadvantage of determining only a single threshold value, although in many practical cases more than one threshold value may exist. Therefore, it is necessary to use a new approach to address this limitation in the existing literature. Accordingly, the question of whether there is a nonlinear impact of TO on EG needs to be addressed. If there is a nonlinear impact of TO on EG, what is the threshold value of TO? Furthermore, can there be many threshold values of TO when it has an impact on EG? These are the questions that previous studies have not provided satisfactory answers to. In other words, this is a very interesting research problem and there are still gaps to be explored.
In this paper, the authors focus on examining the nonlinear impact of TO on EG through the fixed-effect panel threshold approach, thereby estimating the threshold value of TO. Using this new approach, the authors were able to discover more interesting things than previous studies have. Furthermore, the research data were collected from Asean-6 countries, which have witnessed relatively high rates of TO and EG in recent years, but there is a lack of empirical studies concerning this issue. Accordingly, the authors provide empirical evidence of the nonlinear impact of TO on EG in Asean-6 countries. The research results are an important foundation to help Asean-6 countries to formulate appropriate TO policies to stimulate EG in a more stable and sustainable manner.
The remaining content of the paper is presented as follows:
Section 2 demonstrates the literature review of previous studies,
Section 3 indicates the methodology,
Section 4 displays the results and discussion, and the final section contains the conclusions of the paper.
2. Literature Review
Traditional trade theory states that the benefits of trade at the country level are expressed through specialization, investment in innovation, productivity improvement, and enhanced resource allocation (
Zahonogo 2016). This is also evident in the Ricardian–Heckscher–Ohlin theoretical model (
Leamer and Levinsohn 1995). Accordingly, international trade openness can increase the output, because countries can allocate resources more efficiently after trade openness depending on their comparative advantage. The theory of international trade indicates that profits from trade can arise from a number of basic sources: the difference in comparative advantage and the increase in international trade around the globe (
Yanikkaya 2003). According to the theory of comparative advantage, international trade leads countries to use resources more efficiently because countries can import goods and services, instead of spending a lot of money on domestic production. This shows that imports are as important as exports in regard to economic activities. In other words, imports and exports are two inseparable and complementary factors. Therefore, international trade transactions are clearly shown through the TO of each country. This indicator shows the value of exports and imports for GDP (
Yanikkaya 2003;
Fetahi-Vehapi et al. 2015;
Zahonogo 2016).
Nowadays, commercial transactions not only take place within a country but also tend to expand globally. It can be said that international trade transactions are considered to be important catalysts of the EG of each country (
Fetahi-Vehapi et al. 2015). The impact of TO on EG has been examined in many studies in different economies, but there are still many contradictory views concerning this issue. One of the first theories that can be used to explain the relationship between TO and EG is the neoclassical growth theory drawn from
Solow’s (
1957) model. This theory assumes that EG in the long term is impacted mainly by exogenous technological progress. Therefore, TO may have an impact on EG in the long term if TO stimulates technological progress. In general, the neoclassical growth theory has a considerable limitation because it does not provide a theoretical framework proposing that commercial openness can stimulate technological progress. To overcome this limitation, we can use endogenous growth theories to more specifically explain the impact of TO on EG (
Grossman and Helpman 1991b;
Rivera-Batiz and Romer 1991). Accordingly, TO can provide four major opportunities for EG in the long term: (i) communication effect: international TO creates opportunities for countries to cooperate with foreign partners, thereby promoting technology transfer; (ii) duplication effect: TO encourages countries to create new ideas and technologies, and this limits the duplication of ideas and technologies between countries; (iii) integration effect: TO increases the market size that enterprises can access, which also increases the competition facing enterprises not only in the international market but also in the domestic market; (iv) allocation effect: TO pushes countries to specialize according to their comparative advantages, which enables countries to develop advantageous goods at lower costs compared to other countries. It can be seen that endogenous growth theories together with other classical theories provide a solid theoretical framework for the impact of TO on EG in the long term. Furthermore, these theories also explain why countries should increase their trade openness. However, each country’s resources are different, and each country has different comparative advantage and different policies on trade openness, which leads to the fact that some countries have higher TO levels than others.
In empirical studies, most documents argue that TO plays a key role in stimulating EG in each country; however, there are some contradictory views on the impact of TO on EG.
A large number of previous studies have shown that TO can stimulate EG in each country through increased access to advanced technologies (
Barro and Sala-i-Martin 1997;
Baldwin et al. 2005;
Almeida and Fernades 2008). At the same time, TO also enables countries to expand their markets, make good use of the opportunities offered by international integration, and greatly improve their productivity (
Alesina et al. 2000;
Bond et al. 2005). In other words, TO can have a positive impact on EG (
Chang et al. 2009;
Kim 2011;
Jouini 2015). Therefore, countries tend to increase their TO in expectation of stimulating EG, a phenomenon that is evident in developing countries (
Zahonogo 2016). Since the 1970s, a positive impact of TO on EG has been found in many empirical studies, most of which have conducted cross-border sample analyses. The first studies on the relationship between TO and EG using transnational data samples are
Balassa (
1978),
Feder (
1982), and
Ram (
1987). These studies conducted analyses based on the neoclassical growth theory.
Regarding exports as the representative of TO, these studies suggest that TO can promote EG. In the early 1990s, due to the emergence of significant liberalization reforms in many developing countries, the relationship between TO and EG was of more interest in empirical studies. During this period, the majority of empirical studies analyzed the relationship between TO and EG based on the endogenous growth theory. For example,
Dollar (
1992) concluded that TO had a positive relationship with EG in 95 developing countries.
Sachs and Warner (
1995) examined the impact of trade liberalization on EG in 122 countries, and their research results show that countries with TO often have higher EG rates than protectionist ones.
Frankel and Romer (
1999) indicated that TO generates higher income levels in 63 countries. By collecting data samples from more than 100 developing and developed countries,
Yanikkaya (
2003) argued that TO can boost EG through a number of channels such as technology transfers and comparative advantage.
Dollar and Kraay (
2004) claimed that TO contributes significantly to EG in developed and developing countries.
Freund and Bolaky (
2008) found that TO led to improvements in the standards of living and particularly promoted EG in 126 countries.
Chang et al. (
2009) emphasized that TO could significantly stimulate EG in 82 countries if those countries implemented other complementary policies.
Zeren and Ari (
2013) assumed that TO had a positive impact on EG in G7 countries. In another study,
Fetahi-Vehapi et al. (
2015) analyzed data samples from 10 South East European (SEE) countries and stated that trade cooperation in the region and integration into the global economy contributed significantly to promoting EG in these countries.
Although the role of TO in boosting EG is undeniable, there are some who think that TO can hinder EG (e.g.,
Lucas 1988;
Young 1991;
Redding 1999;
Kim and Lin 2009;
Herzer 2013). One of the most satisfactory explanations for this impact is that the management policies in many countries are ineffective. Indeed,
Newfarmer and Sztajerowska (
2012) argued that TO must be accompanied by macroeconomic stability and a favorable investment environment in order to boost EG. In another study,
Kim and Lin (
2009) found that TO played an important role in promoting long-term EG in 61 countries; nevertheless, the level of impact depended on the level of economic development in the countries. In fact, this study suggests that TO had a positive impact on EG in high-income economies. Meanwhile, in low-income economies, TO had a negative impact on EG. Therefore, the role of TO in stimulating EG seems to be more evident in developed economies. From the same viewpoint,
Herzer (
2013) analyzed data samples from 91 countries and found a positive impact of TO on EG in developed countries, but this impact was negative in developing countries.
From a different viewpoint, some studies suggest that the impact of TO on EG can be expressed through the inverted U-type curve, also known as the Laffer curve of trade. Accordingly, the impact of TO on EG significantly depends on the level of TO. Indeed,
Zahonogo (
2016) argued that the impact of TO on EG in 42 Sub-Saharan African (SSA) countries can be shown as an inverted U-type curve. Specifically, before the threshold value of TO (with the threshold value of 134.21%), the impact of TO on EG is positive, but this impact is negative after the threshold value. This shows that countries need more effective TO, and that TO must be accompanied by complementary policies to encourage funding for new investments and stimulate EG.
Furthermore, a number of studies propose that TO has a negligible impact on EG. For example,
Eris and Ulasan (
2013) found no statistically significant empirical evidence on the long-term impact of TO on EG. Nonetheless, macroeconomic uncertainties related to inflation are the major determinants of long-term EG in these countries. In another study,
Trejos and Barboza (
2015) presumed that TO is not an important factor in stimulating EG in Asia. Additionally,
Ulaşan (
2015) also argued that TO is not related to EG.
Overall, although the impact of TO on EG has been of great interest in empirical studies, this research topic remains controversial. Moreover, there may be a nonlinear impact of TO on EG, but only a very small number of empirical studies have been carried out on this issue. An example of this view is the study of
Zahonogo (
2016) concerning analyzing the data of Sub-Saharan African (SSA) countries. With the analysis of the quadratic function, this study finds only a single threshold value of TO. This approach is also found in most of the current literature concerning examining the nonlinear impact between economic variables (
Haans et al. 2016). However, the use of the quadratic function for analysis is limited when only a single threshold value can be determined, although in many practical cases more than one threshold value may exist. Furthermore,
Zahonogo (
2016) only carried out an analysis for a sample of Sub-Saharan African (SSA) countries, while for other regions and economies there is still a lack of empirical studies examining this issue. From the above arguments, we see that if there is a nonlinear impact of TO on EG, we can estimate the threshold value of TO when the impact of TO on EG may change. In particular, it is necessary to use a new approach in order to fully determine the threshold values of TO. Based on this threshold value, countries have a reliable foundation to propose appropriate TO policies in order to stimulate EG in a more stable and sustainable manner. It can be said that examining the nonlinear impact of TO on EG is a very important research topic, but it is rarely mentioned in empirical studies. On the other hand, in different economies and regions, the impact of TO on EG may be different. Therefore, it is essential to examine the nonlinear impact of TO on EG in different economies and regions in order to confirm the view of
Zahonogo (
2016).
In this study, the authors analyze the impact of TO on EG in Asean-6 countries, which have seen quite impressive TO and EG in the recent period. Based on the ideas of
Zahonogo (
2016), the authors argue that the impact of TO on EG may not be purely linear, but rather nonlinear. Moreover, the authors also state that more than one threshold value of TO may exist, which is also presumed to make a significant difference compared with the study of
Zahonogo (
2016). Based on this, the authors propose the following hypothesis for this study:
Hypothesis 1 (H1). There is a threshold value of TO, and before and after this threshold value the impact of TO on EG can change. In this case, the authors assume that the research model has one threshold value or several threshold values of TO.
In addition to determining the threshold values of TO, the authors also determine the impact of TO on EG before and after these threshold values. It can be seen that TO can enable countries to expand their markets and take advantage of many significant opportunities offered by international integration, which may contribute to stimulating EG. However, if TO increases to a high level without being combined with other complementary policies, this may not have much significant benefit for EG. Therefore, the authors propose the next two hypotheses for this study as follows:
Hypothesis 2 (H2). Before the threshold value, TO has a positive impact on EG.
Hypothesis 3 (H3). After the threshold value, the impact of TO on EG may change and at a lower level.
3. Methodology
This paper analyzes the data of Asean-6 countries (Indonesia, Malaysia, Thailand, Singapore, Philippines, and Vietnam). These are countries which have many similar characteristics and which have seen impressive rates of TO and EG in recent years. The research data were collected by the authors from the World Bank in the period 2004–2019. The use of this research period enables the authors to fully analyze the relationship between TO and EG before, during, and after the global financial crisis. Moreover, since 2004 Asean-6 countries have seen dramatic improvements in TO and EG. In particular, the data sample used for the analysis is strongly balanced, enabling the authors to use the fixed-effect panel threshold approach to estimate the research model. These are the main reasons why we decided to collect this data sample instead of collecting another data sample which may have resulted in more observations.
In this paper, the authors use the panel threshold regression approach proposed by
Hansen (
1999). Later,
Wang (
2015) developed this approach into a fixed-effect panel threshold model. This is an estimation method that allows the authors to determine the threshold value of TO and reflect the nonlinear impact of TO on EG. To determine the threshold value, many researchers use the quadratic function (
Haans et al. 2016). In the existing literature on this issue,
Zahonogo (
2016) is one of the very few studies to find a nonlinear impact of TO on EG. This study also uses the quadratic function to estimate the threshold value of TO. The use of the quadratic function to estimate the threshold value has a major limitation in that only one threshold value can be determined. Meanwhile, the impact of TO on EG can have more than one threshold value. Indeed, assuming that TO impacts EG in the form of an inverted U-type curve, as concluded by
Zahonogo (
2016), this also means that TO has a positive impact on EG when TO is before the threshold value, and this impact turns negative when TO exceeds the threshold value. This is not convincing, because when TO exceeds the threshold value, the impact of TO on EG may not immediately turn negative, but rather may take a certain amount of time to change. On the other hand, managers do not remain still to see the negative impact of TO on EG. They have specific policies to take advantage of the benefits offered by TO for the economy. This means that the level of impact of TO on EG may change when TO exceeds the threshold value, but this impact is not necessarily negative and may still be positive at a lower level than the case where TO is below the threshold value. When TO exceeds the threshold value, the impact of TO on EG may bring about many changes, as managers may have to adjust policies in accordance with each period. In other words, there can be more than one threshold value of TO when examining the impact of this factor on EG. To overcome the limitations of previous studies by determining more than one threshold value of TO, the fixed-effect panel threshold approach proves quite suitable, making it possible to determine up to three threshold values (
Wang 2015). Based on this, the authors used the fixed-effect panel threshold approach to estimate the research model in expectation of discovering more interesting findings than previous studies have.
The authors measured the variable of EG through nominal annual GDP growth; this measure is based on the study conducted by
Yanikkaya (
2003). This measure has the advantage of reflecting the growth trend of GDP over time. The authors measured the variable of TO using the ratio of the total volume of merchandise trade to GDP—namely, the total value of merchandise exports and imports divided by the value of GDP, which is calculated in current US dollars. The measure of TO that we used is limited in that it is not possible to show whether the country being analyzed is predominant in exports or imports. However, this measure has great advantages in that it can reflect the entirety of a country’s commercial transactions, including exports and imports. Therefore, from the perspective of a country’s TO, the measure of TO in this study is more appropriate than the separate measurement of exports or imports. This point of view is also consistent with the previous statement of
Yanikkaya (
2003) and
Fetahi-Vehapi et al. (
2015).
Furthermore, the authors also included the control variables of domestic investment (INV), inflation (INF), and financial crisis (CRISIS) in this paper. These control variables were determined by the authors based on the research of
Zahonogo (
2016). However, regarding the measurement of the financial crisis (CRISIS) variable, the authors identified the period of the global financial crisis as the period of 2008–2009, instead of the entire period of time after 2008, as used in
Zahonogo’s (
2016) study, because it is evident that the financial crisis originated in the United States and occurred most dramatically in the period of 2008–2009 (
Kapan and Minoiu 2018).
Based on the results of previous studies, the authors built a research model with the following general equation:
where:
Dependent variable: economic growth (EG);
Independent variable: trade openness (TO);
Control variable: CV is a set of control variables, including domestic investment (INV), inflation (INF), and financial crisis (CRISIS).
u is the country-specific effect. v is the time-specific constant. ε is the error term.
Table 1 describes the variables used in the research model.
4. Results and Discussion
Table 2 shows the preliminary statistics for variables in the research model of Asean-6 countries in the period 2004–2019. It can be seen that EG reached the lowest value (−1.514%) in Malaysia in 2009, while the highest value (14.526%) was achieved in Singapore in 2010. TO reached the lowest value (37.303%) in Indonesia in 2019, while the highest value (437.327%) was achieved in Singapore in 2008. In terms of the mean over the entire research period, Thailand was the country with the lowest EG (3.646%), while the highest EG (6.460%) belonged to Vietnam. Regarding TO, Indonesia was the country with the lowest mean (48.844%), while the highest mean (367.385%) belonged to Singapore.
Table 3 shows that the variables of TO, INV, and INF are positively correlated with EG. Meanwhile, the control variable of CRISIS is negatively correlated with EG.
Table 4 shows that the research model has the double threshold of TO at the 1% significance level. In particular, the double threshold of TO achieved the values of γ
1 = 129.873% and γ
2 = 147.842%, respectively. This shows that the hypothesis H
1 is accepted.
Therefore, Equation (1) is developed into the following equations:
where ϒ
1 and ϒ
2 are the threshold values of TO, respectively, and I(.) is an indicator function of the threshold variable.
In order to determine the impact of TO on economic growth before and after the threshold, the authors estimated the research model using the fixed-effect panel threshold approach. This estimation result is presented in
Table 5 below.
Table 3 shows that the estimation results for the research model with the fixed-effect panel threshold approach proved suitable and significant at the 1% level. Moreover, the mean VIF has a rather low value; accordingly, the research model does not seriously suffer from the multicollinearity problem. At the same time, the research model does not suffer from heteroscedasticity and autocorrelation. In particular, the Ramsey reset test is suitable and shows that the research model does not miss important variables. The R-squared (within) reached 37.65%. This shows that the variables in the research model can be used to explain 37.65% of the volatility of EG. Overall, it can be said that the estimation results of the research model are quite suitable and usable. Accordingly, before and after the thresholds, TO has a positive impact on EG at the 1% significance level, but the impact level before and after these thresholds is different. Therefore, the hypotheses H
2 and H
3 are accepted.
With TO reaching a value less than or equal to the threshold ϒ
1 (TO ≤ 129.873%), TO has a positive impact (β
1 = 0.056) on EG. Accordingly, with TO less than or equal to 129.873%, if TO increases by 1% EG increases by 0.056%. In this research sample, Indonesia, the Philippines, and Thailand are the three countries with a mean TO less than ϒ
1. Based on
Figure 1, it can be seen that the positive effect of TO on EG is evident in these three countries. For example, TO fell deeply in the period 2008–2009, which caused EG to drop sharply. During the periods 2009–2010 and 2016–2017, TO in these three countries improved a lot, which boosted EG. Thereby, we can see that TO has an important role in promoting EG.
With TO reaching a value greater than the threshold ϒ
1 and less than or equal to the threshold ϒ
2 (129.873% < TO ≤ 147.842%), it is evident that TO has a positive impact on EG but at a lower level (β
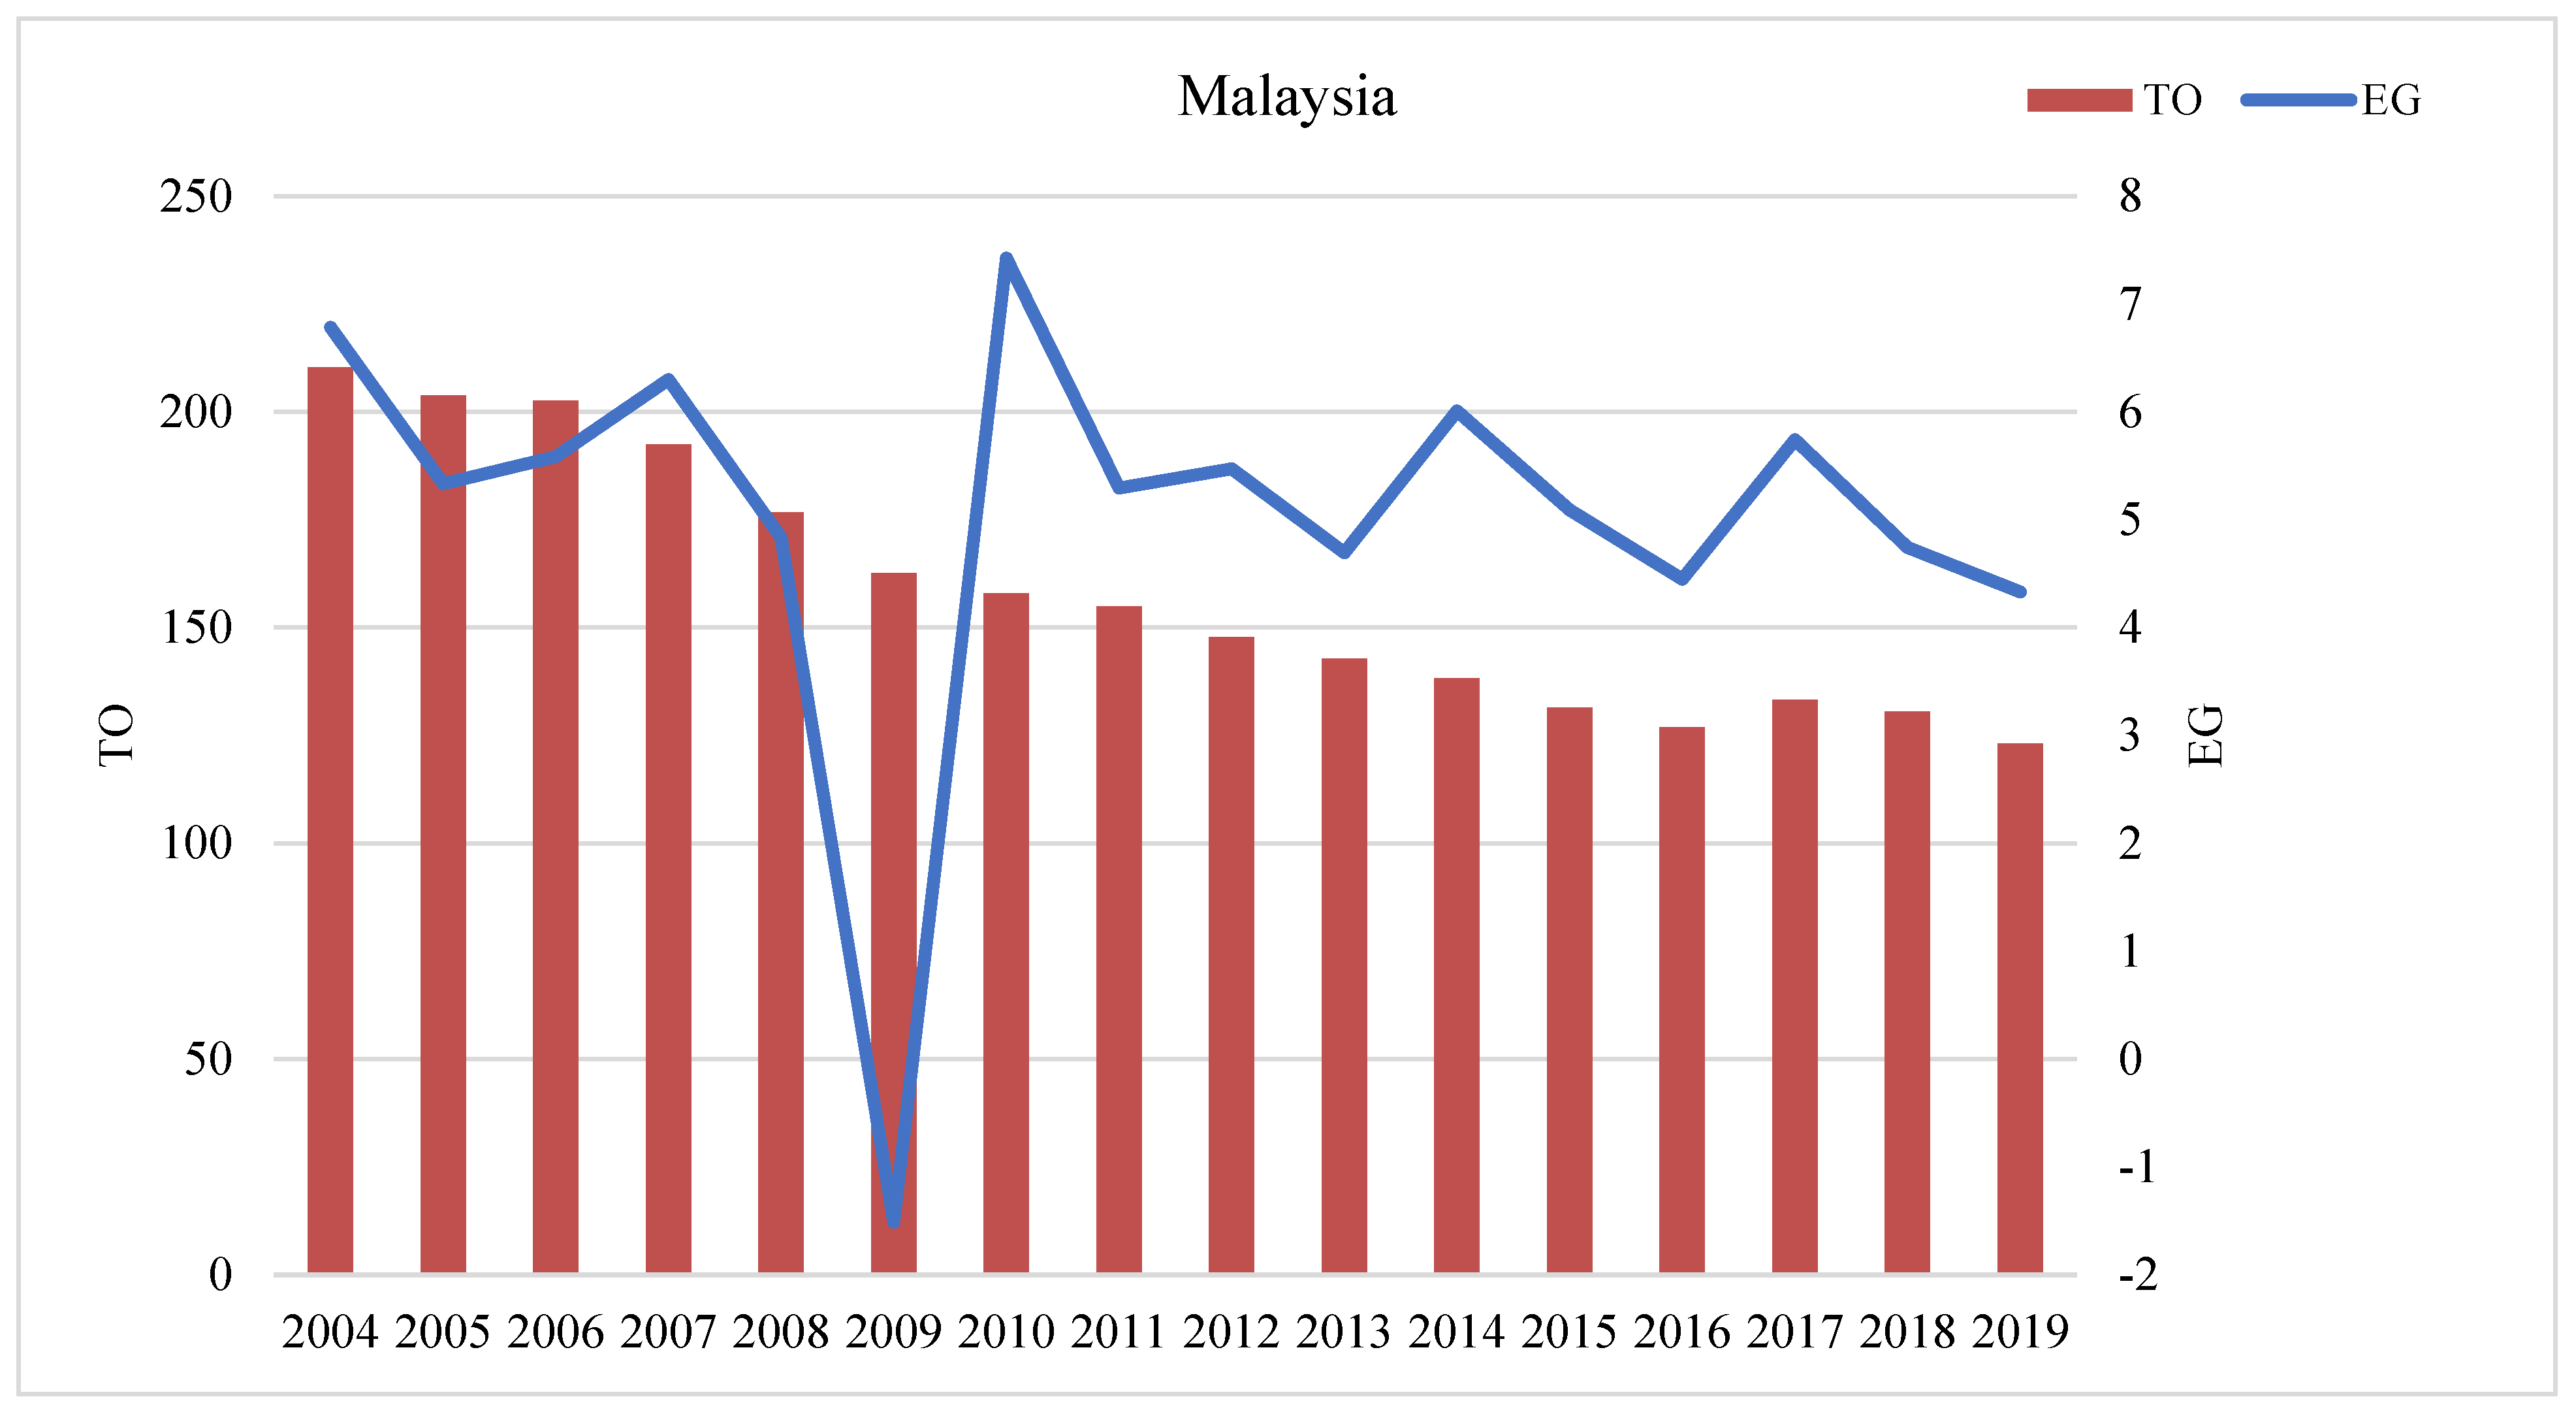
2 = 0.047). This shows that TO is between 129.873% and 147.842%, and if TO increases by 1% EG increases by 0.047%. In this context, we can point to the case of Malaysia in the period 2014–2016, when TO tended to decrease, which caused EG to decrease significantly (
Figure 2).
With the TO reaching a value greater than the threshold ϒ2 (TO > 147.842%), it is evident that TO has a positive impact (β3 = 0.038) on EG. Accordingly, with a TO greater than 147.842%, if TO increases by 1% EG increases by 0.038%. Malaysia, Singapore, and Vietnam are the three countries where the average TO exceeds ϒ2. Accordingly, Singapore is the only country with TO exceeding ϒ2 in the entire research period. Although the positive impact of TO on EG is still very evident, this country had a rather modest EG in the recent period. For Malaysia, the country had a higher TO than ϒ2 during the period 2004–2008. However, the declining trend of TO during this period led to a decline in EG. For Vietnam, when TO exceeded ϒ2, the positive impact of TO on EG was evident in the period 2012–2019. At that time, the improvement of TO was followed by a slight increase in EG. In general, when TO exceeds ϒ2, TO still positively affects EG but at a lower level than in the cases before the threshold.
In addition, the intercept reaches the value of −4.175 at the 10% significance level, which implies that, if international trade ceases, there is no more gross capital formation, the inflation is zero, and there is no financial crisis, EG decreases by 4.175%.
The findings above show that international TO can significantly improve each country’s EG. This is also quite understandable, because TO can help countries to gain high access to advanced technology (
Barro and Sala-i-Martin 1997;
Baldwin et al. 2005;
Almeida and Fernades 2008) and to expand the market to regions with great potential (
Alesina et al. 2000;
Bond et al. 2005), thereby stimulating EG. This result is also completely consistent with endogenous growth theories. However, the level of positive impact of TO on EG depends on the value of TO, which is an interesting finding of this study compared to previous studies.
In this paper, the authors found a nonlinear impact of TO on EG. This finding is consistent with the previous view of
Zahonogo (
2016) and consistent with the Laffer Curve of Trade theory. Nevertheless,
Zahonogo (
2016) argued that the impact of TO on EG is expressed through an inverted U-type curve, which means that there is only one threshold value of TO. Meanwhile, this study found two threshold values of TO. Furthermore,
Zahonogo (
2016) suggested that the impact of TO on EG was negative when TO exceeded the threshold value, whereas this study found a positive effect of TO on EG before and after the threshold values, but the level of this impact varies depending on the value of TO.
It can be said that this is an interesting finding and that this is the difference of this study compared to previous studies. Indeed, the findings in this study show that TO plays an important role in stimulating EG, but when TO exceeds the threshold value ϒ1 (TO > 129.873%) its role of stimulating EG is still shown but at a lower level. In particular, when TO exceeds the threshold value ϒ2 (TO > 147.842%), the impact of TO on EG is still positive but takes a relatively low value. It can be said that this is empirical evidence to find two threshold values of TO when it affects EG. This is also quite consistent with the reality in Asean-6 countries, as most of these are emerging economies and TO is still in the early stage of development, not showing many shortcomings. Thus, TO always plays the role of stimulating EG (even after the threshold values). Although the research model results do not reveal the negative impact of TO on EG, the research results clearly show that when TO exceeds the threshold values, the positive impact of TO on EG decreases dramatically. It can be said that this is a big difference and an interesting finding of this paper compared to previous studies.
In addition, the results of the research model show that EG was positively impacted (0.105) by INV at the 10% significance level and negatively impacted (−3.110) by CRISIS at the 1% significance level. This indicates that domestic investment and the global financial crisis also have significant impacts on EG in Asean-6 countries. Accordingly, we can see that TO must be accompanied by macroeconomic stability and a favorable investment environment in order to stimulate EG. In other words, TO must be accompanied by complementary policies to stimulate EG. This is quite consistent with the previous statements of
Newfarmer and Sztajerowska (
2012) and
Zahonogo (
2016). In this study, the authors found a negative impact (−3.110) of CRISIS on EG at the 1% significance level, which shows that the global financial crisis had a significantly negative impact on EG. This is an interesting finding of this study compared with previous studies. Furthermore, with the identification of the global financial crisis, which appears the most severe in the period 2008–2009 when measuring the variable of CRISIS, the results of this study are likely to be more reliable than those of previous studies.
Overall, the findings of this study show that, in addition to promoting TO, the measures used to increase efficiency in managing TO are important. In other words, Asean-6 countries need to combine TO with complementary policies. In addition, these countries need to take practical measures to limit the negative impact of the global financial crisis on EG.
5. Conclusions
This study identified the nonlinear impact of TO on EG in Asean-6 countries. Moreover, the authors estimated two threshold values of TO (ϒ1 = 129.873%, ϒ2 = 147.842%) when it affects EG. This shows that TO has a significantly positive impact on EG, but the impact level before and after the two threshold values of TO is different. In other words, if TO is increased at a high level (beyond the threshold value) without combining with other complementary policies, it does not create high-efficiency EG. In addition, the authors found a significant impact of the control variables of domestic investment and financial crisis on EG. These findings are an important foundation for Asean-6 countries to come up with appropriate TO policies to stimulate EG. Based on the findings of this study, the authors propose some policy implications for Asean-6 countries to boost EG in a stable and sustainable manner as follows:
- -
For TO: The research results show that TO has an important role in promoting EG. Therefore, Asean-6 countries need to promote TO together with effective management. The promotion and management of TO should be conducted carefully to ensure that they are suitable for the specific characteristics of each country. Excessive trade openness should be avoided and appropriate management measures should be accompanied; otherwise, this leads to the waste of domestic resources and hinder EG. For example, in the countries with a lower TO than Y1 (such as Indonesia, the Philippines, and Thailand), the promotion of TO needs to be performed more strongly; at the same time, attention should be paid to the management of TO in order to take advantage of the benefits offered by TO for EG. In the countries with a greater TO than ϒ1 (such as Malaysia, Singapore, and Vietnam), the promotion of TO has achieved certain success. However, the positive impact of TO on EG is somewhat attenuated when TO exceeds ϒ2. Therefore, these countries need to improve the management of TO and be combined with many other complementary policies to further boost EG in a sustainable way. In general, the Asean-6 countries need to pay more attention to the promotion and effective management of TO in order to stimulate EG. The Asean-6 countries need to focus on the further improvement in both exports and imports. In order to do this, it is important for Asean-6 countries to develop a road map for trade openness in accordance with the country’s specific characteristics, make the most of the country’s advantage, use domestic resources efficiently, as well as participate in regional and global trade agreements. Simultaneously, Asean-6 countries also need to improve the supply chain of goods in the region and around the globe, combined with the management of goods quality. In addition, all types of trade need to develop towards the harmonious combination between modern trade and traditional trade in accordance with the characteristics of each market.
The Asean-6 countries need to increase their export value. To do this, Asean-6 countries need to identify the key export products that are suitable for the specific characteristics of each country so that these countries can increase their export value with many competitive advantages. Simultaneously, Asean-6 countries need to improve their export value in traditional markets and combine with the expansion of exports to new markets with great potential.
For the import, Asean-6 countries need to increase their search for sources of imported raw materials to serve domestic production and export, thereby ensuring the supply of raw materials for domestic production and contributing to ensuring export growth. In addition, Asean-6 countries need to take practical measures to stimulate import and export activities, and these measures must be adjusted in a timely manner in order to be consistent with reality at each time and in accordance with international practices.
- -
For domestic investment: Asean-6 countries need to stimulate domestic investment, which is an important source of capital to help improve EG in these countries. Asean-6 countries need to take practical measures to facilitate domestic investment activities, increasing their search for domestic investment, especially low-cost investments.
- -
For the financial crisis: Asean-6 countries need to improve their forecasting of the domestic and international macroeconomic situation. Accordingly, Asean-6 countries have a reliable basis to take practical and timely measures to limit the negative impacts of global financial crises and unusual developments of the global economy on domestic EG.
Although our set objectives have been achieved, this study still faces major limitations, as it only considers TO through the proportion between the total volume of goods trade transactions (including the total value of merchandise exports and imports) and GDP, instead of examining the separate values of exports or imports as part of GDP. Moreover, because of data limitations, this study only estimates the research model using a data sample of Asean-6 countries, instead of analyzing each country separately. Several other control variables that can affect EG have not been examined in this study, such as employment growth, exchange rates, foreign direct investment, and financial development. On the other hand, due to the limitation of data collection, this paper has not been able to collect data from all Asean-6 countries. In addition, EG and TO in Asean-6 countries have increased dramatically in recent times; therefore, the authors collected research data for the period 2004–2019 to ensure that the research results are highly reliable and consistent with the current situation. These limitations may open up interesting research directions for further studies.


