1. Introduction
Based on development characteristics, the EU countries can be divided into northern countries, southern countries and catching-up countries. The last group consists of eleven countries from Central and Southeast Europe (CEE), the so-called post-transition countries, whose accession to the EU/EMU aims to accelerate growth and achieve convergence with developed EU countries, partly with the help of foreign savings, especially foreign direct investment (FDI) from developed EU countries. The sample consists of the following countries: Bulgaria, Romania, Hungary, Croatia, Slovenia, Slovakia, Czech Republic, Poland, Latvia, Lithuania and Estonia.
FDI is considered a particularly desirable form of capital inflow due to its lower volatility and assumed positive spillover effects. According to endogenous growth theories, foreign capital flows should contribute to higher growth rates through spillover effects on the host country of the investment. However, many studies conclude that FDI inflows do not necessarily lead to an increase in the GDP growth rate, macroeconomic stability, an increase in employment and export orientation of the host country.
This paper assumes that the different sectoral structure of FDI has different effects on economic growth—i.e., inflows to the manufacturing sector have stronger effects on growth than inflows to the service sector (
Alfaro and Charlton 2007;
Mencinger 2003,
2008;
Kinoshita 2011;
Walsh and Yu 2010). Understanding the potentially negative effects of the sectoral structure of FDI inflows and exploring the transmission mechanisms implies the possibility of a better diagnosis of the current state of affairs and insights into new policy directions to accelerate growth and a more developmentally efficient inflow of FDI.
It is argued that the positive effects of FDI inflows can only be achieved based on fulfilled initial criteria regarding the development of institutional and economic infrastructure. It is well known from the development economics literature that institutions are mostly endogenous variables and their change is country specific (i.e., path dependent), where different institutional endowments can lead to similar economic outcomes. Developed countries also have developed institutions. FDI has the largest impact on productivity and thus spillover effects in the most technologically developed EU countries, which are also high-income countries (
Derado and Horvatin 2019). The political economy of institutional change precisely emphasizes the emergence of different variants of capitalism. The conceptual model of EU integration based on financial openness and the emphasized importance of capital flows for the growth of countries CEE lead to asymmetric growth models (export- and demand-driven models) that determine the sectoral structure of capital inflows to these countries. Contrary to expectations, capital inflows, including FDI, cannot automatically change the structures of economies and their growth models. Rather, the structural framework of the integration process determines the FDI.
The focus is on the impact of capital movements on the real exchange rate (REER) and the limitations of growth models based on external imbalances (current account deficit) and encouraged consumption and investment in the production of nontradable goods. The given model makes countries dependent on foreign savings, capital inflows, and financial disturbances (sudden stops) that end in crises, volatility, and a decline in GDP.
By considering theoretically assumed transmissions and analyzing previous research, the second part of the paper provides a framework for formulating the empirical model. Based on a critical analysis of previous research, the selection of variables was made and the hypothesized influences are explained in the third part of the paper. According to the country sample, a panel analysis method with three dependent variables (total FDI inflow and FDI in manufacturing and services) was chosen. The results of the paper suggest that the best way to attract developmentally efficient forms of FDI is to design one’s own investment and development strategy that ensures stable domestic savings and export orientation of the economy through income growth, thus attracting export-oriented FDI.
2. Literature Review
Most surveys in a sample of CEE countries mainly take into account the FDI total inflows, while only a few surveys make a distinction regarding the sectoral structure of investment and its impact on the GDP growth rate. It theoretically and empirically confirms that FDI inflows into the manufacturing sector have favorable effects on the GDP and export orientation of the host country.
Among the first papers to question this relationship in terms of FDI sectoral structure, although implicitly, were the ones by
Mencinger (
2003,
2008). This author points out the negative impact of FDI on GDP growth for CEE countries, explaining the same by FDI inflows mainly into the service sector—i.e., lack of investment in export-oriented economic sectors. Thus,
Mencinger (
2008) considers that the concentration of investments predominantly in only few service sectors (e.g., financial sector, real estate and retail—mainly those sectors with a high profit rate) can also lead to a deterioration of the current account balance. It can lead to an increase in consumption and imports (and thus the growth of foreign debt) at the expense of increasing export competitiveness of the recipient country. Furthermore, the same author (
Mencinger 2003) states that the increase in the deficit is especially evident in the income subaccount, which is generated mainly through the outflow of realized added value—i.e., profit.
Accordingly, it is assumed that FDI in the manufacturing sector will have a favorable effect on achieving desirable macroeconomic objectives in terms of increasing the GDP growth rate, increasing employment and improving the current account balance. On the contrary, the investment inflows into the service sector are mainly market seeking-oriented. With this investors’ motive in mind, such a sectoral orientation will generally not lead to the improvement of the foreign trade balance, nor can it guarantee sustainable economic growth.
Mitra (
2011) thus considers that capital inflows into certain economic sectors and not necessarily the type of capital inflows lead to macroeconomic instability in CEE countries. If there is an investment inflow into the service sector (which occurs mainly through investments in the banking sector and consequently the growth of credit demand), the author believes that such sectoral structure investment mainly leads to higher macroeconomic volatility, regardless of the adopted monetary (exchange rate) regime.
Riedl (
2008) also considers that the inflows into predominantly service sectors lead to increased macroeconomic instability, pointing out that the prevailing motive of investors in the service sector is the market-seeking motive, while investments in the manufacturing sector are mainly motivated by gaining international competitiveness through the realization of lower unit production costs.
Furthermore, using the sample of OECD countries,
Alfaro and Charlton (
2007) highlight the importance of spillover effects on the recipient country—i.e., they conclude that the positive effects of FDI inflows can only be achieved based on fulfilled initial criteria regarding the development of institutional and economic infrastructure.
Following
Alfaro and Charlton (
2007),
Ioan et al. (
2020), among others, also look at the impact of FDI on economic growth using the example of selected CEE countries for the period 2005–2016, concluding that recipient countries need to make significant domestic savings and investments in fixed infrastructure to achieve the positive effects of FDI on economic growth. In turn,
Gherghina et al. (
2019) find the existence of a nonlinear relationship between FDI inflows and GDP per capita, as well as a significant role of the institutional framework in attracting FDI.
In addition to the positive effects of FDI inflows into the host country, FDI can also have negative effects, which are analyzed extensively in the literature. In addition to the obvious negative effects of the sectoral structure of FDI on the movement of the current account of the balance of payments, it is important to note that some of the available research emphasizes some other negative effects of FDI inflows on the economy of the host country. For example,
Vissak and Roolaht (
2005) found that investors’ focus on only a few activities can lead to opposite effects of FDI than theoretically desirable. Moreover, there is the question of a tendency for foreign firms to cooperate with domestic firms (crowding out effect). If investment flows into predominantly import-oriented sectors and such activities that aim at expanding market share, then in the case of increased bank lending there will be an increase in import demand, at the expense of export supply. Moreover, more favorable credit conditions for foreign companies (better
know-how, technological superiority) lead to a further crowding out of domestic companies from the market. In this context, the inflow of investment in the form of FDI does not necessarily lead to the spread of spillover effects if the primary form of investment is via brownfield investment through the privatization of domestic firms.
Taking into account the above information, the following question arises: what are the determinants of the FDI sectoral structure? In turn, their analysis can provide an answer to the question of how changing these factors can affect the change in sectoral FDI, and consequently the achievement of economic goals. In the following part of the paper, we present a brief overview of recent research on a sample of CEE countries in order to critically analyze the choice of variables for our empirical model and assess their significance.
Among the first is paper of
Kinoshita (
2011) who analyzed the impact of the FDI sectoral structure on the import/export using the sample of 15 CEE countries for the period 2000–2007. The author took into account the fact that the sectoral structure of foreign direct investment has an important effect on the macroeconomic stability of the recipient country, its foreign debt and the current account balance. The author concluded that a larger investment inflow in the tradable sector (predominantly vertical FDI) leads to a higher share of exports in foreign trade (and consequently to an improvement in the current account balance). A higher investment inflow in the nontradable sector mainly leads to an increase in imports and stimulation of credit growth, and, in general, an in-crease in the purchasing power. The author also emphasized the important role of the real exchange rate variable as a determinant of import and export in these countries. The econometric analysis showed that, among other control variables, the increase in the value of the real effective exchange rate index leads to a decrease in the share of exports in GDP, while positively affecting the share of imports in GDP.
Makhavikova (
2018) reaches a similar conclusion. The author concluded that an increase in the value of the index leads to a decrease in competitiveness, implying an investment inflow into the nontradable sector with the aim of expanding the market and exploiting the purchasing power of domicile consumers. In addition,
Polat (
2015) also came to similar conclusions for the sample of CEE countries.
All of the above studies so far have been conducted on a sample of CEE countries. However, some of the analysis on the mentioned subject were obtained on the sample of developed or developing countries.
Thus, for example,
Walsh and Yu (
2010) analyzed the impact of selected macroeconomic, financial and institutional variables on FDI inflows into primary, secondary (manufacturing) and service (tertiary) sectors on a sample of 27 developed and developing countries for the period 1985–2008. The authors found that the inflows of FDI into the primary sector are mainly not dependent on macroeconomic situation in the recipient country, but on the location of certain natural resources. When it comes to FDI inflows in the manufacturing sector, the authors found a more noticeable impact primarily the real exchange rate and GDP growth rate where the depreciated real exchange rate had a positive effect on investment in export-oriented sectors (the same conclusion applies to the GDP growth rate). The appreciation of the real exchange rate led to significant FDI inflows into the service sector (the appreciation of the real exchange rate increases wages and profits, thereby increasing the purchasing power of the target market). The reverse logic applies to the manufacturing sector where the investors’ primary goal is to achieve cost-efficiency production, through real depreciation.
From the research review presented so far, in the following chapter we select the variables for econometric testing using panel data models. As a review of previous research shows, FDI mainly flow to these countries that have a developed financial system, positive GDP growth rate, favorable institutional infrastructure and adequate monetary policy management (the monetary variable in the model is represented using the real effective exchange rate index). According to the literature review, the appreciation of the real exchange rate leads to an increased inflow into the predominantly service sector. Otherwise, the depreciation of the real exchange rate leads to an increase in the international competitiveness of the domestic economy and an increased investment inflow into the tradable sector(s).
The paper pays particular attention to the impact of financial openness and capital movements on the real exchange rate and its conceptual relationship with the sectoral structure of FDI. The research shows that short-term debt and portfolio capital forms have a primary influence on the volatility of the exchange rate rather than long-term FDI. Nevertheless, it is possible to see a transmission mechanism of influence between the real exchange rate and the long-term capital forms. The inflow of capital into these countries leads to an increase in credit due to the privatization of the domestic banking sector and hence an inflow of FDI into the financial sector.
The increase in credit leads to an increase in consumption, imports and wage growth in services with severe deindustrialization and a decline in competitiveness. This can be explained by the reverse Balassa–Samuelson (effect B-S effect) and a kind of “Dutch disease” phenomenon—namely, if the inflow of foreign capital (as a driver of productivity growth in a given sector) is concentrated in goods and services (i.e., in the nontradable sector), this can lead to an appreciation of the real exchange rate. It is due to wage increases (which do not have to be accompanied by productivity increases, which only amplifies the negative effects) and of the price of those services and goods that are not subject to international exchange. In their study,
Magud and Sosa (
2013) conclude that the notion of Dutch disease is closely related to the achievement of positive economic growth rates, indirectly through the movement of the real effective exchange rate. Indeed, the authors conclude that the “Dutch disease” exists as an economic phenomenon and, by affecting the realization of resources between sectors of the economy, leads to a reduction in investment in manufacturing production at the expense of increasing investment in some other sectors.
The transmission mechanism of the appreciation of the REER, especially before the crisis, led to deficits in the trade and current accounts and growth based on borrowing and consumption. In terms of Bresser-Pereira and Gala’s “New developmentalism”, this would mean that capital inflows and trade patterns lead to the substitution of domestic savings for foreign savings and determine both the nature and sectoral structure of FDI coming into the host country. Growth based on foreign savings, leading to an increase in the current account deficit, leads to an overvaluation of the exchange rate in the long run, which, together with a high marginal propensity to spend, reduces domestic savings and discourages investment. Therefore, it indicates growth through foreign savings (
Bresser-Pereira and Gala 2009).
In this way, an economic structure is formed in the medium to long term, which ultimately influences the structure of FDI inflows into the country. The process is entangled as the new FDI inflows only reproduce the existing structure. The fact is that developed countries exchange the most technologically advanced FDI among themselves, so the problem of changing the structure can be expressed as path dependence. The given structure determines and induces inflows into the service sector as a result of previous capital inflows, which promote import consumption and real appreciation of the currency.
3. Methodology and Data
The country sample on which econometric tests are performed consists of 11 countries from Central and Eastern Europe. Five of them are members of the euro area (i.e., Estonia, Latvia, Lithuania, Slovakia and Slovenia), Bulgaria and Croatia joined the ERM 2 mechanism, while Czech Republic, Hungary, Poland and Romania (although not members of the ERM 2 mechanism) coordinate their monetary policies with the euro area and, especially after 2009, peg their exchange rates to the euro. Except for Poland, before the crisis, all countries had a fixed or intermediate nominal exchange rate regime. With regard to exchange rate policy, this study considers the real exchange rate as a determinant of the movement of goods and services in the international economy. Although the sampled countries (and especially those that have not yet joined the Eurozone) have different adopted exchange rate regimes, the common feature is that all of them experienced significant appreciation pressures on the real exchange rate in the period before the Eurozone crisis in 2008. This, in turn, indirectly affected the very sectoral structure of foreign investment, especially FDI. Indeed, according to
Bolukoglu (
2020), capital inflows lead to real appreciation under conditions of financial liberalization. Real appreciation in turn further leads to higher imports, to a change in the structure of the economy and to a change in the sectoral structure of FDI inflows. According to Eurostat, these countries are still below the EU’s average GDP per capita (in purchasing power parity terms).
After a critical analysis of previous research, descriptive statistics analyzed the inflows and sectoral structure of FDI (see
Appendix A), while the relationship between sectoral structure and growth was analyzed using scattergrams. Descriptive statistics shows different characteristics of the FDI sectoral structure by country (see
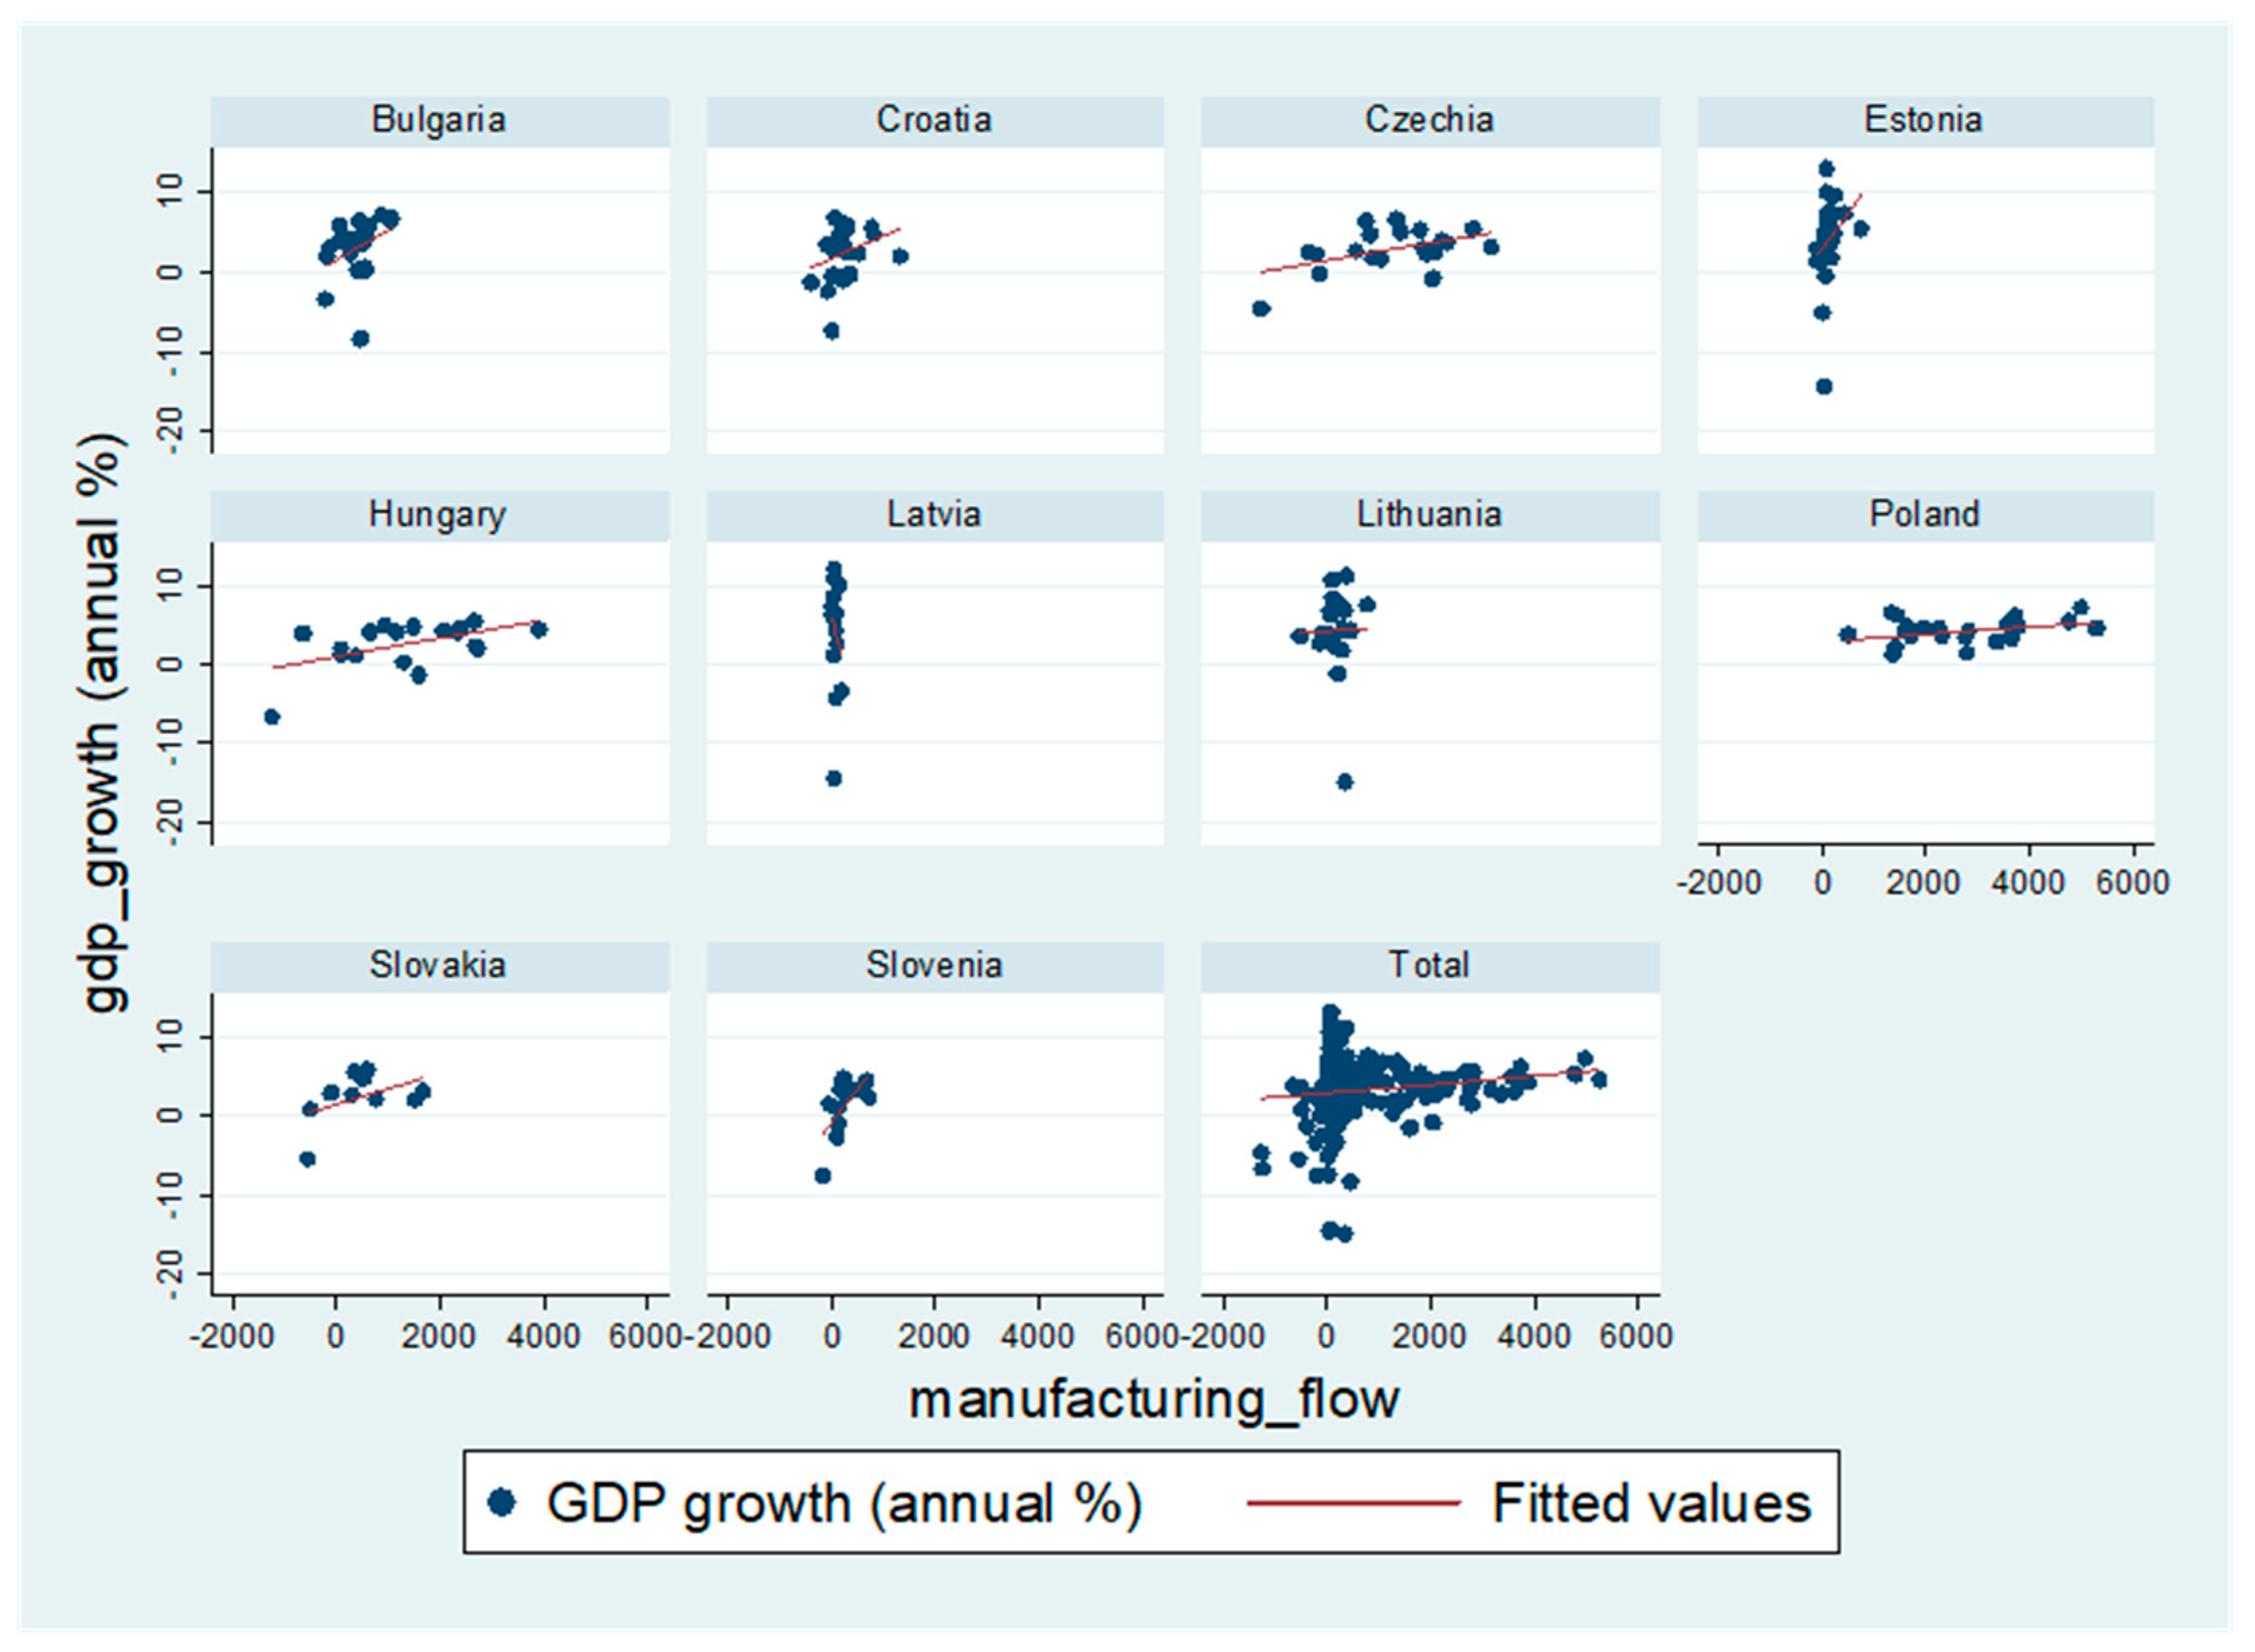
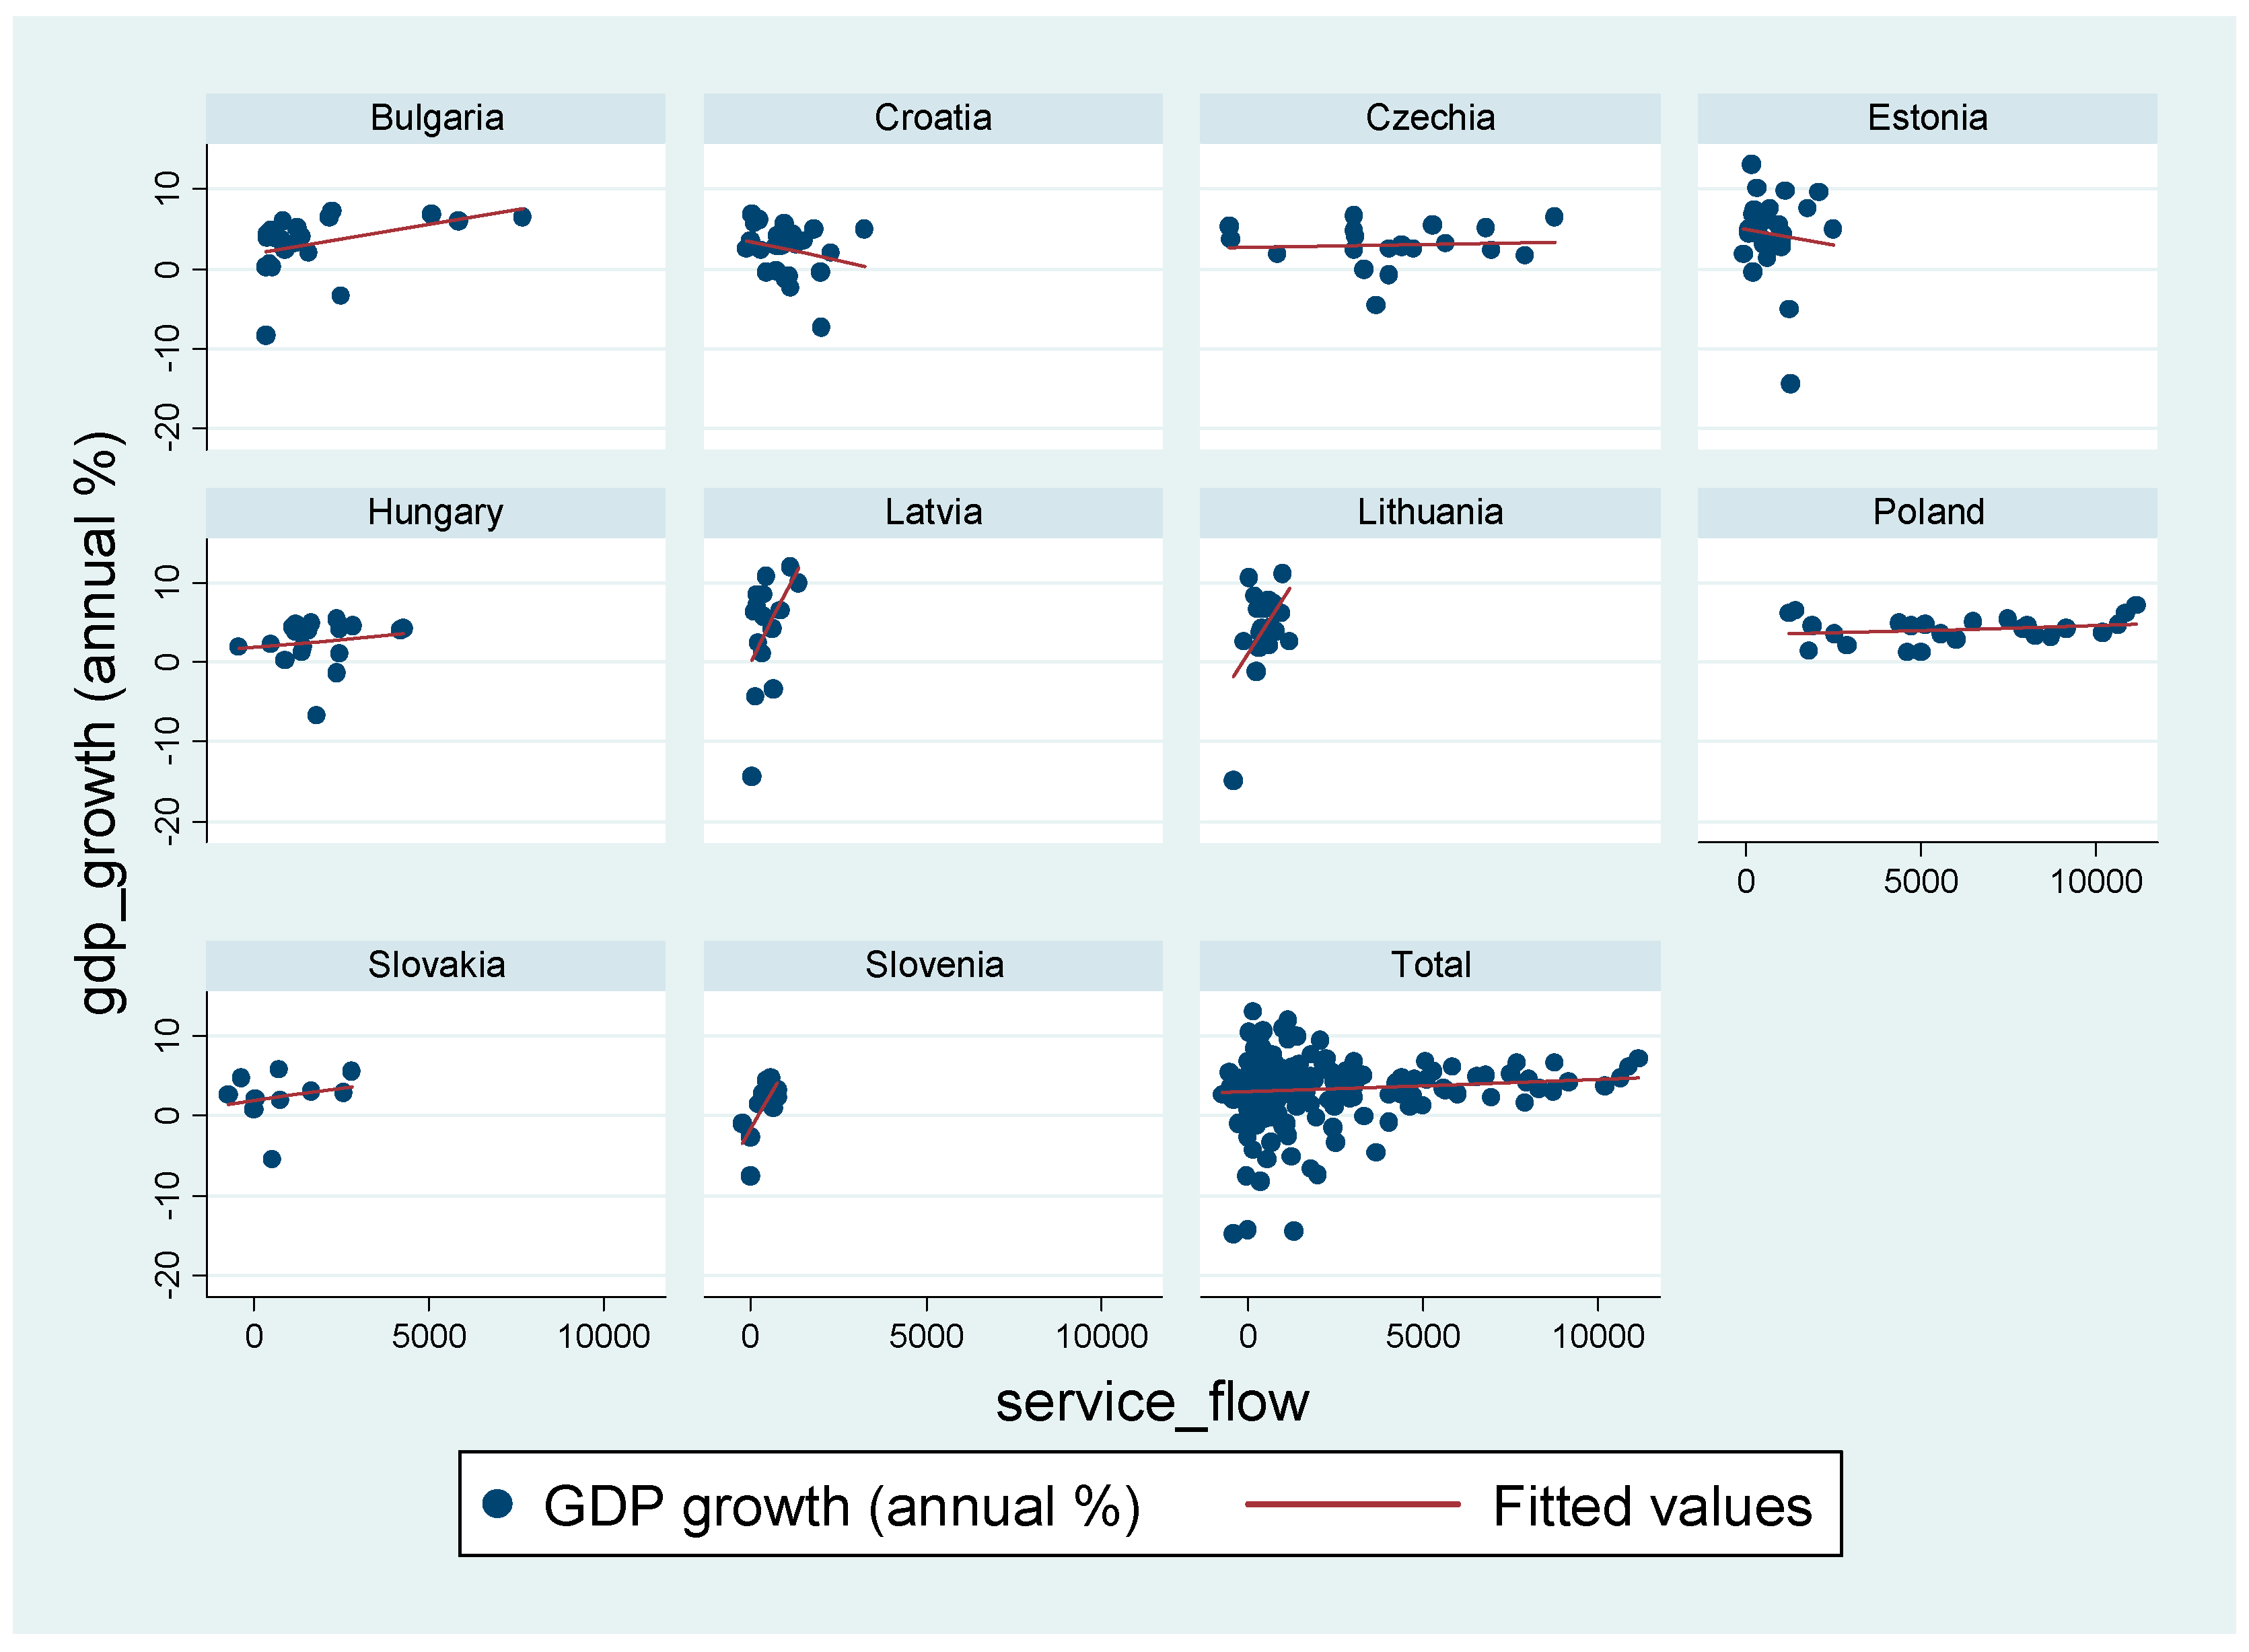
Appendix B). Scattergrams show, on the overall sample, the positive impact of manufacturing sector inflows on GDP growth rate as opposed to service sector inflows. In order to test these relations, we tested the determinants of the FDI inflows into the manufacturing and service sector as well as the total FDI inflows using panel model.
The two scattergrams below present an estimated regression line of the interrelationship between the investment inflows into the manufacturing sector (
Figure 1) or service sector (
Figure 2) and the GDP growth rate (in %) in CEE countries. In the case of service sector inflows, there is an imperceptible effect of investments on the GDP growth rate, while in the case of manufacturing sector investments this effect is slightly positive, implying that such investments are export-oriented, leading to improved current account balance and economic growth.
Prior to econometric analysis, descriptions of dependent and independent variables are given in
Table 1.
An econometric panel analysis of determinants of the FDI total inflows and FDI sectoral structure will be conducted. The secondary sector includes the manufacturing industry, while the tertiary sector mainly covers service activities (e.g., financial services, construction, real estate sales services, transport, etc.). The data for the sectoral structure of the FDI were obtained from the WIIW FDI database. The estimated models can be represented with the following equations:
where
is the real GDP growth,
is the total FDI inflows (in % of GDP) of
i unit of observation for the time period
t, while
is FDI sectoral structure (in % of GDP).
represents the vector of other independent variables of dimensions
1*k in the country and for time period
t. Parameter
is a constant term different for each unit of observation,
are the parameters to be estimated, while
is the estimation error of
i unit of observation for time period
t and are assumed to be independently and identically distributed random variables across observation units and time, with mean 0 and a variance
.
A fixed effect panel model with an AR (1) component was tested (
Table 1). The model uses the following variables: trade openness, inflation rate, domestic credit to private sector by banks (in % of GDP), GDP growth rate and current account balance (in % of GDP). To account for the impact of the crisis on the total FDI inflows and its structure, we introduced a dummy variable that has the value of 1 (for the crisis years 2009–2013), while for the remaining years of the analyzed time period it has a value of 0. As one of the key independent variables, the real effective exchange rate variable (2010 = 100) will also be used.
1 Descriptive statistics of the explanatory variables and correlation matrix are presented in
Appendix B. The correlation matrix shows that there is a strong positive or negative correlation between certain independent variables. Indeed, the high dependence (strong correlation) of two or more independent variables in the model may bias the parameter estimates of the tested model. Therefore, it is recommended to place highly correlated independent variables in different models rather than in the same model. For example, the correlation matrix shows a very high value of the correlation coefficient between the variables GDP per capita and the real effective exchange rate index, and GDP per capita and the trade openness index. In addition, a strong correlation was also found between the variables bank credit and the real effective exchange rate index and GDP per capita. In addition, a significant correlation was found between total FDI inflows (stock approach) and trade openness index. In addition, all variables in the model were tested for the presence of a unit root (see
Appendix B). Two tests were used: Levin-Lin-Chu unit-root test and Im-Pesaran-Shin unit-root test, with the last test used for an unbalanced panel. All tests confirmed the nonexistence of the unit root, which means that all series are stationary.
The variables of direct investment inflows in the manufacturing and tertiary (services) sectors and total FDI inflows are used as dependent variables. The structure of FDI is presented in terms of manufacturing and service sectors. The FDI indicator as a percentage of GDP is taken from the WIIW base, while the FDI indicator in the services sector as a percentage of GDP is formed on the same basis as the sum of inflows.
The content of this indicator has been constructed taking into account the heterogeneity of the sector and the recognition that not all forms of investment in the service sectors need have a weaker impact on value added growth or exports. The indicator therefore focuses on dominant service sectors that are close to nontradables or, as in the case of tourism, have a high import dependence and a labor-intensive character. It is thus about inflows into a sector whose spillover effects are not so present. For the purposes of panel analysis, logarithmic values of dependent and independent variables were used. The data for the variables used in the model were collected from the WIIW annual and FDI database and from the World Bank WDI database (
Table 1). The first panel model was tested on sample of 11 CEE countries, while other models that use FDI sectoral structure as dependent variable were tested on a sample of 10 countries, due to lack of data for Romania.
4. Results and Discussion
In accordance with the presented research review, and bearing in mind the choice of the variables, the assumed effects of selected independent variables on selected dependent variables will be briefly presented. As the main determinants of the impact on the inflows in the service sector, it was assumed that the variables regarding the financial system development and the GDP growth rate will positively affect service sector inflows. At the same time, it was also expected that the crisis variable would have a negative impact on service sector inflows (due to lower installation cost, compared to manufacturing sector; installation costs are costs usually associated with starting a production process). On the other hand, GDP growth rate is also expected to have a positive impact on the manufacturing sector inflows. Variables regarding the real exchange rate and the current account balance are expected to have both positive and negative impacts.
Seven models were tested using the variable of total FDI inflow (as a percentage of GDP) and the sectoral structural variables of investment in services and manufacturing as a percentage of GDP as dependent variables.
The real exchange rate depreciation has a slightly negative effect on inflows in the services sector. On the other hand, this effect is predominantly negative when it comes to inflows in the manufacturing sector (in line with
Polat 2015;
Walsh and Yu 2010;
Makhavikova 2018), meaning that real exchange rate depreciation leads to higher inflow in manufacturing sector. This finding can be related to the horizontal or vertical orientation of the FDI made. As shown in the theoretical part of the research, making investments of the horizontal type aims at expanding the market and exploiting domestic absorption. Vertical direct investment, on the contrary, is aimed primarily at the use of cheaper production resources—i.e., relocation of production to other countries (investment recipients) with the aim of subsequent re-export. In this case, the depreciation of real exchange rate leads to a higher price competitiveness of exports, but also to a lower labor cost.
In four of the six tested models, the GDP growth rate showed a positive and statistically significant effect on the inflow of total FDI—i.e., investment in services and manufacturing. It is interesting to note that the effect of GDP growth rate was equally strong for both service sector and manufacturing investment, which can be somewhat compared with the result of
Kinoshita (
2011).
Moreover, the variable of current account balance (as % of GDP) showed a negative influence on the inflow of total FDI as well as variables of its sectoral structure in the tested models. Indeed, it can be seen from
Table 2 that the negative impact of the current account variable of the balance of payments on the dependent variable is the most economically significant in the case of inflows of investment in the services sector.
Staehr (
2018) analyzed the relationship between GDP growth rate and current account balance using the example of 11 CEE countries for the period 1997–2015. According to this author, the relationship between the two mentioned variables is inverse; an improvement in GDP (i.e., an increase in its growth rate) leads to a deterioration in the current account balance (i.e., an increase in the deficit). In the opposite case, due to the decrease in GDP, the current account improves—deficit reduction/surplus increase. In addition to the results of the panel analysis conducted above regarding the relationship between these two variables (and taking into account the fact that FDI inflows partly have the purpose of financing the current account deficit), their negative relationship suggested by the panel analysis has a logical and economically justified explanation. Indeed, the improvement in the current account balance leads to a reduced need for inflows of various forms of capital (including FDI), while the existence of a negative balance leads to an increase in capital inflows to cover the deficit. This can be associated with the so-called demand-led growth model, which leads to the realization of positive GDP growth rates primarily through an increase in private consumption, which subsequently leads to a violation of the current account balance.
It can be seen that the economic impact of the current account variable on the inflow of investment in the manufacturing sector is weaker than in the context of the investment variable in the services sector. The reason for this is that the manufacturing sector is generally considered to be more export-oriented and thus contributes to the improvement of the current account balance.
Moreover, the financial system (proxied by domestic credit to the private sector) showed a positive influence (i.e., in the case of inflows of investment into the services sector, this influence is statistically significant). This supports the proposition that FDI inflows into the services sector (for the purpose of market expansion and exploiting the purchasing power of domestic consumers) are positively correlated with the developed credit market in the recipient country (
Walsh and Yu 2010).
The GDP per capita variable also had a positive impact on inflows to the services sector, due to increased purchasing power.
The crisis variable showed a negative influence on the dependent variable, and this influence was most economically and statistically significant for FDI inflows into the services sector, with a significance level of 1%. This result can be compared with
Riedl (
2008), who concluded that investments in the service sector could be more easily brought to the desired level of investment due to lower installation costs.
5. Conclusions and Policy Recommendations
In the conceptual architecture of the EU, financial openness is of paramount importance for growth, especially in the newly added CEE countries, in order to accelerate their growth rates and convergence with the developed EU countries. In contrast to short-term, portfolio and debt forms of capital flows, FDI is considered the most appropriate form of capital flows, taking into account developmental influences through spillover effects. Thus, while FDI is considered the most appropriate form for development, it can also have negative effects on the growth and stability of the host country. The idea of the paper begins with the recognition that forms of FDI have a differential effect on the growth and development of countries—i.e., FDI inflows into the manufacturing sector are assumed to have a greater intensity and impact on economic growth than inflows into the services sector. Complementing a number of studies that have looked at the impact of total or sectoral FDI on economic growth, the objective of this study was to find the key determinants of the sectoral structure of FDI inflows. If the structure of FDI inflows is endogenous and in turn shaped by the structure of the economy into which they flow, the question of attraction policy arises. The paper assumes that the structure of inflows matters for assessing the development effects of FDI and that the structural framework of the integration process determines it.
As
Dullien (
2013) points out, answering the question of why capital flows do not behave in accordance with existing theoretical models opens up many explanations and emphasizes the importance of new transmission channels. The basic argument of mainstream economic theory emphasizes the importance of capital inflows as a means to achieve real convergence by increasing the capital stock and per capita productivity in less developed countries (an argument based on the neoclassical production function). However, even with institutional adjustment and a high degree of financial sector development, the benefits of capital inflows may be absent or have a negative impact on the process of economic growth and convergence. One explanation is that capital inflows could have some negative externalities on the underlying catching-up process and thus on medium-term economic growth through real exchange rate appreciation and thus negative effects on growth in the manufacturing sector (
Dullien 2013).
A critical analysis of previous research has identified the key determinants of the model in this paper. Using the variable of the real effective exchange rate, we have extended the theoretical framework of the analyses. Indeed, capital inflows lead to an appreciation of the real exchange rate, resulting in a current account deficit. The economy expanded by imports then affects the sectoral structure of FDI. The research findings were then explained in the context of heterodox economic theory, highlighting, for this sample of countries, the overwhelming role of FDI in stimulating domestic consumption at the expense of export orientation and the consequent deepening of the country’s current account deficit. The transmission of capital inflows and exchange rate appreciation to increased consumption and FDI inflows in non-export sectors make the country vulnerable to shocks and unsustainable economic growth based on rising debt (demand and debt growth model). Stronger growth associated with currency appreciation did not help stimulate investment to increase competitiveness. Changes in the real exchange rate affect net exports and the sectoral structure of FDI. The appreciated real exchange rate reduces the domestic development of tradable goods production. How does one avoid the penalty of an overvalued currency and attract developmentally efficient foreign direct investment?
It should be noted that the scope for exchange rate policy in these countries is limited for several reasons. First, the effect of devaluation on growth applies only to less developed countries, and the effect is lost to growth. According to
Rodrik (
2008), a depreciated real exchange rate stimulates growth only in developing countries that need an influx of technology and an export-based growth and ceases to be valid when developed countries are added to the sample. There is the limited and short-term importance of nominal devaluation. Even if countries had this possibility, it would only work in the short run in import-oriented economies. Therefore, the devalued exchange rate policy cannot promote exports, so it is desirable to promote domestic production, consumption and productivity growth to make domestic products as competitive as possible (
Begović and Kreso 2017).
Second, the euro integration process is losing the importance of nominal exchange rate change, and even countries with their own currency that have not yet accepted the euro after the crisis are fixing exchange rates or pursuing policies coordinated with the euro area.
Third, the different value of the euro even within eurozone countries underlines the importance of the real exchange rate, but also raises the question of its rebalancing policy. Increasing competitiveness through internal devaluation is not an efficient way to significantly change the existing structure of the economy and start a new, stronger economic cycle. The limitation of internal devaluation is that it does not take into account structural changes that must be based on clear investment policies and greater public policy participation. Avoiding overvaluation of the real exchange rate through internal devaluation is relatively controversial.
The way out must be sought in the reshaping of the integration concept and a more active fiscal policy, investment in the energy sector and green technologies, especially in times of expansionary monetary policy and low interest rates. Investment in these sectors could give a significant boost to the reindustrialization of these countries and to convergence. This type of FDI in manufacturing through new industrialization and vertical integration allows for greater use of IT technologies and technologically advanced FDI inflows.
Only stable growth, as explained by
Staehr (
2018), allows for stable domestic saving, and there is no automaticity of converting saving into investment. Stable domestic saving due to the supported investment cycle and income growth due to structural change can lead to a better capital inflow structure to these countries. Reliance on capital inflows makes the country particularly sensitive to international financial cycles and the real exchange rate mechanism. An appreciated real exchange rate can stimulate investment in a production structure that allows for short-term high and volatile growth rates, as well as the growth of macroeconomic imbalances with a negative impact on long-term growth.
With the exception of capital controls, which have a fragile effect and are questionable in the case of foreign direct investment due to the long-term nature of this type of international capital movement, a step forward should be sought in active domestic investment policies and income growth that generates domestic savings (I→Y→Sd). Stable and growing domestic savings require export growth and a positive current account balance, as well as an economic structure that attracts export-oriented, technologically developed FDI that brings strong spillover effects and increases total factor productivity (TFP).
Effective development management of foreign savings begins with domestic investment and growth strategies. The EU model of market integration (financial openness) should be complemented by country specific development management mechanisms.
Given the fundamental insight that the structure of existing economies, shaped by the integration framework, determines the sectoral structure of foreign investment inflows, future research should include analysis of the relationship between growth models, the sectoral structure of CEE economies, and the sectoral structure of foreign direct investment.
Future research must also include investment policy research as part of the change in growth model from a demand-led growth model to an export-led growth model. This is especially true as the integration model based on financial openness needs to be complemented by investment policy. Research on investment policy should analyze a range of direct and indirect effects on investment. A special role should be played by the effects of fiscal policy both indirectly on the revenue side and directly on the expenditure side of the budget, with particular attention to the investment structure of public spending. Promoting investment in infrastructure and R&D would increase total factor productivity and hence profit opportunities. It will certainly increase the participation of private domestic and foreign investors in the investment cycle of export-oriented industries. Moreover, future research should pay special attention to the analysis of the real exchange rate determinant in order to minimize real exchange rate misalignments.


