Article

Digital Competitiveness in the European Union Era: The Greek Case

Department of Informatics and Telecommunications, National and Kapodistrian University of Athens, 10672 Athens, Greece
*
Author to whom correspondence should be addressed.
Economies 2020, 8(4), 85; https://doi.org/10.3390/economies8040085
Submission received: 9 September 2020 / Accepted: 24 September 2020 / Published: 15 October 2020

Abstract

:
Digital competitiveness is gaining more and more attention as a source of competitive advantage at the business and national economies levels. Digital economy performance is a matter of national strategies for achieving economic growth and socioeconomic development. Widely accepted instruments for reporting progress in these areas have been recently developed, including the Digital Economy and Society Index (DESI index). The current study aims to use the DESI index and its five dimensions (namely Connectivity, Human Capital, Use of Internet Services, Integration of Digital Technology and Digital Public Services) not only as a tool for recognizing the current state, but also to forecast progress under the Greek economic environment. The Gompertz model was used as a methodological tool and it is valuable that a diffusion model has been implemented on a composite index related to countries’ digital competitiveness. Moreover, the results reveal the areas where convergencies and divergencies exist between Greece and the rest of the EU-28 member states, while forecast permits one to evaluate how current policies have a significant impact on digital competitiveness. Results indicate that Greece is facing significant challenges as a result of the low state of digitization, coming from both the demand side (businesses that consume internet services) and the offer side (institutional and governmental constraints). The proposed results could be used in order to readjust existing policies and to spot aspects where further improvement is needed to achieve high standards of digital competitiveness.

1. Introduction

In a fast-changing world, economies and societies as well are forced to reshape their traditional models in order to adapt to the fast-growing digital environment. Information and communication technologies (ICTs) have become more than a common ground of everyday use. ICT gradually has developed to be a crucial operational component for individuals, businesses and national economies as a whole.
Countries and supranational organizations, such as the European Union, reshape their traditional economic landscape, by promoting broadband use and internet usage, delivering online services for citizens, facilitating investments in the spectrum of the digital economy and implementing new business models appropriate for digital economy development.
The global economy as a framework is nowadays significantly related to the digital economy, while even traditional economic aspects (e.g., agriculture) implement more and more digital aspects at least in developed economies. Under this framework, governments and international companies compete to establish their position on the digital economic spectrum. For example, the European Union (EU) aims to become a global leader in the digital economy, by developing its own Digital Single Market strategy. Moreover, since the declaration of the Lisbon Strategy, the EU’s policymakers aim to the development of competitive, knowledge-based economies, while the same objective has been confirmed in the Europe 2020 plan (Balcerzak 2016; Stanickova 2017).
A series of documentation supports the idea that digital competitiveness is an EU priority, starting from “A Digital Agenda for Europe” (EUR-Lex 2010a) and passing to the “European Broadband: Investing in Digitally Driven Growth” (EUR-Lex 2010b), while the necessity for converging policies among member states has been supported by “The EU’s New Digital Single Market Strategy” (EUR-Lex 2015). More recently, the documentation reveals a more intense willingness to reshape what digital economy represents by publishing: (a) “Building a European Data Economy” (EUR-Lex 2017), and (b) “The Age of Artificial Intelligence: Towards a European Strategy for Human-Centric Machines” (European Commission 2018).
Even though the digital economy has gained vast attention over the last 20 years, it is a rather complex phenomenon. Measurement techniques and traditional tools of economic development cannot easily capture what is actually happening in the digital world, whose channels can be lost when a financial transaction takes place. Moreover, the evaluation of the digital development and digital competitiveness of an economy cannot be achieved by using solely statistical data and that led to the development of various indexes, trying to compare and rank national digital economies. It is revealing that there is an ongoing discussion about how the innovation and competitiveness of countries are developed in the digital age (Morrar and Arman 2017; OECD 2019; Schwab 2016; WEF 2018).
Under this framework, the current study contributes by revealing the current condition and forecasting the future development in digital competitiveness in Greece, compared with EU-28 member states. Greece has been heavily damaged by the economic crisis of 2008, while the importance of ICT in general for a restart of its economy has been revealed by several studies (Laitsou et al. 2017). Revealing whether the country is converging or diverging from the EU average can have an important impact from a regulatory and government’s side of view.
A well-known index has been chosen as a means to compare digital competitiveness. The Digital Economy and Society Index (DESI) is a composite index that has been developed to rank EU member states in terms of digital performance and moreover to track their digital competitiveness’s evolution. The proposed index consists of five distinct dimensions, namely (European Commission 2019):
  • Connectivity, which measures the deployment of broadband infrastructure and its quality.
  • Human Capital, which measures the skills needed to take advantage of the digital society.
  • Use of Internet Services, as a measure of the variety of online activities performed by citizens.
  • Integration of Digital Technology, which measures the digitalization of businesses.
  • Digital Public Services, which measures the digitalization of public services.
Based on this index and current data, a forecast is made for the growth of the digital economy in Greece in comparison to the EU-28. A well-established methodology is used, the Gompertz II diffusion model, in order to forecast, while the data used were obtained from the European Commission and the European Statistical Office (Eurostat). By using a forecasting framework to explore whether the Greek digital economy is converging or diverging from the EU-28 average, the study contributes to spotting the strengths and weaknesses, considering future trends delivered from the forecast.
Therefore, the main objective of this paper is to present the current situation and compare digital economy trends in the EU-28 and Greece. The empirical part of the paper is aimed at forecasting future tensions regarding Connectivity, Human Capital, Use of Internet Services, Integration of Digital Technology and Digital Public Services. The research questions that will be answered in this paper are the following:
  • What are the sources of competitiveness regarding the digital economy in Greece compared with the EU-28?
  • Can the DESI index be used as a forecast means for both Greece and the EU-28?
  • In which dimensions do convergencies/divergencies exist?
  • According to existing data, how many years are needed for Greece to converge with the EU-28 as far as its overall digital competitiveness is concerned?
The paper’s added value lies in both the methodology proposed and the results regarding digital competitiveness. On the one hand, implementing a diffusion model on a composite index related to countries’ digital competitiveness is an under-investigated subject. The proposed methodology involves various steps, which can facilitate researchers of the field in exploring data and more significantly in forecasting trends or convergencies/divergencies between countries. On the other hand, the results themselves are of high significance for policymakers and researchers of digital economics at the national and European levels, taking into account that data related to digital competitiveness are scarce at the current point, while the need for long-term policies has emerged intensively as a result of Industry 4.0’s rise. Results indicate not only dimensions where policy efforts should be set, but moreover can estimate the “time” (years) where convergence will occur under the current situation. Such a framework can be used as a means to compare the estimated convergency with other EU countries “before and after” a digital policy’s implementation.
The rest of the paper is organized as follows. Section 2 presents existing scientific research related to the Digital Economy and Society Index, while in Section 3 the proposed methodology of forecasting is developed. The results are presented in the last two sections, where the methodology’s appropriateness is evaluated and trends regarding digital competitiveness in the case study country are discussed.

2. Bibliographic Review

Competitiveness has remained an important issue over the last forty years, while its importance has been established from researchers of various fields. According to M.E. Porter (Porter 2008, p. 176), “The only meaningful concept of competitiveness at the national level is productivity. (…) A nation’s standard of living depends on the capacity of its companies to achieve high levels of productivity and to increase productivity over time” (Porter 2008). In the core of this framework lies the emphasis on the interrelationship between innovation and competitiveness, as a key for sustainable productivity, based on a neo-Schumpeterian approach, from economic literature’s point of analysis (Chiappini 2014; Grossman and Helpman 1990; Narula and Wakelin 1998; Uchida and Cook 2005).
Competitiveness, productivity and innovation tend to evolve according to the technological trends and socioeconomic needs. The digital age has revealed a series of intangible assets that are gaining importance for the effective digitization and the successful implementation of technologies that make the world digital (Weresa 2019), even though productivity in the digital age still remains the core issue for achieving competitiveness (Aiginger et al. 2013; IMD 2018; Porter and Heppelmann 2014; Radman and Belin 2017; WEF 2018).
Under the Industry 4.0 concept, competitiveness is also described/explained with emphasis put on quality (quality competitiveness) or technology (technological competitiveness) (Aiginger and Vogel 2015). In the case of technological competitiveness, the whole concept can be related to:
Following each researcher’s point of analysis, digital economy and its competitiveness have been examined through information economy (Elsner et al. 2015; Sun et al. 2017; Trushkina 2019), implementation of the digital market (Gupta and Bose 2019; Lutz 2019), Industry 4.0 (Dzwigoł et al. 2020; Hubert et al. 2019; Kumar and Kumar 2019; Lenart-Gansiniec 2019; Sanghavi et al. 2019; Vrchota et al. 2019; Zupan Korže 2019) and new sources of gaining competitive advantage (Hoła et al. 2015; Kuzior et al. 2019; Miśkiewicz 2019; Shank and Gott 2019; Zhao et al. 2019). Such aspects, as well as many others related to digital competitiveness, have been used in competitiveness rankings (IMD 2018; WEF 2018) and the formation of the Digital Transformation Scoreboard developed by the European Union (EC 2018).
There have been many studies in recent years which attempt to monitor the digital economy performance of a country or group of countries using e-indexes. The DESI index is often used in these studies as well as other e-indexes, e.g., the Networked Readiness Index (NRI). Most of the research conducted aimed to study a particular economy’s digital framework and to provide recommendations regarding aspects of digital dimensions that should be improved. For as long as our research took place, no forecasting was made regarding the future development of digital competitiveness issues.
The Digital Economy and Society Index was initially launched in 2014. In 2016, Vidruska (Vidruska 2016) used the DESI and NRI indexes in order to compare Latvia’s digital economy to the rest of the European countries. The author aimed to highlight aspects where improvement was needed, while issues that could enhance the country’s performance were identified. Improving the digitization impact has been referred to as a key issue.
A new study was added in 2017 (Nagy 2017), focusing mainly on the digital economy and society in Hungary and comparing with those of Ukraine. Based on this comparison, conclusions were extracted regarding the future trends of digital development. The comparison revealed that Hungary is an emerging digital nation, while most significant parameters regarding the digital economy/society outmatched Ukraine’s corresponding parameters. Despite that, the author expects fast progress in the development of the digital economy and society in both Hungary and Ukraine, in the next few years. His prediction is mainly based on clues regarding the high growth rate of the internet, as well as in the tablets and smartphones penetration in both countries.
Moroz (Moroz 2017) evaluated the degree of the development of the digital economy in Poland, compared with a number of chosen European countries. The methodology of the conducted research was based on statistical methods. In order to make the comparison in a methodologically accepted way, synthetic measures regarding the development of e-economy were used in the form of two indexes: NRI and DESI. Poland was compared with four European countries, while the results indicated a relatively unfavorable situation for Poland.
From a more methodological perspective, Kotarba (Kotarba 2017) concentrated on the analysis of the various metrics used to measure digitalization activities. Five main levels were analyzed including metrics for the digital economy, society, industry, enterprise and clients. The study is based on leading public and commercial metrics used for the evaluation of digital progress. The similarities and differences between key performance indicators at each level were discussed, forming a set of conclusions on the scope and maturity of various measurement systems and potential improvement options.
Chaaben and Mansouri (Chaaben and Mansouri 2017) used the International Digital Economic and Social Index (I-DESI) to compare Tunisia with EU member states. The International Digital Economic and Social Index (I-DESI) was introduced by the European Commission in 2016 (European Commission 2016) as a tool for international comparisons. The results revealed that Tunisia is a digitally poor performer compared to the average of the EU member states, while the digital aspects requiring investments and actions were prioritized.
In a more recent study, Balacescu and Babucea (Balacescu and Babucea 2018) used the DESI index to measure the ICT integration in the European economies and societies. Their results indicated that the acceptance of the Digital Single Market is not sufficient, as a result of significant digital gaps between member states. Moreover, their results revealed that significant differences exist even at a regional level, leading to divergences even at the national level. Under these conditions, a unified European digital society cannot exist, while even in terms of the digital economy, developmental efforts may not lead to a sustainable result.
Romania has been the research field of another study (Burlacioiu et al. 2018). By using the DESI index, the authors aimed to determine the pattern of digital technology in Romania compared to the other European Union countries. Their main contribution laid in the study of a young segment, as a genuine early adopter of new technologies, while its significant role was justified by the fact that this kind of user can compensate for the country’s digital skills deficit.
Česnauskė (Česnauskė 2019) assessed the progress of the Baltic states towards developing a digital economy and society with the use of the DESI index. The author identified areas requiring priority investments and actions. The study revealed the digital performance for each Baltic country, comparing them one to each other, as well as with other EU countries.
Finally, the influence of the consumption index growth by the purchasing power parity and unemployment among the active population on the structural units of DESI has been estimated (Stavytskyy et al. 2019). The results, calculated with panel regression, indicated that consumption and DESI are positively correlated, while unemployment has a negative impact. More significantly, the authors claimed that the 98% value of DESI is actually determined by its previous trends, and therefore it is impossible to increase this index rapidly.
As far as Greece is concerned, only one study exists regarding the use of the DESI index, which is mainly concentrated on presenting the results rather than forecasting (Kontolaimou and Skintzi 2018). From its analysis, it is obvious that Greece is positioned at the bottom of the EU-28 ranking according to the DESI 2018. Noticeable improvements have been recorded only regarding the digital public services. A divergence procedure is noticed between Greece and the rest of the EU member states, especially in terms of human capital.
The above-mentioned research reveals that the DESI index has been widely used as a comparing means, while only recently regression analysis has been started in order to achieve statistically significant results in analysis. The current study’s contribution focuses on implementing forecasting techniques alongside the DESI index. Moreover, the exploitation of the proposed index under the Greek economic landscape is scarce and mainly aims at presenting data. The study expands the analysis of the Greek economy by interpreting current trends and supporting forecasts for the future development of the DESI index’s five dimensions.

3. Methodology

The paper’s methodological tool in order to forecast was the Gompertz II diffusion model, one of the most frequently used sigmoid models (Gompertz 1825), fitted to growth data (Vogels et al. 1975) and many other kinds of data leading to an enormous literature (Tjørve and Tjørve 2017). The model belongs to the Richards family of three-parameter sigmoidal growth models, even though it has four parameters. Other familiar models are the Bertalanffy, the logistic and the negative exponential (Tjørve and Tjørve 2010), while a series of parametrizations have been attempted. In the Gompertz II model, a single parameter controls the starting value for the curve (i.e., the intersection with the y-axis), while other parameters do not affect the starting point.
The proposed model has been extensively applied in technological sensitive sectors, including research in various fields and different national contexts. Wu and Chu (Wu and Chu 2010) evaluated its accuracy in Taiwan’s mobile telephony market by incorporating in their analysis technological factors (the coming of smartphones) and the rise of services (e.g., social media and YouTube), Cik, Zagar and Kordic (Čik et al. 2016) compared forecasting ability with other models regarding the fixed broadband service in the Republic of Croatia, while Sudtasan and Mitomo (Sudtasan and Mitomo 2017) evaluated their accuracy regarding the mobile telecommunication market and fixed broadband market in Thailand. A series of other studies have explored the usefulness and accuracy of the model including (a) 200 developed and developing countries in the 1990s (Rouvinen 2006), (b) mobile telephony subscriptions in Greece (Michalakelis et al. 2008), (c) mobile phone and mobile density in India (Singh 2008), (d) the influence of social, technological, economic and political factors on the diffusion speed of mobile telephony (Gupta and Jain 2012), (e) the diffusion of mobile telephony in China (Liu et al. 2012) and the diffusion of mobile telephone subscriptions in Peru (Yamakawa et al. 2013). The main conclusion of the above-mentioned studies was that the Gompertz model best describes the diffusion process compared with other models. Regarding the necessity to better forecast digital competitiveness, the Gompertz II model has arisen as the most accurate model when technological aspects are included.
The current study exploits the DESI index, as a whole and taking into account its sub-indicators, in order to forecast the evolution of Greece’s digital performance in relation to that of the EU-28. The DESI index has been chosen for a series of reasons including:
  • Coverage of research: all European Union member states are included;
  • Data: quantitative data indicators are used to forecast;
  • Comprehensiveness: research areas are strongly related to the use of ICT;
  • Credibility: institutions that develop and measure the index.
From the total sub-indicators, selected were those that meet the criteria for applying data prediction techniques, and the Gompertz II technique was applied to forecast data growth over the next 20 years. Afterwards, the DESI index was recomposed, as far as its five dimensions are concerned, while convergences or divergences were detected in order to forecast the evolution of these indicators for Greece and the EU-28. Emphasis was put on revealing the time when Greece could exceed the EU-28 average, for each of the five dimensions or the DESI index as a whole.
From a methodological point of view, the procedure could be described in several phases. Phase 1, where the data were collected from the European Commission. From the whole dataset, a selection was conducted in order to comply with the following prerequisites:
  • The data values are percentages of the total population or specific groups of the population;
  • The data cover a period of at least three years.
This selection was necessary in order to keep data that can be used during the forecast procedure. Table 1 presents the five (5) principal dimensions, the following subdimensions, as well as the indicators that develop each subdimension. The proposed coding (No. of Indicator) comes from the European Commission, while the data range from 2014 up to 2019.
With gray color the indicators that fulfill the two above-mentioned criteria of selection are given. Out of the forty-four (44) proposed indicators, twenty-two (22) of them were finally selected during the first phase. It must be noted that components of the index do not have equal weights. Connectivity and Human Capital are the two main components, contributing each one with 25% to the total score. Integration of Digital Technology accounts for 20%, while Use of Internet and Digital Public Services account for 15% each.
For the indicators selected, there is a short description of their meaning in Appendix A (Table A1, Table A2, Table A3, Table A4 and Table A5).
During the next phase (Phase 2), data were converted from percentages to absolute numbers. In order to achieve that, information and data were used, coming from the Eurostat European Statistical Office. These data were related mainly to population, number of employees, number of enterprises, etc., depending on the unit of measure. The conversion was needed in order to apply the Gompertz II technique which was launched to the following phase.
In Phase 3, the Gompertz II model was applied by using the given-below formula:
Y ( t ) = S   e   A e b × t
where b > 0 is a scaling factor, S represents the saturation level and a is the parameter that is related to the point of inflection. Moreover, A is a constant parameter that substitutes e a . Y(t) is the estimated diffusion level at time t, while the parameters that have to be estimated are S, a and b. The parameters a and A are related to the time that diffusion reaches 37% of its upper level ( S e 1 ) , and parameter b is a measure of the diffusion speed, or how rapidly the adoption progresses (Michalakelis et al. 2008).
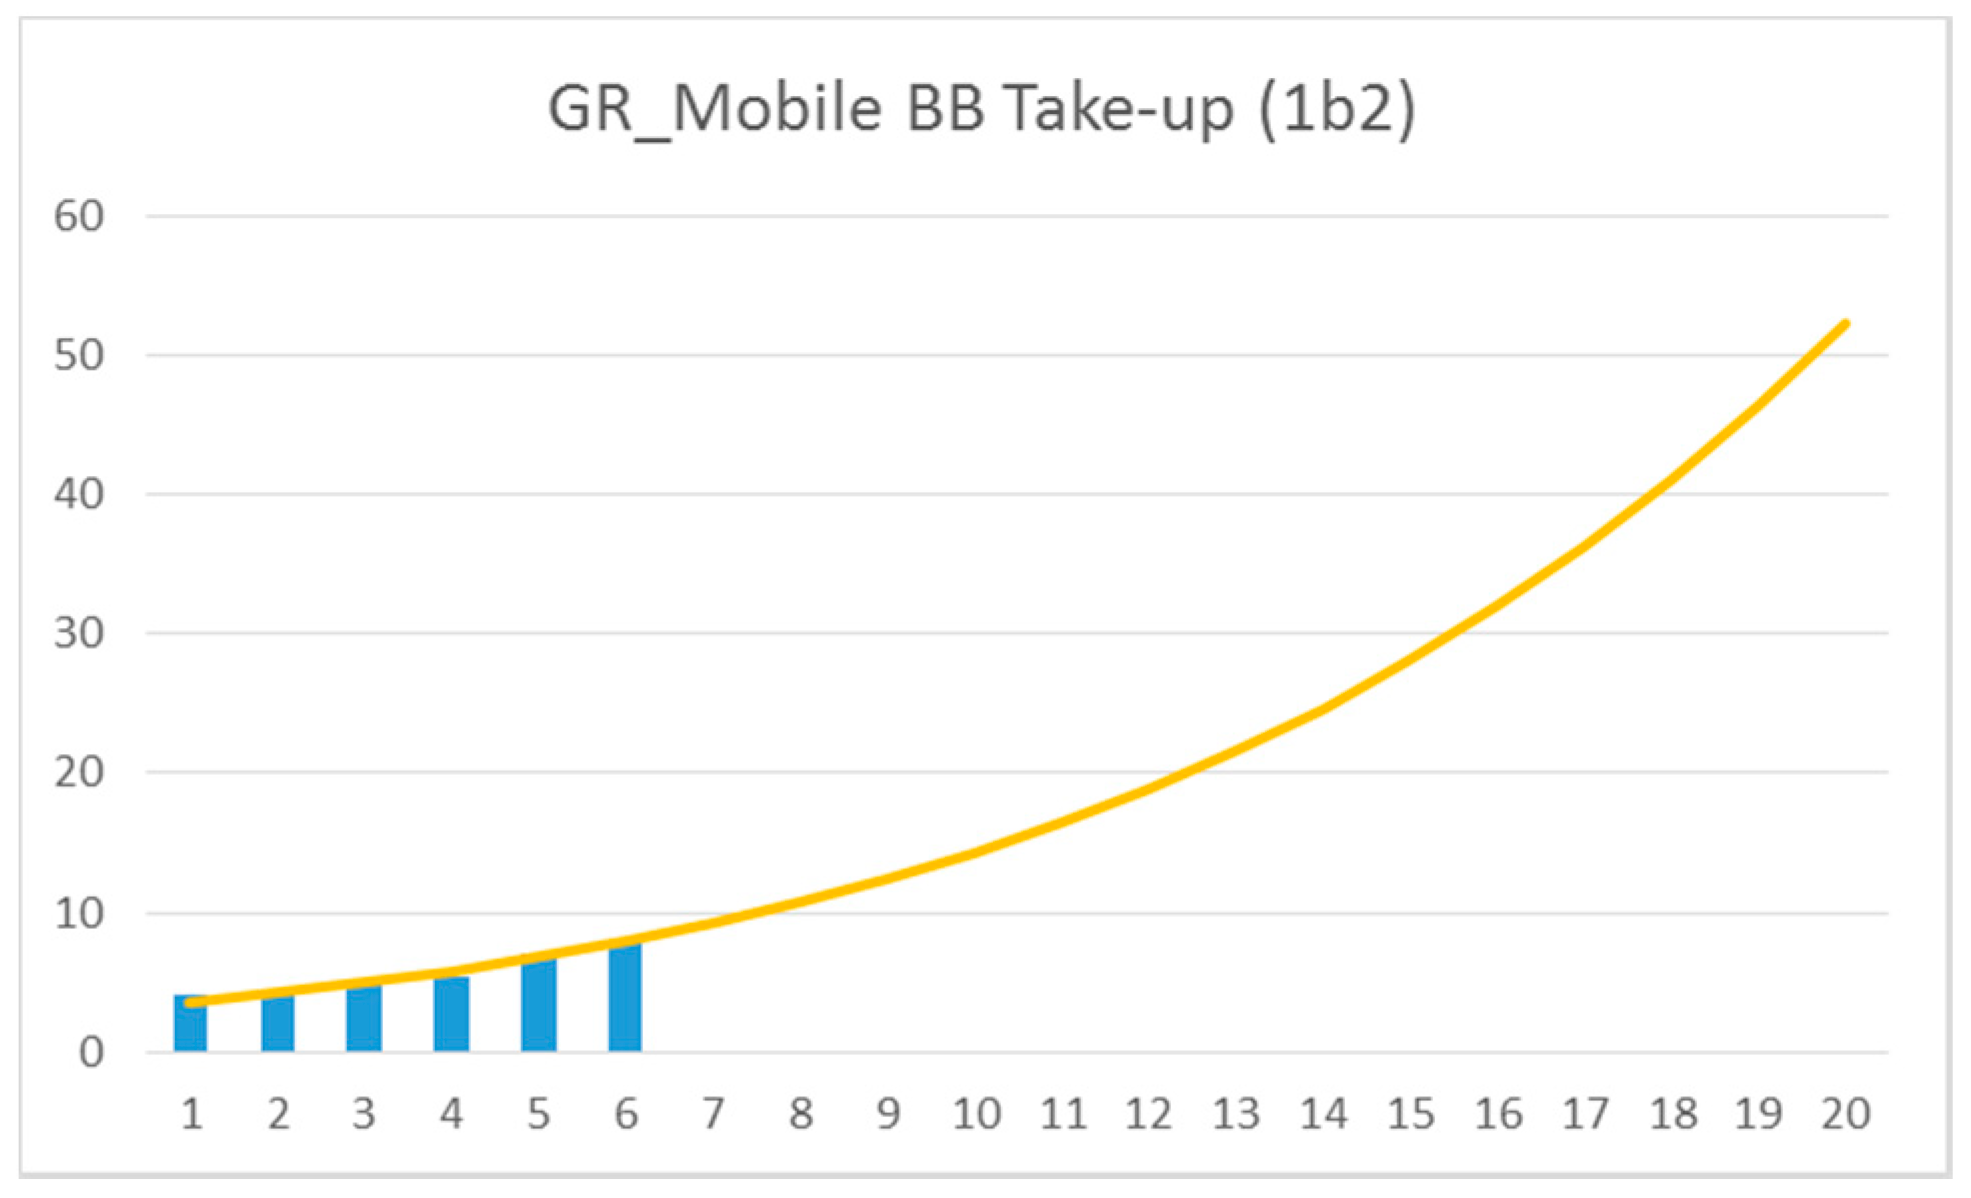
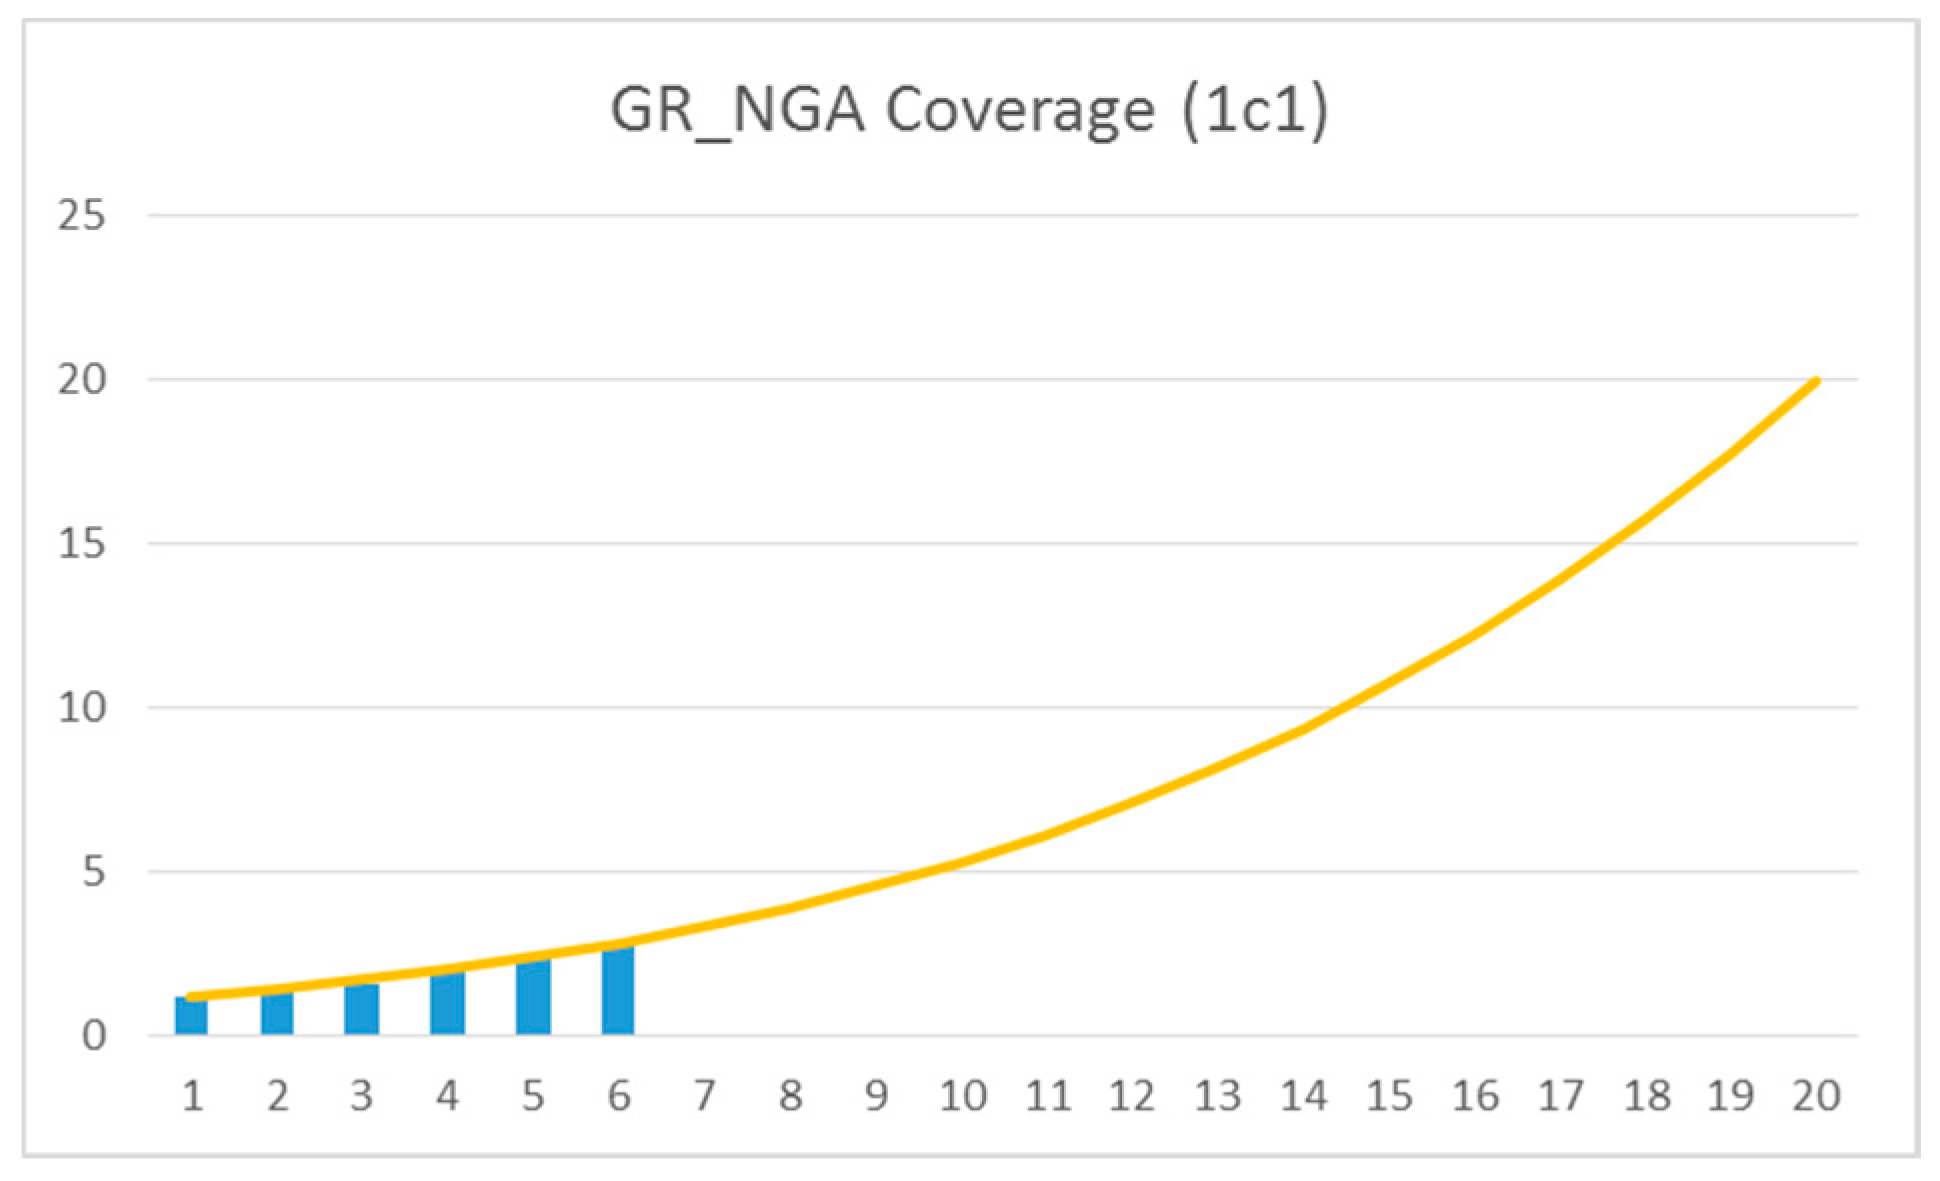
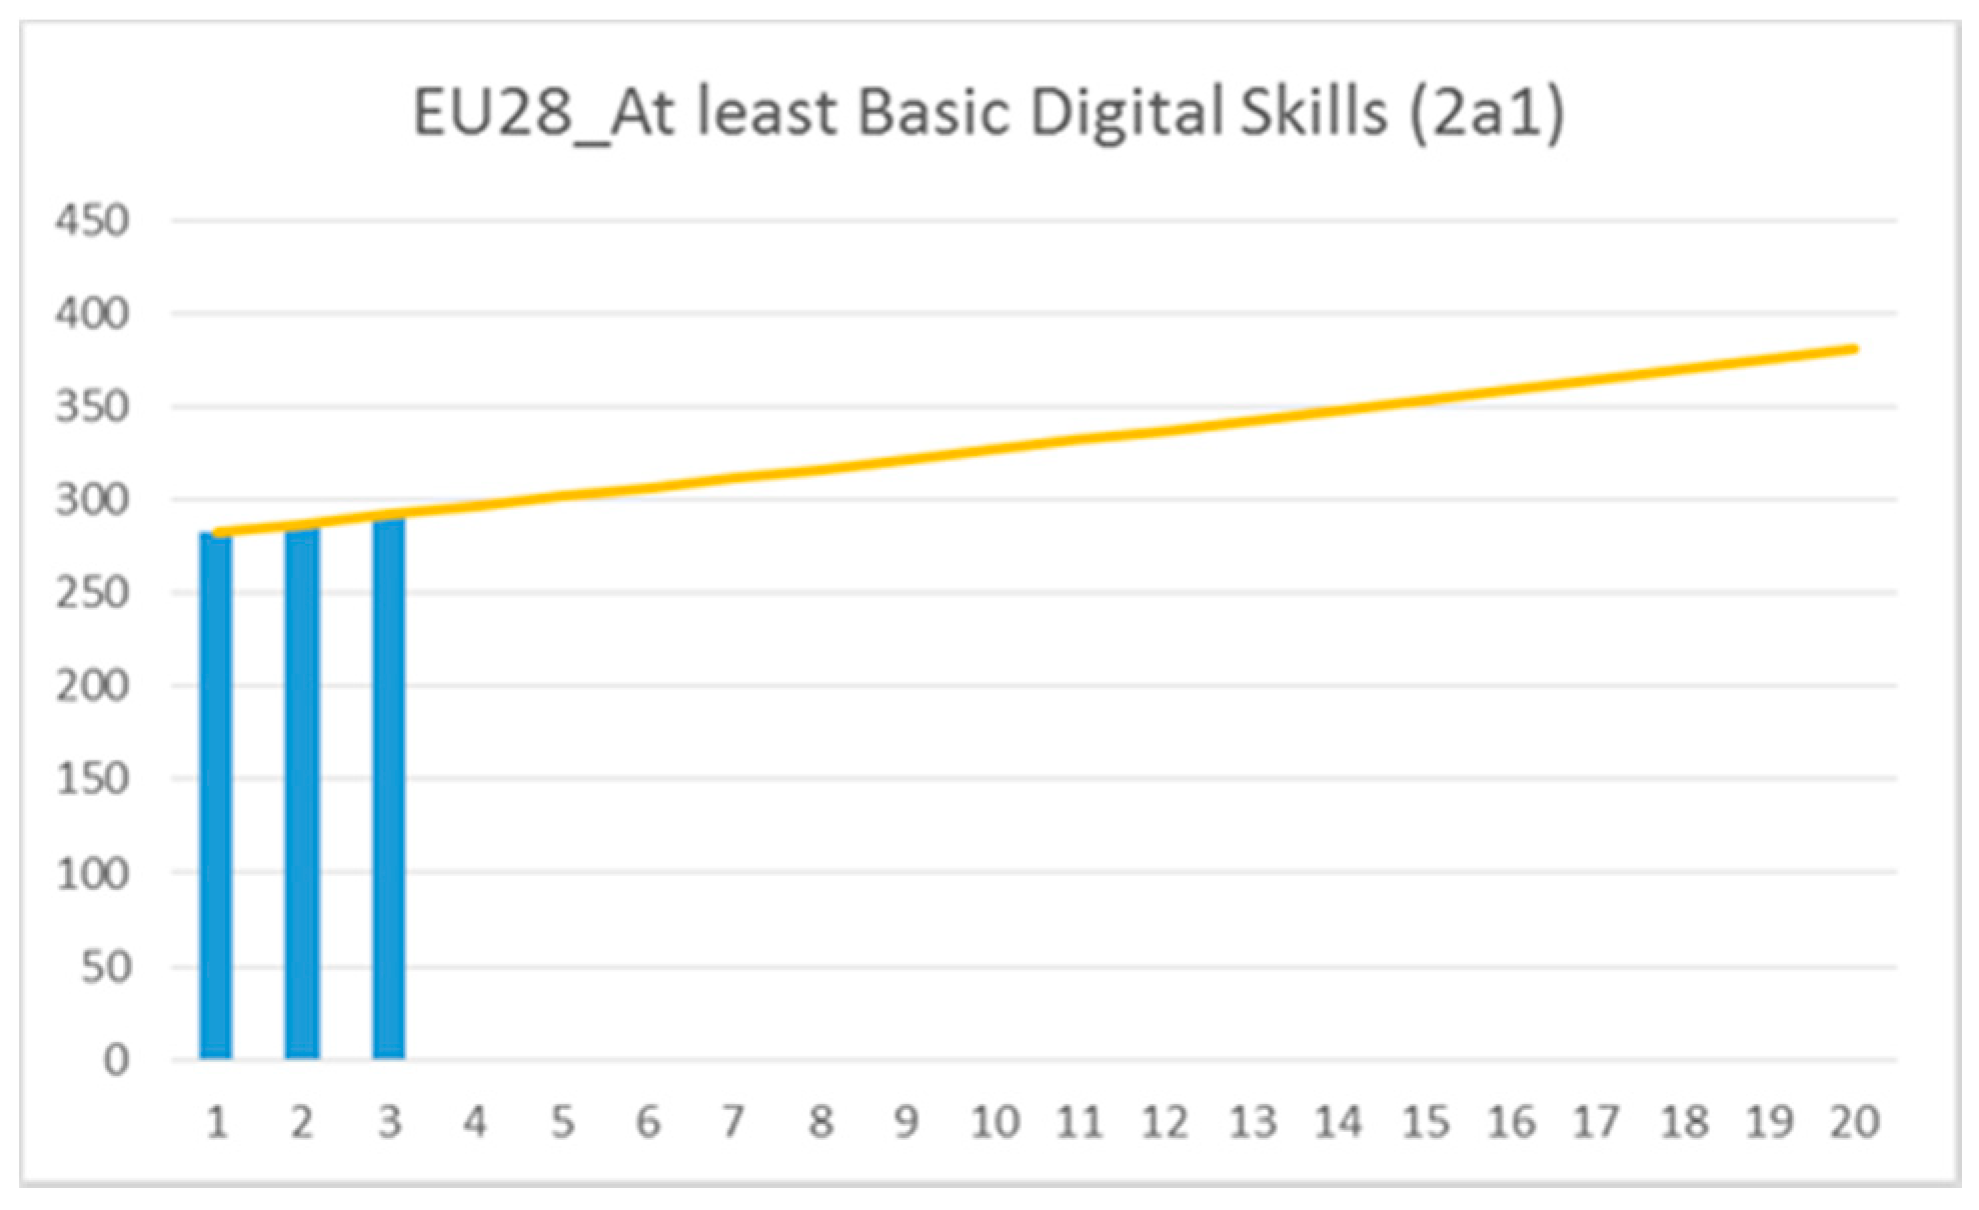
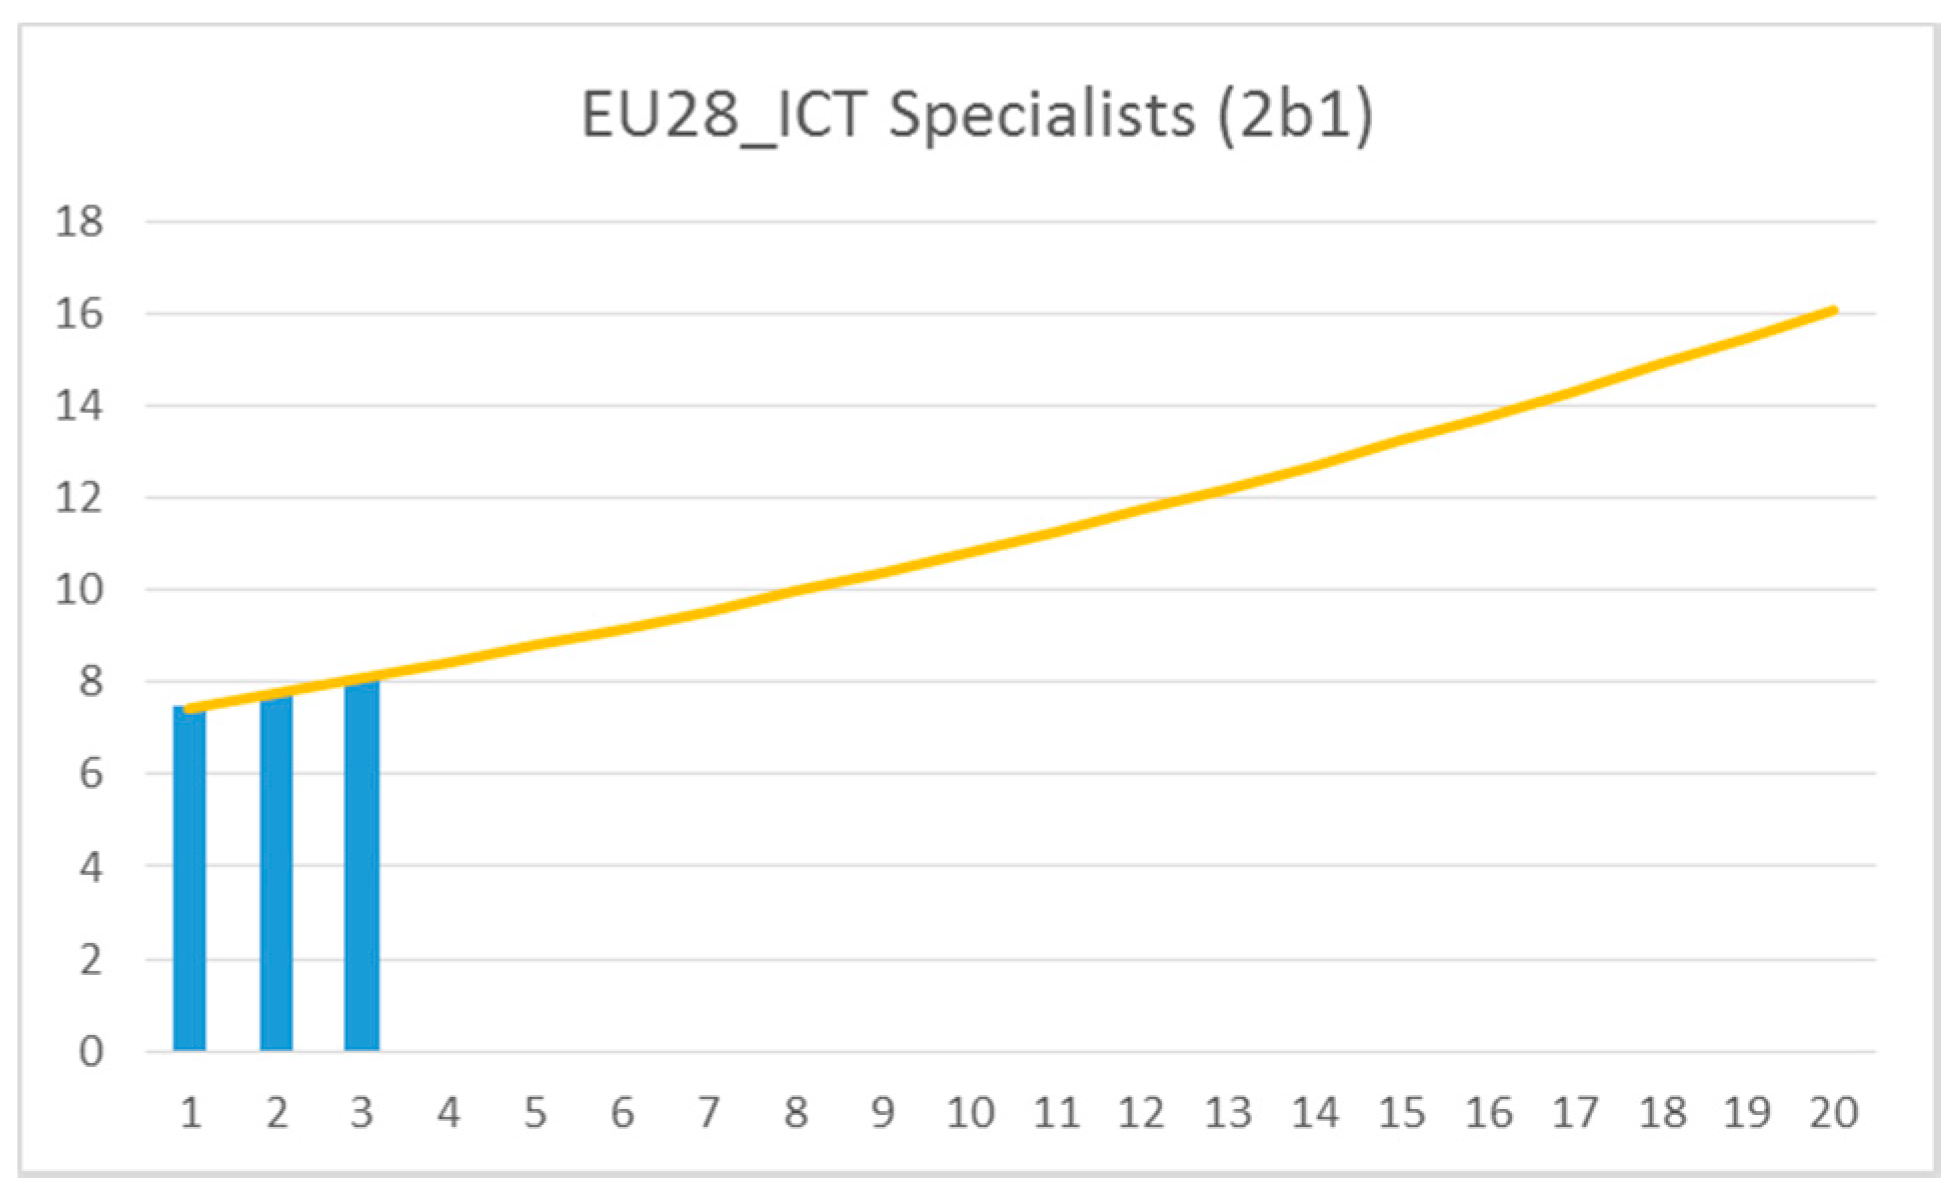
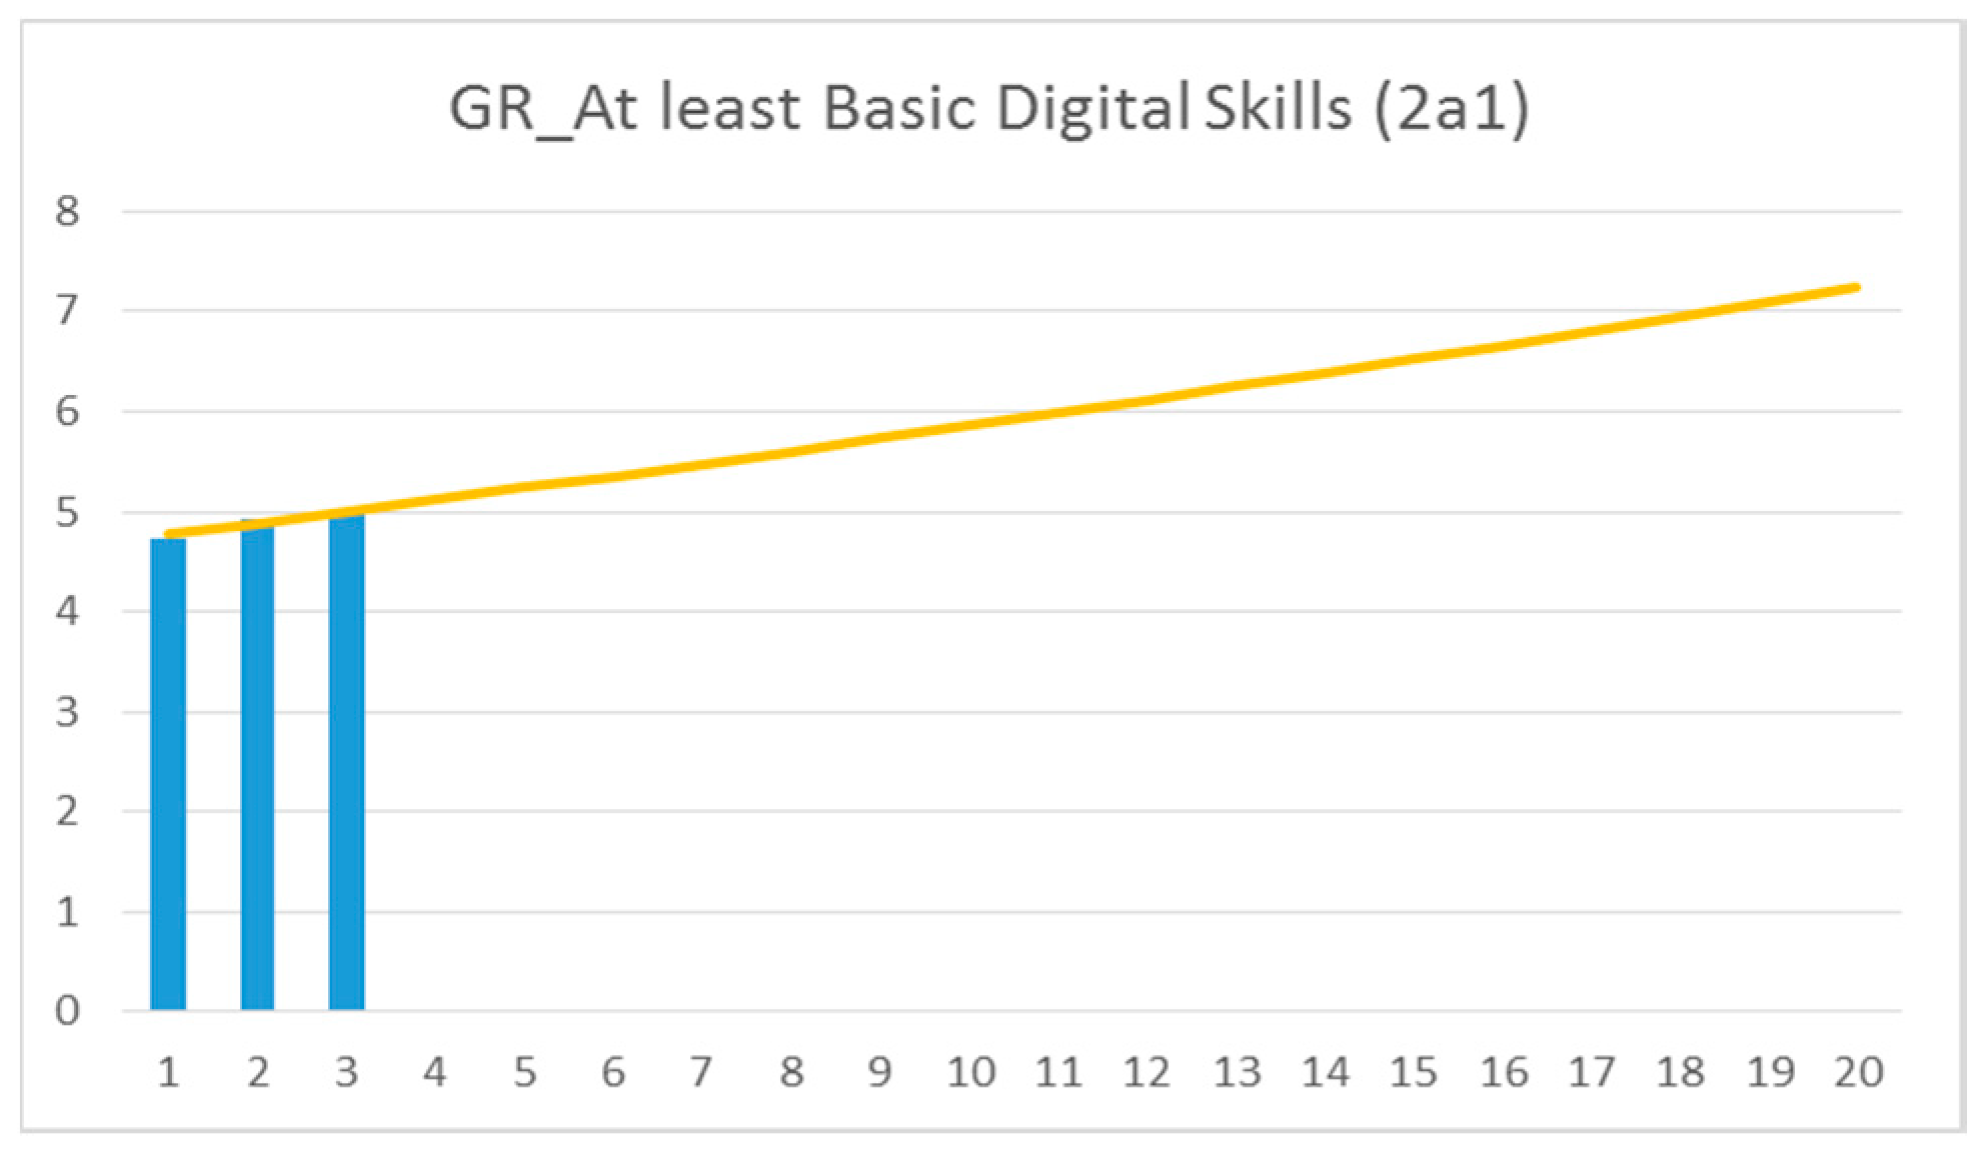
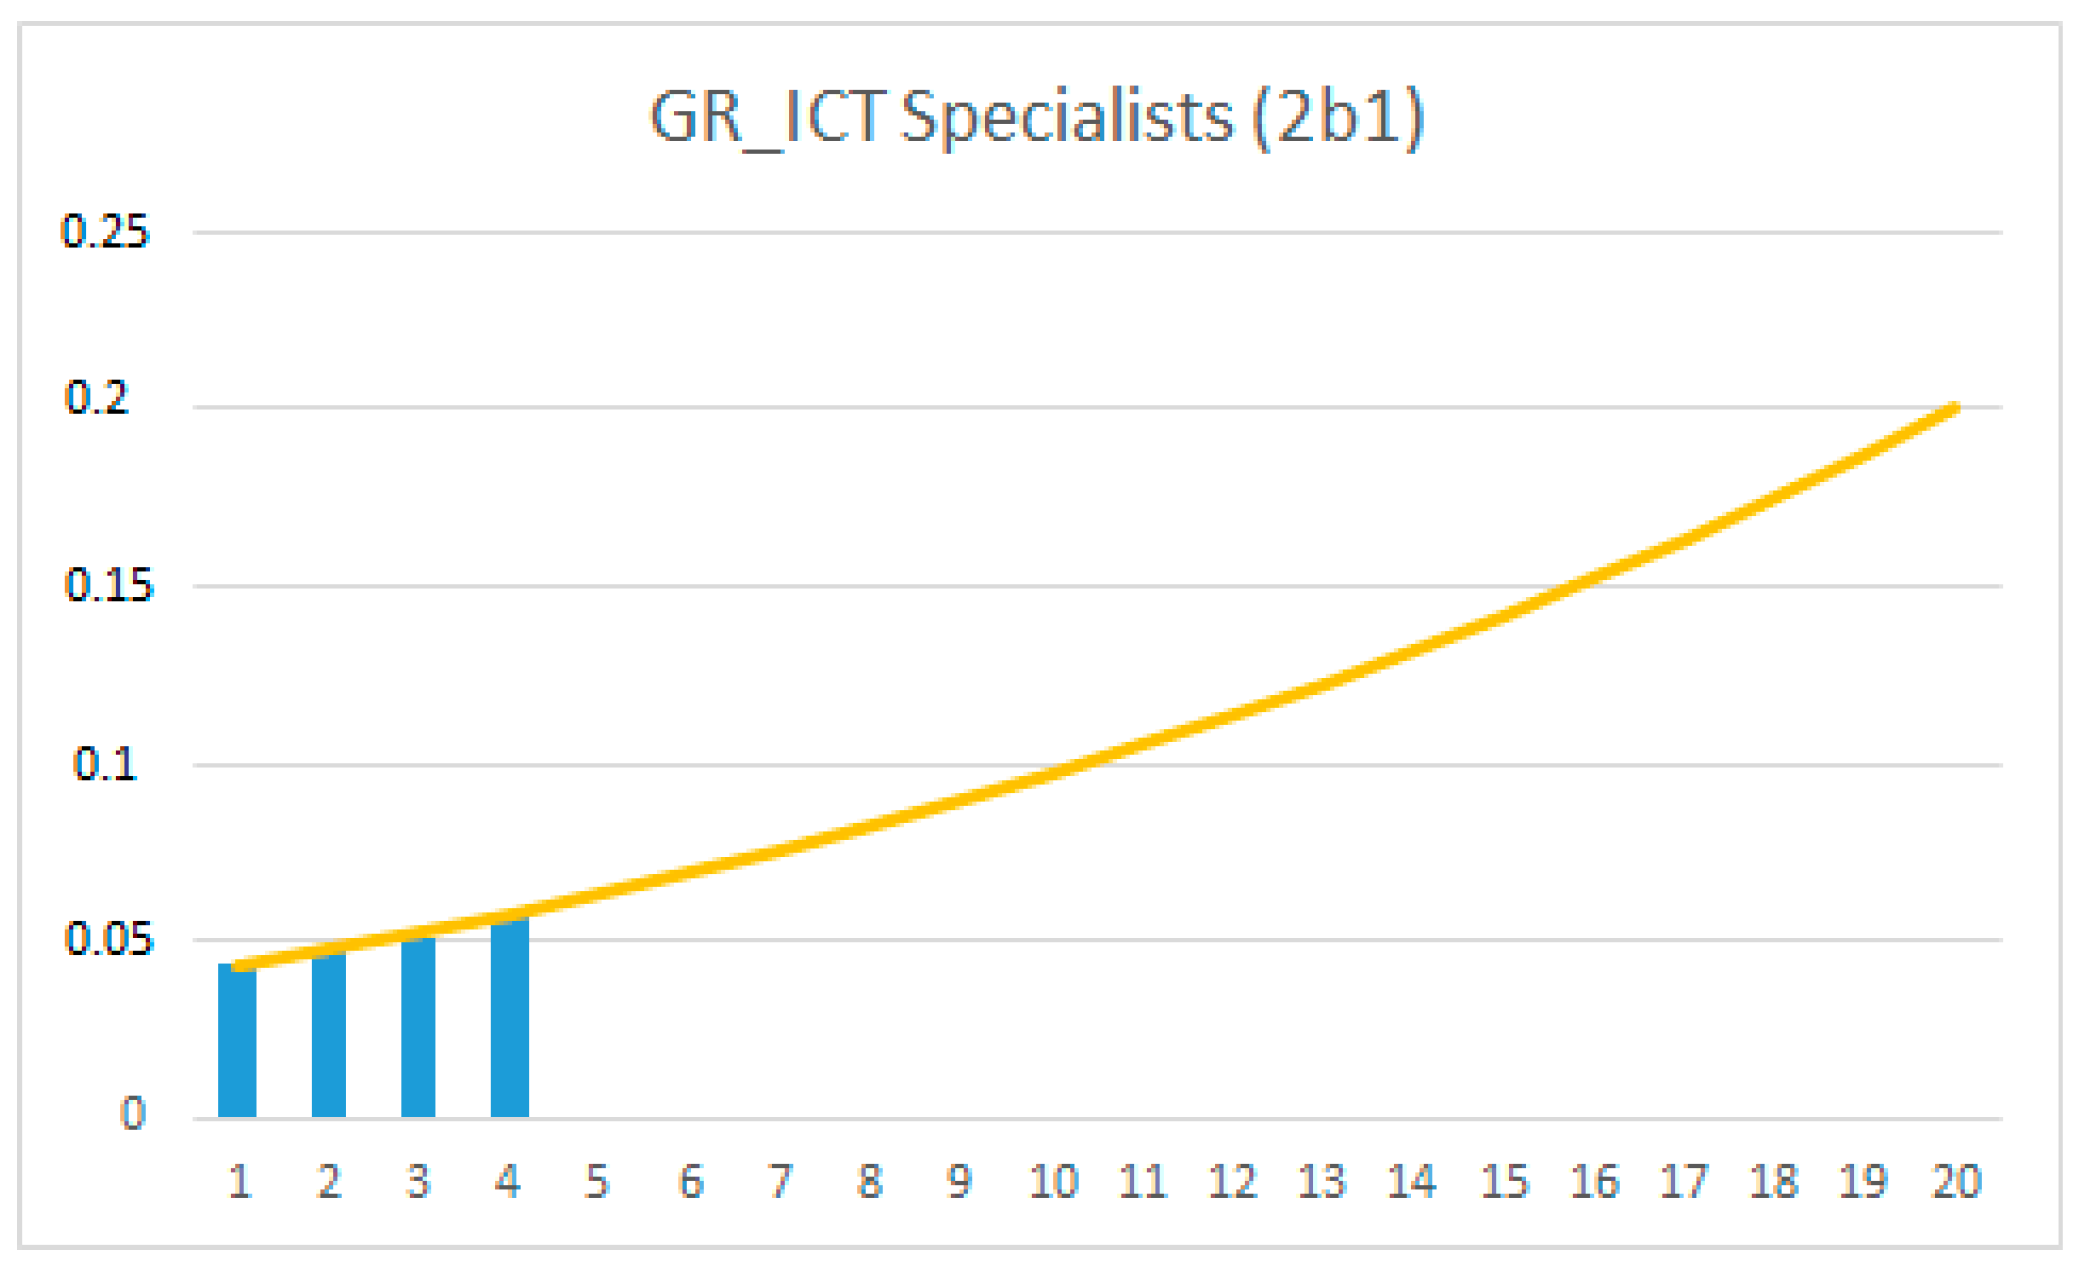
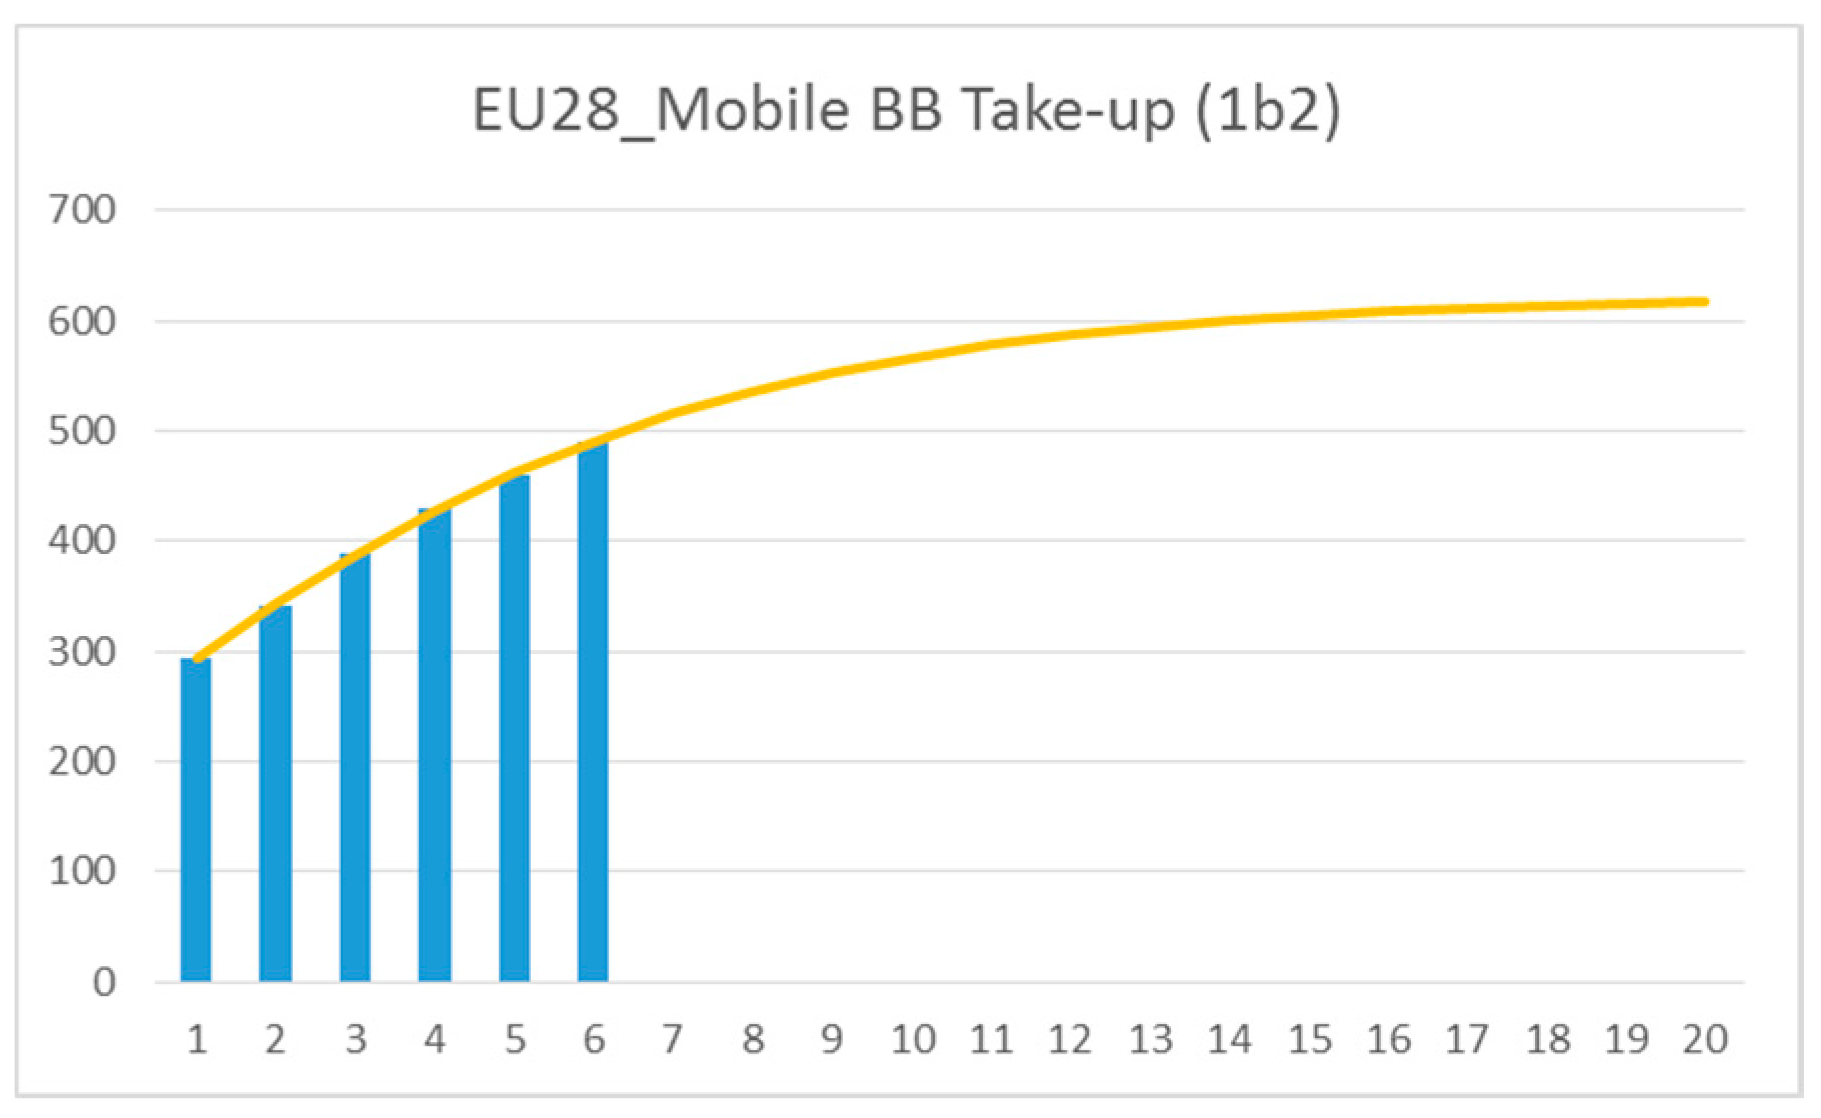
Following this formula, the forecasting values for Greece and EU-28 member states were calculated. The total results are presented in Appendix B, Table A6 and Table A7, where the results are recorded according to the proposed values (e.g., the values of S, alpha, beta, SUM(DIFF^2)), while the time period covered by the input data is presented as well. Appendix C includes indicative graphs for some of the sub-indicators for Greece and the EU-28 over time. The horizontal axis shows the time in years starting from the first year of our data values. The vertical axis shows the forecasted values for each sub-indicator. The blue lines are the values that were used as data.
After forecasting how the above-mentioned indicators will change over the next years, Phase 4 follows where the data calculated (in absolute prices) by using the Gompertz II model are converted again to percentage form of the population. This is a necessary procedure in order to reconstruct the DESI index. By doing so, all five dimensions (Connectivity, Human Capital, Use of Internet Services, Integration of Digital Technology and Digital Public Services) were re-calculated by using the data forecasted, while the calculated sub-indexes provide a new DESI index for a long-term, future period. For the remaining parameters, where no forecast could be conducted, constant values were assumed.
By adopting the proposed methodology and implementing the above-mentioned research framework, data values for Greece and the EU-28 were forecasted, while a comparison (divergence versus convergence) could be applied.

4. Results and Discussion

The current section presents the results of the forecasting values for each of the five DESI dimensions and for the DESI index as a whole.

4.1. Connectivity

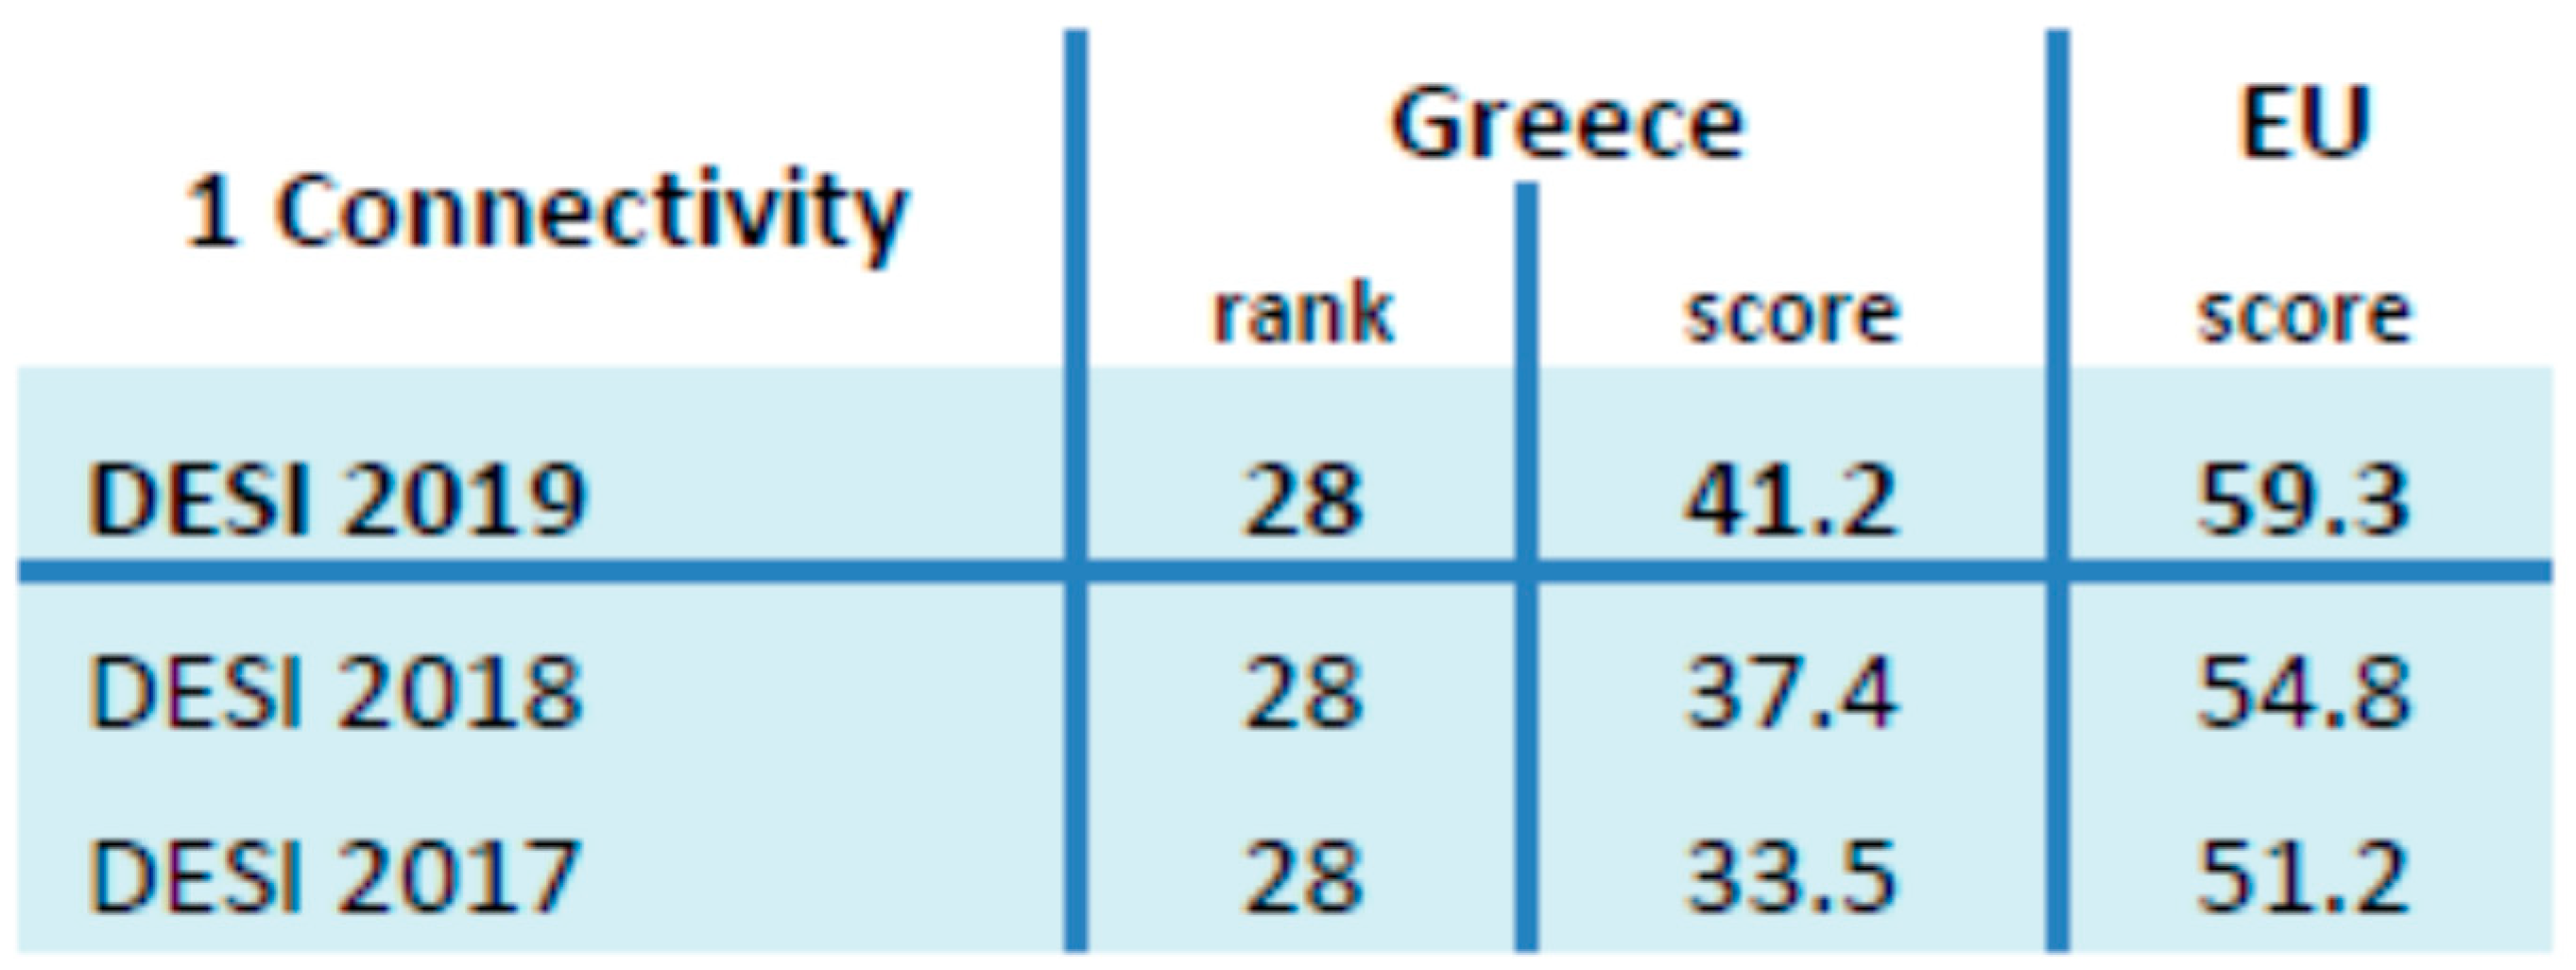
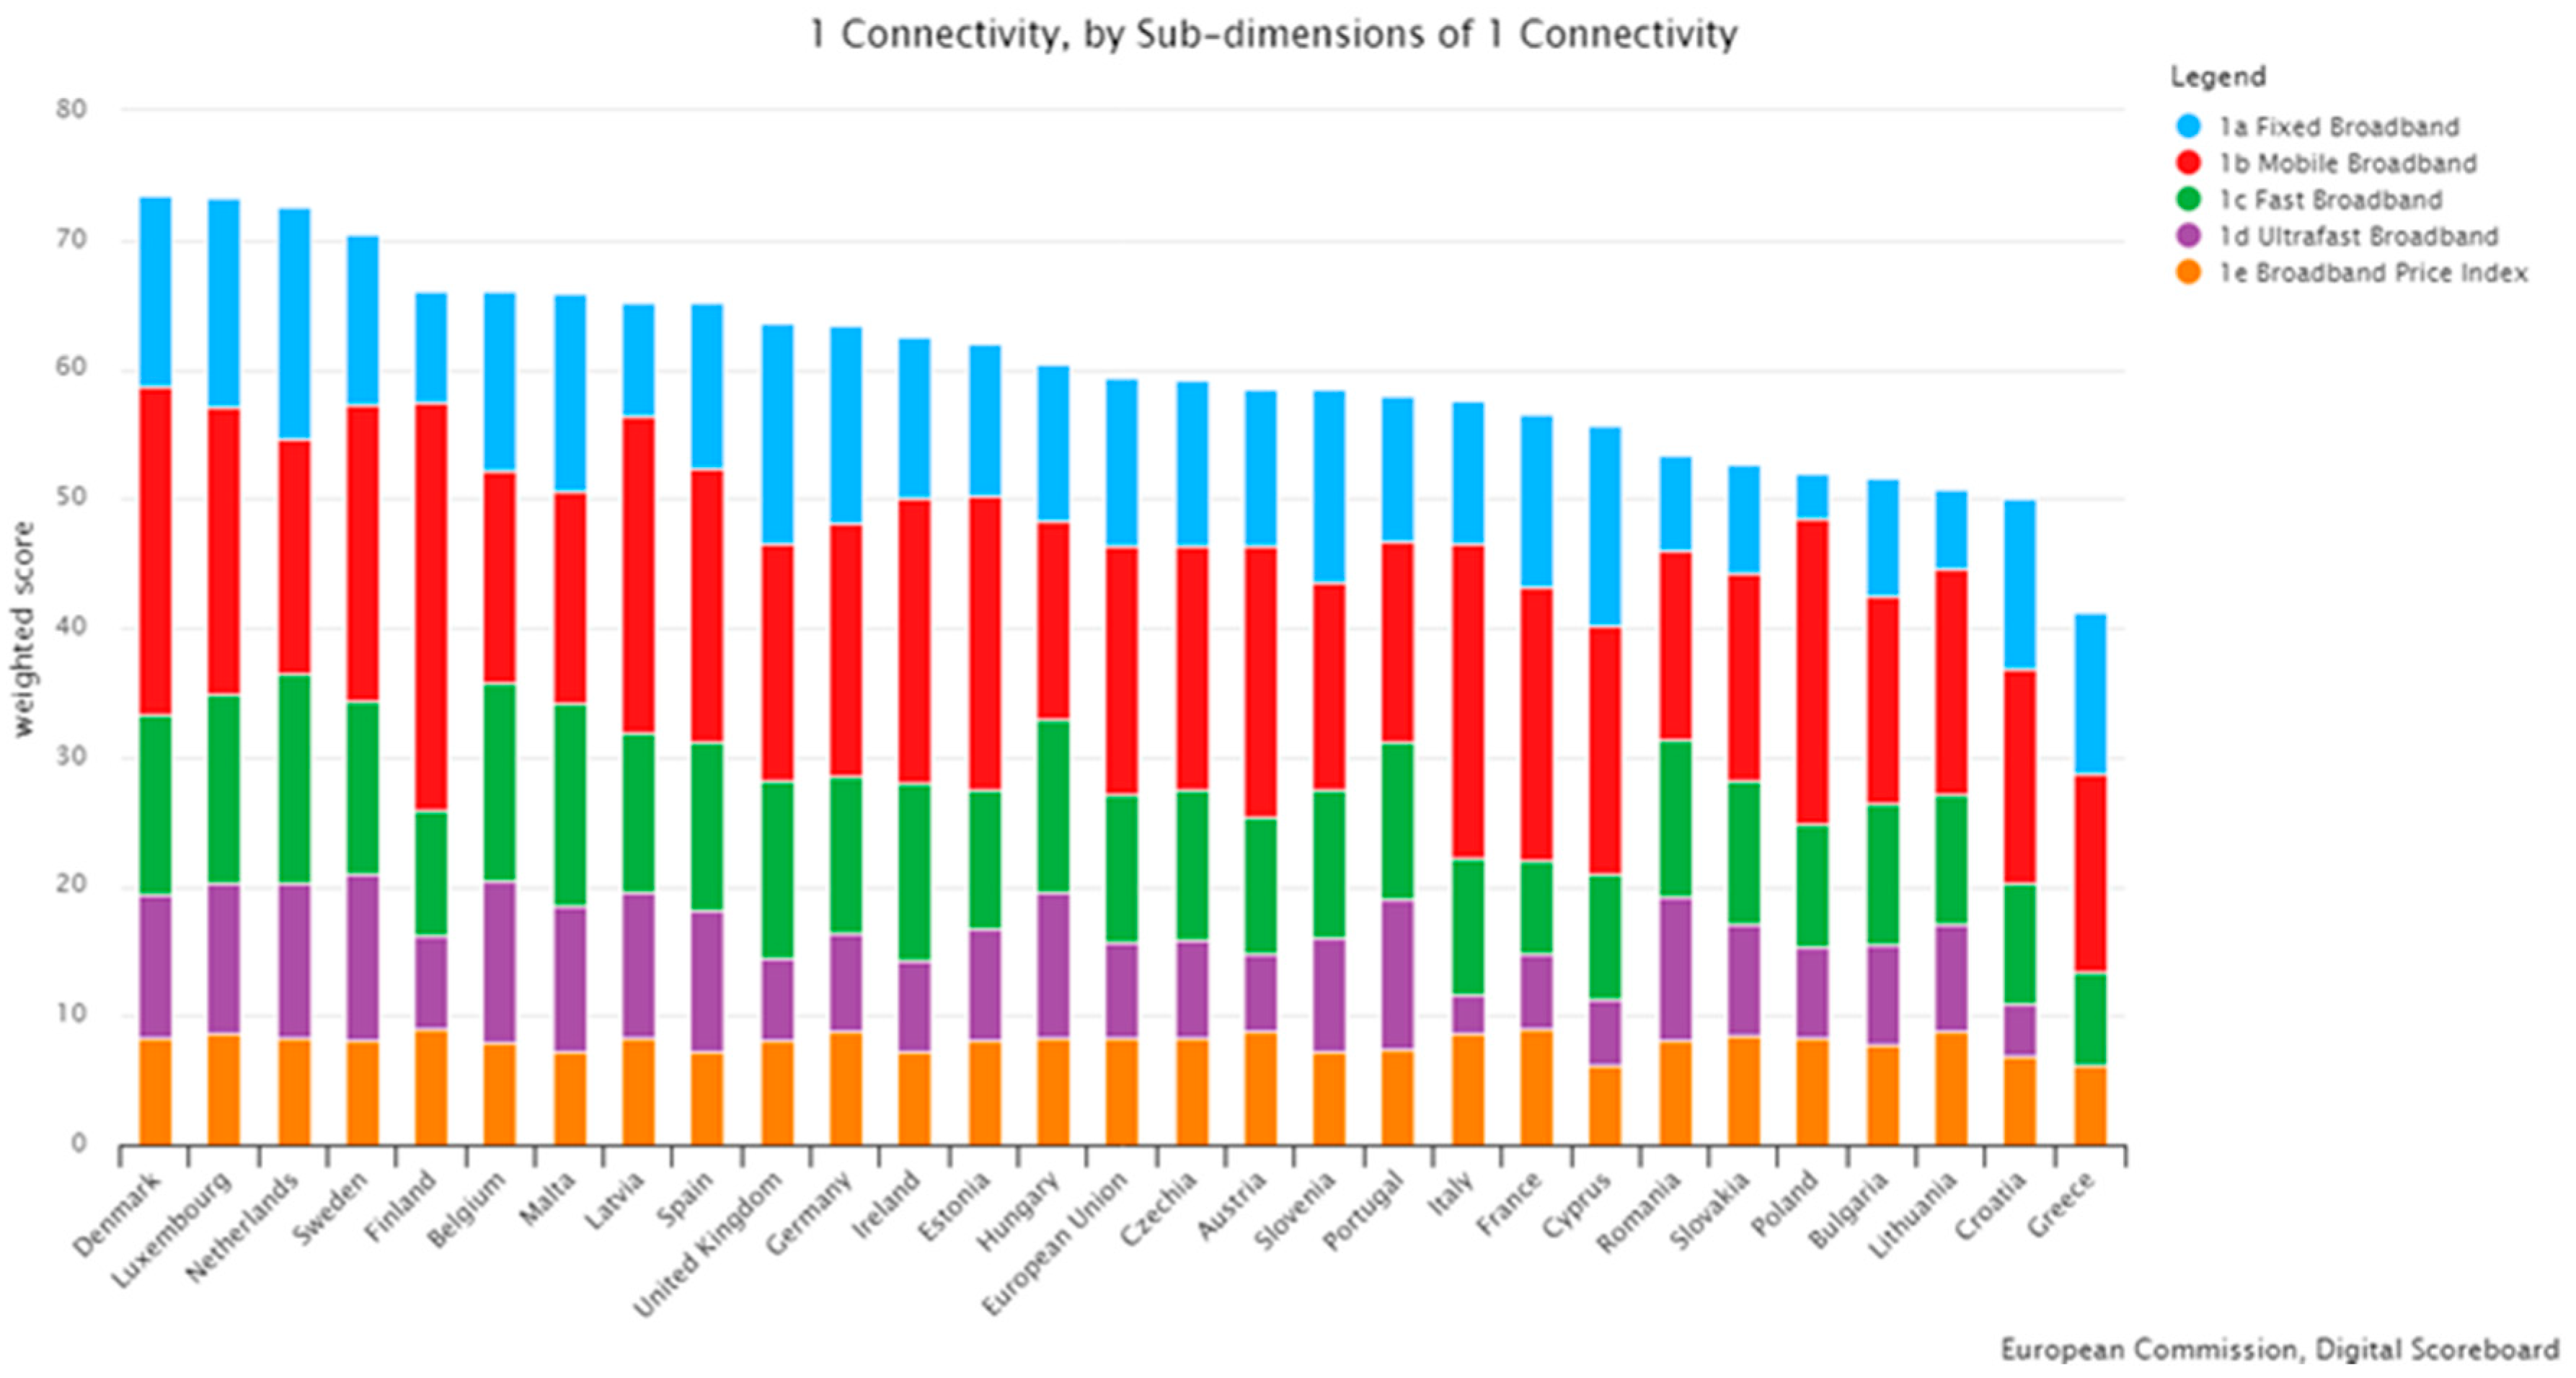
The Connectivity dimension measures the deployment of broadband infrastructure and its quality, as a necessary condition for competitiveness. Greece has systematically been found among the last ranks of EU-28 member states. Even though the Connectivity’s score has increased since 2017, no improvement has occurred as far as its rank is concerned, while the overall connectivity score is 41.2 for 2019 (Figure 1). The country has a wide fixed broadband coverage, reaching 96%, which is slightly lower than the 97% EU-28 average (Figure 2). Fixed broadband take-up is, however, progressing slowly (74%) compared with the rest of the EU member states. According to the European Commission (European Commission 2019), this may reflect a comparatively high level of prices, compared to the EU-28, revealed by the indicator entitled “Broadband price index”, in which Greece is ranked last.
As far as 4G coverage is concerned, Greece has 92% coverage, slightly below the EU-28 average but the results indicate that mobile broadband take-up is estimated at 74 subscriptions per 100 people, well below the EU average of 96 subscriptions per 100 people. 5G readiness is estimated at 0%, which is a delay compared to the 14% of the rest of the member states. NGA coverage remains at low levels (66% compared to 83% for the rest of the EU), and even though there is an increase in subscriptions related to fast broadband networks, the national percentage (11%) is rather low compared with the European average (41%). Finally, with a percentage beneath 1%, it is as if the country has almost no ultrafast broadband networks.
Even though there is an update of the national broadband plan and significant progress of the vectoring implementation, there still exist important delays in implementing the projects and in the absorption of the funds allocated. This fact led the country to be ranked 28th among the EU-28 countries in 2018. Greece bases its hopes for further improvement on private investments that may be favored by changes to the existing legal framework, that can enhance investments in 5G development and hasten the proceedings for antenna permits.
Taking into consideration the progress and data values during the years 2014–2019, the forecasting techniques were applied for the values that can be forecasted for Greece and the EU-28 (gray rows in Table 2). The values of the rest of the subdimensions remained constant (subdimension of Broadband Price Index).
Forecasted values were calculated for each indicator (with gray color), while each indicator contributes to a single subdimension (column entitled “Indicators Contribution). Each of the four DESI Connectivity subdimensions was calculated as the weighted average of the normalized indicators, while the fifth subdimension remained as a constant price. Finally, the DESI “Connectivity dimension” was calculated as the weighted average of the five subdimensions: (a) fixed broadband (18.5%), (b) mobile broadband (35%), (c) fast broadband (18.5%), (d) ultrafast broadband (18.5%) and (e) Broadband Price Index (9.5%).
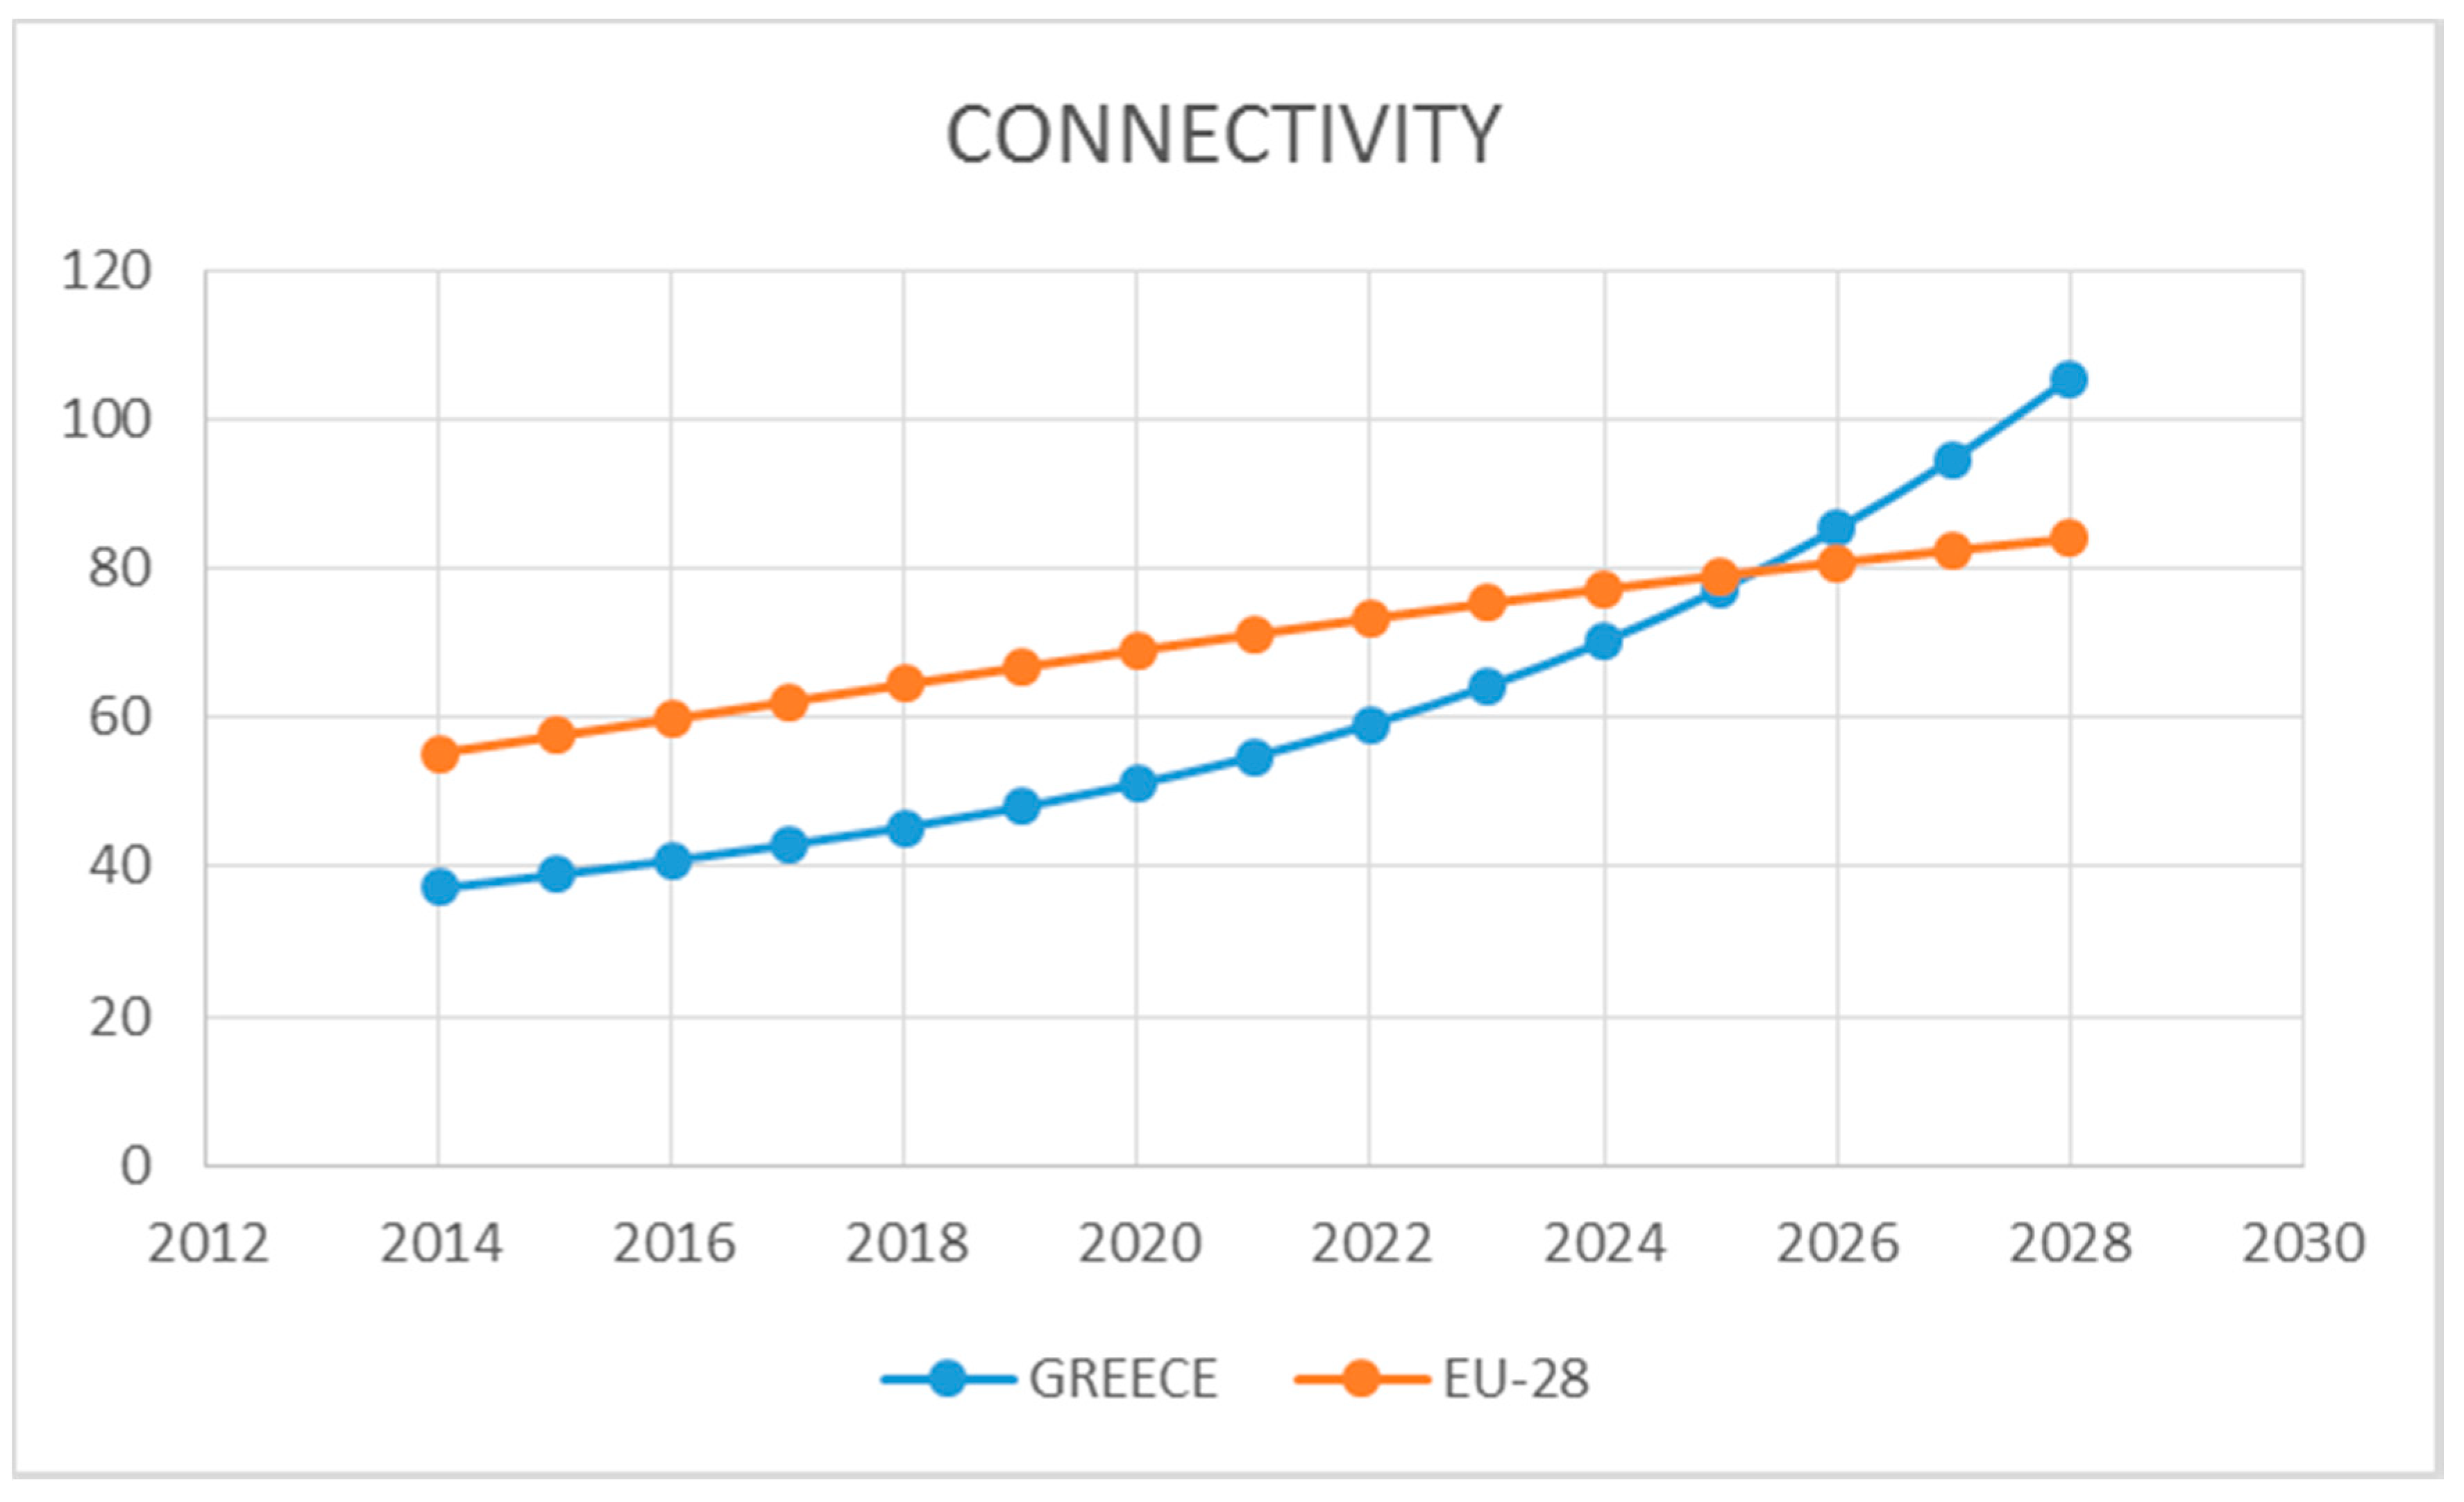
The chart below (Figure 3) graphically presents the DESI Connectivity dimension for Greece and the EU-28. The proposed methodology forecasts a converging procedure, while the results calculated estimate that Greece will exceed the EU-28 average, in 2026. As far as the Connectivity dimension is concerned, Greece seems to be in a take-up procedure, while the reasons for being below the EU-28 average seem to be known and under a find—solution procedure. Fast broadband and ultrafast broadband seem to be the subdimensions that need more action from a regulatory and the state’s scope.

4.2. Human Capital

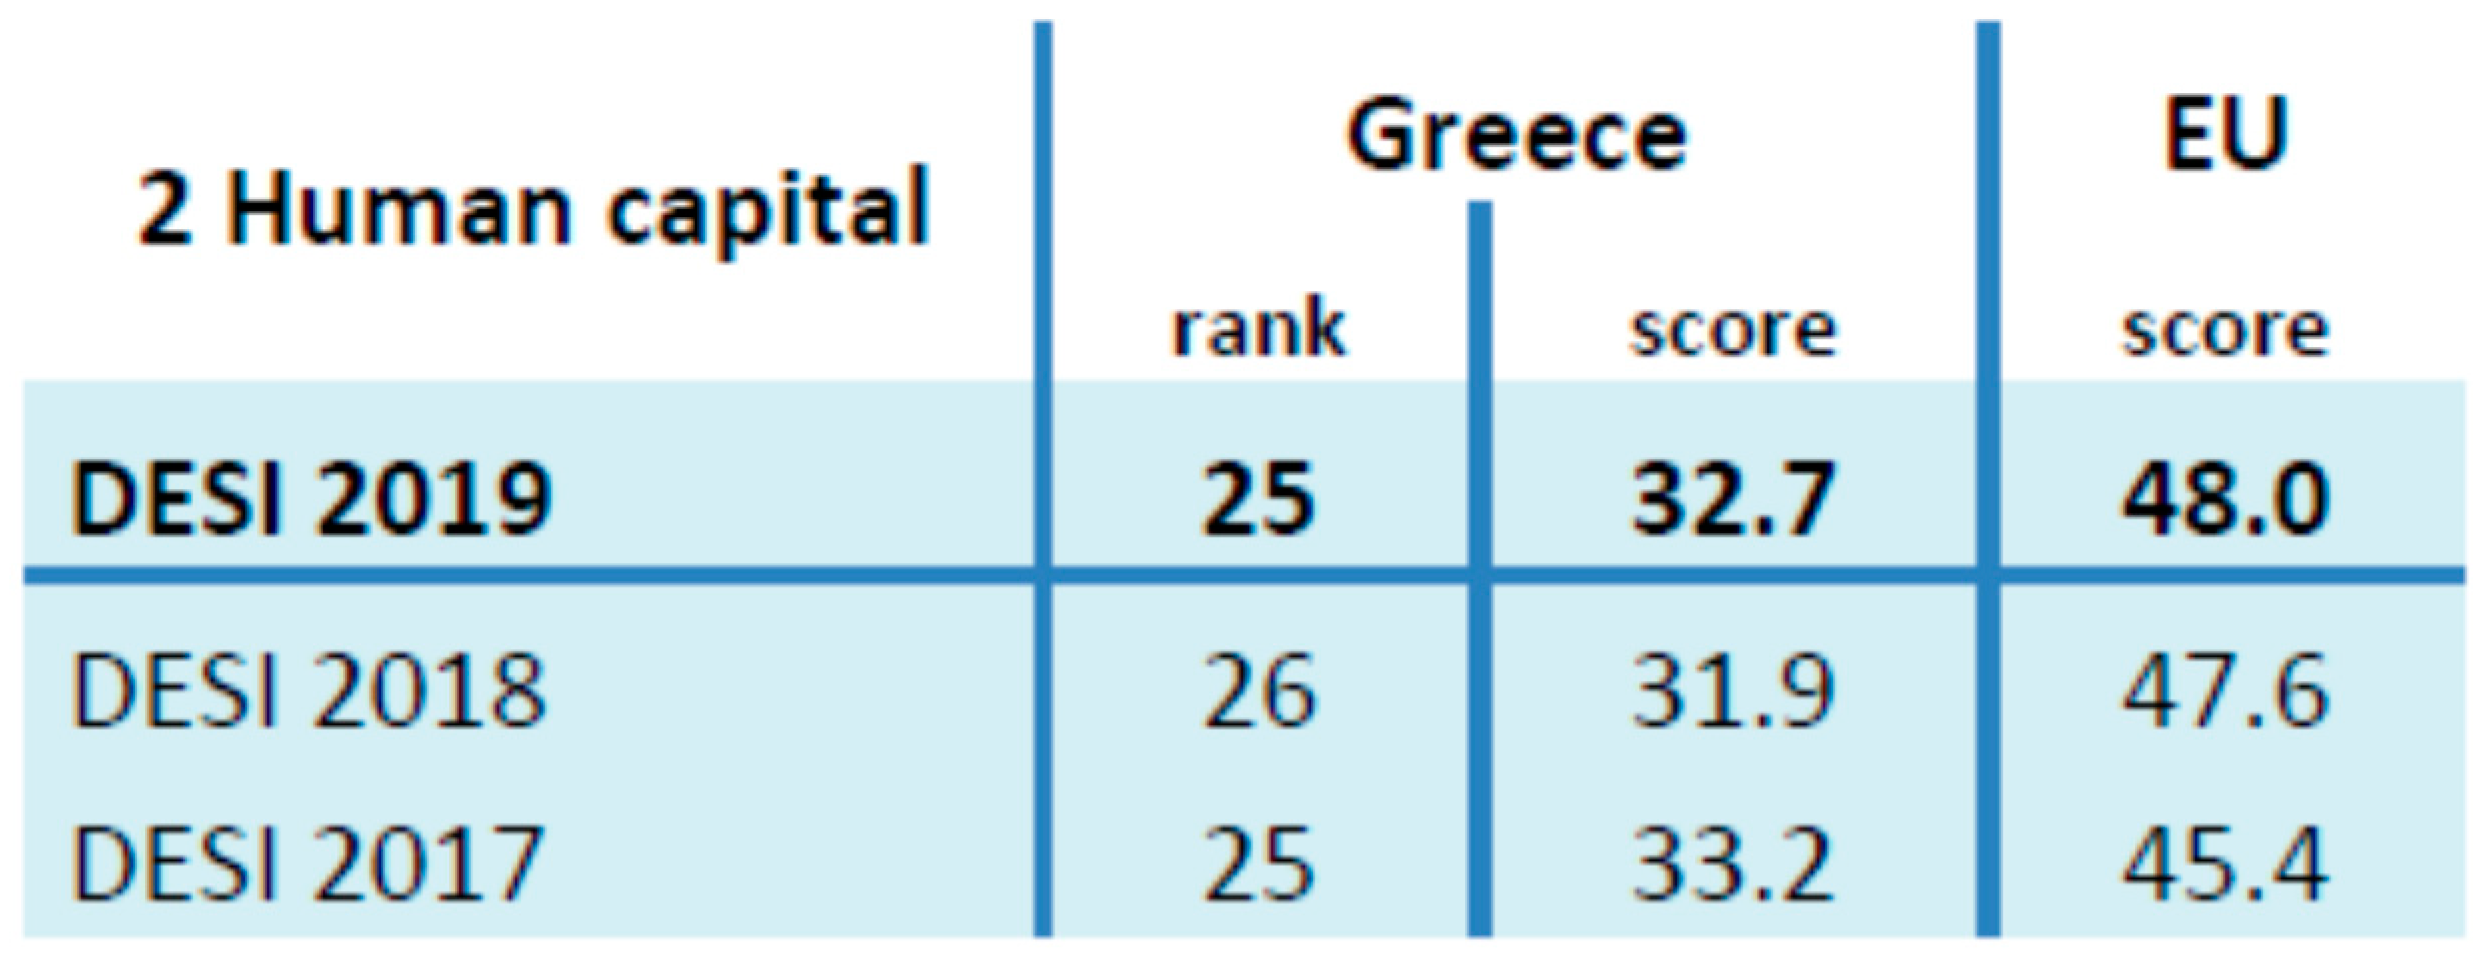
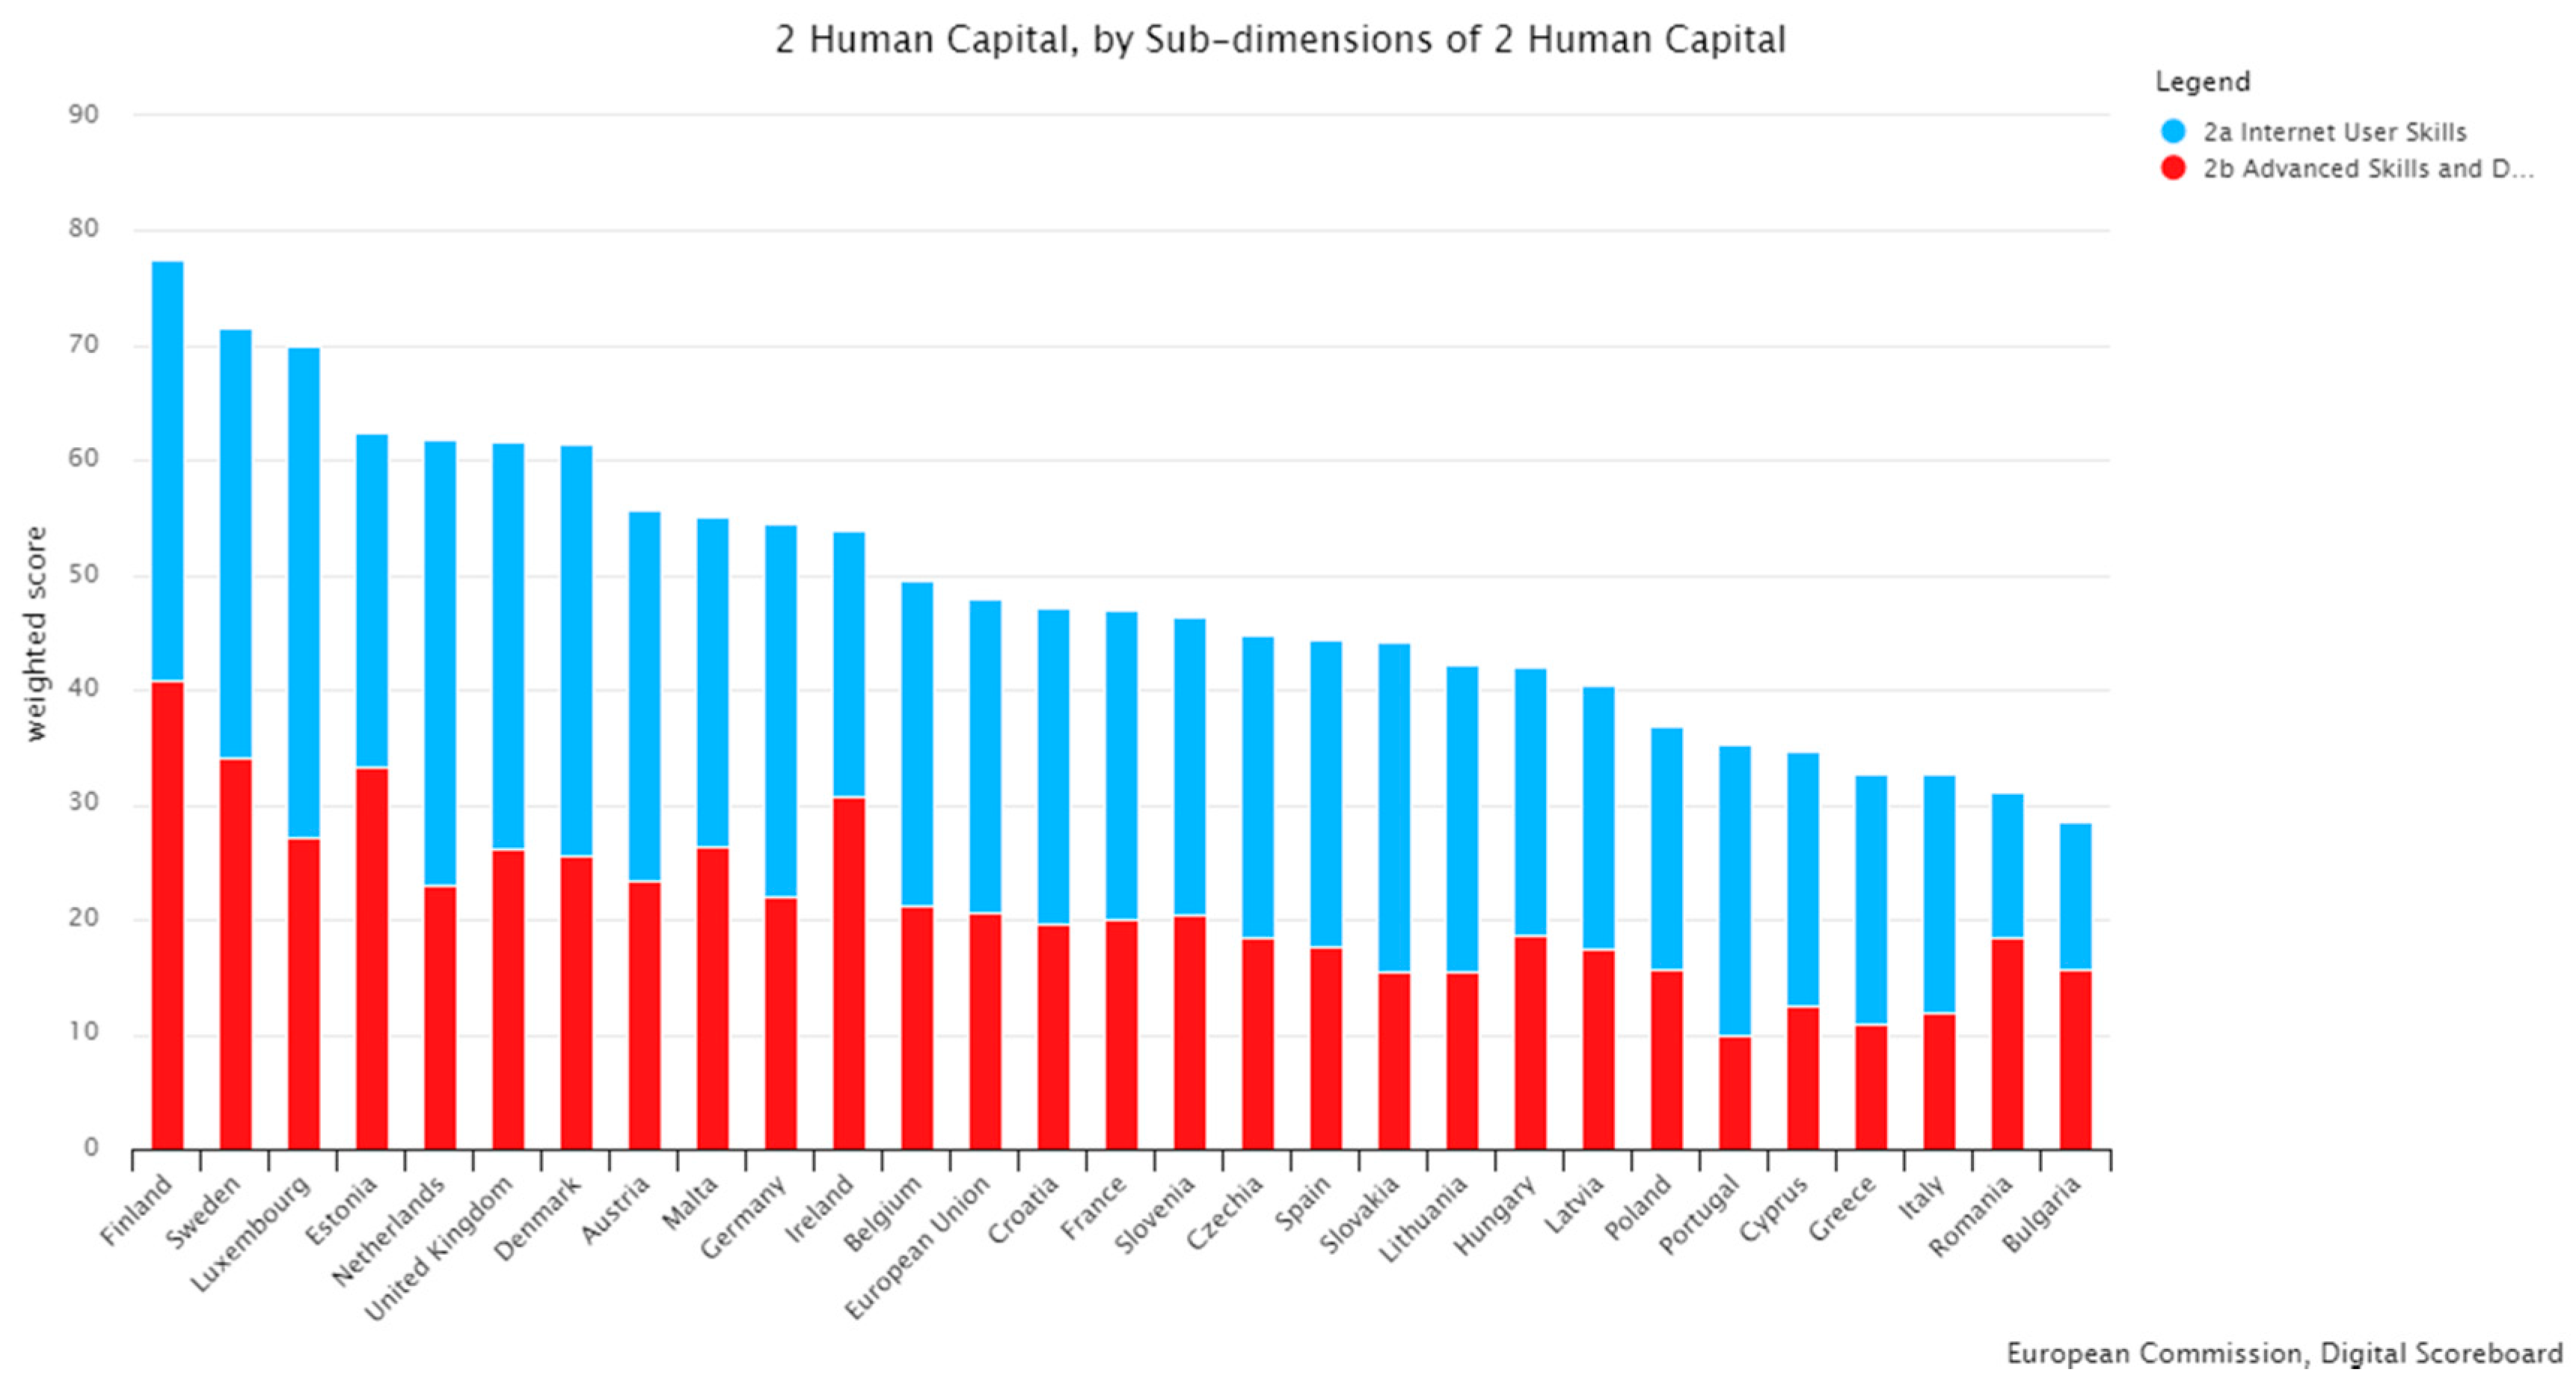
The Human Capital dimension measures the skills needed to take advantage of the possibilities offered by digital. Even though Greece has made some progress, it still remains well below the EU-28 average. The country is not ranked last in the EU-28, positioning in 25th place (Figure 4 and Figure 5), since Italy, Romania and Bulgaria are lower in the ranking. It should be stressed that as far as the last two countries are concerned, they both have a higher degree in “Advanced Skills and Development” than Greece, which mainly reflects professionals’ and specialists’ skills. Greece’s main advantage is based on “Internet user skills” which reflect the wider society.
It is worth mentioning that during 2017, less than 50% of the individuals aged between 16 and 74 years old had at least basic digital skills (57% in the EU-28). Most significant is that 31% of those that did not have basic digital skills (almost 16% of the total population) reported having no digital skills at all. This is one of the main indicators where a great divergence exists between Greece and the EU-28, with the former’s percentage being 31% and the latter’s percentage being 17%.
Moreover, Greece seems to have the lowest share of ICT specialists in total employment in the EU-28: 1.6% in 2017, compared with an EU-28 average of 3.7%. The financial crisis has most probably forced the most experienced and well-educated employment force to emigrate to other European Union countries, as the ICT specialist sector is a much more promising sector for job seeking abroad for Greek professionals of the sector.
Taking into account the progress and data values during the years 2016–2018, the forecasting techniques were applied for the values that can be forecasted for Greece and the EU-28 (gray rows in Table 3). The rest of the values regarding indicators (2a3—At least basic software skills, 2b2—Female ICT specialists, 2b3—ICT graduates) remain constant.
Forecasted values were calculated for each indicator (with gray color), while each indicator contributes to a single subdimension (column entitled “Indicators Contribution”). Each of the two DESI Human Capital subdimensions was calculated as the weighted average of the normalized indicators. Finally, the DESI “Human Capital dimension” was calculated as the weighted average of the two subdimensions: (a) Internet user skills (50%) and (b) Advanced skills and development (50%).
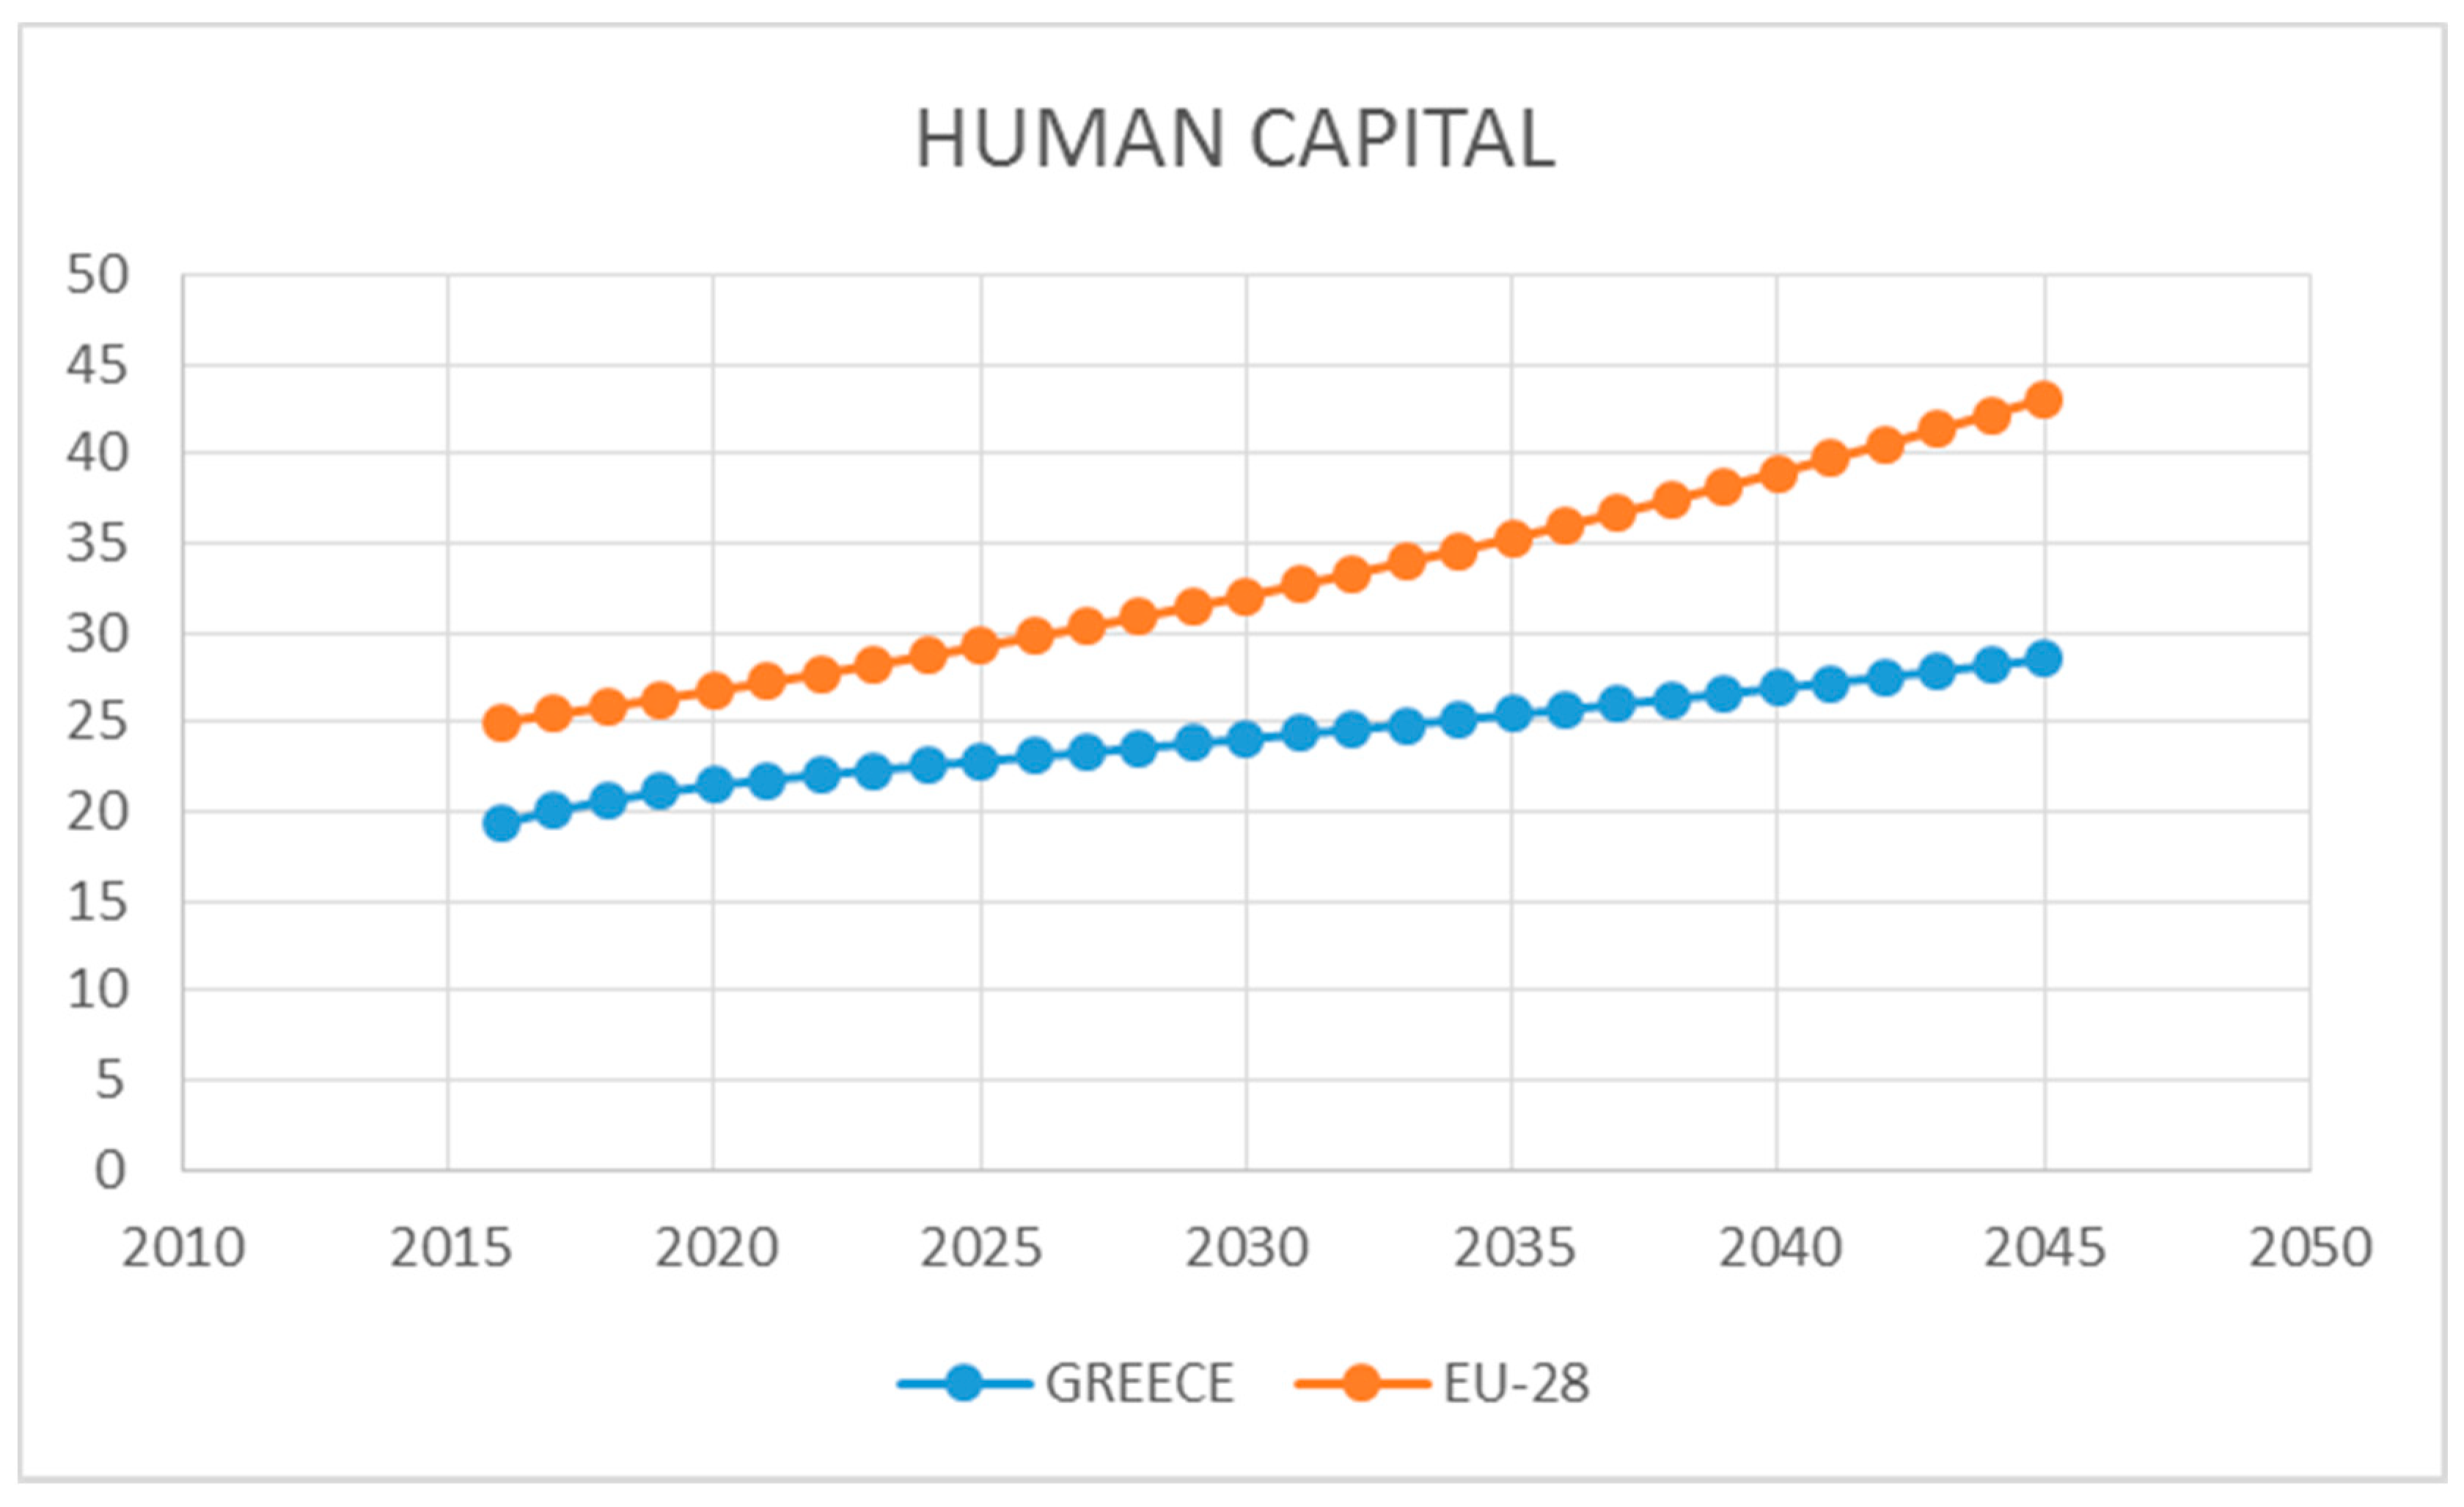
The chart (Figure 6) shows graphically the DESI Human Capital dimensions for Greece and the EU-28. The calculations show that Greece is not converging on the other states, thus there is a necessity for Greece to implement a more effective strategy, in order to attain the EU-28 average. Most significantly, it must be reported that the results indicate that the rest of the EU-28 member states seem to invest more in human capital, especially as far as it concerns Advanced skills and development. Divergencies in this dimension may lead to a multi-speed European Union regarding skills and conditions for further business and societal development.

4.3. Use of Internet

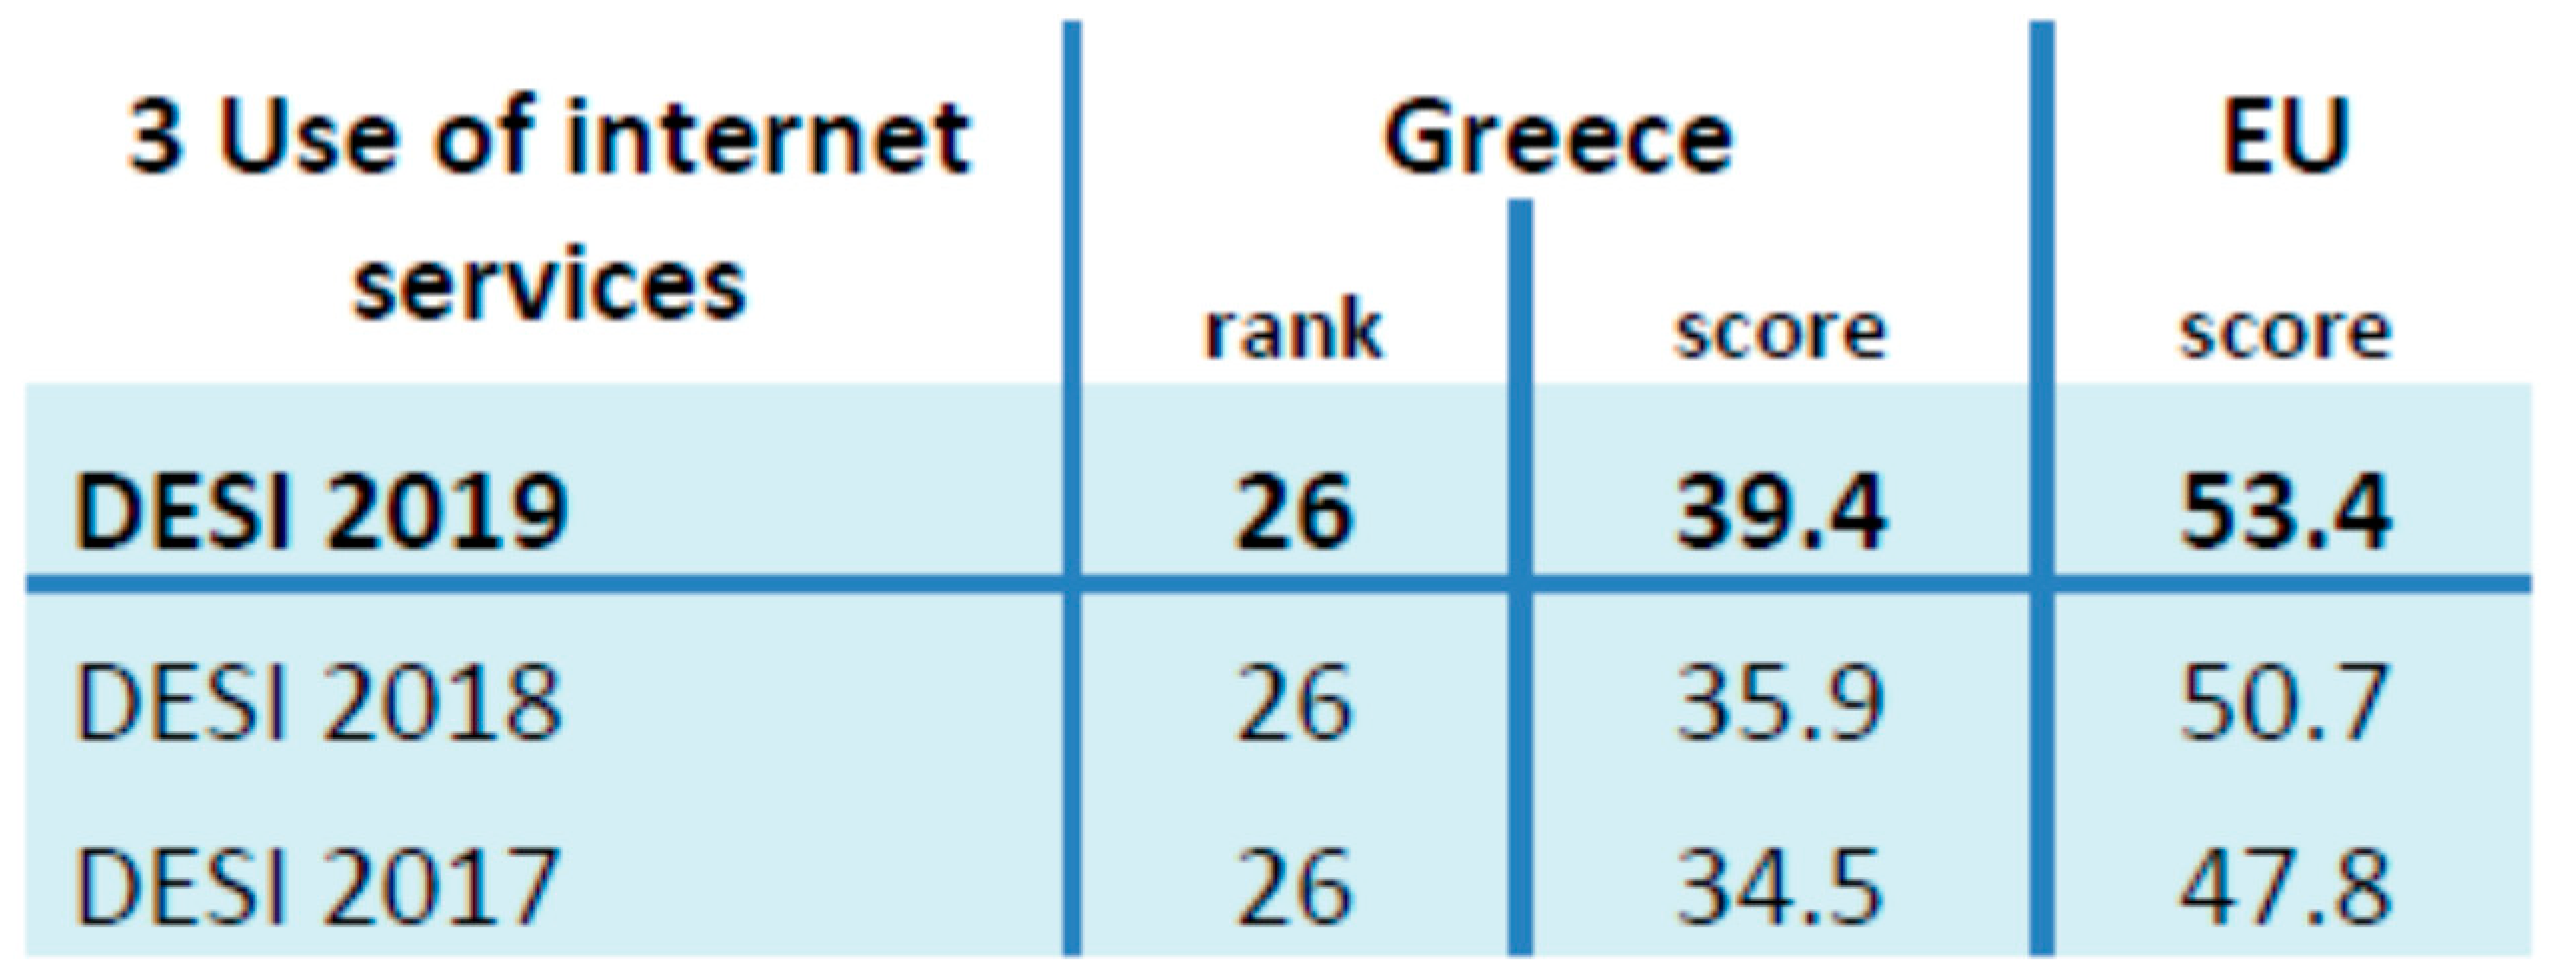
The Use of Internet Services dimension accounts for a variety of online activities, such as the consumption of online content (videos, music, games, etc.) and video calls as well as online shopping and banking. These activities can be divided into two general categories: (a) activities conducted by individuals for entertainment and (b) activities conducted as part of a professional or business life. Figure 7 reveals that Greece is ranked among the last positions in the EU-28.
Even though the number of internet users is growing, these users are mainly concentrated on online activities related to entertainment (e.g., news online, making video calls and using social networks). A total of 87% of Greek internet users read news online, 61% use video calls and 73% use social networks. On the other hand, more professional activities such as professional social networks, banking, shopping and selling online are far below the EU-28 average, revealing an existing digital gap. This gap is better revealed in Figure 8, where Greece is ranked above Bulgaria and Romania only.
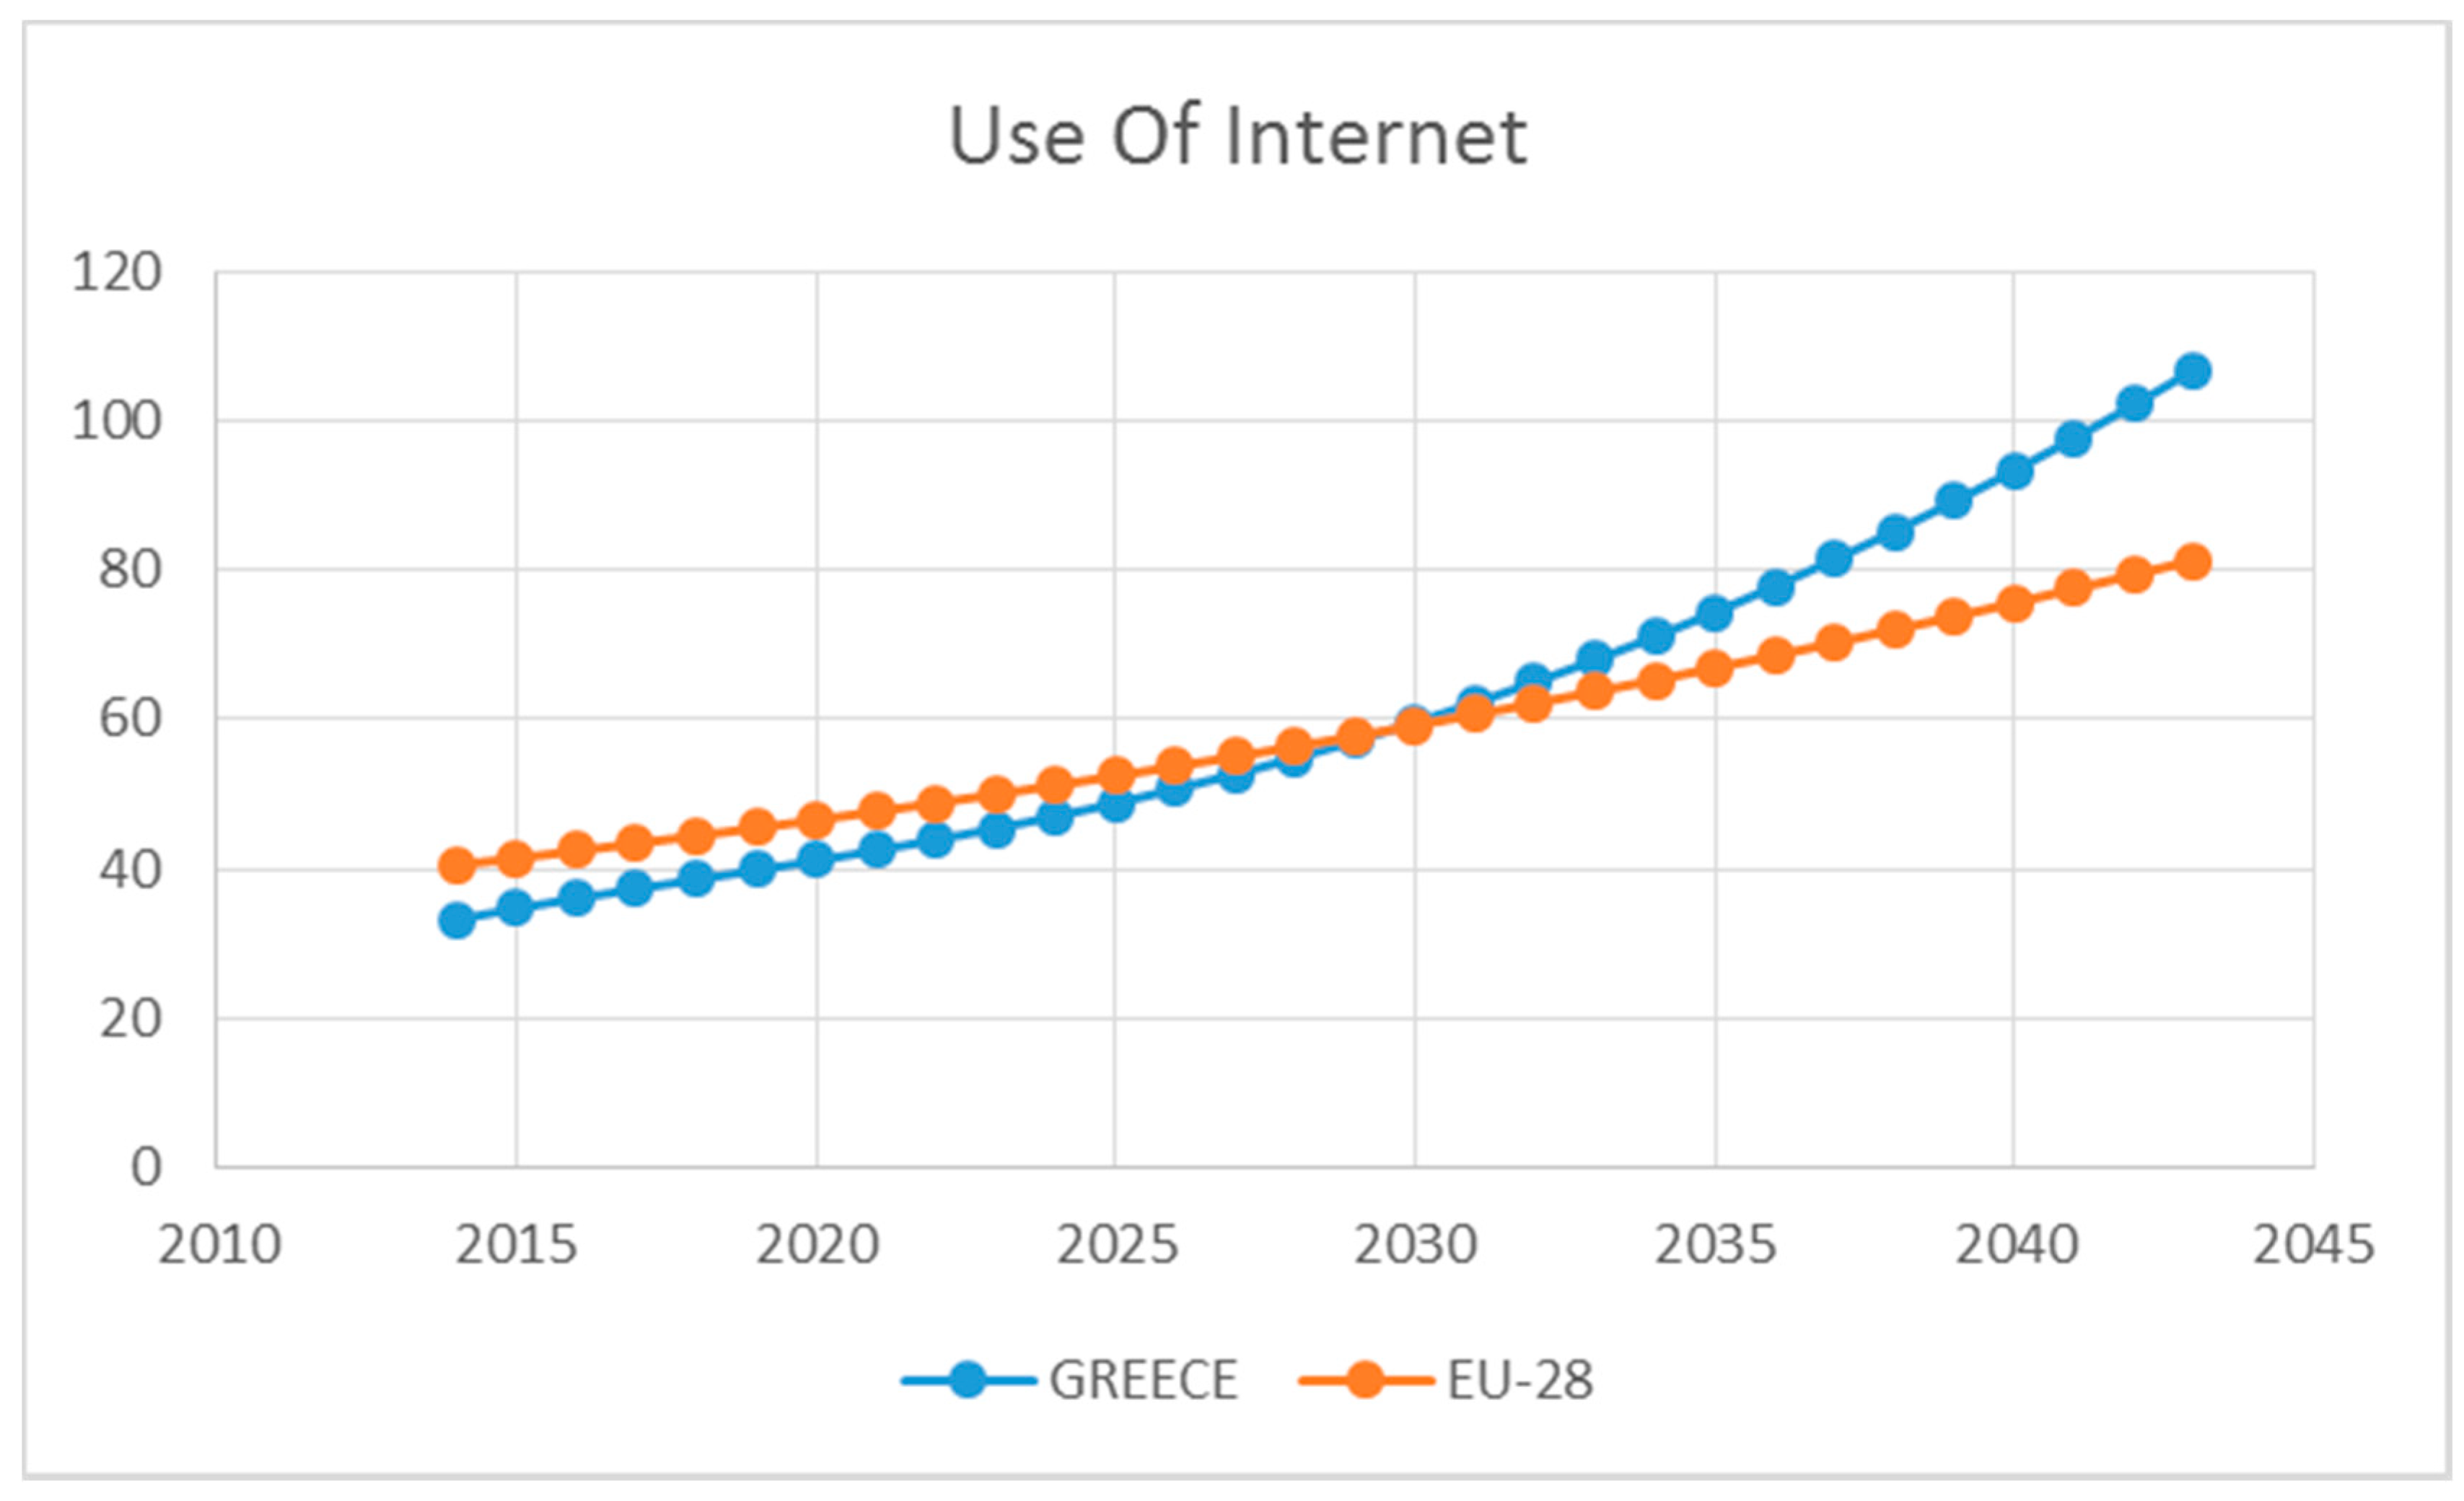
Taking into account the progress and data values during the years 2016–2018, the forecasting techniques were applied for the values that can be forecasted for Greece and the EU-28 (gray rows in Table 4). The rest of the values regarding indicators (3a1—People who never used the internet, 3b2—Music, videos and games, 3b3—Video on demand, 3b7—Doing an online course, 3b8—Online consultations and voting, 3c3—Selling online) remain constant.
Forecasted values were calculated for each indicator (with gray color), while each indicator contributes to a single subdimension (column entitled “Indicators Contribution”). Each of the three DESI Use of Internet subdimensions was calculated as the weighted average of the normalized indicators. Finally, the DESI “Use of Internet dimension” was calculated as the weighted average of the three subdimensions: (a) Internet use (25%), (b) Activities online (50%) and (c) Transactions (25%).
The timeline chart (Figure 9) depicts the DESI Use of Internet dimension for Greece and the EU-28. The calculations show that Greece is converging on and will exceed the EU-28 average in 2030. It is the second dimension, after the Connectivity dimension, where a convergence is forecasted.
In this case, the forecast reveals a convergence in 2030, while the Connectivity dimension had a timeline of convergence around 2026. This delay can be explained as a result of the small penetration of online services and use of internet in general for business and professional purposes. Motives could create a demand boost, leading to a faster convergence degree. At the current point, coming closer to the EU-28 average is mainly a result of the use of the internet for entertainment, news and social networks.

4.4. Integration of Digital Technology

The Integration of Digital Technology dimension measures the digitization of businesses and e-commerce. This dimension is mainly addressed for businesses, proposing that the adoption of digital technologies can enhance efficiency and reduce costs. Moreover, digital technologies are one of the most important means to engage customers with brands and businesses, while sales via the internet can expand businesses’ boundaries to the global markets.
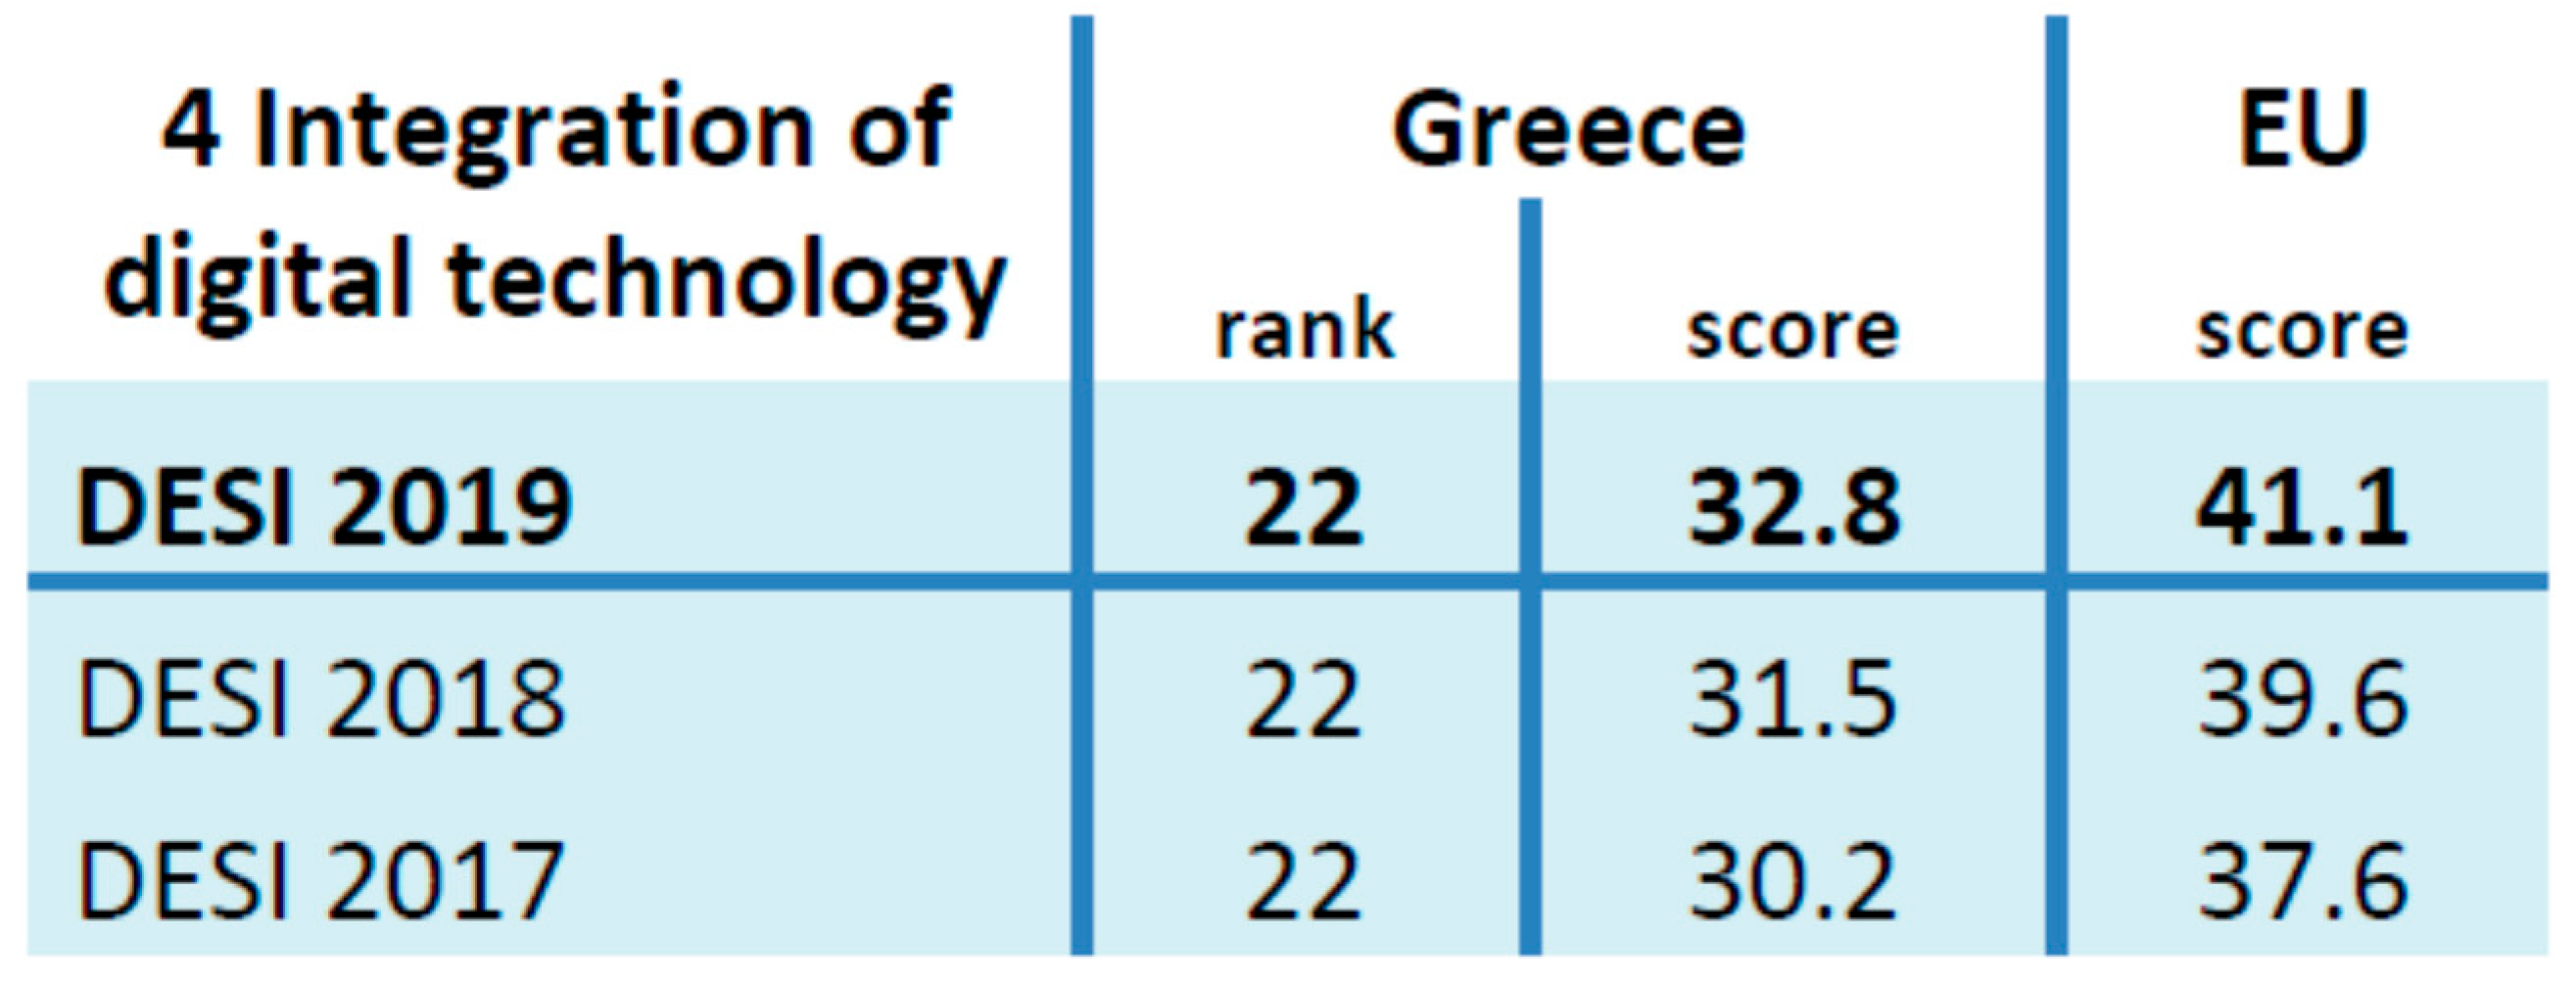
Greece is ranked 22nd among the EU-28 (Figure 10), which is the best rank among all five DESI dimensions. Regardless of this rank, its score is well below the European average, while the total rank remains the same for the last three years. The progress achieved can be characterized as marginal and that explains the reason why the rank is unchanged.
Electronic information sharing, social media and big data are the three indicators where Greece is near or above the EU-28 average. On the other hand, significant delays exist in terms of cloud computing, where the national scores are that only 11% of Greek SMEs sell online and 7% sell online cross-border, while at the same time, the European average is 17% and 8%, respectively.
Even though the country is not ranked among the last few EU member states, the scores achieved should trouble decision makers. The results indicate that no significant improvement is taking place, even though the economic crisis should have enhanced the use of digital technologies as a means to improve business efficiency and to expand commercial borders. Figure 11 provides an overview of the country’s rank among the EU-28.
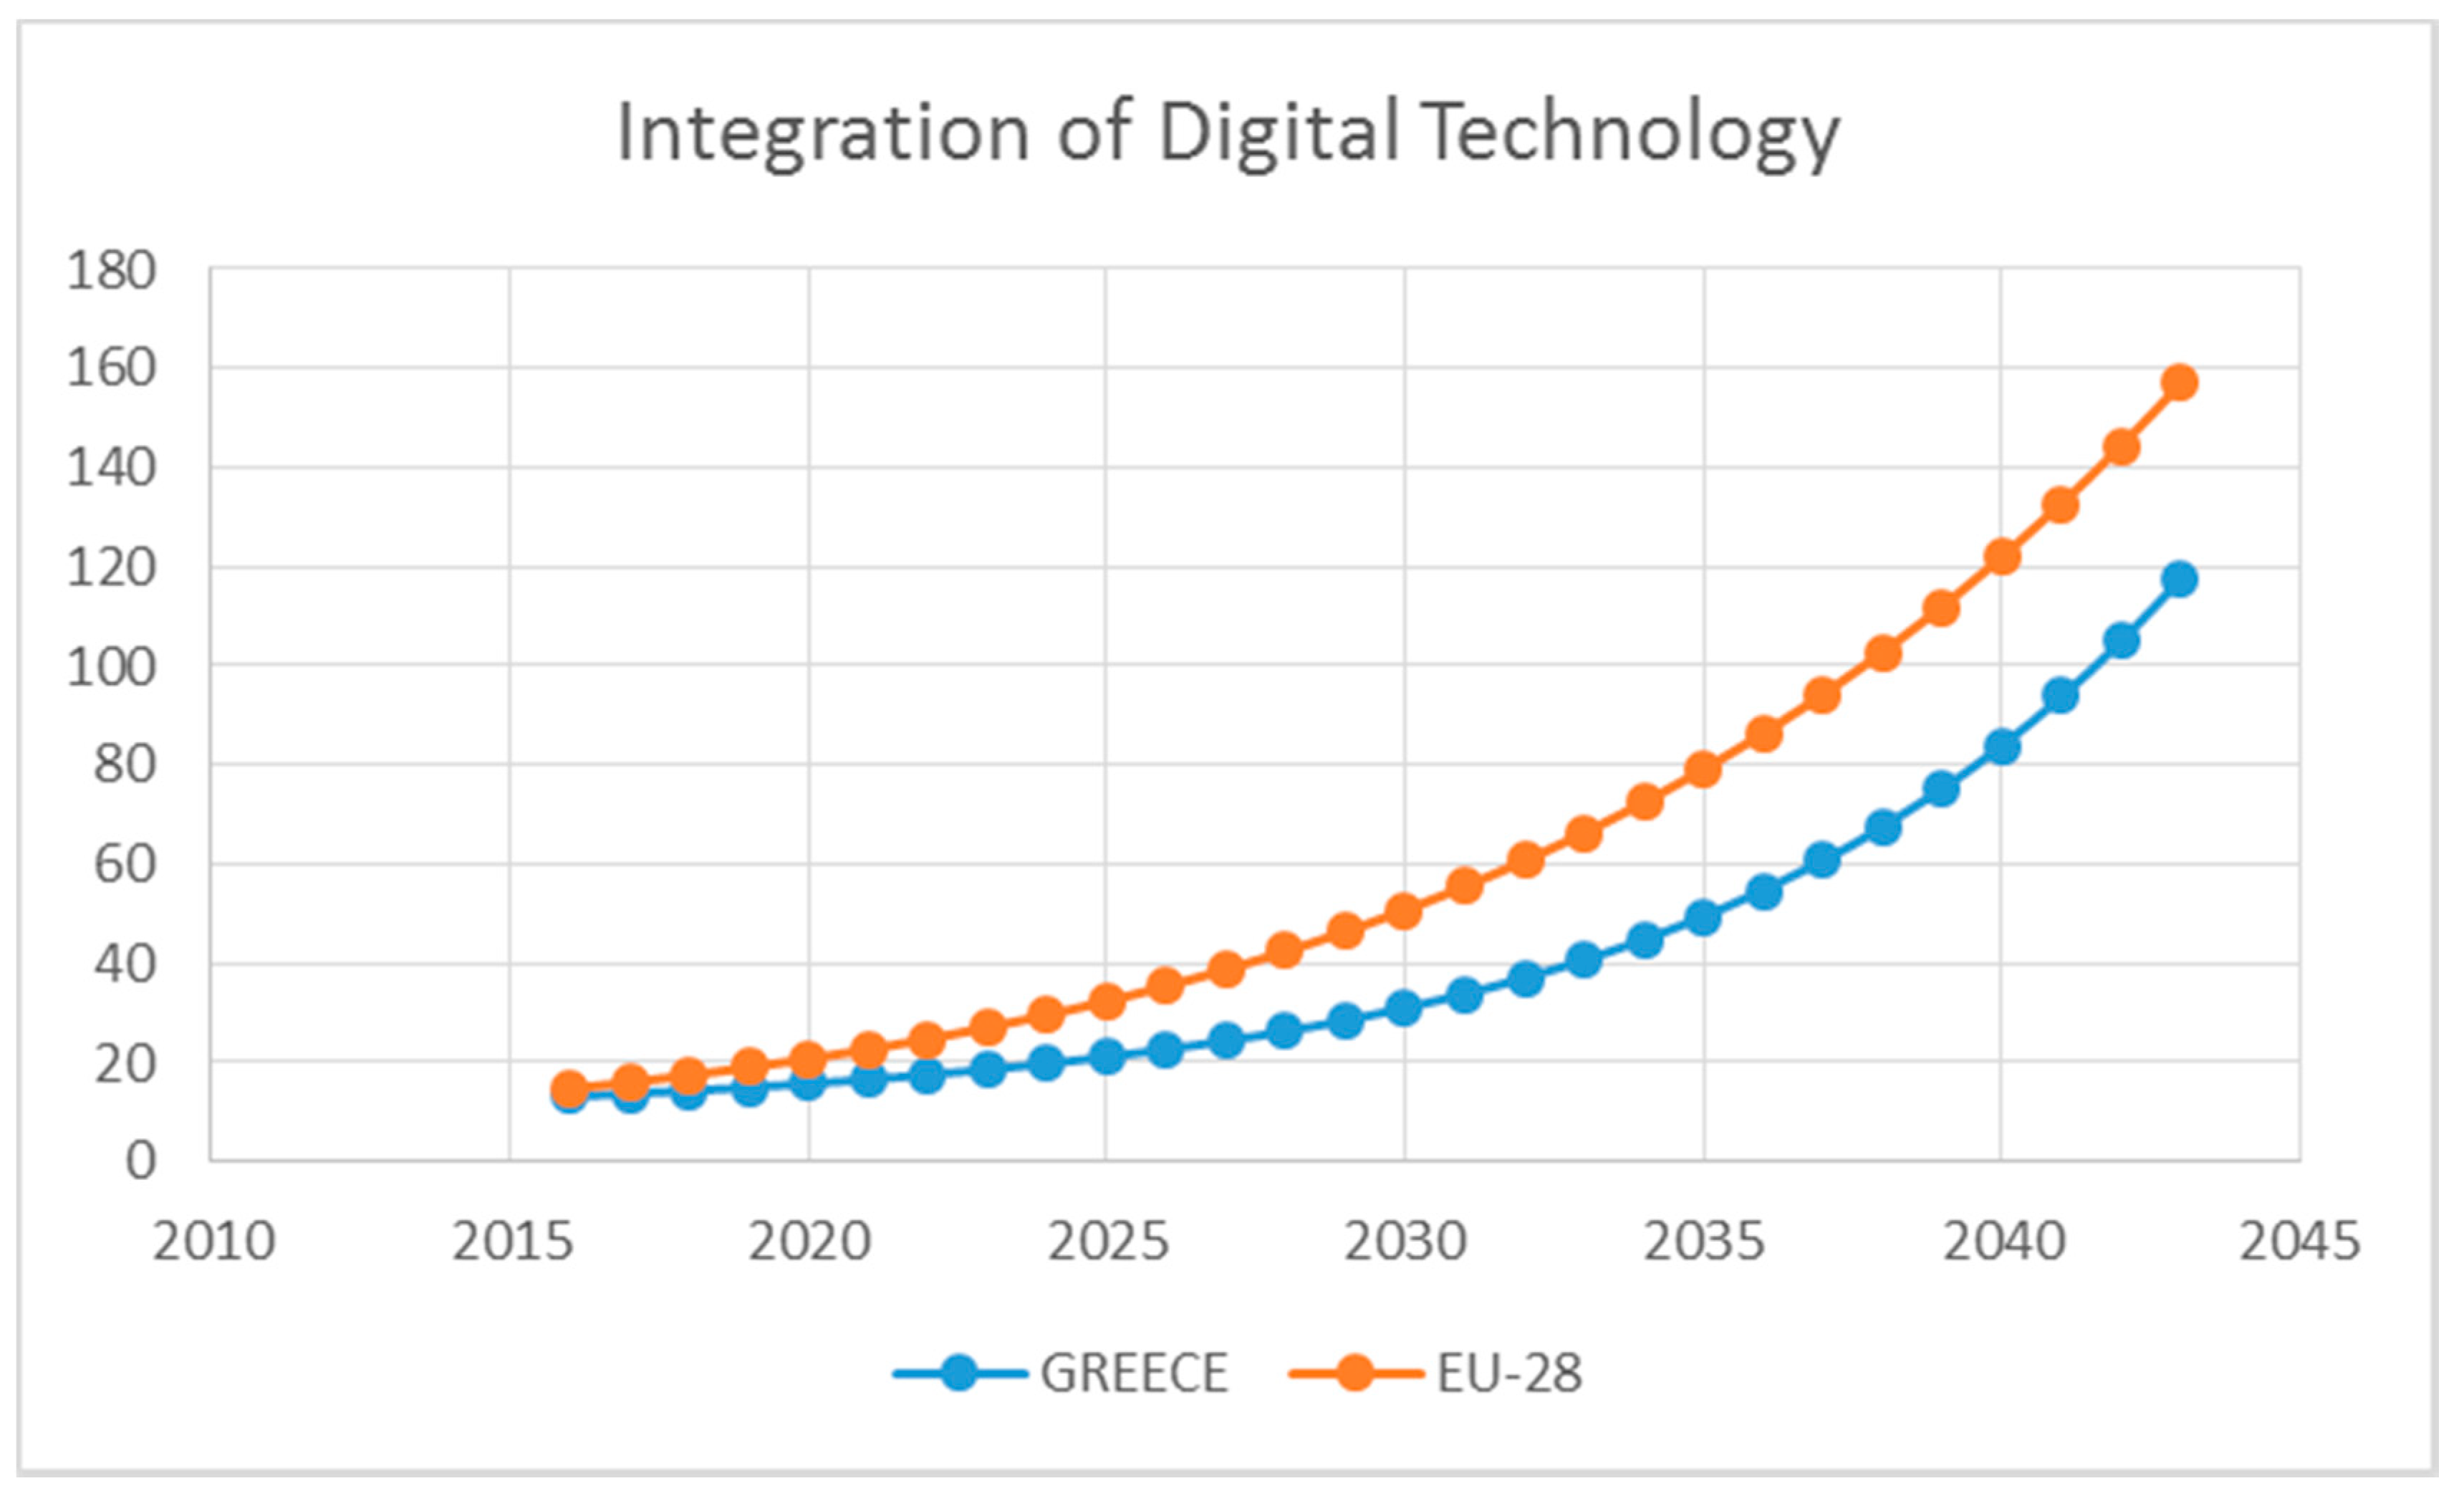
Taking into account the progress and data values during the years 2016–2018, the forecasting techniques were applied for the values that can be forecasted for Greece and the EU-28 (gray rows in Table 5). The rest of the values regarding indicators (4a3—Big data, 4b2—E-commerce turnover) remain constant. Forecasted values were calculated for each indicator (with gray color), while each indicator contributes to a single subdimension (column entitled “Indicators Contribution”). Each of the two DESI Integration of Digital Technologies subdimensions was calculated as the weighted average of the normalized indicators. Finally, DESI “Integration of Digital Technologies” was calculated as the weighted average of the two subdimensions: (a) Business digitization (60%) and (b) E-commerce (40%).
The chart (Figure 12) graphically shows the DESI Integration of Digital Technology dimension for Greece and the EU-28. Although, initially the values of Greece and the EU-28 appeared to start from a similar point, over time a divergence appears, while after 2035 a consolidated and unchanged difference between Greece’s score and the EU-28 average seems to exist.

4.5. Digital Public Services

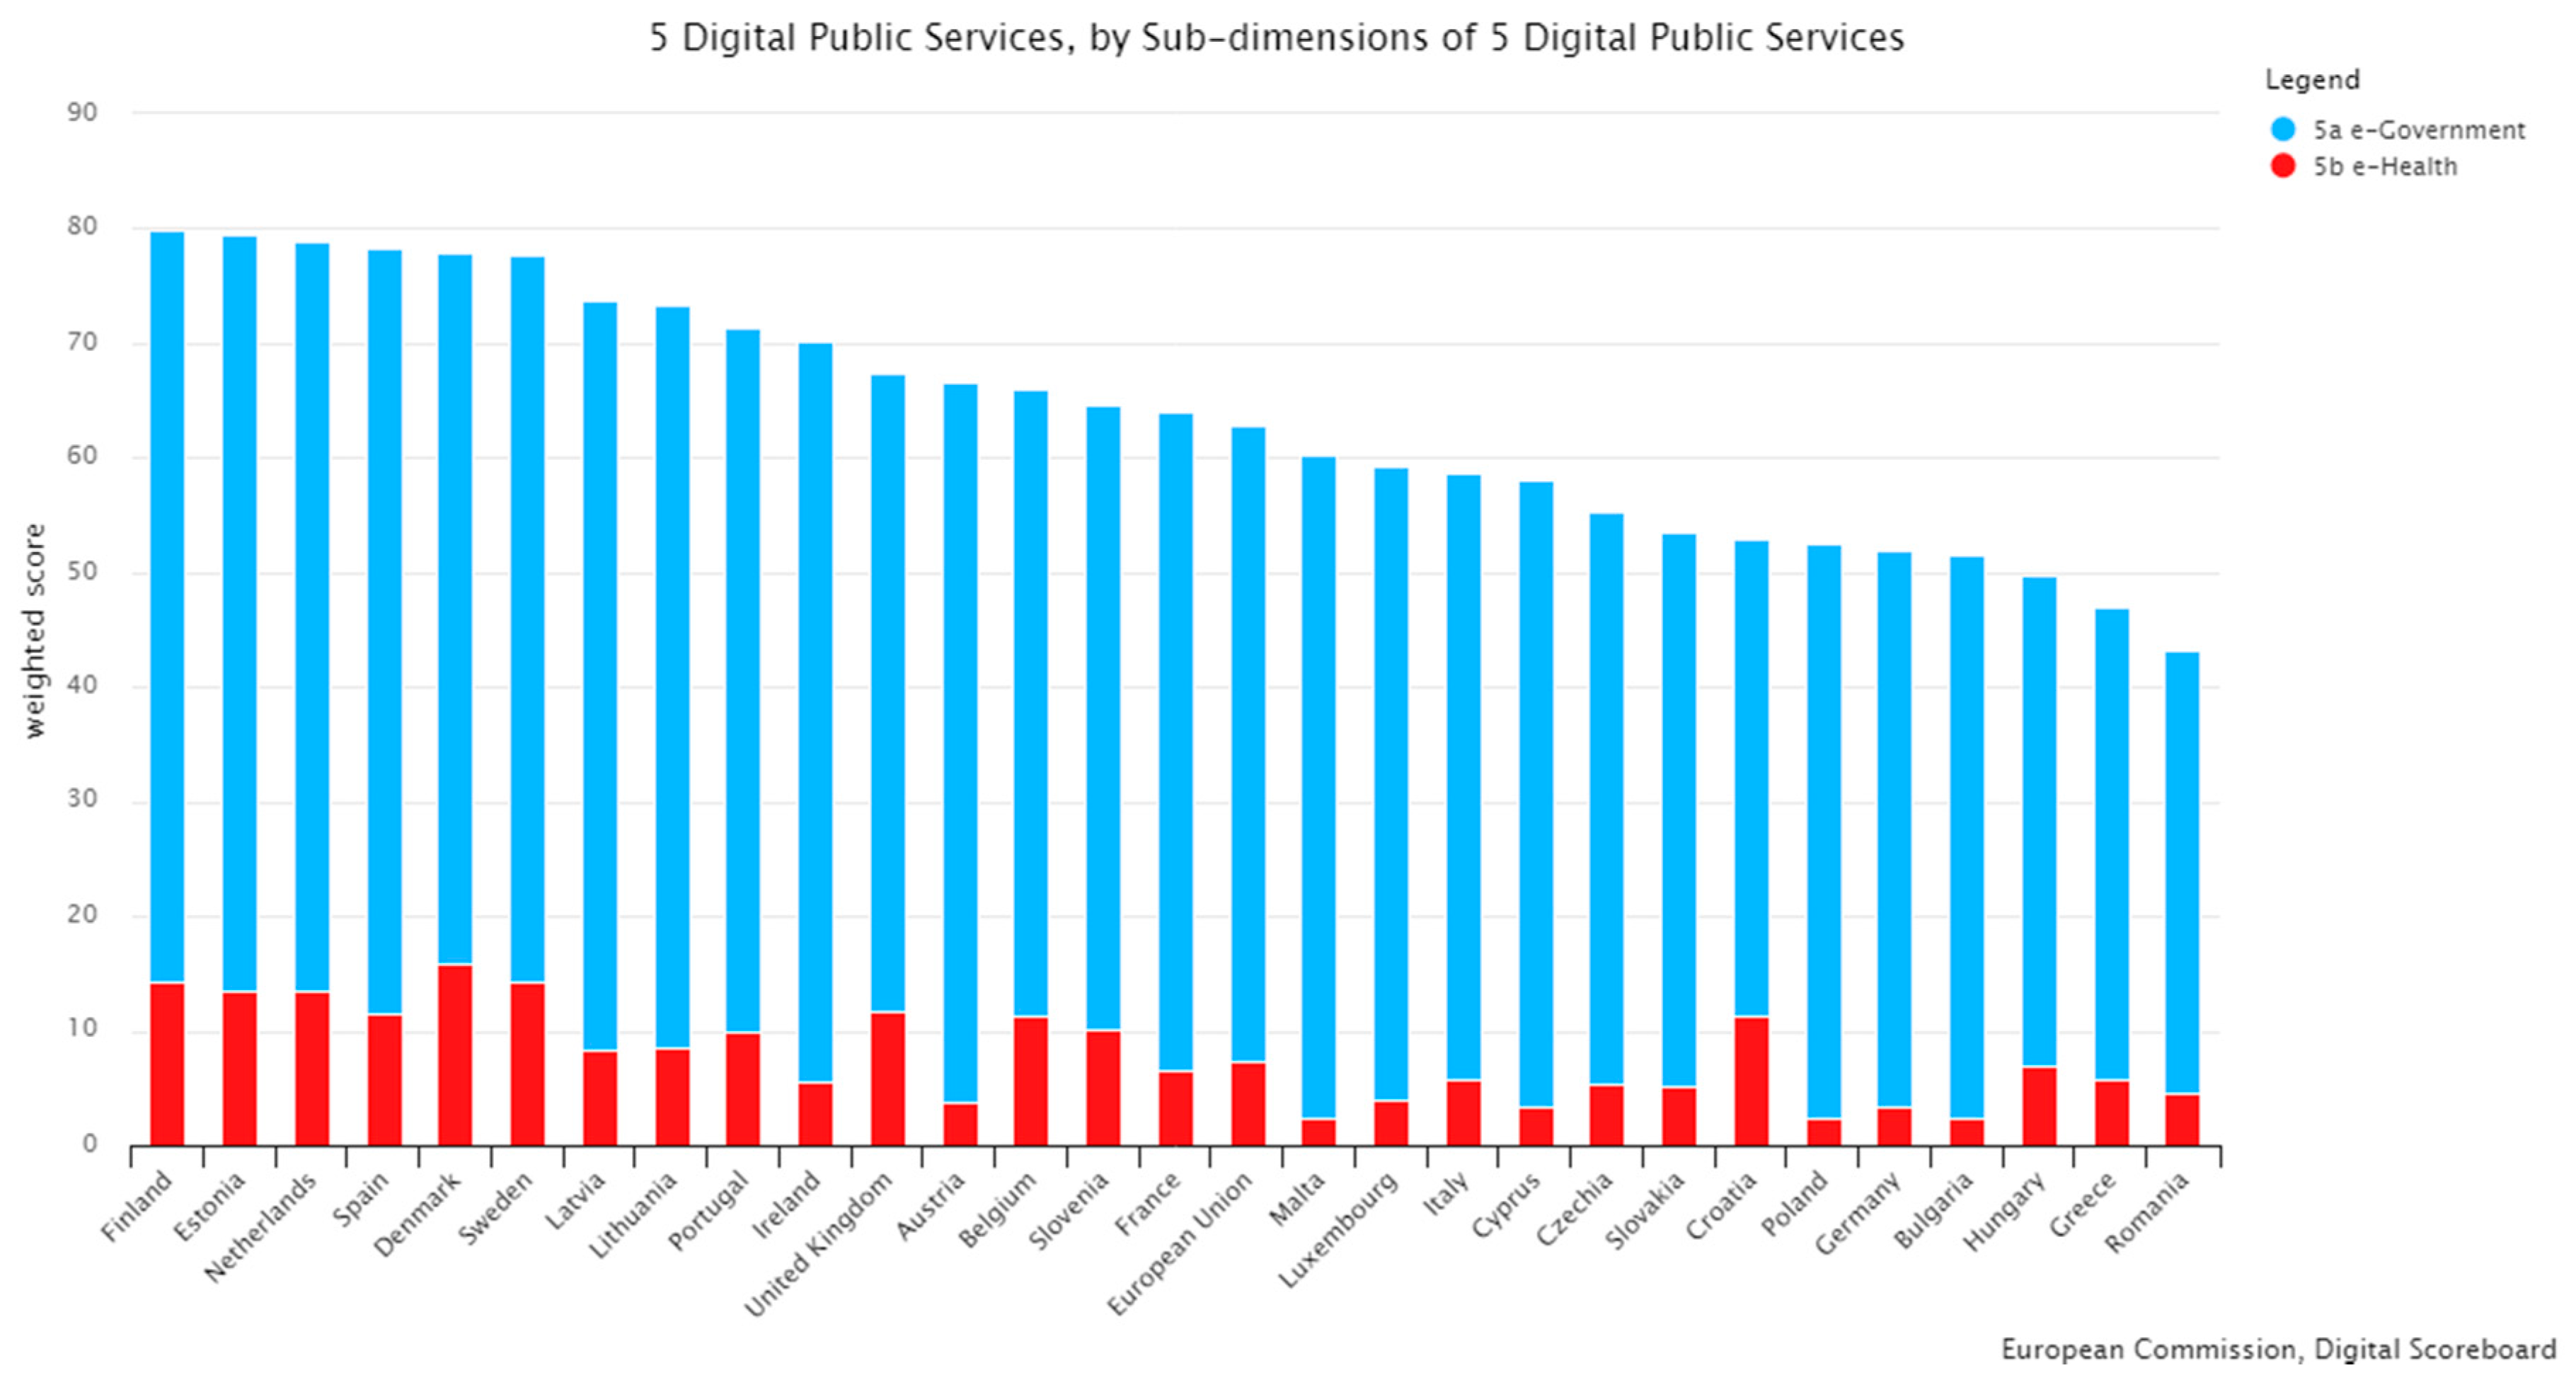
The final dimension is Digital Public Services, which measures the digitization of public services, focusing on e-Government and e-Health. The importance of this dimension lies in the fact that digitized public services can lead to efficiency gains for public administration, citizens and businesses alike. For one more time, Greece is ranked in the last positions among the EU-28, but a significant progress has been achieved in the dimension’s score compared with 2018. Greece’s score rose by 7.4 points in 2018, while the average EU-28 increase, over the same period, was only 5 points (Figure 13).
The results indicate that only 36% of internet users are actually using any e-government service, against an EU-wide average of 64%. Greece has made a significant advance as far as pre-filled forms are concerned, while it exceeds the EU-28 average regarding open data. On the other hand, there are significant delays regarding digital public services for businesses and the whole e-Health subdimension (Figure 14).
Taking into consideration the progress and data values during the years 2014–2016, the forecasting techniques were applied for the values that can be forecasted for Greece and the EU-28 (gray row in Table 6). The rest of the values remain constant, which is a small disadvantage regarding the forecast of the proposed dimension.
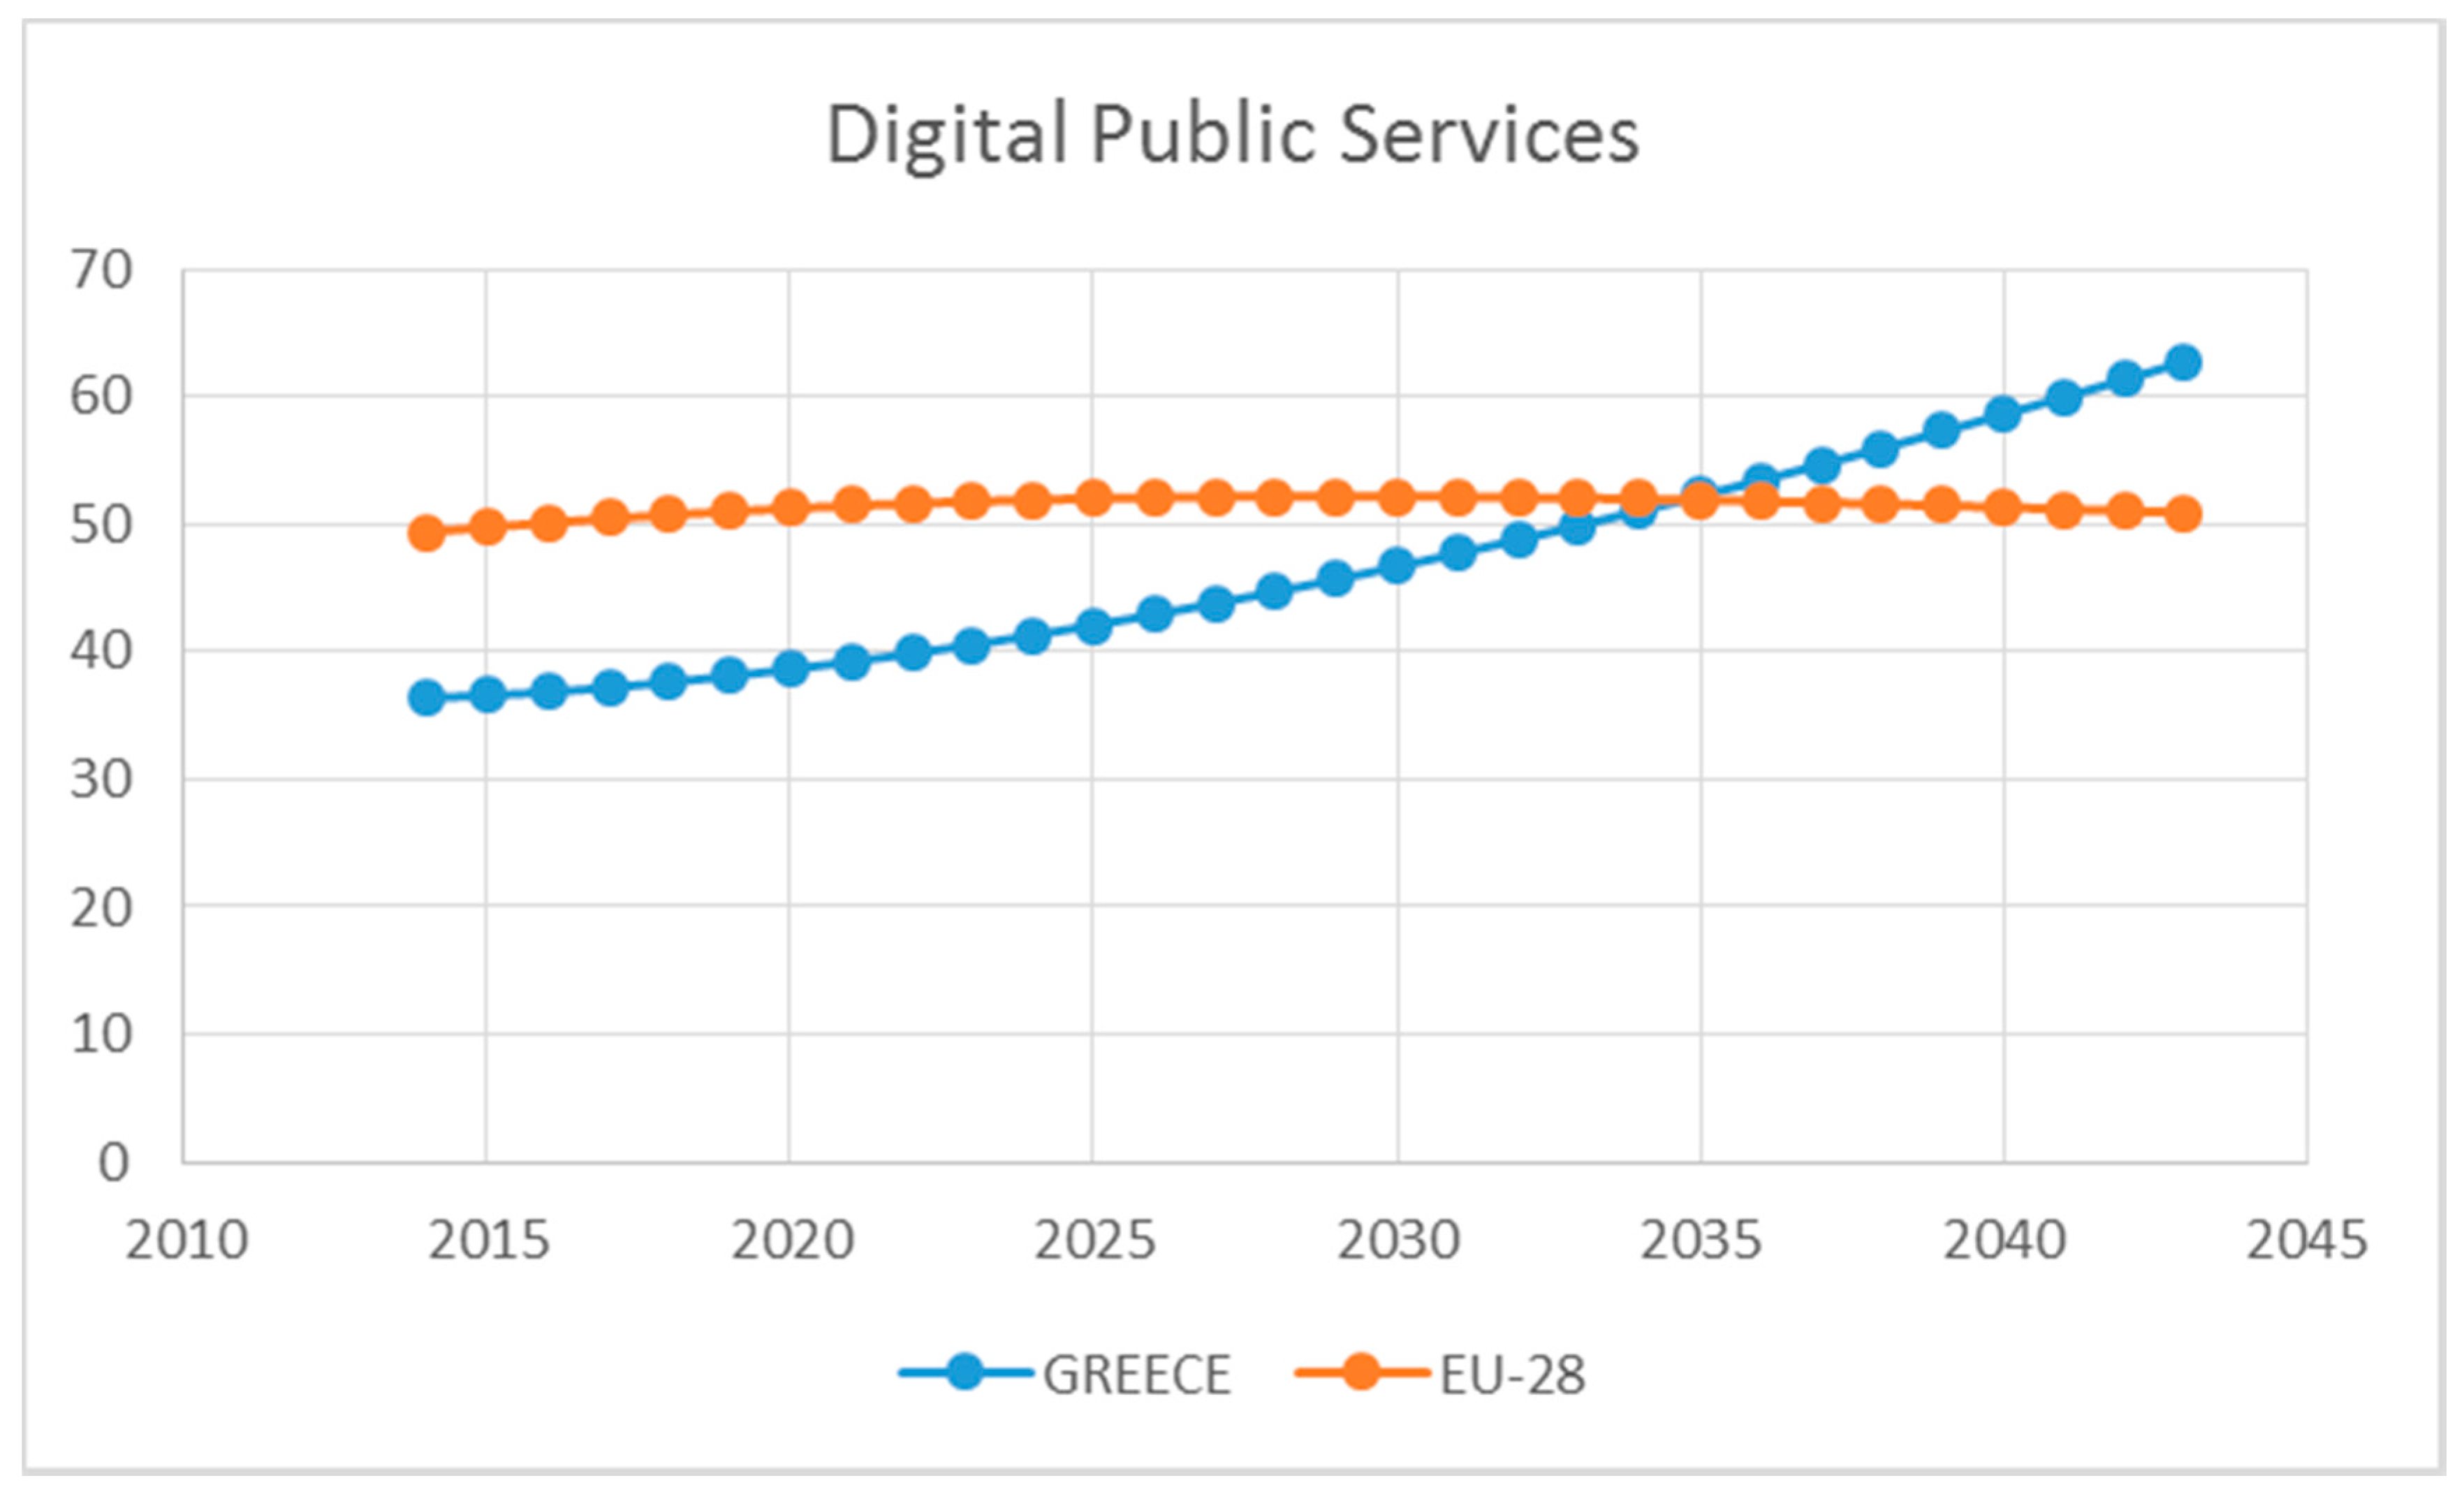
The chart (Figure 15) graphically shows the DESI Digital Public Services dimension for Greece and the EU-28. The calculations show that Greece is converging on the average of the EU member states and will exceed it in 2035.

4.6. DESI Overall Index

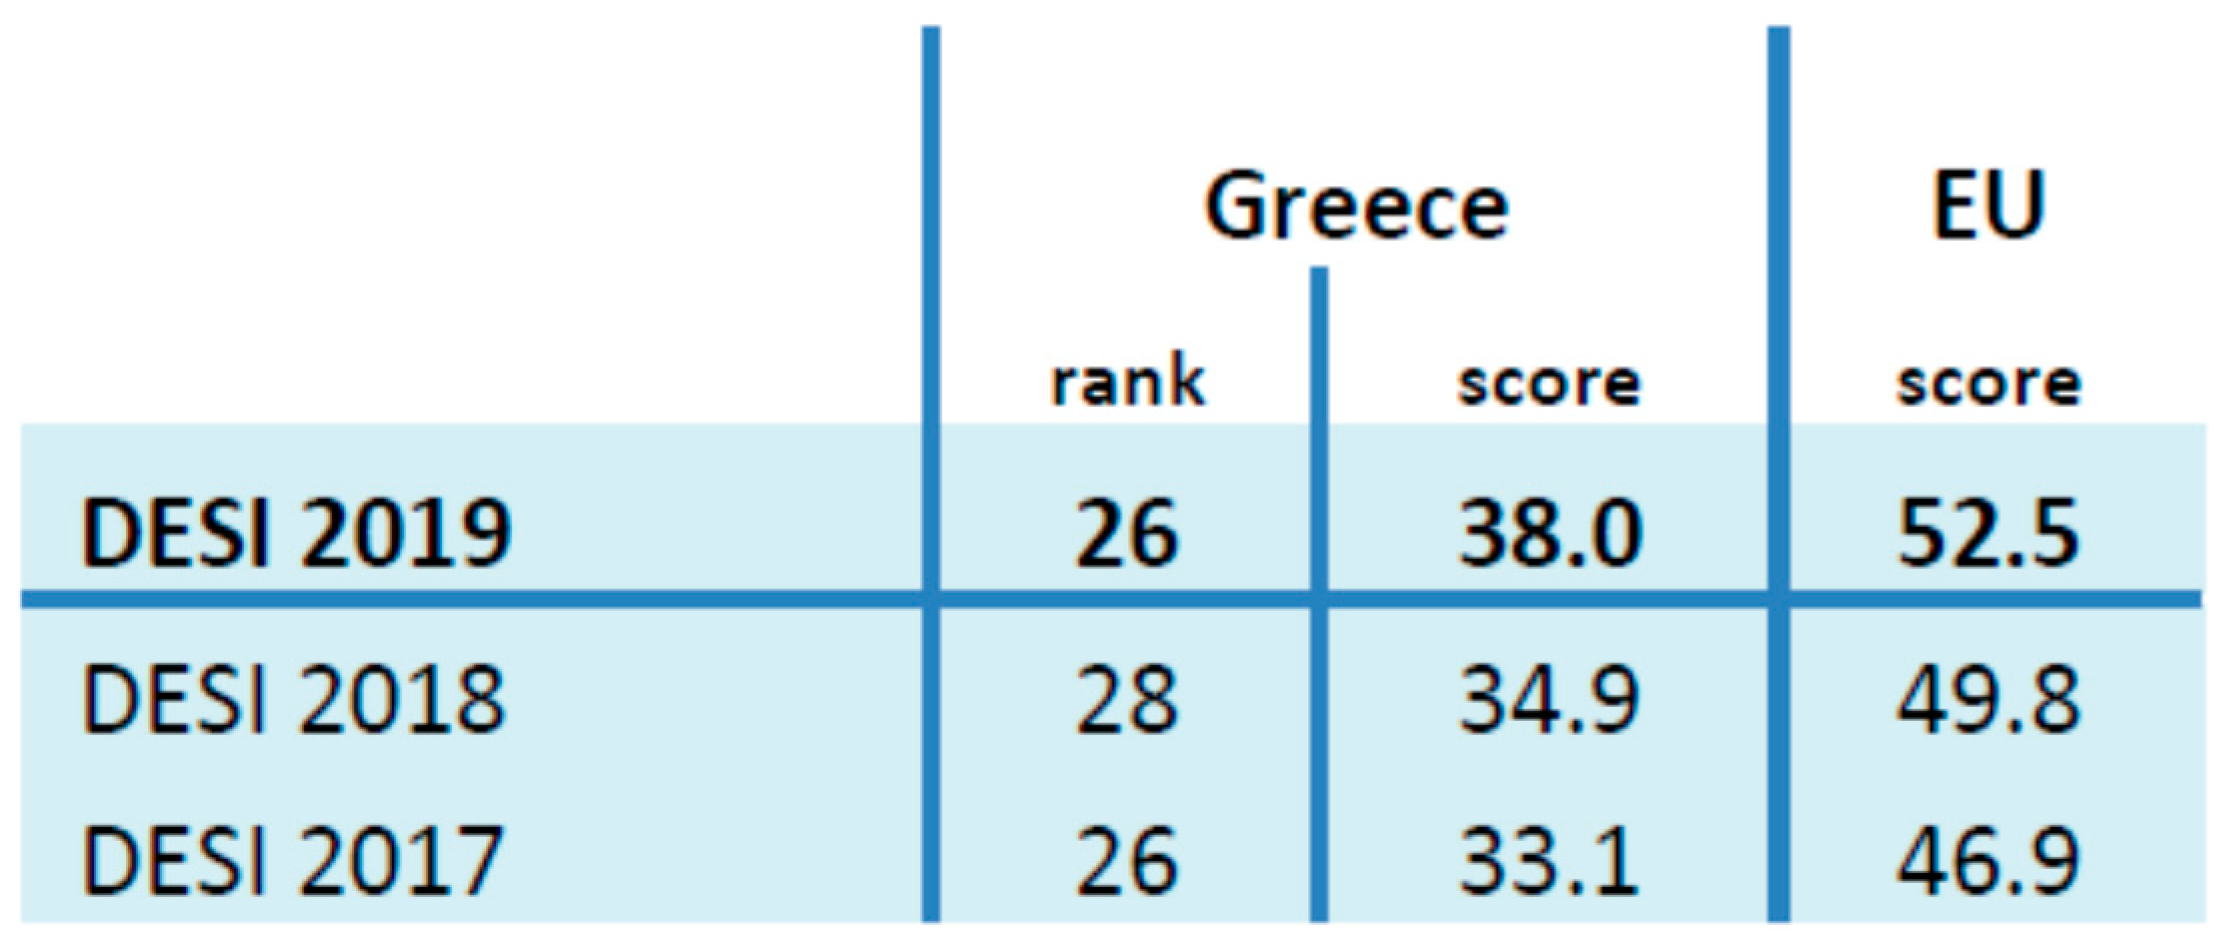
The current section presents the overall DESI index and how all five above-mentioned dimensions lead to the final scoreboard. Figure 16 reveals the country’s ranking, which has varied between 26th and 28th position in the last three years. Currently (data reflecting 2019), Greece is ranked 26th among the EU-28, having progressed slightly higher than the EU average (3.1 degrees, while the EU average is 2.7 degrees).
The improvement of its score is due to an enhanced performance in some of the DESI dimensions measured, mainly Connectivity and Use of Internet. It should be taken into account that even in these dimensions, there are important issues to be resolved. For example, in Connectivity, the transition to fast and ultrafast broadband is much slower in Greece than in the rest of Europe. 5G implementation is expected to lead to further improvement and can become a demand-driver.
Use of Internet is rather expanded, but this reflects mainly Greeks as individuals that use the internet for entertainment (news, video calls, social media, etc.). At the business and professional levels, motives should be provided, and much progress should be achieved in the next years, in order to follow the EU average. Despite these weaknesses, these two dimensions are leading to convergence with the EU-28 average.
At the same time, there have been dimensions where only a marginal increase was reported, such as Human Capital and the supply side of Digital Public Services. For the latter, even if there has been an increase of 7.4 points, much work should be done from the government’s point of view in order to enlarge and deepen the use of public internet services among businesses. Human Capital is the dimension where most effort should be concentrated while the most important divergencies with the EU average occur. Especially as far as ICT specialists are concerned, the country seems to be weakened, from emigration and a lack of expertise, which could enhance the efficiency of all national economic aspects.
The above-mentioned situation led Greece to be ranked among the last positions of the DESI index, with an average score of under 40 degrees, while the only other countries with a score under 40 are Romania and Bulgaria. Figure 17 describes that situation.
As far as the DESI overall index forecast is concerned, this was calculated as the weighted average of the five main DESI dimensions. The overall forecast was based on the forecasts conducted for the five dimensions, while its dimension contributions to the final results were as follows:
  • Connectivity (25%);
  • Human Capital (25%);
  • Use of Internet (15%);
  • Integration of Digital Technology (20%);
  • Digital Public Services (15%).
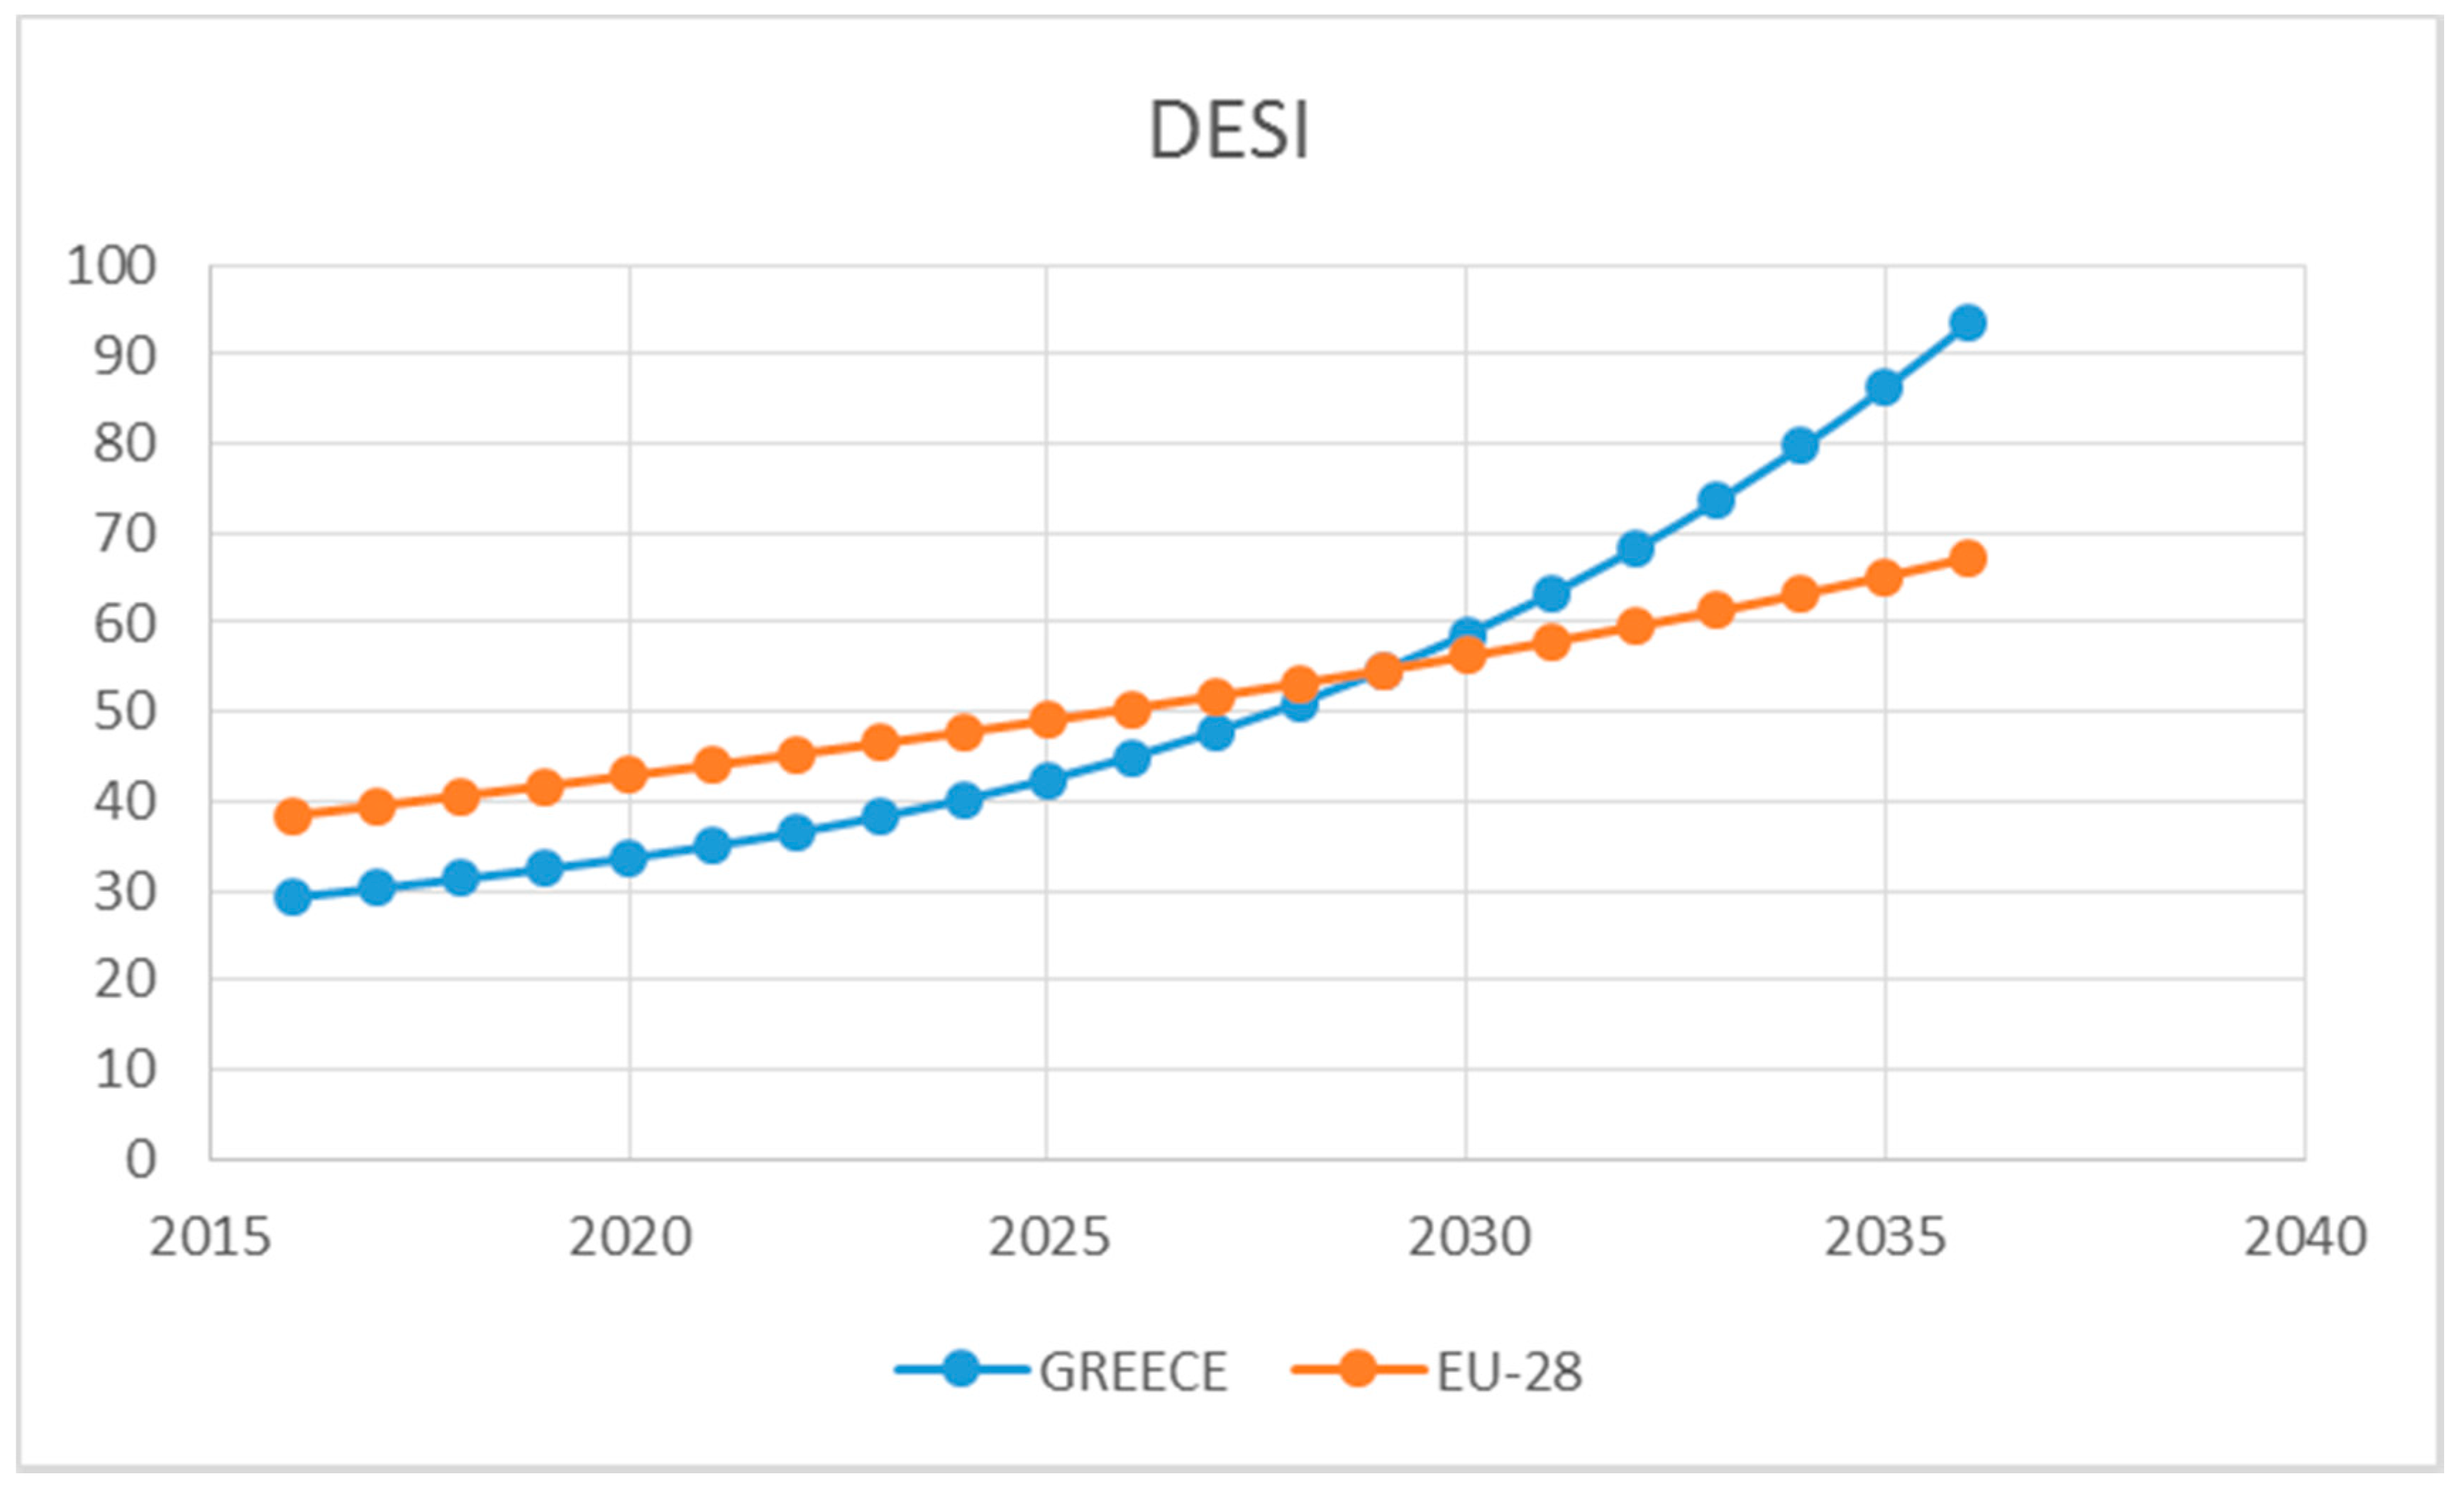
The overall results (Figure 18) indicate that a convergence is possible after 2029–2030, taking into account that some indicators were used as constant values and that the rest of the EU-28 member states will follow the progress as it is forecasted. Any boost of the demand or supply side can differentiate the proposed results.
The forecast incorporates the fact that Greece, from a regulatory and government’s perspective, has spotted weaknesses and measures that have been adopted over the last three years. It should be taken into account that only recently the country has updated its national broadband plan, while the Greek state has declared as its first priority the digitization of public services and the expansion of services developed for businesses and individuals.
The proposed results are consistent with the results of research conducted with similar indexes (Chakravorti and Chaturvedi 2017). Taking a step back, the “Digital Planet 2017” report (Chakravorti and Chaturvedi 2017) estimates for a series of countries (including Greece) the current state of digitalization, as well as the pace of digitalization over time (growth rate for the period 2008–2015). Greece is clustered among countries that face significant challenges as a result of the low state of digitization, coming from both the demand side (consumer of internet services) and the supply side (institutional and governmental constraints).
Moreover, other researchers used DESI and similar indexes in order to estimate digital competitiveness and its relationship with (a) the e-government process in Romania (Lixăndroiu 2018), (b) the digital transformation of the Croatian economy compared with EU member-states (Jurčević et al. 2020), (c) society’s sustainable development (Jovanović et al. 2018) and (d) digital skills and competencies of EU-28 human capital (Folea 2018). The current study indicates that a composite index, such as the DESI index, can be used as a forecast means, providing significant results. The DESI index was supported with data from the Gompertz II model, which was used to forecast the diffusion of digital competitiveness and its various dimensions for Greece and the EU-28 member-states.
According to the forecast results, Greece is converging with the rest of the EU member-states even though it seems that a lot of adjustments are needed in order to facilitate and to speed-up the whole procedure. The forecast proposed that at least ten (10) more years are needed but under a “ceteris paribus” condition. This condition indicates that in order to converge, Greece should act proactively and be ready to adopt policies that can further enhance digital competitiveness and Industry 4.0’s framework. The analysis conducted follows similar studies where the digital economy phenomenon was analyzed at the regional level (Balcerzak and Pietrzak 2017).
Moreover, the methodology used estimated the various dimensions of digital competitiveness performed for the under-evaluated country. The aim was to spot the areas where more effort is needed in order to improve the national effectiveness of the digital economy, as a condition for keeping international competitiveness. The results are supplementary of the findings of research conducted for European Union economies (Simionescu et al. 2017). Greece has gained much from its improved position in the DESI index, as a result of the development in “Connectivity”, while this dimension is the most possible to converge with the EU-28 in 2026.
“Use of Internet” is the second dimension where convergence might be achieved relatively soon, namely the year 2030. This expected convergence is mainly provoked by the high degree of the use of the internet at a societal level rather than at a business level. Even though this dimension is converging, the authors’ opinion is that more emphasis should be put on achieving better results at the business level, as a key driver for deepening national digital competitiveness as a whole. The results reflect previous research on differences in the digitalization levels of various countries in order to reveal the global digital divide, where internet use is associated with mobile telephony and PC usage as a pattern of digitalization (Billon et al. 2010).
The area where divergence (instead of convergence) occurred is “Human Capital”. Especially in the field of ICT specialists and graduates, the country seems to face difficulties mainly coming from the fact that after ten (10) years of an economic crisis, a large proportion of youngsters emigrated. This trend is more severe in scientific fields where those who are highly educated such as ICT graduates, are referred to as the “brain drain”, while policies that have evolved seem not to be as effective as needed. The results are in coordination with similar research (Katsikas and Gritzalis 2017) related to the digital literacy of adults in Greece.
The last two dimensions, namely “Integration of Digital Technology” and “Digital Public Services”, are keeping a stable pace. Unable to face current needs and to become a source of competitive advantage, “Integration of Digital Technology” is neither converging, nor diverging. It just follows the rest of the EU-28’s pace, without any signs that the existing digital gap could be reduced. As far as “Digital Public Services” is concerned, there is a convergence in the year 2035, though the proposed period is rather long, reflecting the slow progress achieved. The reasons why delays exist in Greece regarding the two above-mentioned dimensions of the DESI index can be found in several sources, while a recent research by Katsikas and Gritzalis (Katsikas and Gritzalis 2017) reflects the results presented in the current paper.
In order to improve digital competitiveness, policy strategies should be implemented that might lead digital diffusion to a boost. The areas where such policies are more needed include the demand side and more precisely education and digital skills improvements. Human capital seems to be a critical factor for digital competitiveness, while digital literacy can facilitate a more productive use of the internet as well. Moreover, e-commerce should be encouraged for both supply and demand side initiatives as a means to encourage digital diffusion. Some indicative policies should include: secure environments, skills development/education for e-commerce transactions among citizens, motives for businesses to favor e-commerce and new services from telecom operators to help SMEs to implement e-commerce applications.
Most significantly, the public sector should act in favor of e-services: e-government, e-health, e-learning and e-business. Public authorities should develop and implement large-scale applications, in order to develop a social culture favoring the use of digital means.
5. Conclusions

The current study put emphasis on comparing the digital economy performance of Greece with the EU-28 member states. Moreover, a forecast procedure was followed in order to predict future trends. Comparisons and a forecast were applied in the five basic components that lead to the DESI index, namely: Connectivity, Human Capital, Use of Internet Services, Integration of Digital Technology and Digital Public Services. A forecast was applied only when (a) the data values are percentages of the total population or specific groups of the population and (b) the data cover a period of at least three years. In all other cases, constant prices were used.
The existing situation indicates that Greece has a slow grow-up, ranked 26th out of the EU-28 member states in the field of the digital economy. Results vary as far as each DESI dimension is concerned, while the most important findings are:
  • The area where Greece has gained the most is “Connectivity”. The results indicate that in 2026, convergence with the EU-28 will most probably be achieved.
  • The area where divergence (instead of convergence) occurred is “Human Capital”.
  • “Use of Internet” is the second dimension where convergence might be achieved relatively soon, namely the year 2030.
  • “Integration of Digital Technology” is stable, following the rest of the EU-28’s pace.
  • “Digital Public Services” is making slow progress, while a convergence will exist during the year 2035.
The results presented are consistent with the results of previous studies, which cluster Greece among countries that face significant challenges as a result of the low state of digitization, coming from both the demand side (consumer of internet services) and the offer side (institutional and governmental constraints) (Chakravorti and Chaturvedi 2017). Even though Greece seems to have achieved less than the rest of the EU-28 member states, the results coming from the proposed forecast indicate that at the end a convergence will occur. Studies from various fields are nowadays trying to research about convergencies and divergencies in the European Union (Kargas et al. 2020). The current research comes to contribute to this field, by revealing the aspects where more effort should be made in order to enhance digital competitiveness. The proposed results could be used by regulatory authorities and governmental institutions, as an indicator of expected results that will be achieved from the currently implemented policies.
The forecast derived from the DESI index is of high importance, firstly because the index itself has gained significant attention from European authorities and secondly because the proposed forecast methodology could be applied for a larger sample of countries, creating clusters of countries according to their (forecasted) scores. Limitations exist regarding the number of years the DESI index will exist for. Its relatively new implementation leads to small time series data samples, while its framework may face changes in the next year. Every new index tends to incorporate new elements by the years or even rejects values that previously were included. Moreover, using Gompertz II should be further used in larger data samples in order to evaluate its accuracy and sustainability.
As part of future research, the authors recommend the expansion of the analysis conducted per country in order to achieve a better understanding of the dynamics formulated between the EU-28 member states. Moreover, it would be valuable to cluster the EU-28 member states per digital competitiveness trend in order to understand the similarities and differences between digital economies. Even though such analysis exists for the regular EU-28 economies (Kargas et al. 2020), no such research exists for digital economies or digital competitiveness.

Author Contributions

Conceptualization, E.L. and A.K.; Methodology, E.L.; Formal Analysis, E.L. and A.K.; Investigation, E.L. and A.K.; Resources, E.L. and A.K.; Data Curation, E.L. and A.K.; Writing—Original Draft Preparation, E.L. and A.K.; Writing—Review & Editing, E.L., A.K. and D.V.; Supervision, D.V. All authors have read and agreed to the published version of the manuscript.

Funding

This research received no external funding.

Conflicts of Interest

The authors declare no conflict of interest.

Appendix A

Table A1. DESI Connectivity subdimensions.
Connectivity1a1 Fixed BB Coverage1a2 Fixed BB Take-Up1b2 Mobile BB Take-Up1c1 NGA Coverage1c2 Fast BB Take-Up1d2 Ultrafast BB Take-Up
DefinitionPercentage of households covered by broadband: xDSL, cable (basic and NGA), FTTP or WiMax networksPercentage of households subscribing to broadband: xDSL, cable (basic and NGA), FTTP or WiMax networksNumber of mobile data subscriptions per 100 people Percentage of households covered by broadband of at least 30 Mbps download. Considered technologies are FTTH, FTTB, Cable Docsis 3.0 and VDSLPercentage of households subscribing to broadband of at least 30 MbpsPercentage of households subscribing to broadband of at least 100 Mbps
Unit of measurePercentage of householdsPercentage of householdsNumber of subscriptions per 100 peoplePercentage of householdsPercentage of householdsPercentage of households
Table A2. DESI Human Capital subdimensions.
Human Capital2a1 at least Basic Digital Skills2a2 above Basic Digital Skills2b1 ICT Specialists
DefinitionPeople with “basic” or “above basic” digital skills in each of the following four dimensions: information, communication, problem solving and software for content creation (as measured by the number of activities carried out during the previous 3 months)People with “above basic” digital skills in each of the following four dimensions: information, communication, problem solving and software for content creation (as measured by the number of activities carried out during the previous 3 months)Employed ICT specialists. Broad definition based on the ISCO-08 classification and including jobs like ICT service managers, ICT professionals, ICT technicians, ICT installers and servicers
Unit of measurePercentage of individualsPercentage of individuals Percentage of total employment
Table A3. DESI Use of Internet subdimensions.
Use of Internet3a2 Internet Users3b1 News3b4 Video Calls3b5 Social Networks3b6 Professional Social Networks3c1 Banking3c2 Shopping
DefinitionPeople who use the internet at least once a weekPeople who used the internet to read online news sites, newspapers or news magazinesPeople who used the internet to make telephone or video calls (e.g., Skype)People who used the internet to participate in social networks (create user profile, post messages or other contributions)People who have used internet for participating in social or professional networksPeople who used the internet to use online bankingPeople who ordered goods or services online
Unit of measurePercentage of individualsPercentage of individuals who used internet in the last 3 monthsPercentage of individuals who used internet in the last 3 monthsPercentage of individuals who used internet in the last 3 monthsPercentage of individuals who used internet in the last 3 monthsPercentage of individuals who used internet in the last 3 monthsPercentage of individuals who used internet within the last year
Table A4. DESI Integration of Digital Technology subdimensions.
Integration of Digital Technology4a1 Electronic Information Sharing4a2 Social Media4a4 Cloud4b1 SMEs Selling Online4b3 Selling Online Cross-Border
DefinitionBusinesses who have used an ERP (enterprise resource planning) software package, to share information between different functional areas (e.g., accounting, planning, production, marketing)Businesses using two or more of the following social media: social networks, enterprise’s blog or microblog, multimedia content sharing websites, wiki-based knowledge-sharing tools. Businesses purchasing at least one of the following cloud computing services: hosting of the enterprise’s database, accounting software applications, CRM software, computing powerSMEs selling online (at least 1% of turnover) SMEs that carried out electronic sales to other EU countries
Unit of measurePercentage of enterprisesPercentage of enterprisesPercentage of enterprises Percentage of enterprisesPercentage of enterprises
Table A5. DESI Digital Public Services subdimensions.
Digital Public Services5a1 E-government Users
DefinitionPeople who sent filled forms to public authorities, over the internet, previous 12 months
Unit of measurePercentage of individuals who used internet (last year)

Appendix B

Table A6. EU-28 Gompertz II.
Connectivity1a1 Fixed BB Coverage1a2 Fixed BB Take-Up1b2 Mobile BB Take-Up1c1 NGA Coverage1c2 Fast BB Take-Up1d2 Ultrafast BB Take-Up
S256,595.69865,989.31622.97329.62467.18140.82
alpha7.148.710.951.003.223.86
beta0.000.000.230.080.110.19
SUM(DIFF^2)0.012.078.425.092.180.27
Time Period2014–20192014–20192014–20192014–20192014–20192014–2019
Human Capital2a1 At least Basic Digital Skills2a2 Above Basic Digital Skills2b1 ICT Specialists
S4769.6816,506.1416,975.84
alpha2.844.797.78
beta0.010.010.01
SUM(DIFF^2)0.152.470.01
Time Period2016–20182016–20182016–2018
Use of Internet3a2 Internet Users3b1 News3b4 Video Calls3b5 Social Networks3b6 Professional Social Networks3c1 Banking3c2 Shopping
S256592.36256,674.84483,589.59483,588.20483,795.52483,795.84483,795.84
alpha6.577.038.437.799.377.847.71
beta0.0040.010.010.010.010.010.01
SUM(DIFF^2)15.0364.91164.63105.0725.8015.3423.11
Time Period2014–20192014–20192014–20192014–20192014–20192014–20192014–2019
IDT4a1 Electronic Information Sharing4a2 Social Media4a4 Cloud4b1 SMEs Selling Online4b3 Selling Online Cross-Border
S256,596.70256,595.68256,595.69256,595.69256,595.69
alpha10.7211.2511.6311.3512.07
beta0.010.010.010.010.01
SUM(DIFF^2)0.050.060.020.000.00
Time Period2016–20182015–20182015–20192014–20172014–2018
Digital Public Services5a1 E-government Users
S594.53
alpha1.20
beta0.07
SUM(DIFF^2)252.33
Time Period2014–2019
Table A7. Greece Gompertz II.
Connectivity1a1 Fixed BB Coverage1a2 Fixed BB Take-Up1b2 Mobile BB Take-Up1c1 NGA Coverage1c2 Fast BB Take-Up1d2 Ultrafast BB Take-Up
S297.783.2939,312.882532.97225.09100.11
alpha4.290.469.477.879.3814.94
beta0.0010.370.020.020.070.06
SUM(DIFF^2)0.000.030.510.040.00060.00
Time Period2014–20192014–20192014–20192014–20192014–20192014–2019
Human capital2a1 At least Basic Digital Skills2a2 Above Basic Digital Skills2b1 ICT Specialists
S77.452.793.77
alpha2.810.774.57
beta0.010.490.02
SUM(DIFF^2)0.000.000.00
Time Period2016–20182016–20182016–2018
Use of Internet3a2 Internet Users3b1 News3b4 Video Calls3b5 Social Networks3b6 Professional Social Networks3c1 Banking3c2 Shopping
S8.346.7825,151.518.37100.03137.164.68
alpha0.410.589.350.955.585.150.82
beta0.230.430.010.140.010.050.19
SUM(DIFF^2)0.010.010.300.000.000.080.09
Time Period2014–20192014–20192014–20192014–20192014–20192014–20192014–2019
IDT4a1 Electronic Information Sharing4a2 Social Media4a4 Cloud4b1 SMEs Selling Online4b3 Selling Online Cross-Border
S256,595.71256,595.76256,595.94256,595.79256,595.69
alpha13.7414.5415.8915.3511.63
beta0.000.000.010.010.01
SUM(DIFF^2)0.000.000.000.000.02
Time Period2016–20182015–20182015–20192014–20172014–2018
Digital Public Services5a1 E-government Users
S80.34
alpha3.53
beta0.03
SUM(DIFF^2)0.00
Time Period2014–2019

Appendix C. (Forecasting Values for the EU-28 Connectivity Dimension)

Figure A1. EU Mobile BB Take-up forecast.
Economies 08 00085 g0a1
Figure A2. EU NGA Coverage forecast.
Economies 08 00085 g0a2
Figure A3. GR Mobile BB Take-up forecast.
Economies 08 00085 g0a3
Figure A4. GR NGA Coverage forecast.
Economies 08 00085 g0a4
Figure A5. EU At least Basic Digital Skills forecast.
Economies 08 00085 g0a5
Figure A6. EU ICT Specialists forecast.
Economies 08 00085 g0a6
Figure A7. GR At least Basic Digital Skills forecast.
Economies 08 00085 g0a7
Figure A8. GR ICT Specialists forecast.
Economies 08 00085 g0a8

References

  1. Aiginger, Karl, and Johanna Vogel. 2015. Competitiveness: From a Misleading Concept to a Strategy Supporting Beyond GDP Goals. Competitiveness Review 25: 497–523. [Google Scholar] [CrossRef] [Green Version]
  2. Aiginger, Karl, Susanne Bärenthaler-Sieber, and Johanna Vogel. 2013. Competitiveness under New Perspectives. WWWforEurope Working Paper No. 44. WIFO Studies. Available online: https://ideas.repec.org/b/wfo/wstudy/47019.html (accessed on 24 September 2020).
  3. Aschhoff, Birgit, Dirk Crass, Katrin Cremers, Christoph Grimpe, Christian Rammer, Felix Brandes, Fernando Diaz-Lopez, Rosalinde Klein Woolthuis, Michael Mayer, and Carlos Montalvo. 2010. European Competitiveness in Key Enabling Technologies. Available online: https://nanonet.pl/wp-content/uploads/2018/02/European-Competitiveness-in-Key-Enabling-Technologies.pdf (accessed on 24 September 2020).
  4. Balacescu, Aniela, and Ana Gabriela Babucea. 2018. Use of the Internet By the Romanian Citizens. an Empirical Study of Digital Gaps Between Regions. Analele Universităţii Constantin Brâncuşi Din Târgu Jiu: Seria Economie 1: 81–88. [Google Scholar]
  5. Balcerzak, Adam P. 2016. Technological Potential of European Economy. Proposition of Measurement with Application of Multiple Criteria Decision Analysis. Montenegrin Journal of Economics 12: 7–17. Available online: https://ideas.repec.org/a/mje/mjejnl/v12y2016i3p7-17.html (accessed on 24 September 2020). [CrossRef] [PubMed]
  6. Balcerzak, Adam P., and Bernard Michał Pietrzak. 2017. Digital Economy in Visegrad Countries. Multiple-Criteria Decision Analysis at Regional Level in The Years 2012 and 2015. Journal of Competitiveness 9: 5–18. [Google Scholar] [CrossRef] [Green Version]
  7. Billon, Margarita, Fernando Lera-Lopez, and Rocío Marco. 2010. Differences in Digitalization Levels: A Multivariate Analysis Studying the Global Digital Divide. Review of World Economics 146: 39–73. [Google Scholar] [CrossRef] [Green Version]
  8. Burlacioiu, Cristina, Irina Moise, Cristina Boboc, and Elena Oana Croitoru. 2018. Digital Technology Trend in Romania and its Impact on the Young Segment. Paper presented at 12th International Management Conference “Management Perspectives in the Digital Era”, Bucharest, Romania, November 1–2; pp. 824–35. [Google Scholar]
  9. Česnauskė, Jevgenija. 2019. Digital Economy and Society: Baltic States in the EU Context. Economics and Culture 16: 80–90. [Google Scholar] [CrossRef] [Green Version]
  10. Chaaben, Nahla, and Faysal Mansouri. 2017. Digital Economic and Social Evolution of Tunisia. Paper presented at Management International Conference, Venice, Italy, May 24; pp. 393–404. [Google Scholar]
  11. Chakravorti, Bhaskar, and Ravi Shankar Chaturvedi. 2017. Digital Planet 2017: How Competitiveness and Trust in Digital Economies Vary Across the World. Available online: https://www.betterthancash.org/tools-research/resources/digital-planet-2017-how-competitiveness-and-trust-in-digital-economies-vary-across-the-world (accessed on 24 September 2020).
  12. Chiappini, Raphaël. 2014. Persistence vs. Mobility in Industrial and Technological Specialisations: Evidence from 11 Euro Area Countries. Journal of Evolutionary Economics 24: 159–87. [Google Scholar] [CrossRef]
  13. Čik, Višnja Križanović, Drago Žagar, and Kristijan Kordić. 2016. Comparison of Models for Prediction and Forecast of Broadband Services Adoption. In 2016 39th International Conference on Telecommunications and Signal Processing, TSP 2016. Vienna: Institute of Electrical and Electronics Engineers Inc., pp. 33–39. [Google Scholar] [CrossRef]
  14. Dzwigoł, Henryk, Mariola Dzwigoł-Barosz, and Aleksy Kwilinski. 2020. Formation of Global Competitive Enterprise Environment Based on Industry 4.0 Concept | Abstract. International Journal of Entrepreneurship 24: 1–5. Available online: https://www.abacademies.org/abstract/formation-of-global-competitive-enterprise-environment-based-on-industry-40-concept-9079.html (accessed on 24 September 2020).
  15. EC. 2018. Digital Transformation Scoreboard 2018. EU Businesses Go Digital: Opportunities, Outcomes and Uptake Internal Market. Luxembourg: EC. [Google Scholar]
  16. Elsner, Wolfram, Torsten Heinrich, and Henning Schwardt. 2015. The Information Economy and the Open-Source Principle. In The Microeconomics of Complex Economies. Amsterdam: Elsevier, pp. 451–71. [Google Scholar] [CrossRef]
  17. EUR-Lex. 2010a. A Digital Agenda for Europe. Available online: https://eur-lex.europa.eu/LexUriServ/LexUriServ.do?uri=COM:2010:0245:FIN:EN:PDF (accessed on 24 September 2020).
  18. EUR-Lex. 2010b. European Broadband: Investing in Digitally Driven Growth. Available online: https://eur-lex.europa.eu/legal-content/EN/TXT/PDF/?uri=CELEX:52011IP0322&rid=10 (accessed on 24 September 2020).
  19. EUR-Lex. 2015. The EU’s New Digital Single Market. Strategy. Available online: https://eur-lex.europa.eu/legal-content/EL/TXT/?uri=CELEX%3A52015SC0100 (accessed on 24 September 2020).
  20. EUR-Lex. 2017. Building a European Data Economy. Available online: https://eur-lex.europa.eu/content/news/building_EU_data_economy.html (accessed on 24 September 2020).
  21. European Commission. 2016. International Digital Economic and Social Index (I-DESI). Available online: https://op.europa.eu/en/publication-detail/-/publication/2feb6564-f9a7-11e7-b8f5-01aa75ed71a1/language-en (accessed on 24 September 2020).
  22. European Commission. 2018. The Age of Artificial Intelligence: Towards a European Strategy for Human-Centric Machines. EPSC Strategic Notes 29: 1–14. [Google Scholar]
  23. European Commission. 2019. The Digital Economy and Society Index (DESI) | Digital Single Market. [Google Scholar]
  24. Fagerberg, Jan. 1996. Technology and competitiveness. Oxford Review of Economic Policy 12: 39–51. [Google Scholar] [CrossRef]
  25. Folea, Victoria. 2018. Digital Competitiveness of European Union Member States from the Perspective of Human Capital. European Journal of Engineering and Formal Sciences Articles 2. Available online: https://ideas.repec.org/a/eur/ejefjr/9.html (accessed on 24 September 2020).
  26. Gompertz, Benjamin. 1825. On the Nature of the Function Expressive of the Law of Human Mortality, and on a New Mode of Determining the Value of Life Contingencies. London: Philosophical Transactions of the Royal Society of London, vol. 115, Available online: https://www.medicine.mcgill.ca/epidemiology/hanley/c609/material/Gompertz-1825.pdf (accessed on 24 September 2020).
  27. Grossman, Gene M., and Elhanan Helpman. 1990. Comparative advantage and long-run growth. American Economic Review 80: 796–815. [Google Scholar] [CrossRef]
  28. Gupta, Gaurav, and Indranil Bose. 2019. Strategic learning for digital market pioneering: Examining the transformation of Wishberry’s crowdfunding model. Technological Forecasting and Social Change 146: 865–76. [Google Scholar] [CrossRef]
  29. Gupta, Ruchita, and Karuna Jain. 2012. Diffusion of mobile telephony in India: An empirical study. Technological Forecasting and Social Change 79: 709–15. [Google Scholar] [CrossRef]
  30. Hemais, Carlos A., Henrique M. Barros, and Elizabeth O. R. Rosa. 2005. Technology competitiveness in emerging markets: The case of the Brazilian polymer industry. Journal of Technology Transfer 30: 303–14. [Google Scholar] [CrossRef]
  31. Hoła, Bozena, Marek Sawicki, and Mirosław Skibniewski. 2015. An it model of a knowledge map which supports management in small and medium-sized companies using selected polish construction enterprises as an example. Journal of Civil Engineering and Management 21: 1014–26. [Google Scholar] [CrossRef] [Green Version]
  32. Howells, Jeremy, and Jonathan Michie. 1998. Technological competitiveness in an international arena. International Journal of the Economics of Business 5: 279–93. [Google Scholar] [CrossRef]
  33. Hubert Backhaus, Simon Karl, and Devika Nadarajah. 2019. Investigating the relationship between industry 4.0 and productivity: A conceptual framework for Malaysian manufacturing firms. In Procedia Computer Science. Surabaya: Elsevier B.V., vol. 161, pp. 696–706. [Google Scholar] [CrossRef]
  34. IMD. 2018. IMD World Digital Competitiveness Ranking 2018. Lausanne: IMD. [Google Scholar]
  35. Jovanović, Milica, Jasmina Dlačić, and Milan Okanović. 2018. Digitalization and society’s sustainable development—Measures and implications. Zbornik Radova Ekonomskog Fakultet Au Rijeci 36: 905–28. [Google Scholar] [CrossRef]
  36. Jurčević, Marinko, Lukša Lulić, and Vinko Mostarac. 2020. The Digital Transformation of Croatian Economy Compared With EU Member CountriesIES. Ekonomski Vjesnik/Econviews 33: 151–64. [Google Scholar]
  37. Kargas, Antonios, Michail Kiriakidis, and Evangelos Zacharakis. 2020. Europe’s Economic Crisis: Re-Clustering European Economies. European Journal of Social Science Education and Research 7: 41. [Google Scholar] [CrossRef]
  38. Katsikas, Sokratis K., and Stefanos Gritzalis. 2017. Digitalization in Greece: State of play, barriers, challenges, solutions. In Public Administration and Information Technology. Cham: Springer, vol. 25, pp. 355–75. [Google Scholar] [CrossRef]
  39. Kontolaimou, Alexandra, and Georgia Skintzi. 2018. Digitisation patterns of the Greek economy and society. In Greek Economic Outlook. Athens: KEPE, pp. 41–48. [Google Scholar]
  40. Kotarba, Marcin. 2017. Measuring Digitalization—Key metrics. Foundations of Management 9. [Google Scholar] [CrossRef] [Green Version]
  41. Kumar, Naveen, and Jyoti Kumar. 2019. E_ciency 4.0 for Industry 4.0. Human Technology 15: 55–78. [Google Scholar] [CrossRef]
  42. Kuzior, Aleksandra, Aleksy Kwilinski, and Volodymyr Tkachenko. 2019. Sustainable development of organizations based on the combinatorial model of artificial intelligence. Entrepreneurship and Sustainability Issues 7: 1353–76. [Google Scholar] [CrossRef]
  43. Laitsou, Eleni, Michail Kiriakidis, Antonis Kargas, and Dimitris Varoutas. 2017. Economies of scale, cost minimization and productivity in telecom markets under economic crisis: Evidence from Greece. NETNOMICS: Economic Research and Electronic Networking 18: 169–82. [Google Scholar] [CrossRef]
  44. Lenart-Gansiniec, Regina. 2019. Organizational Learning in Industry 4.0. Problemy Zarzadzania 82: 96–108. Available online: https://econpapers.repec.org/RePEc:sgm:pzwzuw:v:17:i:82:y:2019:p:96-108 (accessed on 24 September 2020). [CrossRef]
  45. Liu, Xielin, Feng Shang Wu, and Wen Lin Chu. 2012. Diffusion of mobile telephony in China: Drivers and forecasts. IEEE Transactions on Engineering Management 59: 299–309. [Google Scholar] [CrossRef]
  46. Lixăndroiu, Dorin. 2018. Digital Competitiveness Indicators And The E-Government Process In Romania. Journal of Smart Economic Growth 3: 107–22. Available online: https://ideas.repec.org/a/seg/012016/v3y2018i2p107-122.html (accessed on 24 September 2020).
  47. Lutz, Sebastian Uljas. 2019. The European digital single market strategy: Local indicators of spatial association 2011–2016. Telecommunications Policy 43: 393–410. [Google Scholar] [CrossRef]
  48. Michalakelis, Christos, Dimitrios Varoutas, and Thomas Sphicopoulos. 2008. Diffusion models of mobile telephony in Greece. Telecommunications Policy 32: 234–45. [Google Scholar] [CrossRef]
  49. Miśkiewicz, Julia. 2019. The merger of natural intelligence with artificial intelligence, with a focus on Neuralink company. Virtual Economics 2: 22–29. [Google Scholar] [CrossRef]
  50. Moroz, Miroslaw. 2017. The Level of Development of the Digital Economy in Poland and Selected European Countries: A Comparative Analysis. Foundations of Management 9: 175–90. Available online: https://content.sciendo.com/view/journals/fman/9/1/article-p175.xml?lang=en (accessed on 24 September 2020). [CrossRef] [Green Version]
  51. Morrar, Rabeh, and Husam Arman. 2017. The Fourth Industrial Revolution (Industry 4.0): A Social Innovation Perspective. Technology Innovation Management Review 7: 12–20. [Google Scholar] [CrossRef] [Green Version]
  52. Nagy, Szabolcs. 2017. Digital Economy And Society. A Cross Country Comparison Of Hungary And Ukraine. Visnyk Natsionalnogo Tekhichnogo Universytetu Kharkivskyj Politekhnichnyj Instytut Ekonomichni Nauky 46: 174–79. [Google Scholar]
  53. Narula, Rajneesh, and Katharine Wakelin. 1998. Technological competitiveness, trade and foreign direct investment. Structural Change and Economic Dynamics 9: 373–87. [Google Scholar] [CrossRef] [Green Version]
  54. OECD. 2019. Digital Innovation: Seizing Policy Opportunities. Paris: OECD. [Google Scholar]
  55. Porter, Michael E. 2008. On Competition. Boston: Harvard Business School Publishing, Available online: https://www.hbs.edu/faculty/Pages/item.aspx?num=184 (accessed on 24 September 2020).
  56. Porter, Michael, and James E. Heppelmann. 2014. How Smart, Connected Products Are Transforming Competition. Harvard Business Review 92: 64–88. [Google Scholar]
  57. Radman, Goran, and Ana Belin. 2017. Competitiveness in Technology and Innovation: How to Keep On? International Journal of Digital Technology & Economy 2: 45–56. [Google Scholar]
  58. Rouvinen, Petri. 2006. Diffusion of Digital Mobile Telephony: Are Developing Countries Different? Telecommunications Policy 30: 46–63. Available online: https://papers.ssrn.com/sol3/papers.cfm?abstract_id=885954 (accessed on 24 September 2020). [CrossRef] [Green Version]
  59. Sanghavi, Devansh, Sahil Parikh, and S. Aravind Raj. 2019. Industry 4.0: Tools and Implementation. Management and Production Engineering Review 10: 3–13. [Google Scholar]
  60. Schwab, K. 2016. The Fourth Industrial Revolution. Geneva: World Economic Forum. [Google Scholar]
  61. Shank, Daniel B., and Alexander Gott. 2019. People’s self-reported encounters of Perceiving Mind in Artificial Intelligence. Data in Brief 25: 104220. [Google Scholar] [CrossRef]
  62. Simionescu, Mihaela, Kornélia Lazányi, Gabriela Sopková, Kamil Dobeš, and Adam P. Balcerzak. 2017. Determinants of Economic Growth in V4 Countries and Romania. Journal of Competitiveness 9: 103–16. [Google Scholar] [CrossRef] [Green Version]
  63. Singh, Sanjay Kumar. 2008. The diffusion of mobile phones in India. Telecommunications Policy 32: 642–51. Available online: https://econpapers.repec.org/RePEc:eee:telpol:v:32:y::i:9-10:p:642-651 (accessed on 24 September 2020). [CrossRef]
  64. Stanickova, Michaela. 2017. Can the implementation of the Europe 2020 Strategy goals be efficient? The challenge for achieving social equality in the European Union. Equilibrium 12. [Google Scholar] [CrossRef] [Green Version]
  65. Stavytskyy, Andriy, Ganna Kharlamova, and Eduard Alexandru Stoica. 2019. The Analysis of the Digital Economy and Society Index in the EU. Baltic Journal of European Studies 9: 245–61. [Google Scholar] [CrossRef] [Green Version]
  66. Sudtasan, Tatcha, and Hitoshi Mitomo. 2017. Comparison of Diffusion Models for Forecasting the Growth of Broadband Markets in Thailand. In 14th Asia-Pacific Regional Conference of the International Telecommunications Society (ITS): “Mapping ICT into Transformation for the Next Information Society”. Kyoto: International Telecommunications Society (ITS), Available online: http://hdl.handle.net/10419/168541www.econstor.eu (accessed on 24 September 2020).
  67. Sun, Xiang, Yeneng Sun, Lei Wu, and Nicholas C. Yannelis. 2017. Equilibria and incentives in private information economies. Journal of Economic Theory 169: 474–88. [Google Scholar] [CrossRef]
  68. Tjørve, Even, and Kathleen M.C. Tjørve. 2010. A unified approach to the Richards-model family for use in growth analyses: Why we need only two model forms. Journal of Theoretical Biology 267: 417–25. [Google Scholar] [CrossRef]
  69. Tjørve, Kathleen M. C., and Even Tjørve. 2017. The use of Gompertz models in growth analyses, and new Gompertz-model approach: An addition to the Unified-Richards family. PLoS ONE 12: e0178691. [Google Scholar] [CrossRef]
  70. Trushkina, Nataliia. 2019. Development of the information economy under the conditions of global economic transformations: Features, factors and prospects. Virtual Economics 2: 7–25. [Google Scholar] [CrossRef]
  71. Uchida, Yuichiro, and Paul Cook. 2005. The effects of competition on technological and trade competitiveness. Quarterly Review of Economics and Finance 45: 258–83. [Google Scholar] [CrossRef]
  72. Vidruska, Renate. 2016. The Digital Economy & Society Index and Network Readiness Index: Performance of Latvia on European Union Arena. In New Challenges of Economic and Business Development—2016. Riga: University of Latvia. [Google Scholar]
  73. Vogels, Maurice, Rita Zoeckler, Donald M. Stasiw, and Lawrence C. Cerny. 1975. P. F. Verhulst’s “notice sur la loi que la populations suit dans son accroissement” from correspondence mathematique et physique. Ghent, vol. X, 1838. Journal of Biological Physics 3: 183–92. [Google Scholar] [CrossRef]
  74. Vrchota, Jaroslav, Monika Mařiková, Petr Řehoř, Ladislav Rolínek, and Radek Toušek. 2019. Human Resources Readiness for Industry 4.0. Journal of Open Innovation: Technology, Market, and Complexity 6: 3. [Google Scholar] [CrossRef] [Green Version]
  75. WEF. 2018. The Global Competitiveness Report 2018. Geneva: WEF. [Google Scholar]
  76. Weresa, Marzenna Anna. 2010. Intellectual property rights and competitiveness: Evidence from Poland. International Journal of Foresight and Innovation Policy 6: 233–47. [Google Scholar] [CrossRef]
  77. Weresa, Anna Marzenna. 2019. Technological competitiveness of the EU member states in the era of the fourth industrial revolution. Economics and Business Review 5: 50–71. Available online: https://ideas.repec.org/a/vrs/ecobur/v5y2019i3p50-71n5.html (accessed on 24 September 2020). [CrossRef]
  78. Wu, Feng-Shang, and Wenlin Chu. 2010. Diffusion models of mobile telephony. Journal of Business Research 63: 497–501. [Google Scholar] [CrossRef]
  79. Yamakawa, Peter, Gareth H. Rees, Jose Manuel Salas, and Nikolai Alva. 2013. The diffusion of mobile telephones: An empirical analysis for Peru. Telecommunications Policy 37: 594–606. [Google Scholar] [CrossRef]
  80. Zhao, Yang, Tingting Li, Xuejun Zhang, and Chaobo Zhang. 2019. Artificial intelligence-based fault detection and diagnosis methods for building energy systems: Advantages, challenges and the future. Renewable and Sustainable Energy Reviews 109: 85–101. [Google Scholar] [CrossRef]
  81. Zupan Korže, Saša. 2019. From Industry 4.0 to Tourism 4.0. Innovative Issues and Approaches in Social Sciences 12. [Google Scholar] [CrossRef]
1
Figure 1. Connectivity in Greece and the EU (European Commission 2019).
Economies 08 00085 g001
Figure 2. DESI Connectivity Scoreboard (European Commission 2019).
Economies 08 00085 g002
Figure 3. DESI Connectivity dimension forecast.
Economies 08 00085 g003
Figure 4. Human Capital in Greece and the EU (European Commission 2019).
Economies 08 00085 g004
Figure 5. DESI Human Capital scoreboard.
Economies 08 00085 g005
Figure 6. DESI Human Capital dimension forecast.
Economies 08 00085 g006
Figure 7. Use of Internet Services in Greece and the EU (European Commission 2019).
Economies 08 00085 g007
Figure 8. DESI Use of Internet scoreboard.
Economies 08 00085 g008
Figure 9. DESI Use of Internet dimension forecast.
Economies 08 00085 g009
Figure 10. Integration of Digital Technologies in Greece and the EU (European Commission 2019).
Economies 08 00085 g010
Figure 11. DESI Integration of Digital Technology scoreboard.
Economies 08 00085 g011
Figure 12. DESI Integration of Digital Technology dimension forecast.
Economies 08 00085 g012
Figure 13. Digital Public Services in Greece and the EU (European Commission 2019).
Economies 08 00085 g013
Figure 14. DESI Digital Public Services scoreboard.
Economies 08 00085 g014
Figure 15. DESI Digital Public Services dimension forecast.
Economies 08 00085 g015
Figure 16. The DESI index in Greece and the EU (European Commission 2019).
Economies 08 00085 g016
Figure 17. DESI index overall scoreboard.
Economies 08 00085 g017
Figure 18. DESI overall index forecast.
Economies 08 00085 g018
Table 1. Methodological structure of Digital Economy and Society Index.
Principal DimensionsSubdimensionsNo. of IndicatorIndicators
ConnectivityFixed broadband1a1Fixed broadband (BB) coverage
1a2Fixed BB take-up
Mobile broadband1b14G coverage
1b2Mobile BB take-up
1b35G readiness
Fast broadband1c1NGA coverage
1c2Fast BB take-up
Ultrafast broadband1d1Ultrafast BB coverage
1d2Ultrafast BB take-up
Broadband Price Index1e1Broadband Price Index
Human CapitalInternet user skills2a1At least basic digital skills
2a2Above basic digital skills
2a3At least basic software skills
Advanced skills and development2b1ICT Specialists
2b2Female ICT specialists
2b3ICT graduates
Use of InternetInternet use3a1People who never used the internet
3a2Internet users
Activities online3b1News
3b2Music, videos and games
3b3Video on demand
3b4Video calls
3b5Social networks
3b6Professional social networks
3b7Doing an online course
3b8Online consultations and voting
Transactions3c1Banking
3c2Shopping
3c3Selling online
Integration of Digital TechnologyBusiness digitization4a1Electronic information sharing
4a2Social media
4a3Big data
4a4Cloud
E-commerce4b1SMEs selling online
4b2E-commerce turnover
4b3Selling online cross-border
Digital Public ServicesE-government5a1E-government users
5a2Pre-filled forms
5a3Online service completion
5a4Digital public services for businesses
5a5Open data
e-Health5b1e-Health
5b2Medical data exchange
5b3e-Prescription
Source: European Commission (European Commission 2019)1.
Table 2. Connectivity dimension.
Principal DimensionsSubdimensions and Their ContributionNo. of IndicatorIndicators ContributionIndicators
ConnectivityFixed broadband18.5%1a150%Fixed broadband (BB) coverage
1a250%Fixed BB take-up
Mobile broadband35.0%1b133%4G coverage
1b233%Mobile BB take-up
1b333%5G readiness
Fast broadband18.5%1c150%NGA coverage
1c250%Fast BB take-up
Ultrafast broadband18.5%1d150%Ultrafast BB coverage
1d250%Ultrafast BB take-up
Broadband Price Index9.5%1e19.5%Broadband Price Index
Table 3. Human Capital dimension.
Principal DimensionsSubdimensions and Their ContributionNo. of IndicatorIndicators ContributionIndicators
Human CapitalInternet user skills50%2a133%At least basic digital skills
2a233%Above basic digital skills
2a333%At least basic software skills
Advanced skills and development50%2b133%ICT specialists
2b233%Female ICT specialists
2b333%ICT graduates
Table 4. Use of Internet dimension.
Principal DimensionsSubdimensions and Their ContributionNo. of IndicatorIndicators ContributionIndicators
Use of InternetInternet use25%3a150.0%People who never used the internet
3a250.0%Internet users
Activities online50%3b112.5%News
3b212.5%Music, videos and games
3b312.5%Video on demand
3b412.5%Video calls
3b512.5%Social networks
3b612.5%Professional social networks
3b712.5%Doing an online course
3b812.5%Online consultations and voting
Transactions25%3c133.0%Banking
3c233.0%Shopping
3c333.0%Selling online
Table 5. Integration of Digital Technology dimension.
Principal DimensionsSubdimensions and Their ContributionNo. of IndicatorIndicators ContributionIndicators
Integration of Digital TechnologyBusiness digitization60%4a125%Electronic information sharing
4a225%Social media
4a325%Big data
4a425%Cloud
E-commerce40%4b133%SMEs selling online
4b233%E-commerce turnover
4b333%Selling online cross-border
Table 6. Digital Public Services dimension.
Principal DimensionsSubdimensions and Their ContributionNo. of IndicatorIndicators ContributionIndicators
Digital Public ServicesE-government80%5a120%E-government users
5a220%Pre-filled forms
5a320%Online service completion
5a420%Digital public services for businesses
5a520%Open data
e-Health20%5b133%e-Health
5b233%Medical data exchange
5b333%e-Prescription
Publisher’s Note: MDPI stays neutral with regard to jurisdictional claims in published maps and institutional affiliations.