Internal Migration in Spain: A Complementary Approach


Abstract
1. Introduction
2. A Snapshot of the Case Study: Internal Migratory Flows in Spain
- There are important differences in the intensity of migratory flows throughout Spain.
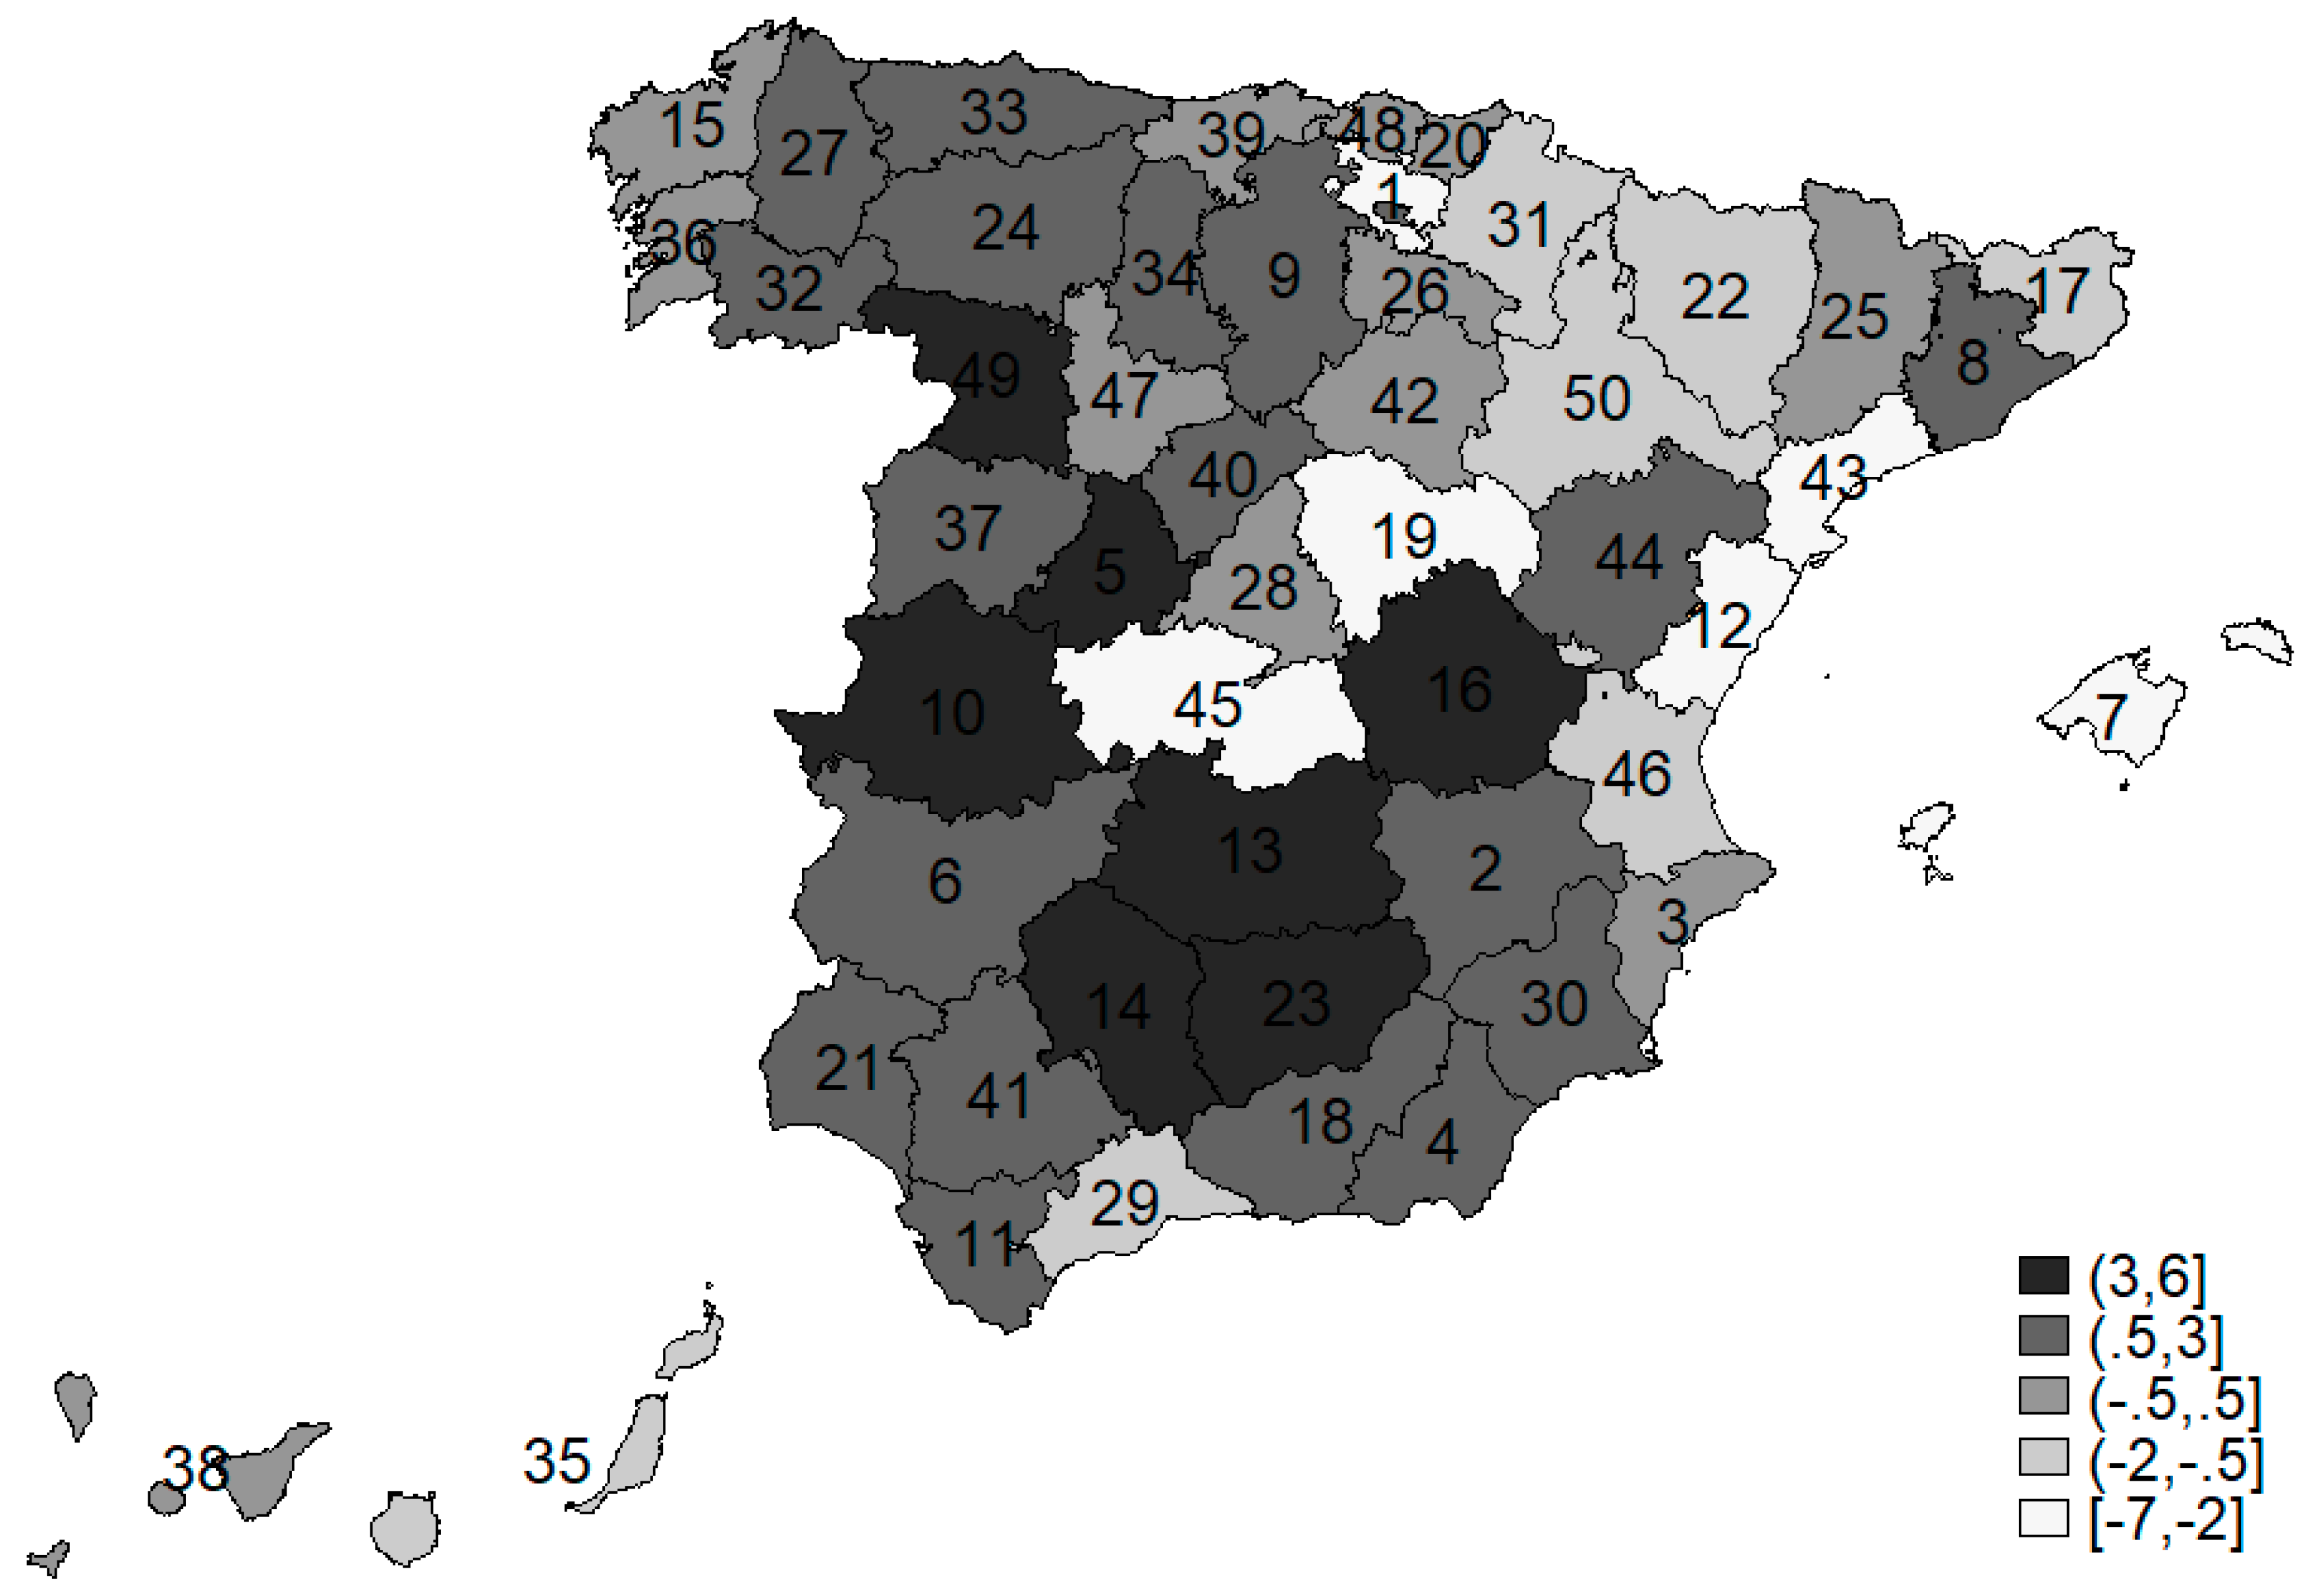
- Rates are especially high between neighbouring provinces. Figure 2 displays the geographical location of the 50 Spanish provinces so that the reader can check how gross migration rates increase between them and, as a rule, diminish as the distance increases.
- The role played by provinces such as Madrid and Barcelona, arguably the two most important ones in economic terms, as a destination of migratory flows is unquestionable. These rates are highlighted in bold in the table. In any event, there are also many people leaving these rich provinces to live in neighbouring ones.
- The island provinces (Baleares, Tenerife and Las Palmas) also stand out both as sending and receiving provinces. Flows towards and from them are intense.
- Finally, although for the sake of space it is not offered for each pair of provinces but globally, when computing the net migration rate for each province—defined as internal movements from each province (to the remaining ones) minus internal movements (from the rest of provinces) towards it divided by its population in the previous year and multiplied by 1000—one can get a precise idea of the role that each one plays as a province of origin or destination. By doing so, we find out (see Figure 3) that some provinces highlight for being basically destination provinces (namely Guadalajara, Toledo, Alava, Tarragona and Castellon), some others do so as sending provinces (mainly some areas in the surroundings of Madrid such as Ciudad Real, Zamora and Ávila), while others report a net migration rate close to zero (e.g., Pontevedra, Vizcaya, Coruña and Lleida).
3. Methodology
- -
- denotes the inter-provincial gross migration rate, defined as above. There is always some discussion on the use of net or gross migration flows; concerning this point, I am in line with Juarez (2000) and believe gross flows are more appropriate since they prevent inflows and outflows from offsetting each other.
- -
- refers to the ratio of per capita GDP (destination province over origin province).4 Regardless of the model you are applying, one main factor behind migration is the wage-gap between territories. It is important to note, therefore, that following, among others, Redding and Venables (2004) and Bruna et al. (2016), I decided to take per capita income as a proxy for wages. Data were collected from the Contabilidad Regional de España (INE).
- -
- denotes the unemployment rate ratio (as always, destination divided by origin). As in the previous case, employment opportunities are always considered a key factor in explaining migration (see, e.g., the seminal paper by Harris and Todaro 1970, one of the extensions of Todaro’s model previously mentioned). Data were collected from the Encuesta de Población Activa (INE).
- -
- means the ratio between housing prices. It is also quite common in migration models to include a variable capturing differences in housing prices between origin and potential destinations (as a reference, see the ‘Push-pull’ Theory of Migration established by Lee 1966). Data were taken from the Spanish Ministry of Development. Unfortunately, there is no available information about homeownership, which no doubt becomes a crucial factor when making a migration decision (Palomares-Linares and van Ham 2020).
- -
- denotes the climate condition ratio. As indicated by, for instance, Partridge and Rickman (2003), migration cannot only be economic but also amenity-driven. Here, to check for this type of migration, I consider as a proxy for amenities, in line with many empirical works, a climate variable (which in turn is approximated by the average temperature of each province). Data were collected from different yearly reports provided by INE.
- -
- refers to the distance (thousand kilometres of road) between pairs of capitals (except for island provinces, obviously). Data were collected from the Repsol Guide (http://aim-andalucia.com/distancias.html).
- -
- refers to origin (destination) fixed effects, and to time effects. Following Royuela and Ordóñez (2018), I considered different combinations of fixed-effects to deal with multilateral resistance in migration decisions. For the sake of simplicity, here I show the one offering, in my view, better results.
- -
- Finally, it is important to stress that the reason I take lagged variables is two-fold: On the one hand, since when it comes to moving, migrants pay attention to the value of each variable in a previous period; on the other hand, because it is an easy way to somewhat tackle with endogeneity problems arising in any migration model.
4. Results
4.1. Benchmark Model
4.2. Dealing with Age
4.3. Dealing with Distance
5. Conclusions
Funding
Conflicts of Interest
Appendix A

Appendix B

| Origin\Destin. | Almeria | Cádiz | Córdoba | Granada | Huelva | Jaen | Malaga | Sevilla | Huesca | Teruel | Zaragoza | Asturias | |
| Almeria | 0.28 | 0.21 | 2.32 | 0.25 | 0.45 | 0.91 | 0.40 | 0.12 | 0.03 | 0.26 | 0.10 | ||
| Cádiz | 0.18 | 0.29 | 0.41 | 0.28 | 0.12 | 1.80 | 2.02 | 0.02 | 0.03 | 0.15 | 0.11 | ||
| Córdoba | 0.26 | 0.52 | 0.65 | 0.26 | 0.59 | 2.17 | 1.46 | 0.04 | 0.03 | 0.24 | 0.08 | ||
| Granada | 1.88 | 0.45 | 0.44 | 0.19 | 0.84 | 2.25 | 0.70 | 0.09 | 0.03 | 0.17 | 0.09 | ||
| Huelva | 0.24 | 0.67 | 0.30 | 0.26 | 0.16 | 0.55 | 3.63 | 0.08 | 0.04 | 0.15 | 0.04 | ||
| Jaen | 0.77 | 0.37 | 0.84 | 2.02 | 0.19 | 1.55 | 0.70 | 0.05 | 0.04 | 0.16 | 0.06 | ||
| Malaga | 0.36 | 1.25 | 0.58 | 1.01 | 0.13 | 0.32 | 0.78 | 0.04 | 0.02 | 0.15 | 0.11 | ||
| Sevilla | 0.18 | 1.20 | 0.47 | 0.31 | 0.91 | 0.16 | 0.85 | 0.03 | 0.01 | 0.11 | 0.08 | ||
| Huesca | 0.17 | 0.12 | 0.10 | 0.19 | 0.12 | 0.05 | 0.11 | 0.14 | 0.32 | 5.63 | 0.10 | ||
| Teruel | 0.24 | 0.07 | 0.08 | 0.09 | 0.05 | 0.10 | 0.15 | 0.13 | 0.66 | 7.92 | 0.07 | ||
| Zaragoza | 0.13 | 0.17 | 0.11 | 0.10 | 0.07 | 0.07 | 0.19 | 0.19 | 1.11 | 0.75 | 0.12 | ||
| Asturias | 0.06 | 0.11 | 0.03 | 0.06 | 0.04 | 0.04 | 0.23 | 0.13 | 0.04 | 0.01 | 0.12 | ||
| Baleares | 0.23 | 0.76 | 0.39 | 0.77 | 0.15 | 0.30 | 0.66 | 1.00 | 0.05 | 0.04 | 0.26 | 0.26 | |
| Palmas, Las | 0.13 | 0.54 | 0.14 | 0.28 | 0.10 | 0.08 | 0.51 | 0.54 | 0.04 | 0.02 | 0.20 | 0.21 | |
| Tenerife | 0.11 | 0.38 | 0.11 | 0.20 | 0.10 | 0.07 | 0.53 | 0.39 | 0.04 | 0.01 | 0.20 | 0.28 | |
| Cantabria | 0.06 | 0.14 | 0.06 | 0.09 | 0.03 | 0.02 | 0.28 | 0.21 | 0.04 | 0.02 | 0.16 | 0.81 | |
| Ávila | 0.11 | 0.12 | 0.03 | 0.11 | 0.06 | 0.11 | 0.34 | 0.19 | 0.07 | 0.01 | 0.26 | 0.24 | |
| Burgos | 0.11 | 0.15 | 0.06 | 0.13 | 0.05 | 0.03 | 0.26 | 0.17 | 0.09 | 0.03 | 0.42 | 0.28 | |
| León | 0.12 | 0.17 | 0.07 | 0.11 | 0.07 | 0.03 | 0.26 | 0.15 | 0.07 | 0.03 | 0.42 | 1.69 | |
| Palencia | 0.09 | 0.17 | 0.02 | 0.09 | 0.06 | 0.06 | 0.15 | 0.15 | 0.02 | 0.03 | 0.20 | 0.54 | |
| Salamanca | 0.08 | 0.16 | 0.06 | 0.11 | 0.10 | 0.04 | 0.37 | 0.20 | 0.04 | 0.02 | 0.22 | 0.37 | |
| Segovia | 0.19 | 0.26 | 0.11 | 0.19 | 0.09 | 0.07 | 0.31 | 0.30 | 0.09 | 0.13 | 0.33 | 0.28 | |
| Soria | 0.11 | 0.06 | 0.15 | 0.15 | 0.03 | 0.09 | 0.21 | 0.18 | 0.19 | 0.04 | 3.51 | 0.24 | |
| Valladolid | 0.07 | 0.13 | 0.09 | 0.10 | 0.07 | 0.03 | 0.29 | 0.22 | 0.02 | 0.01 | 0.26 | 0.36 | |
| Zamora | 0.13 | 0.06 | 0.06 | 0.10 | 0.07 | 0.05 | 0.23 | 0.12 | 0.07 | 0.01 | 0.15 | 0.61 | |
| Albacete | 0.22 | 0.14 | 0.16 | 0.17 | 0.11 | 0.23 | 0.18 | 0.23 | 0.06 | 0.04 | 0.21 | 0.11 | |
| Ciudad Real | 0.30 | 0.25 | 0.46 | 0.43 | 0.12 | 0.38 | 0.61 | 0.35 | 0.06 | 0.03 | 0.22 | 0.09 | |
| Cuenca | 0.20 | 0.14 | 0.26 | 0.19 | 0.12 | 0.26 | 0.16 | 0.21 | 0.07 | 0.13 | 0.28 | 0.10 | |
| Guadalajara | 0.20 | 0.23 | 0.12 | 0.23 | 0.13 | 0.12 | 0.47 | 0.28 | 0.13 | 0.19 | 0.69 | 0.22 | |
| Toledo | 0.20 | 0.24 | 0.19 | 0.19 | 0.10 | 0.17 | 0.38 | 0.26 | 0.09 | 0.05 | 0.18 | 0.28 | |
| Barcelona | 0.16 | 0.14 | 0.11 | 0.22 | 0.05 | 0.09 | 0.28 | 0.23 | 0.13 | 0.07 | 0.26 | 0.10 | |
| Girona | 0.15 | 0.16 | 0.14 | 0.29 | 0.06 | 0.17 | 0.30 | 0.18 | 0.10 | 0.05 | 0.22 | 0.10 | |
| Lleida | 0.22 | 0.10 | 0.08 | 0.16 | 0.16 | 0.11 | 0.24 | 0.19 | 1.15 | 0.12 | 0.97 | 0.10 | |
| Tarragona | 0.17 | 0.18 | 0.10 | 0.18 | 0.08 | 0.18 | 0.23 | 0.23 | 0.18 | 0.18 | 0.47 | 0.14 | |
| Alicante | 0.29 | 0.14 | 0.08 | 0.27 | 0.04 | 0.14 | 0.33 | 0.23 | 0.05 | 0.03 | 0.19 | 0.16 | |
| Castellon | 0.14 | 0.20 | 0.13 | 0.13 | 0.05 | 0.09 | 0.20 | 0.14 | 0.12 | 0.39 | 0.33 | 0.10 | |
| Valencia | 0.11 | 0.09 | 0.07 | 0.12 | 0.05 | 0.07 | 0.19 | 0.14 | 0.06 | 0.18 | 0.28 | 0.10 | |
| Badajoz | 0.10 | 0.39 | 0.32 | 0.16 | 0.37 | 0.06 | 0.43 | 1.10 | 0.03 | 0.04 | 0.19 | 0.11 | |
| Caceres | 0.11 | 0.22 | 0.09 | 0.16 | 0.21 | 0.06 | 0.31 | 0.45 | 0.07 | 0.03 | 0.18 | 0.19 | |
| Coruña | 0.06 | 0.33 | 0.03 | 0.06 | 0.03 | 0.02 | 0.15 | 0.10 | 0.02 | 0.01 | 0.14 | 0.28 | |
| Lugo | 0.09 | 0.07 | 0.02 | 0.05 | 0.03 | 0.01 | 0.11 | 0.10 | 0.02 | 0.03 | 0.19 | 1.10 | |
| Ourense | 0.07 | 0.09 | 0.03 | 0.06 | 0.05 | 0.02 | 0.24 | 0.14 | 0.02 | 0.02 | 0.13 | 0.27 | |
| Pontevedra | 0.05 | 0.13 | 0.03 | 0.06 | 0.05 | 0.01 | 0.14 | 0.09 | 0.04 | 0.01 | 0.08 | 0.19 | |
| Madrid | 0.17 | 0.29 | 0.14 | 0.19 | 0.06 | 0.11 | 0.54 | 0.33 | 0.05 | 0.02 | 0.24 | 0.27 | |
| Murcia | 0.72 | 0.27 | 0.09 | 0.38 | 0.08 | 0.16 | 0.29 | 0.19 | 0.06 | 0.04 | 0.22 | 0.09 | |
| Navarra | 0.10 | 0.15 | 0.07 | 0.14 | 0.03 | 0.10 | 0.26 | 0.14 | 0.16 | 0.04 | 1.02 | 0.19 | |
| Alava | 0.08 | 0.15 | 0.06 | 0.07 | 0.02 | 0.05 | 0.22 | 0.13 | 0.07 | 0.02 | 0.40 | 0.17 | |
| Vizcaya | 0.06 | 0.11 | 0.04 | 0.07 | 0.03 | 0.02 | 0.20 | 0.11 | 0.04 | 0.01 | 0.16 | 0.17 | |
| Guipuzcoa | 0.06 | 0.13 | 0.02 | 0.11 | 0.02 | 0.04 | 0.17 | 0.13 | 0.07 | 0.01 | 0.27 | 0.19 | |
| La Rioja | 0.05 | 0.19 | 0.10 | 0.11 | 0.06 | 0.08 | 0.20 | 0.15 | 0.09 | 0.05 | 0.98 | 0.39 | |
| Origin\Destin. | Baleares | Palmas | Tenerife | Cantabria | Ávila | Burgos | León | Palencia | Salamanca | Segovia | Soria | Valladolid | Zamora |
| Almeria | 0.54 | 0.26 | 0.15 | 0.05 | 0.01 | 0.07 | 0.08 | 0.03 | 0.04 | 0.03 | 0.03 | 0.06 | 0.03 |
| Cádiz | 1.10 | 0.63 | 0.30 | 0.08 | 0.01 | 0.05 | 0.05 | 0.02 | 0.05 | 0.03 | 0.01 | 0.06 | 0.01 |
| Córdoba | 0.76 | 0.30 | 0.15 | 0.05 | 0.01 | 0.04 | 0.04 | 0.01 | 0.02 | 0.03 | 0.01 | 0.05 | 0.01 |
| Granada | 1.24 | 0.32 | 0.25 | 0.07 | 0.03 | 0.05 | 0.04 | 0.00 | 0.03 | 0.01 | 0.01 | 0.04 | 0.01 |
| Huelva | 0.43 | 0.30 | 0.21 | 0.06 | 0.03 | 0.02 | 0.04 | 0.01 | 0.05 | 0.05 | 0.02 | 0.06 | 0.01 |
| Jaen | 0.78 | 0.19 | 0.10 | 0.06 | 0.02 | 0.05 | 0.02 | 0.01 | 0.03 | 0.03 | 0.02 | 0.07 | 0.00 |
| Malaga | 0.43 | 0.36 | 0.26 | 0.07 | 0.03 | 0.04 | 0.04 | 0.01 | 0.04 | 0.02 | 0.02 | 0.07 | 0.02 |
| Sevilla | 0.97 | 0.40 | 0.25 | 0.06 | 0.03 | 0.03 | 0.04 | 0.02 | 0.04 | 0.01 | 0.02 | 0.06 | 0.01 |
| Huesca | 0.34 | 0.20 | 0.28 | 0.10 | 0.04 | 0.17 | 0.14 | 0.00 | 0.03 | 0.04 | 0.07 | 0.06 | 0.02 |
| Teruel | 0.31 | 0.22 | 0.13 | 0.14 | 0.01 | 0.07 | 0.11 | 0.02 | 0.04 | 0.04 | 0.16 | 0.03 | 0.00 |
| Zaragoza | 0.30 | 0.22 | 0.24 | 0.11 | 0.03 | 0.15 | 0.13 | 0.03 | 0.05 | 0.04 | 0.22 | 0.10 | 0.02 |
| Asturias | 0.40 | 0.32 | 0.28 | 0.50 | 0.02 | 0.10 | 0.74 | 0.06 | 0.08 | 0.02 | 0.02 | 0.25 | 0.08 |
| Baleares | 0.56 | 0.47 | 0.12 | 0.03 | 0.08 | 0.13 | 0.03 | 0.11 | 0.03 | 0.02 | 0.12 | 0.05 | |
| Palmas, Las | 0.73 | 2.10 | 0.16 | 0.03 | 0.04 | 0.09 | 0.02 | 0.08 | 0.03 | 0.01 | 0.07 | 0.02 | |
| Tenerife | 0.67 | 2.32 | 0.13 | 0.03 | 0.05 | 0.07 | 0.03 | 0.06 | 0.04 | 0.01 | 0.09 | 0.02 | |
| Cantabria | 0.26 | 0.30 | 0.28 | 0.03 | 0.47 | 0.23 | 0.33 | 0.15 | 0.04 | 0.02 | 0.37 | 0.07 | |
| Ávila | 0.29 | 0.30 | 0.20 | 0.21 | 0.39 | 0.30 | 0.12 | 1.34 | 0.83 | 0.12 | 1.24 | 0.11 | |
| Burgos | 0.35 | 0.15 | 0.17 | 0.85 | 0.05 | 0.41 | 0.44 | 0.36 | 0.31 | 0.35 | 1.00 | 0.12 | |
| León | 0.43 | 0.27 | 0.23 | 0.47 | 0.09 | 0.34 | 0.41 | 0.35 | 0.11 | 0.07 | 0.94 | 0.44 | |
| Palencia | 0.24 | 0.17 | 0.25 | 1.38 | 0.07 | 1.36 | 1.16 | 0.32 | 0.20 | 0.10 | 2.86 | 0.28 | |
| Salamanca | 0.42 | 0.28 | 0.36 | 0.33 | 0.45 | 0.37 | 0.42 | 0.19 | 0.18 | 0.07 | 1.15 | 0.70 | |
| Segovia | 0.21 | 0.35 | 0.21 | 0.23 | 0.81 | 0.80 | 0.42 | 0.17 | 0.27 | 0.14 | 2.26 | 0.13 | |
| Soria | 0.29 | 0.24 | 0.20 | 0.27 | 0.02 | 1.61 | 0.33 | 0.18 | 0.37 | 0.27 | 0.80 | 0.15 | |
| Valladolid | 0.31 | 0.23 | 0.16 | 0.48 | 0.26 | 0.58 | 0.70 | 0.72 | 0.47 | 0.45 | 0.12 | 0.66 | |
| Zamora | 0.34 | 0.19 | 0.10 | 0.38 | 0.18 | 0.32 | 1.47 | 0.35 | 1.94 | 0.17 | 0.06 | 2.54 | |
| Albacete | 0.84 | 0.28 | 0.22 | 0.07 | 0.04 | 0.06 | 0.08 | 0.02 | 0.10 | 0.04 | 0.03 | 0.05 | 0.02 |
| Ciudad Real | 0.58 | 0.18 | 0.16 | 0.12 | 0.06 | 0.06 | 0.09 | 0.03 | 0.07 | 0.03 | 0.03 | 0.10 | 0.02 |
| Cuenca | 0.35 | 0.14 | 0.12 | 0.13 | 0.05 | 0.09 | 0.14 | 0.05 | 0.09 | 0.06 | 0.04 | 0.15 | 0.04 |
| Guadalajara | 0.29 | 0.36 | 0.36 | 0.18 | 0.16 | 0.09 | 0.13 | 0.04 | 0.14 | 0.16 | 0.25 | 0.23 | 0.06 |
| Toledo | 0.38 | 0.36 | 0.25 | 0.12 | 0.28 | 0.08 | 0.12 | 0.03 | 0.15 | 0.07 | 0.04 | 0.11 | 0.05 |
| Barcelona | 0.67 | 0.20 | 0.21 | 0.07 | 0.01 | 0.04 | 0.07 | 0.02 | 0.04 | 0.01 | 0.03 | 0.05 | 0.02 |
| Girona | 0.48 | 0.25 | 0.20 | 0.06 | 0.02 | 0.02 | 0.04 | 0.02 | 0.06 | 0.02 | 0.02 | 0.04 | 0.03 |
| Lleida | 0.45 | 0.19 | 0.16 | 0.09 | 0.03 | 0.05 | 0.04 | 0.04 | 0.05 | 0.09 | 0.03 | 0.07 | 0.01 |
| Tarragona | 0.54 | 0.24 | 0.14 | 0.06 | 0.02 | 0.07 | 0.07 | 0.02 | 0.05 | 0.01 | 0.02 | 0.05 | 0.02 |
| Alicante | 0.68 | 0.22 | 0.18 | 0.10 | 0.03 | 0.08 | 0.09 | 0.02 | 0.06 | 0.03 | 0.01 | 0.11 | 0.02 |
| Castellon | 0.53 | 0.16 | 0.11 | 0.08 | 0.01 | 0.05 | 0.06 | 0.02 | 0.03 | 0.02 | 0.02 | 0.06 | 0.01 |
| Valencia | 0.72 | 0.16 | 0.19 | 0.06 | 0.02 | 0.05 | 0.05 | 0.01 | 0.04 | 0.02 | 0.02 | 0.05 | 0.01 |
| Badajoz | 0.89 | 0.36 | 0.20 | 0.07 | 0.03 | 0.07 | 0.05 | 0.01 | 0.15 | 0.03 | 0.02 | 0.13 | 0.02 |
| Caceres | 0.52 | 0.23 | 0.17 | 0.13 | 0.17 | 0.15 | 0.10 | 0.04 | 0.94 | 0.04 | 0.07 | 0.36 | 0.05 |
| Coruña | 0.35 | 0.47 | 0.36 | 0.13 | 0.01 | 0.06 | 0.18 | 0.02 | 0.05 | 0.03 | 0.01 | 0.07 | 0.03 |
| Lugo | 0.28 | 0.33 | 0.22 | 0.13 | 0.06 | 0.08 | 0.41 | 0.04 | 0.07 | 0.05 | 0.03 | 0.14 | 0.03 |
| Ourense | 0.31 | 0.39 | 0.24 | 0.18 | 0.02 | 0.13 | 0.46 | 0.02 | 0.12 | 0.03 | 0.02 | 0.13 | 0.14 |
| Pontevedra | 0.44 | 0.68 | 0.36 | 0.10 | 0.03 | 0.05 | 0.18 | 0.01 | 0.04 | 0.03 | 0.01 | 0.09 | 0.04 |
| Madrid | 0.52 | 0.44 | 0.37 | 0.19 | 0.29 | 0.13 | 0.17 | 0.05 | 0.15 | 0.23 | 0.07 | 0.19 | 0.08 |
| Murcia | 0.54 | 0.20 | 0.19 | 0.06 | 0.02 | 0.07 | 0.06 | 0.03 | 0.04 | 0.03 | 0.02 | 0.06 | 0.02 |
| Navarra | 0.24 | 0.18 | 0.18 | 0.20 | 0.03 | 0.13 | 0.10 | 0.03 | 0.09 | 0.03 | 0.12 | 0.08 | 0.03 |
| Alava | 0.19 | 0.26 | 0.19 | 0.36 | 0.02 | 1.48 | 0.14 | 0.07 | 0.09 | 0.02 | 0.02 | 0.27 | 0.06 |
| Vizcaya | 0.25 | 0.20 | 0.12 | 1.47 | 0.02 | 0.61 | 0.13 | 0.10 | 0.09 | 0.02 | 0.03 | 0.10 | 0.07 |
| Guipuzcoa | 0.24 | 0.18 | 0.12 | 0.23 | 0.01 | 0.20 | 0.06 | 0.08 | 0.10 | 0.03 | 0.03 | 0.11 | 0.04 |
| La Rioja | 0.25 | 0.16 | 0.12 | 0.39 | 0.02 | 0.54 | 0.11 | 0.08 | 0.12 | 0.04 | 0.26 | 0.15 | 0.04 |
| Origin\Destin. | Albacete | C. Real | Cuenca | Guadalajara | Toledo | Barcelona | Girona | Lleida | Tarragona | Alicante | Castellon | Valencia | |
| Almeria | 0.10 | 0.12 | 0.05 | 0.05 | 0.12 | 1.23 | 0.21 | 0.18 | 0.21 | 0.76 | 0.15 | 0.54 | |
| Cádiz | 0.04 | 0.05 | 0.03 | 0.08 | 0.13 | 0.74 | 0.10 | 0.05 | 0.10 | 0.21 | 0.11 | 0.25 | |
| Córdoba | 0.07 | 0.27 | 0.07 | 0.04 | 0.14 | 0.77 | 0.13 | 0.07 | 0.18 | 0.33 | 0.11 | 0.27 | |
| Granada | 0.05 | 0.17 | 0.05 | 0.06 | 0.16 | 1.12 | 0.18 | 0.09 | 0.17 | 0.52 | 0.11 | 0.35 | |
| Huelva | 0.07 | 0.09 | 0.03 | 0.05 | 0.11 | 0.65 | 0.14 | 0.19 | 0.11 | 0.19 | 0.10 | 0.28 | |
| Jaen | 0.17 | 0.32 | 0.07 | 0.12 | 0.21 | 0.85 | 0.24 | 0.12 | 0.20 | 0.56 | 0.11 | 0.45 | |
| Malaga | 0.04 | 0.08 | 0.03 | 0.06 | 0.15 | 0.92 | 0.11 | 0.06 | 0.13 | 0.40 | 0.06 | 0.34 | |
| Sevilla | 0.02 | 0.08 | 0.01 | 0.04 | 0.10 | 0.66 | 0.09 | 0.06 | 0.08 | 0.20 | 0.06 | 0.22 | |
| Huesca | 0.05 | 0.05 | 0.06 | 0.09 | 0.12 | 2.50 | 0.36 | 2.54 | 0.64 | 0.36 | 0.29 | 0.84 | |
| Teruel | 0.09 | 0.04 | 0.17 | 0.20 | 0.13 | 1.91 | 0.15 | 0.40 | 0.84 | 0.52 | 1.90 | 3.26 | |
| Zaragoza | 0.05 | 0.07 | 0.05 | 0.15 | 0.13 | 1.24 | 0.15 | 0.31 | 0.38 | 0.34 | 0.31 | 0.70 | |
| Asturias | 0.02 | 0.03 | 0.01 | 0.06 | 0.08 | 0.59 | 0.08 | 0.06 | 0.13 | 0.27 | 0.08 | 0.24 | |
| Baleares | 0.21 | 0.16 | 0.05 | 0.06 | 0.20 | 2.69 | 0.30 | 0.14 | 0.28 | 1.04 | 0.29 | 1.49 | |
| Palmas, Las | 0.07 | 0.05 | 0.01 | 0.06 | 0.19 | 0.95 | 0.15 | 0.05 | 0.14 | 0.42 | 0.10 | 0.50 | |
| Tenerife | 0.05 | 0.05 | 0.02 | 0.08 | 0.13 | 0.97 | 0.14 | 0.05 | 0.14 | 0.45 | 0.09 | 0.50 | |
| Cantabria | 0.04 | 0.04 | 0.03 | 0.06 | 0.13 | 0.62 | 0.09 | 0.06 | 0.11 | 0.31 | 0.11 | 0.27 | |
| Ávila | 0.04 | 0.10 | 0.07 | 0.21 | 1.47 | 0.51 | 0.06 | 0.07 | 0.17 | 0.78 | 0.10 | 0.57 | |
| Burgos | 0.10 | 0.11 | 0.06 | 0.08 | 0.15 | 0.65 | 0.08 | 0.11 | 0.18 | 0.35 | 0.11 | 0.55 | |
| León | 0.09 | 0.05 | 0.05 | 0.08 | 0.13 | 0.80 | 0.11 | 0.12 | 0.13 | 0.37 | 0.11 | 0.36 | |
| Palencia | 0.05 | 0.05 | 0.03 | 0.05 | 0.18 | 0.80 | 0.10 | 0.04 | 0.08 | 0.47 | 0.09 | 0.30 | |
| Salamanca | 0.07 | 0.10 | 0.02 | 0.12 | 0.22 | 0.79 | 0.13 | 0.10 | 0.10 | 0.43 | 0.10 | 0.46 | |
| Segovia | 0.10 | 0.08 | 0.06 | 0.28 | 0.45 | 0.51 | 0.08 | 0.16 | 0.07 | 0.54 | 0.09 | 0.63 | |
| Soria | 0.06 | 0.06 | 0.04 | 0.55 | 0.33 | 1.23 | 0.13 | 0.15 | 0.22 | 0.37 | 0.29 | 0.57 | |
| Valladolid | 0.09 | 0.05 | 0.02 | 0.09 | 0.17 | 0.58 | 0.06 | 0.04 | 0.15 | 0.40 | 0.10 | 0.39 | |
| Zamora | 0.01 | 0.05 | 0.08 | 0.15 | 0.17 | 0.74 | 0.15 | 0.09 | 0.06 | 0.31 | 0.12 | 0.34 | |
| Albacete | 0.80 | 0.96 | 0.19 | 0.38 | 0.71 | 0.08 | 0.07 | 0.13 | 2.44 | 0.30 | 2.18 | ||
| Ciudad Real | 0.65 | 0.39 | 0.27 | 1.48 | 0.75 | 0.09 | 0.08 | 0.24 | 0.90 | 0.22 | 0.85 | ||
| Cuenca | 2.54 | 1.04 | 0.59 | 1.21 | 0.90 | 0.19 | 0.20 | 0.19 | 0.96 | 0.37 | 4.43 | ||
| Guadalajara | 0.19 | 0.35 | 0.40 | 0.79 | 0.69 | 0.10 | 0.10 | 0.18 | 0.79 | 0.15 | 0.64 | ||
| Toledo | 0.25 | 0.92 | 0.36 | 0.33 | 0.63 | 0.11 | 0.09 | 0.12 | 0.65 | 0.16 | 0.58 | ||
| Barcelona | 0.04 | 0.06 | 0.03 | 0.04 | 0.08 | 1.44 | 0.53 | 1.67 | 0.31 | 0.21 | 0.47 | ||
| Girona | 0.04 | 0.05 | 0.03 | 0.05 | 0.08 | 9.17 | 0.49 | 0.52 | 0.36 | 0.17 | 0.39 | ||
| Lleida | 0.05 | 0.05 | 0.03 | 0.06 | 0.25 | 6.31 | 0.98 | 2.00 | 0.29 | 0.33 | 0.58 | ||
| Tarragona | 0.06 | 0.10 | 0.03 | 0.05 | 0.11 | 8.68 | 0.44 | 0.97 | 0.40 | 0.87 | 0.57 | ||
| Alicante | 0.37 | 0.16 | 0.10 | 0.08 | 0.20 | 1.00 | 0.16 | 0.08 | 0.16 | 0.22 | 2.19 | ||
| Castellon | 0.17 | 0.11 | 0.07 | 0.06 | 0.12 | 1.50 | 0.17 | 0.25 | 0.98 | 0.61 | 3.96 | ||
| Valencia | 0.32 | 0.10 | 0.26 | 0.07 | 0.11 | 0.95 | 0.13 | 0.11 | 0.20 | 1.35 | 0.93 | ||
| Badajoz | 0.06 | 0.21 | 0.06 | 0.11 | 0.36 | 0.83 | 0.16 | 0.04 | 0.12 | 0.25 | 0.09 | 0.26 | |
| Caceres | 0.05 | 0.11 | 0.04 | 0.17 | 1.08 | 0.74 | 0.10 | 0.04 | 0.15 | 0.37 | 0.11 | 0.31 | |
| Coruña | 0.03 | 0.03 | 0.01 | 0.04 | 0.08 | 0.70 | 0.07 | 0.04 | 0.06 | 0.24 | 0.07 | 0.23 | |
| Lugo | 0.01 | 0.02 | 0.02 | 0.04 | 0.08 | 0.85 | 0.06 | 0.04 | 0.17 | 0.21 | 0.05 | 0.19 | |
| Ourense | 0.02 | 0.04 | 0.03 | 0.06 | 0.08 | 0.91 | 0.08 | 0.11 | 0.13 | 0.27 | 0.07 | 0.31 | |
| Pontevedra | 0.02 | 0.01 | 0.01 | 0.04 | 0.07 | 0.67 | 0.05 | 0.04 | 0.06 | 0.18 | 0.04 | 0.20 | |
| Madrid | 0.09 | 0.28 | 0.19 | 0.97 | 2.38 | 0.86 | 0.08 | 0.05 | 0.09 | 0.64 | 0.14 | 0.61 | |
| Murcia | 0.43 | 0.11 | 0.10 | 0.06 | 0.15 | 0.81 | 0.18 | 0.09 | 0.13 | 2.49 | 0.12 | 0.71 | |
| Navarra | 0.03 | 0.04 | 0.02 | 0.04 | 0.08 | 0.83 | 0.08 | 0.10 | 0.13 | 0.31 | 0.13 | 0.32 | |
| Alava | 0.03 | 0.05 | 0.01 | 0.06 | 0.13 | 0.72 | 0.06 | 0.08 | 0.09 | 0.30 | 0.09 | 0.30 | |
| Vizcaya | 0.03 | 0.03 | 0.01 | 0.03 | 0.06 | 0.59 | 0.07 | 0.03 | 0.07 | 0.22 | 0.06 | 0.18 | |
| Guipuzcoa | 0.02 | 0.03 | 0.02 | 0.03 | 0.06 | 0.73 | 0.09 | 0.05 | 0.10 | 0.23 | 0.06 | 0.26 | |
| La Rioja | 0.07 | 0.03 | 0.01 | 0.02 | 0.10 | 0.90 | 0.11 | 0.15 | 0.20 | 0.35 | 0.15 | 0.46 | |
| Origin\Destin. | Badajoz | Caceres | Coruña | Lugo | Ourense | Pontevedra | Madrid | Murcia | Navarra | Alava | Vizcaya | Guipuzcoa | Rioja |
| Almeria | 0.07 | 0.04 | 0.10 | 0.04 | 0.02 | 0.08 | 1.65 | 1.71 | 0.17 | 0.06 | 0.12 | 0.13 | 0.09 |
| Cádiz | 0.16 | 0.07 | 0.35 | 0.02 | 0.02 | 0.11 | 1.95 | 0.35 | 0.11 | 0.07 | 0.13 | 0.08 | 0.05 |
| Córdoba | 0.27 | 0.07 | 0.05 | 0.02 | 0.01 | 0.03 | 1.76 | 0.24 | 0.08 | 0.05 | 0.08 | 0.06 | 0.04 |
| Granada | 0.09 | 0.05 | 0.08 | 0.02 | 0.01 | 0.07 | 1.84 | 0.82 | 0.14 | 0.06 | 0.10 | 0.08 | 0.05 |
| Huelva | 0.42 | 0.13 | 0.07 | 0.02 | 0.03 | 0.09 | 1.28 | 0.20 | 0.08 | 0.03 | 0.08 | 0.07 | 0.08 |
| Jaen | 0.11 | 0.05 | 0.05 | 0.01 | 0.01 | 0.03 | 2.09 | 0.54 | 0.19 | 0.04 | 0.06 | 0.09 | 0.05 |
| Malaga | 0.12 | 0.05 | 0.11 | 0.02 | 0.02 | 0.09 | 1.97 | 0.26 | 0.10 | 0.05 | 0.14 | 0.09 | 0.04 |
| Sevilla | 0.30 | 0.06 | 0.05 | 0.01 | 0.02 | 0.05 | 1.49 | 0.15 | 0.07 | 0.04 | 0.08 | 0.06 | 0.04 |
| Huesca | 0.04 | 0.08 | 0.12 | 0.04 | 0.07 | 0.10 | 1.43 | 0.28 | 0.58 | 0.13 | 0.25 | 0.25 | 0.15 |
| Teruel | 0.12 | 0.04 | 0.07 | 0.05 | 0.03 | 0.10 | 1.10 | 0.21 | 0.39 | 0.08 | 0.12 | 0.07 | 0.16 |
| Zaragoza | 0.09 | 0.04 | 0.12 | 0.03 | 0.04 | 0.12 | 2.12 | 0.31 | 0.69 | 0.12 | 0.20 | 0.14 | 0.28 |
| Asturias | 0.06 | 0.05 | 0.42 | 0.40 | 0.08 | 0.20 | 2.08 | 0.13 | 0.11 | 0.07 | 0.23 | 0.14 | 0.09 |
| Baleares | 0.34 | 0.09 | 0.27 | 0.07 | 0.08 | 0.27 | 2.26 | 0.48 | 0.10 | 0.08 | 0.20 | 0.13 | 0.07 |
| Palmas, Las | 0.11 | 0.06 | 0.46 | 0.07 | 0.09 | 0.48 | 2.03 | 0.29 | 0.11 | 0.07 | 0.18 | 0.14 | 0.07 |
| Tenerife | 0.11 | 0.06 | 0.37 | 0.07 | 0.08 | 0.34 | 2.11 | 0.26 | 0.09 | 0.07 | 0.16 | 0.08 | 0.05 |
| Cantabria | 0.06 | 0.05 | 0.22 | 0.11 | 0.04 | 0.14 | 2.34 | 0.17 | 0.22 | 0.30 | 2.81 | 0.28 | 0.20 |
| Ávila | 0.19 | 0.48 | 0.12 | 0.10 | 0.06 | 0.04 | 13.14 | 0.21 | 0.43 | 0.12 | 0.16 | 0.12 | 0.16 |
| Burgos | 0.06 | 0.10 | 0.18 | 0.07 | 0.08 | 0.15 | 3.12 | 0.15 | 0.35 | 1.46 | 1.73 | 0.29 | 0.57 |
| León | 0.06 | 0.05 | 0.67 | 0.28 | 0.38 | 0.42 | 3.32 | 0.21 | 0.20 | 0.20 | 0.25 | 0.15 | 0.10 |
| Palencia | 0.10 | 0.09 | 0.09 | 0.06 | 0.09 | 0.13 | 2.25 | 0.21 | 0.18 | 0.29 | 0.67 | 0.27 | 0.24 |
| Salamanca | 0.22 | 0.81 | 0.20 | 0.05 | 0.07 | 0.19 | 4.33 | 0.17 | 0.24 | 0.14 | 0.34 | 0.29 | 0.14 |
| Segovia | 0.23 | 0.05 | 0.14 | 0.08 | 0.05 | 0.18 | 10.09 | 0.28 | 0.10 | 0.05 | 0.15 | 0.21 | 0.16 |
| Soria | 0.06 | 0.07 | 0.12 | 0.17 | 0.07 | 0.07 | 4.52 | 0.25 | 1.03 | 0.22 | 0.31 | 0.20 | 0.71 |
| Valladolid | 0.09 | 0.10 | 0.15 | 0.09 | 0.06 | 0.19 | 2.95 | 0.19 | 0.18 | 0.19 | 0.27 | 0.14 | 0.10 |
| Zamora | 0.11 | 0.15 | 0.35 | 0.12 | 0.26 | 0.34 | 3.90 | 0.12 | 0.16 | 0.25 | 0.38 | 0.19 | 0.10 |
| Albacete | 0.11 | 0.06 | 0.09 | 0.01 | 0.02 | 0.09 | 2.29 | 2.07 | 0.12 | 0.05 | 0.12 | 0.06 | 0.04 |
| Ciudad Real | 0.23 | 0.11 | 0.11 | 0.02 | 0.03 | 0.05 | 5.25 | 0.55 | 0.20 | 0.06 | 0.11 | 0.06 | 0.05 |
| Cuenca | 0.14 | 0.05 | 0.04 | 0.06 | 0.01 | 0.06 | 6.87 | 0.64 | 0.17 | 0.08 | 0.09 | 0.10 | 0.06 |
| Guadalajara | 0.22 | 0.17 | 0.18 | 0.07 | 0.03 | 0.10 | 18.93 | 0.36 | 0.20 | 0.14 | 0.25 | 0.07 | 0.09 |
| Toledo | 0.33 | 0.39 | 0.13 | 0.04 | 0.07 | 0.12 | 17.06 | 0.43 | 0.11 | 0.10 | 0.10 | 0.11 | 0.08 |
| Barcelona | 0.12 | 0.06 | 0.12 | 0.08 | 0.06 | 0.11 | 1.13 | 0.21 | 0.11 | 0.04 | 0.12 | 0.08 | 0.05 |
| Girona | 0.17 | 0.05 | 0.10 | 0.03 | 0.04 | 0.07 | 0.70 | 0.26 | 0.11 | 0.06 | 0.09 | 0.10 | 0.03 |
| Lleida | 0.08 | 0.06 | 0.13 | 0.03 | 0.06 | 0.08 | 0.85 | 0.21 | 0.18 | 0.02 | 0.12 | 0.08 | 0.14 |
| Tarragona | 0.10 | 0.09 | 0.14 | 0.07 | 0.04 | 0.07 | 0.83 | 0.26 | 0.16 | 0.04 | 0.12 | 0.10 | 0.10 |
| Alicante | 0.06 | 0.07 | 0.11 | 0.03 | 0.05 | 0.09 | 2.18 | 2.08 | 0.14 | 0.08 | 0.17 | 0.10 | 0.07 |
| Castellon | 0.07 | 0.04 | 0.07 | 0.03 | 0.04 | 0.06 | 1.09 | 0.27 | 0.17 | 0.04 | 0.11 | 0.11 | 0.04 |
| Valencia | 0.05 | 0.04 | 0.09 | 0.02 | 0.03 | 0.06 | 1.41 | 0.37 | 0.10 | 0.05 | 0.10 | 0.08 | 0.05 |
| Badajoz | 1.29 | 0.09 | 0.01 | 0.02 | 0.08 | 2.97 | 0.10 | 0.10 | 0.06 | 0.14 | 0.11 | 0.04 | |
| Caceres | 2.20 | 0.18 | 0.05 | 0.03 | 0.09 | 5.14 | 0.25 | 0.15 | 0.18 | 0.31 | 0.28 | 0.12 | |
| Coruña | 0.03 | 0.03 | 1.06 | 0.51 | 2.03 | 1.73 | 0.20 | 0.09 | 0.04 | 0.15 | 0.10 | 0.05 | |
| Lugo | 0.05 | 0.04 | 4.38 | 1.28 | 1.76 | 1.46 | 0.14 | 0.11 | 0.05 | 0.19 | 0.07 | 0.05 | |
| Ourense | 0.06 | 0.03 | 2.43 | 1.06 | 4.02 | 1.88 | 0.12 | 0.10 | 0.15 | 0.29 | 0.15 | 0.04 | |
| Pontevedra | 0.06 | 0.02 | 2.45 | 0.50 | 1.13 | 1.57 | 0.12 | 0.09 | 0.06 | 0.12 | 0.10 | 0.05 | |
| Madrid | 0.22 | 0.24 | 0.25 | 0.07 | 0.07 | 0.21 | 0.33 | 0.14 | 0.06 | 0.19 | 0.13 | 0.08 | |
| Murcia | 0.04 | 0.04 | 0.17 | 0.04 | 0.02 | 0.06 | 1.67 | 0.31 | 0.09 | 0.12 | 0.11 | 0.09 | |
| Navarra | 0.06 | 0.05 | 0.14 | 0.04 | 0.04 | 0.08 | 1.78 | 0.24 | 0.45 | 0.58 | 1.28 | 1.21 | |
| Alava | 0.05 | 0.10 | 0.10 | 0.03 | 0.10 | 0.11 | 1.45 | 0.10 | 0.72 | 3.22 | 1.50 | 1.18 | |
| Vizcaya | 0.06 | 0.06 | 0.17 | 0.06 | 0.07 | 0.12 | 1.23 | 0.12 | 0.34 | 0.94 | 1.10 | 0.25 | |
| Guipuzcoa | 0.10 | 0.12 | 0.16 | 0.04 | 0.08 | 0.13 | 1.18 | 0.15 | 1.20 | 0.86 | 1.83 | 0.23 | |
| La Rioja | 0.10 | 0.07 | 0.16 | 0.05 | 0.04 | 0.12 | 2.03 | 0.24 | 2.66 | 1.22 | 0.94 | 0.45 |
References
- Álvarez, Maximiliano, and Vicente Royuela. 2020. The Effect of Labour-Market Differentials on Inter-Regional Migration in Spain: A Meta-Regression Analysis. New York: Mimeo. [Google Scholar]
- Antolín, Pablo, and Olympia Bover. 1997. Regional migration in Spain: The effect of personal characteristics and of unemployment, wage and house price differentials using pooled cross-sections. Oxford Bulletin of Economics and Statistics 59: 215–35. [Google Scholar] [CrossRef]
- Artís, Manuel, Javier Romaní, and Jordi Suriñach. 2000. Determinants of individual commuting in Catalonia, 1986–91: Theory and empirical evidence. Urban Studies 37: 1431–50. [Google Scholar] [CrossRef]
- Bande, Roberto, Melchor Fernández, and Victor Montuenga. 2008. Regional unemployment in Spain: Disparities, business cycle and wage setting. Labour Economics 15: 885–914. [Google Scholar] [CrossRef]
- Bande, Roberto, Melchor Fernández, and Victor Montuenga. 2012. Wage flexibility and local labour markets: A test on the homogeneity of the wage curve in Spain. Investigaciones Regionales-Journal of Regional Research 24: 175–98. [Google Scholar]
- Bande, Roberto, Marika Karanassou, and Héctor Sala. 2019. Employment in Spanish regions: Cost-control or growth-enhancing policies? Annals of Regional Science 62: 601–35. [Google Scholar] [CrossRef]
- Bentolila, Samuel, and Juan J. Dolado. 1991. Mismatch and Internal Migration in Spain, 1962–1986. In Mismatch and Labour Mobility. Edited by Fiorella Padoa Sebioppa and La Sapienza. Cambridge: Cambridge University Press, pp. 182–234. [Google Scholar]
- Bruna, Fernando, Jesús López-Rodríguez, and Andrés Faíña. 2016. Market potential, spatial dependences and spillovers in European regions. Regional Studies 50: 1551–63. [Google Scholar] [CrossRef]
- Clemente, Jesús, Gemma Larramona, and Lorena Olmos. 2016. Interregional migration and thresholds: Evidence from Spain. Spatial Economic Analysis 11: 276–93. [Google Scholar] [CrossRef]
- Crescenzi, Riccardo, Marco Di Cataldo, and Alessandra Faggian. 2018. Internationalized at work and localistic at home: The ‘split’ Europeanization behind Brexit. Papers in Regional Science 97: 117–32. [Google Scholar] [CrossRef]
- Cushing, Brian, and Jacques Poot. 2003. Crossing boundaries and borders: Regional science advances in migration modelling. Papers in Regional Science 83: 317–38. [Google Scholar] [CrossRef]
- Devillanova, Carlo, and Walter García Fontes. 2004. Migration across Spanish provinces: Evidence from the social security records (1978–1992). Investigationes Económicas 23: 461–87. [Google Scholar] [CrossRef]
- Ghatak, Subrata, Paul Levine, and Stephen Wheatley Price. 1996. Migration theories and evidence: An assessment. Journal of Economic Surveys 10: 159–98. [Google Scholar] [CrossRef]
- Greenwood, Michael J. 1975. Research on internal migration in the United States: A survey. Journal of Economic Literature 13: 397–433. [Google Scholar]
- Greenwood, Michael J. 1997. Internal Migration in Developed Countries. In Handbook of Population and Family Economics, Volume 1B. Edited by Mark R. Rosenzweig and Oded Stark. Amsterdam: Elsevier, pp. 647–720. [Google Scholar]
- Gutiérrez-Portilla, María, Adolfo Maza, and María Hierro. 2018. Foreigners versus natives in Spain: Different migration patterns? Any changes in the aftermath of the crisis? Annals of Regional Science 61: 139–59. [Google Scholar] [CrossRef]
- Harris, John N., and Michael P. Todaro. 1970. Migration, unemployment and development: A two-sector analysis. The American Economic Review 60: 126–42. [Google Scholar]
- Hierro, María, Adolfo Maza, and José Villaverde. 2019. Internal migration dynamics in Spain: Winners and losers from the recent economic recession. Population, Space and Place 25: e2176. [Google Scholar] [CrossRef]
- Juarez, Juan P. 2000. Analysis of interregional labor migration in Spain using gross flows. Journal of Regional Science 40: 377–99. [Google Scholar] [CrossRef]
- King, Russell, and Ronald Skeldon. 2010. ‘Mind the gap!’ Integrating approaches to internal and international migration. Journal of Ethnic and Migration Studies 36: 1619–46. [Google Scholar] [CrossRef]
- Lee, Everett S. 1966. A theory of migration. Demography 3: 45–57. [Google Scholar] [CrossRef]
- Liu, Lucy Qian. 2018. Regional Labor Mobility in Spain (No. 18/282). Washington, DC: International Monetary Fund. [Google Scholar]
- Martí, Mónica, and Carmen Ródenas. 2020. Measurement errors in geographical labour mobility using data linkage: The Spanish case. International Journal of Social Research Methodology. Forthcoming. [Google Scholar]
- Massey, Douglas S., Joaquin Arango, Graeme Hugo, Ali Kouaouci, Adela Pellegrino, and J. Edward Taylor. 1993. Theories of international migration: A review and appraisal. Population and Development Review 19: 431–66. [Google Scholar] [CrossRef]
- Mayda, Ana M. 2010. International migration: A panel data analysis of the determinants of bilateral flows. Journal of Population Economics 23: 1249–74. [Google Scholar] [CrossRef]
- Maza, Adolfo. 2006. Migrations and regional convergence: The case of Spain. Jahrbuch Fur Regionalwissenschaft/Review of Regional Research 26: 191–202. [Google Scholar] [CrossRef]
- Maza, Adolfo, and Ignacio Moral-Arce. 2006. An analysis of wage flexibility: Evidence from the Spanish regions. Annals of Regional Science 40: 621–37. [Google Scholar] [CrossRef]
- Maza, Adolfo, and José Villaverde. 2004a. Determinantes de la migración interregional en España: Nuevas técnicas de análisis. Investigaciones Regionales-Journal of Regional Research 4: 133–42. [Google Scholar]
- Maza, Adolfo, and José Villaverde. 2004b. Interregional migration in Spain: A semiparametric analysis. Review of Regional Studies 34: 156–71. [Google Scholar]
- Maza, Adolfo, and José Villaverde. 2008. A note on the need to account for spatial dependence: A case of migratory flows in Spain. Review of Regional Studies 38: 105–11. [Google Scholar]
- Maza, Adolfo, and José Villaverde. 2009. Provincial wages in Spain: Convergence and flexibility. Urban Studies 46: 1969–93. [Google Scholar] [CrossRef]
- Maza, Adolfo, José Villaverde, and María Hierro. 2013. Explaining the settlement patterns of foreigners in Spain. Applied Geography 40: 11–20. [Google Scholar] [CrossRef]
- Maza, Adolfo, María Gutiérrez-Portilla, María Hierro, and José Villaverde. 2019. Internal migration in Spain: Dealing with multilateral resistance and nonlinearities. International Migration 57: 75–93. [Google Scholar] [CrossRef]
- Melguizo, Celia, and Vicente Royuela. 2020. What drives migration moves to urban areas in Spain? Evidence from the Great Recession. Regional Studies. Forthcoming. [Google Scholar] [CrossRef]
- Mulhern, Alan, and John G. Watson. 2009. Spanish internal migration: Is there anything new to say? Spatial Economic Analysis 4: 103–20. [Google Scholar] [CrossRef]
- Palomares-Linares, Isabel, and Maarten van Ham. 2020. Understanding the effects of homeownership and regional unemployment levels on internal migration during the economic crisis in Spain. Regional Studies 54: 515–26. [Google Scholar] [CrossRef]
- Partridge, Mark D., and Dan S. Rickman. 2003. The waxing and waning of US regional economies: The chicken-egg of jobs versus people. Journal of Urban Economics 53: 76–97. [Google Scholar] [CrossRef]
- Petersen, William. 1969. Population, 2nd ed. New York: Macmillan. [Google Scholar]
- Plane, David A., and Christopher Bitter. 2005. The role of migration research in regional science. Papers in Regional Science 76: 133–53. [Google Scholar] [CrossRef]
- Ramos, Raúl. 2016. Gravity models: A tool for migration analysis. IZA World of Labor 2016: 239. [Google Scholar] [CrossRef]
- Ramos, Raúl, and Jordi Suriñach. 2017. A gravity model of migration between ENC and EU. Tijdschrift Voor Economische en Sociale Geografie/Journal of Economic and Social Geography 108: 21–35. [Google Scholar] [CrossRef]
- Ravenstein, Ernst G. 1885. The laws of migration. Journal of the Statistical Society 46: 167–235. [Google Scholar] [CrossRef]
- Ravenstein, Ernst G. 1889. The laws of migration: Second paper. Journal of the Royal Statistical Society 52: 241–305. [Google Scholar] [CrossRef]
- Redding, Stephen, and Anthony J. Venables. 2004. Economic geography and international inequality. Journal of International Economics 62: 53–82. [Google Scholar] [CrossRef]
- Ródenas, Carmen. 1994. Migraciones interregionales en España (1960–1989): Cambios y barreras. Revista de Economía Aplicada 64: 361–75. [Google Scholar]
- Ródenas, Carmen, and Mónica Martí. 2009. Estimating false migrations in Spain. Population 4: 5–36. [Google Scholar]
- Royuela, Vicente, and Jessica Ordóñez. 2018. Internal migration in a developing country: A panel data analysis of Ecuador (1982–2010). Papers in Regional Science 87: 345–67. [Google Scholar] [CrossRef]
- Sjaastad, Larry A. 1962. The costs and returns of human migration. Journal of Political Economy 70: 80–93. [Google Scholar] [CrossRef]
- Todaro, Michael P. 1969. A model of labor migration and urban unemployment in less developed countries. The American Economic Review 59: 138–48. [Google Scholar]
- Todaro, Michael P. 1980. Internal Migration in Developing Countries: A Survey. In Population and Economic Change in Developing Countries. Edited by Richard A. Easterlin. Chicago: University of Chicago Press, pp. 361–402. [Google Scholar]
- Wolpert, Julian. 1965. Behavioral aspects of the decision to migrate. Journal of Regional Science 15: 159–69. [Google Scholar] [CrossRef]
| 1 | I consider the age of 34 as the limit between youth and adulthood because this is done in many papers regardless of the topic; see, for example, Crescenzi et al. (2018) when dealing with the causes of Brexit. |
| 2 | Leaving aside the possibility of using data at municipal level, since we do not have enough information regarding the potential migration determinants for each municipality. |
| 3 | Following the recommendations of a reviewer, I also included interaction variables (income, unemployment and climate, all of them individually with distance), but these interaction variables turned out to be, in all cases, non-significant. Therefore, the importance of these factors does not seem to change with distance. |
| 4 | Although this choice is arguable, I include ratios in the model because, when making a decision, potential migrants compare variables in origin and all the potential destinations. |
| 5 | The results obtained by Ordinary Least Squares with robust standard errors are roughly the same. |
| 6 | As can be seen, the income coefficient is higher for short- than for long-distance migration. In any case, the short-distance coefficient is borderline significant and does not differ from the long-distance coefficient according to the Wald test. |


| Independent Variables | Coefficient | t-Student |
|---|---|---|
| Income (Inc) | 0.0520 * | 2.89 |
| Unemployment rate (UR) | −0.0128 * | −3.40 |
| Housing prices (HP) | −0.0067 | −0.86 |
| Climate (CL) | 0.0208 | 0.95 |
| Distance (Dist) | −0.0009 * | −17.78 |
| Origin provinces 1 | ||
| Palmas, Las | 1.0844 * | 8.59 |
| Tenerife | 1.0622 * | 8.39 |
| Girona | 0.3254 * | 2.91 |
| Guadalajara | 0.2363 ** | 2.13 |
| Baleares | 0.2161 *** | 1.95 |
| Tarragona | 0.2032 *** | 1.83 |
| Lleida | 0.1927 *** | 1.74 |
| Destination provinces 1 | ||
| Madrid | 2.1674 * | 19.51 |
| Barcelona | 0.9503 * | 8.54 |
| Palmas, Las | 0.9307 * | 7.37 |
| Tenerife | 0.8816 * | 6.96 |
| Valencia | 0.2040 *** | 1.84 |
| Number of observations | 26,950 | |
| R-square | 0.40 | |
| Independent Variables | Youth | Adulthood | ||
|---|---|---|---|---|
| Coefficient | t-Student | Coefficient | t-Student | |
| Income (Inc) | 0.0112 | 0.92 | 0.0426 * | 4.84 |
| Unemployment rate (UR) | −0.0044 *** | −1.71 | −0.0082 * | −4.49 |
| Housing prices (HP) | −0.0019 | −0.35 | −0.0049 | −1.30 |
| Climate (CL) | −0.0084 | −0.57 | 0.0299 * | 2.81 |
| Distance (Dist) | −0.0004 * | −17.91 | −0.0004 * | −17.54 |
| Origin provinces 1 | ||||
| Palmas, Las | 0.5506 * | 8.54 | 0.5339 * | 8.57 |
| Tenerife | 0.5385 * | 8.33 | 0.5239 * | 8.39 |
| Girona | 0.1574 * | 2.76 | 0.1681 * | 3.05 |
| Guadalajara | 0.1150 ** | 2.03 | 0.1206 ** | 2.20 |
| Baleares | 0.1084 *** | 1.91 | 0.1078 ** | 1.97 |
| Cádiz | 0.1014 *** | 1.77 | - | - |
| Lleida | 0.0975 *** | 1.72 | 0.0953 *** | 1.74 |
| Almeria | 0.0946 *** | 1.66 | - | - |
| Tarragona | - | - | 0.1124 ** | 2.05 |
| Destination provinces 1 | ||||
| Madrid | 1.2449 * | 21.96 | 0.9220 * | 16.83 |
| Barcelona | 0.5274 * | 9.29 | 0.4227 * | 7.70 |
| Palmas, Las | 0.4793 * | 7.42 | 0.4519 * | 7.25 |
| Tenerife | 0.4531 * | 7.00 | 0.4289 * | 6.86 |
| Valencia | 0.1047 *** | 1.85 | 0.0994 *** | 1.82 |
| Number of observations | 26,950 | 26,950 | ||
| R-square | 0.44 | 0.36 | ||
| Independent Variables | Short-Distance Movements | Long-Distance Movements | ||
|---|---|---|---|---|
| Coefficient | t-Student | Coefficient | t-Student | |
| Income (Inc) | 0.2490 ** | 1.97 | 0.0565 * | 3.69 |
| Unemployment rate (UR) | −0.0030 | −0.09 | −0.0109 * | −3.45 |
| Housing prices (HP) | −0.4870 * | −8.14 | 0.0281 * | 4.32 |
| Climate (CL) | −0.2771 | −1.43 | 0.0362 ** | 1.99 |
| Distance (Dist) | −0.0048 * | −5.00 | −0.0003 * | −17.45 |
| Origin provinces 1 | ||||
| Guadalajara | 1.3232 ** | 2.58 | - | - |
| Teruel | 1.1687 ** | 2.28 | - | - |
| Huesca | 1.2898 ** | 2.09 | - | - |
| Palmas, Las | - | - | 0.4217 * | 10.68 |
| Tenerife | - | - | 0.3868 * | 9.76 |
| Baleares | - | - | 0.1977 * | 6.13 |
| Destination provinces 1 | ||||
| Madrid | 9.2419 * | 16.16 | 1.5059 * | 45.01 |
| Barcelona | 5.4020 * | 8.00 | 0.6888 * | 20.89 |
| Valencia | 1.0795 ** | 1.85 | 0.2177 * | 6.54 |
| Palmas, Las | - | - | 0.4611 * | 11.61 |
| Tenerife | - | - | 0.4078 * | 10.24 |
| Baleares | - | - | 0.2283 * | 7.05 |
| Alicante | - | - | 0.2227 * | 6.67 |
| Malaga | - | - | 0.1714 * | 5.04 |
| Cádiz | - | - | 0.1181 * | 3.50 |
| Murcia | - | - | 0.0978 * | 2.93 |
| Coruña, A | - | - | 0.0940 * | 2.86 |
| Sevilla | - | - | 0.0947 * | 2.80 |
| Number of observations | 2453 | 24,497 | ||
| R-square | 0.88 | 0.76 | ||
© 2020 by the author. Licensee MDPI, Basel, Switzerland. This article is an open access article distributed under the terms and conditions of the Creative Commons Attribution (CC BY) license (http://creativecommons.org/licenses/by/4.0/).
Share and Cite
Maza, A. Internal Migration in Spain: A Complementary Approach. Economies 2020, 8, 59. https://doi.org/10.3390/economies8030059
Maza A. Internal Migration in Spain: A Complementary Approach. Economies. 2020; 8(3):59. https://doi.org/10.3390/economies8030059
Chicago/Turabian StyleMaza, Adolfo. 2020. "Internal Migration in Spain: A Complementary Approach" Economies 8, no. 3: 59. https://doi.org/10.3390/economies8030059
APA StyleMaza, A. (2020). Internal Migration in Spain: A Complementary Approach. Economies, 8(3), 59. https://doi.org/10.3390/economies8030059