Article

Direct Effect of TC on the LME Copper Prices

1
Korea Housing Finance Corporation, Pusan 48400, Korea
2
Public Procurement Service, Daejeon 35208, Korea
*
Author to whom correspondence should be addressed.
Economies 2020, 8(2), 36; https://doi.org/10.3390/economies8020036
Submission received: 23 March 2020 / Revised: 28 April 2020 / Accepted: 4 May 2020 / Published: 7 May 2020

Abstract

:
The motivation of this paper is to identify the effect of treatment charge (TC) on LME (London Metal Exchange) copper prices. It is a fundamental variable as a supply side factor, because it is related to the smelting process and reflects the level of concentrates market tightness. To examine this question carefully, the regression model is applied. This paper finds a statistically significant negative link between TC and LME copper prices. It is found that a 10% increase in TC of copper decreases in copper return by 1.8%. Subsequently, the vector autoregression (VAR) model is introduced to consider the impact of TC to copper prices as a permanent effect. It is found that the negative impact of the TC to copper returns dies out quickly. The statistical estimation in this article will provide a good reference for future study.
JEL Classification:
C3; G1

1. Introduction

Mining companies are beginning to embrace innovations including digitization, automation and environmental, social and governance (ESG) considerations going forward. Nevertheless, that classical mining process it is still essential. Smelters in metal industry face a somewhat similar trend but essential process is same. TC (treatment charge) is one of the key smelting process factors within the metal industry. They are known by negotiated fees that may link to metal prices. Within market practices, the miner or seller should pay the TC to a smelter as a concession on cost of the metal concentrate. TC is important and seems like a positive operating margin element for the smelters, while it seems to be a negative operating margin element for mines. Most global sell-side brokers such as JP Morgan, Macquarie and Marex Spectron highlight the variation of TC in the London Metal Exchange (LME) market1, especially in copper, to focus on market trading momentum as a key factor, because it reflects current copper industry fundamentals. The motivation of this paper is to examine the potential impact of TC on copper prices. The variable of TC is a supply side factor, which depends upon the changes in industry quantity of copper mine. We believe that the market participants, such as producers, financial investors and SWAP dealers, are affected by variations of TC. The copper TC is a function of the quantity of copper mines and it ends up with potential changes in copper prices going forward. Park and Lim (2018) found that global copper price had boomed over the past two decades, with secular increase in China demands despite robust rise in copper concentrates.
Indeed, one of crucial variables for TC is metal price itself. If metal price is less than its cost curve, then mining companies will close the mine due to earnings deterioration. We have seen recently a number of closures among smaller smelters in China, as a result of declining TC or the environmental regulation of the Chinese government. On the other hand, if metal price is increasing, then mining companies will increase their operating rate of mining capacity. Higher metal concentrates can generate somewhat higher TC. Put in another way, higher spot TC reflects market expectations of a tight metal concentrate industry under no changes in smelter capacity, which can have a negative impact on metal price.
A rise in TC suggests stronger market supply for the metal and deliveries thereof. The TC is the significant barometer to the investors2, there is an inverse relationship between TC and metal prices, as movement in smelting industry affect the price direction. A sharp rise in TC implies the supply is rising. Table 1 exhibits the possible stylized fact, which is related to dynamics between the TC direction and the metal price direction. The rise in metal concentrates or increase in TC suggests a negative direction for metal price, while a fall in metal concentrates or a decrease in TC implies a positive trend for metal price.
Even though TC is an important signal for market demand/supply fundamentals, the TC as a variable is difficult to identify because they are determined by negotiated process between mining companies and smelting companies. We believe that this is the main reason for there being no previous study within this area.
On a weekly basis, Bloomberg of Metal Bulletin reports the TC3 for copper via market survey. This is survey data, so that it is different from market trading data, such as closing copper price. In particular, copper is produced through two major processes: the smelting/refining route accounts for 80% of all global copper output, while the SX-EW (solvent extraction and electrowinning) route accounts for 20%. Notice that smelters/refiners receive a treatment and refining charge from the miners for their services. This paper focuses on only 80% of global copper output.
The speculative investors want to carefully monitor the variations of industry TC because they would like to evaluate the industry supply pressure. These sequential investors’ reactions have been strengthening through the market expectation, with the speculation trading action of commodity funds. This may convince traders, analysts and index investors who have attributed metal price direction to speculation that the fundamentals have indeed been improving (Park 2019b). The question may be arising: What is the relationship between TC and price in copper price? We develop my hypothesis as the follows:
Hypothesis 1 (H1). 
The rise in TC is associated with the copper price lower.
We consider the variables; the first is the copper TC, and the second is an LME copper price movement. Unfortunately, there is no previous study in the TC area, to the best of my knowledge. The purpose of this paper is to test the above hypothesis using weekly smelting industry data and LME market data from January 2017 to December 2019. This study exhibits a regression model and finds a statistically significant link between copper TC and LME copper price. Through the empirical testing result, copper is found to hold the hypothesis. Using the VAR (vector autoregression) model, it is found that the impact of a TC innovation on spot returns of copper reveals it to be transitory rather than permanent.
The paper is organized as follows. Section 2 reviews the previous literature on the LME-related area. In Section 3, we provide the research model and data with a summary of statistics and a unit root test. Section 4 presents the main results. In the final section, we provide the summary and conclusion.

2. Literature Review

There is no direct rigorous previous study of TC issue in LME and even other commodity markets. As far as we are aware, no causal research has been exhibited on the relationship. Nobody can have foreseen the speed and extent to which the TC will impact the copper market, even though the process of mining and smelting has not been changed. The CRU, as an independent authority in the metal industry, investigated the copper concentrates TC since mid-2010. They launched the TC/RC (Refining Charge) indices since 2013, but they did not provide rigorous research in this area. In 2013, Fastmarkets’ copper concentrate index was launched to track the industry behavior. They argued that the misalignments with copper concentrate market ultimately cause inefficiencies, because they send delayed signals to the market.
Diaz-Borrego et al. (2019) was to provide a forecasting econometric tool for benchmark copper TC/RC annual index. They suggested an applicable forecasting framework to project potential levels of critical discounts to be applied to the copper concentrates valuation process. They showed that the LES (linear exponential smoothing) model revealed the best predictive power to analyze the period from 2004 to 2017. They gave good discussion of the overall smelting process. They argued that copper ores undergo a strict process known as froth-flotation to obtain concentrates containing 30% of copper. Concentrates are later smelted and refined to produce high-purity copper cathodes and other by-products.

3. Research Model and Data

3.1. Regression Model

When examining the effect of TC on LME copper spot price, I developed a simple empirical framework. In its basic form, the following model determines the spot copper price returns of LME, with respect to the TC:
SR t = β 0 + β 1 TC t + ε t
where SR t is the natural logarithm of the spot copper price return against the previous week; and TC t is the natural logarithm of treatment charge against the previous week in the smelting industry; ε t is the vector of independent and identically distributed (i.i.d.) errors of each of the SR t s. If rising TC tends to encourage the investment momentum downward, then β 1 < 0 is expected. Given the fact that LME investors tend to view TC as a key variable, commodity funds are likely to have a significant influence on LME spot copper price.

3.2. Data

Weekly data relating to the period of January 2017 to December 2019 are used for estimating Equation (1), providing N = 155 observations through Bloomberg.4 The Bloomberg data (ticker: ZACNITHE) reflect the China copper ore market. This data comprise of spot TC prices data considering Asian Metal Inc. data on every Friday. Figure 1 provides the weekly price behavior in copper prices and TC over the sample period. The figure implies a somewhat negative relationship between copper prices and TC.
To measure the effect of smelting charges, the TC is used as a log of percent changes against the previous week. Table 2 presents the descriptive statistics of returns and TC. It is found that both the returns and TC are strongly leptokurtic. The skewness and kurtosis measures show that the returns and TC percent changes distributions are asymmetric and fat-tailed, which is known as excess kurtosis. The Jarque–Bera statistics in Table 2 are for checking normal distribution, which reveal no normal distributed data within the considered data set. The conclusion for the data finds that the distributions for returns and TC are skewed and fat-tailed.

3.3. Stationarity Check: Unit Root Tests

To test the stationarity of the variables, this paper employs the ADF (augmented Dickey–Fuller) test and Phillip–Perron (PP) test, which are given in Table 3. Table 3 reports the unit root tests for all the variables (null hypothesis: there is a unit root). The variables of returns and TC percent changes data have no unit root, therefore cannot be converted to stationary by taking the first difference. All the data employ the level.

4. Results

The main objective of this paper is to identify whether the TC helps to explain the extent to which LME copper price moves in an inverse direction to TC. The role of copper spot prices is mainly addressed through forward contracts in the LME market. The movement of spot prices gives the key implication of copper price levels for producers, demanders and speculative investors. Spot prices are known to be primarily affected by supply and demand, which is the main market fundamental environment. This paper exhibits the impact of commodity funds’ activities through the TC changes in LME copper market under Park (2019a) research framework.
Weekly data relating to the period over January 2017 to December 2019 are used for estimating Equation (1). Weekly data can appropriately capture the arbitrage possibilities in the LME market (Park 2019a).

4.1. Empirical Regression Results

In this section, we test whether changes in TC have a negative effect on LME copper prices based on a research hypothesis. Our primary interest is in what happens to the coefficient on TC increases SR t in Table 4. Figure 2 exhibits the plot of residual of regression result of Table 1, which can assess that the residual is consistent with stochastic error. In particular, the residual plot in Figure 2 seems to consist of a narrow horizontal band of point. The estimated elasticity of TC decreases is 0.18, indicating that the immediate 1.8% decreases in copper return gives a 10% increase in its TC. This is strongly significant with t-statistics −2.1 and verifies a negative relationship between TC and copper price. This implies that the somewhat lower TC gives an impact on the copper prices, to motivate the commodity funds, to boost speculative investment sentiments. The negative effect of TC on copper prices indicates somewhat possible excess returns when investors consider TC as a significant variable. For example, the rise in spot TC for copper concentrate gives a meaningful implication to the speculative investors as massive refine copper supply is coming to the market. Therefore, we conclude that TC negatively strengthens the copper price direction.
The negative relationship between TC and copper price is caused by the interface between miners and smelters. Taking a closer look into upstream dynamics on the copper concentrates market, treatment charge is a good fundamental indicator. Oversupplied concentrates in the copper mine increase smelting capacity utilization, which increases TC and refines copper quantity quickly. This stylized fact intensifies speculative investment flows, such as hedge funds and commodity funds, so that LME copper price is affected by this market expectation (Park 2019b). The rigorous negative relationship may give commodity traders arbitrage possibilities.
Indeed, Tang and Xiong (2012) proved that the financialization by global institutional investors affected the market comovement across commodity markets and even equity market, in terms of global financial market comovement. Park and Lim (2018) found that the LME futures market was inefficient because the financialization of commodities had been growing. Park (2019b) presented statistically significant evidence that the position changes of speculators unidirectionally Granger-cause the prices of LME base metals, such as aluminum, copper and zinc. Guzman and Silva (2018) reported that the financialization of commodity appears to have a direct impact on the spot copper price, considering market liquidity as a non-fundamentals variable within VAR analysis. Koitsiwe and Adachi (2018) argued that the recent rise and fall in commodity prices were not determined by only the classical fundamental factors of supply and demand, which gave another example of financialization in commodity market. These previous studies in LME gave a hint for financialization effect on market price direction and proved possible abnormal returns.5 We believe that TC is one of the important key indicators for the LME investors to drive financial speculation into the market.
Even though there was a somewhat broad consensus that market fundamentals such as physical supply and demand in commodity explained market price variations, particularly long term, some dissent had arisen about the role played by non-fundamentals, such as market liquidity. Recent research papers explored the relationship between market speculation and commodity prices via financialization. In particular, Koitsiwe and Adachi (2018) found that LME copper prices have been characterized by structural changes in the period 1993–2016. They insisted that financial speculation accentuated copper price fluctuations over the last decade. Guzman and Silva (2018) found that liquidity and other macroeconomic variables were very important to evaluate the level of copper prices and their fluctuations, although the fundamentals were quite relevant over the sample periods. It is found that the empirical results of this paper support the implications of recent research results.

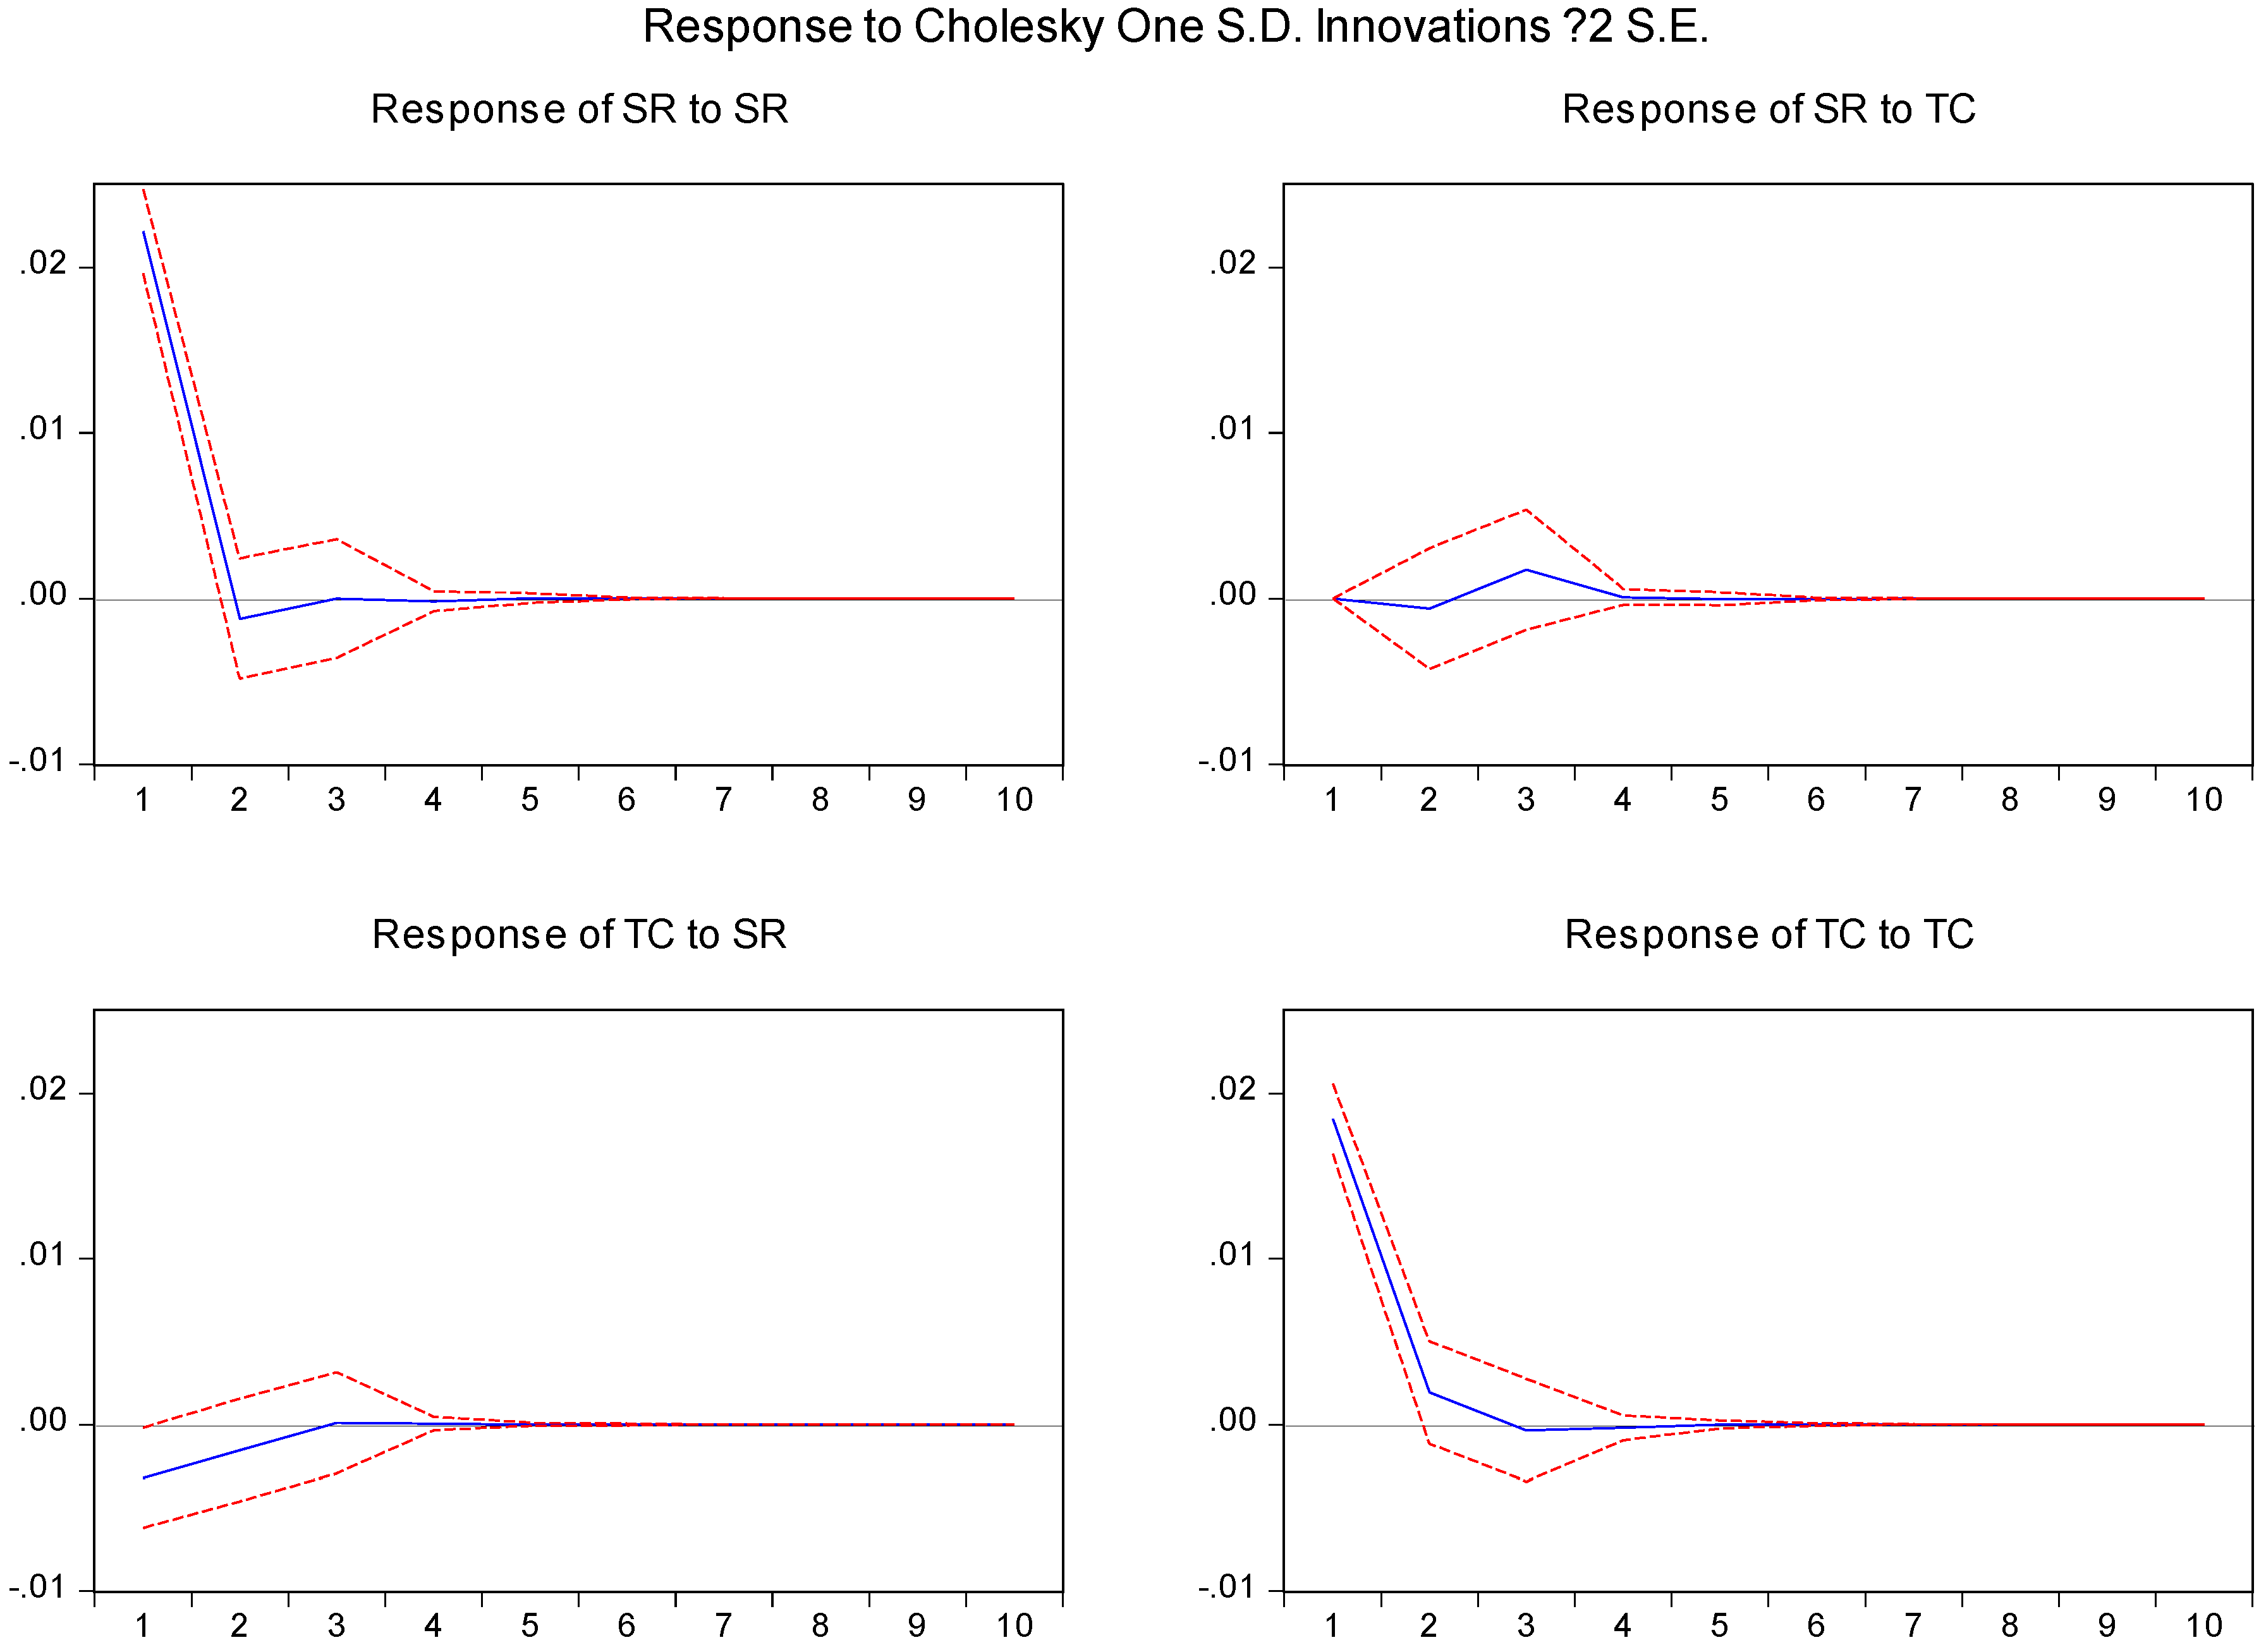
4.2. VAR Model Specification and Impulse Response Results

To investigate the impact of TC on copper price returns in a dynamic manner, a VAR model is developed under the Park (2019a) research framework in this section. In order not to impose a priori, a theory of causality between the variables, a non-structural VAR is used. The VAR is a seemingly unrelated regression model with the same explanatory variables in each equation, when there are no constraints placed on the coefficients. The VAR is a stochastic process model to capture the linear interdependencies among time series data. Each variable within the VAR model depends upon its own lagged values and the lagged values of the other model variables. The p-th order VAR is
Y t = c + i = 1 p i Y t 1 + ε t
where Y t = ( SR t ,   TC t ) , a vector of spot returns of copper, and TC of copper, respectively. P is the lag orders, which6 are 2 in this model. The i is a time-invariant 2 × 2 matrices of coefficients, c is a 2 × 1 vector of constants, and ε t is a 2 × 1 vector of white noise innovations.
Since all variables in a VAR model depend on each other, individual coefficient estimates only provide limited information on reaction to a shock. To get a clear picture of the model’s dynamics, impulse responses (IR) are used. Rewriting and inverting Equation (2) allows Y t to be expressed as an infinite order moving average representation, i.e.,
Y t = i = 0 θ i τ ϵ t 1
where each θ i is the 2 × 2 matrix of coefficients, τ ϵ t i = ε t i , τ τ is a factorization of the covariance matrix of ε t , and ϵ t i is a matrix of orthogonalized innovations. This Equation (3) can be used to identify the dynamic response of spot returns to the TC shocks, which is the impulse response function (g):
g j = Y t ε t j
The VAR shown in Equation (2) is estimated through the Eviews 7 software. The results for parameters as well as for some statistics are not reported in this paper, but exhibit the impulse response results. The impulse responses to spot returns to TC shock are shown in Figure 3. The impact of a TC shock on spot returns of copper has second period negative effects. The negative effect on copper returns holds for the contemporaneous and only the first two lags. Following an increase in the TC, the negative effect on spot returns of a TC shocks converges to zero after the second period.

5. Conclusions

Accurate assessment of TC in copper prices is the motivation of this study to improve the expectation, as it is an increasingly important role in LME. We argue that TC is one of the key factors for pricing LME copper, so that it may give commodity traders arbitrage opportunities. As the main contribution, this paper proposes a regression framework to test the hypothesis. This study establishes a hypothesis concerning whether the rise in TC is associated with the LME copper prices being lower. The TC variable is crucial, because it encompasses both of the two factors within a market, such as fundamentals and non-fundamentals. It is a fundamental variable, because it is related to the smelting process and results. It is also a non-fundamental variable, because it deals with global sell-side brokers’ reports and affects institutional investors’ speculation sentiments, such as CTA (Commodity Trading Advisor).
This paper exhibits the question of whether TC has a negative effect on LME copper prices. Using three years of weekly data, first, this paper finds a statistically significant negative link between TC and LME copper prices. It is found that a 10% increase in TC of copper decreases in copper return by 1.8%. We conclude that TC strengthens the copper spot prices lower. Second, in order to further analyze the impact of TC to copper prices, the impulse response to a unit TC shock shows that the negative impact of the copper returns is transitory rather than permanent, so that the effect of a unit shock in TC eventually converges to zero. Indeed, after the second period, the negative effect on copper spot returns of a TC innovation dies out quickly. The usefulness and novelty of this research is considering the TC variable within LME. This is first time and somewhat robust result. The estimation in this paper will provide a reference for related issues.
In the light of these results, it is very probable to test the effect of TC changes among other LME metals, such as aluminum, zinc, tin, lead and nickel, even though collecting the data is somewhat difficult.

Author Contributions

Each author contributed equally to the research article. All authors have read and agreed to the published version of the manuscript.

Funding

This research received no external funding.

Acknowledgments

Jaehwan Park conceived and developed the research design. Hyeon Sook Kim and Byungkwon Lim collected and analyzed the data and gave useful comments.

Conflicts of Interest

The authors declare no conflict of interest.

References

  1. Canarella, Giorgio, and Stephen K. Pollard. 1986. The ‘Efficiency’ of the London Metal Exchange: A Test with Overlapping and Non-Overlapping Data. Journal of Banking and Finance 10: 575–93. [Google Scholar] [CrossRef]
  2. Cheng, Ing-Haw, and Wei Xiong. 2014. Financialization of Commodity Markets. Annual Review of Financial Economics 6: 419–41. [Google Scholar] [CrossRef] [Green Version]
  3. Diaz-Borrego, Francisco J., María del Mar Miras-Rodríguez, and Bernabé Escobar-Pérez. 2019. Looking for Accurate Forecasting of Copper TC/RC Benchmark Levels. Complexity 2019: 8523748. [Google Scholar] [CrossRef]
  4. Figuerrola-Ferretti, Isabel, and Christopher L. Gilbert. 2008. Commonality in the LME Aluminum and Copper Volatility Processes through a FIGARCH Lens. The Journal of Futures Markets 28: 935–62. [Google Scholar] [CrossRef]
  5. Guzman, Juan Ignacio, and Enrique Silva. 2018. Copper Price Determination: Fundamentals versus Non-fundamentals. Mineral Economics 31: 283–300. [Google Scholar] [CrossRef]
  6. Irwin, Scott H., and Dwight R. Sanders. 2012. Testing the Masters Hypothesis in Commodity Futures Markets. Energy Economics 34: 256–69. [Google Scholar] [CrossRef]
  7. Koitsiwe, Kegomoditswe, and Tsuyoshi Adachi. 2018. The Role of Financial Speculation in Copper Prices. Applied Economics and Finance 5: 87–94. [Google Scholar] [CrossRef] [Green Version]
  8. MacDonald, Ronald, and Mark Taylor. 1988. Metal Prices, Efficiency and Cointegration: Some Evidence from the LME. Bulletin of Economic Research 40: 235–39. [Google Scholar] [CrossRef]
  9. Otto, Sascha. 2011. A Speculative Efficiency Analysis of the London Metal Exchange in a Multi-Contract Framework. International Journal of Economics and Finance 3: 3–16. [Google Scholar] [CrossRef] [Green Version]
  10. Park, Jaehwan. 2018. Volatility Transmission between Oil and LME Futures. Applied Economics and Finance 5: 65–72. [Google Scholar] [CrossRef] [Green Version]
  11. Park, Jaehwan. 2019a. The Role of Canceled Warrants in the LME Market. International Journal of Financial Studies 7: 10. [Google Scholar] [CrossRef] [Green Version]
  12. Park, Jaehwan. 2019b. Effect of Speculators’ Position Changes on the LME Futures Market. International Journal of Financial Studies 7: 32. [Google Scholar] [CrossRef] [Green Version]
  13. Park, Jaehwan, and Byungkwon Lim. 2018. Testing Efficiency of the London Metal Exchange: New Evidence. International Journal of Financial Studies 6: 32. [Google Scholar] [CrossRef] [Green Version]
  14. Tang, Ke, and Wei Xiong. 2012. Index Investment and the Financialization of Commodities. Financial Analysts Journal 68: 54–74. [Google Scholar] [CrossRef]
1
The origins of the LME can be traced back as far as the opening of the Royal Exchange in London in 1571, during the reign of Queen Elizabeth I. The LME officially opened in 1877; it has been recognized as the global benchmark for the metal market since then. Major producers and consumers use LME contracts for hedging price risks and the reference price for spot and futures price. The LME is now the world’s largest future exchange in the metal industry, including copper, which is known to correlate quite a bit with business cycle (Park 2018; Tang and Xiong 2012; and Cheng and Xiong 2014). Even though copper is traded at both CME (Chicago Mercantile Exchange) and SHFE (Shanghai Futures Exchange), LME remains a global benchmark. Previous studies in the LME-related area had three categories. First, Canarella and Pollard (1986) and MacDonald and Taylor (1988) found that the LME was efficient, while Otto (2011) and Park and Lim (2018) found opposing results. Second, Park (2019b) presented statistically significant evidence that the speculators Granger-caused the prices of base metals. Third, Figuerrola-Ferretti and Gilbert (2008) examined copper volatilities, while Park (2018) provided the evidence of volatility transmission between oil and LME.
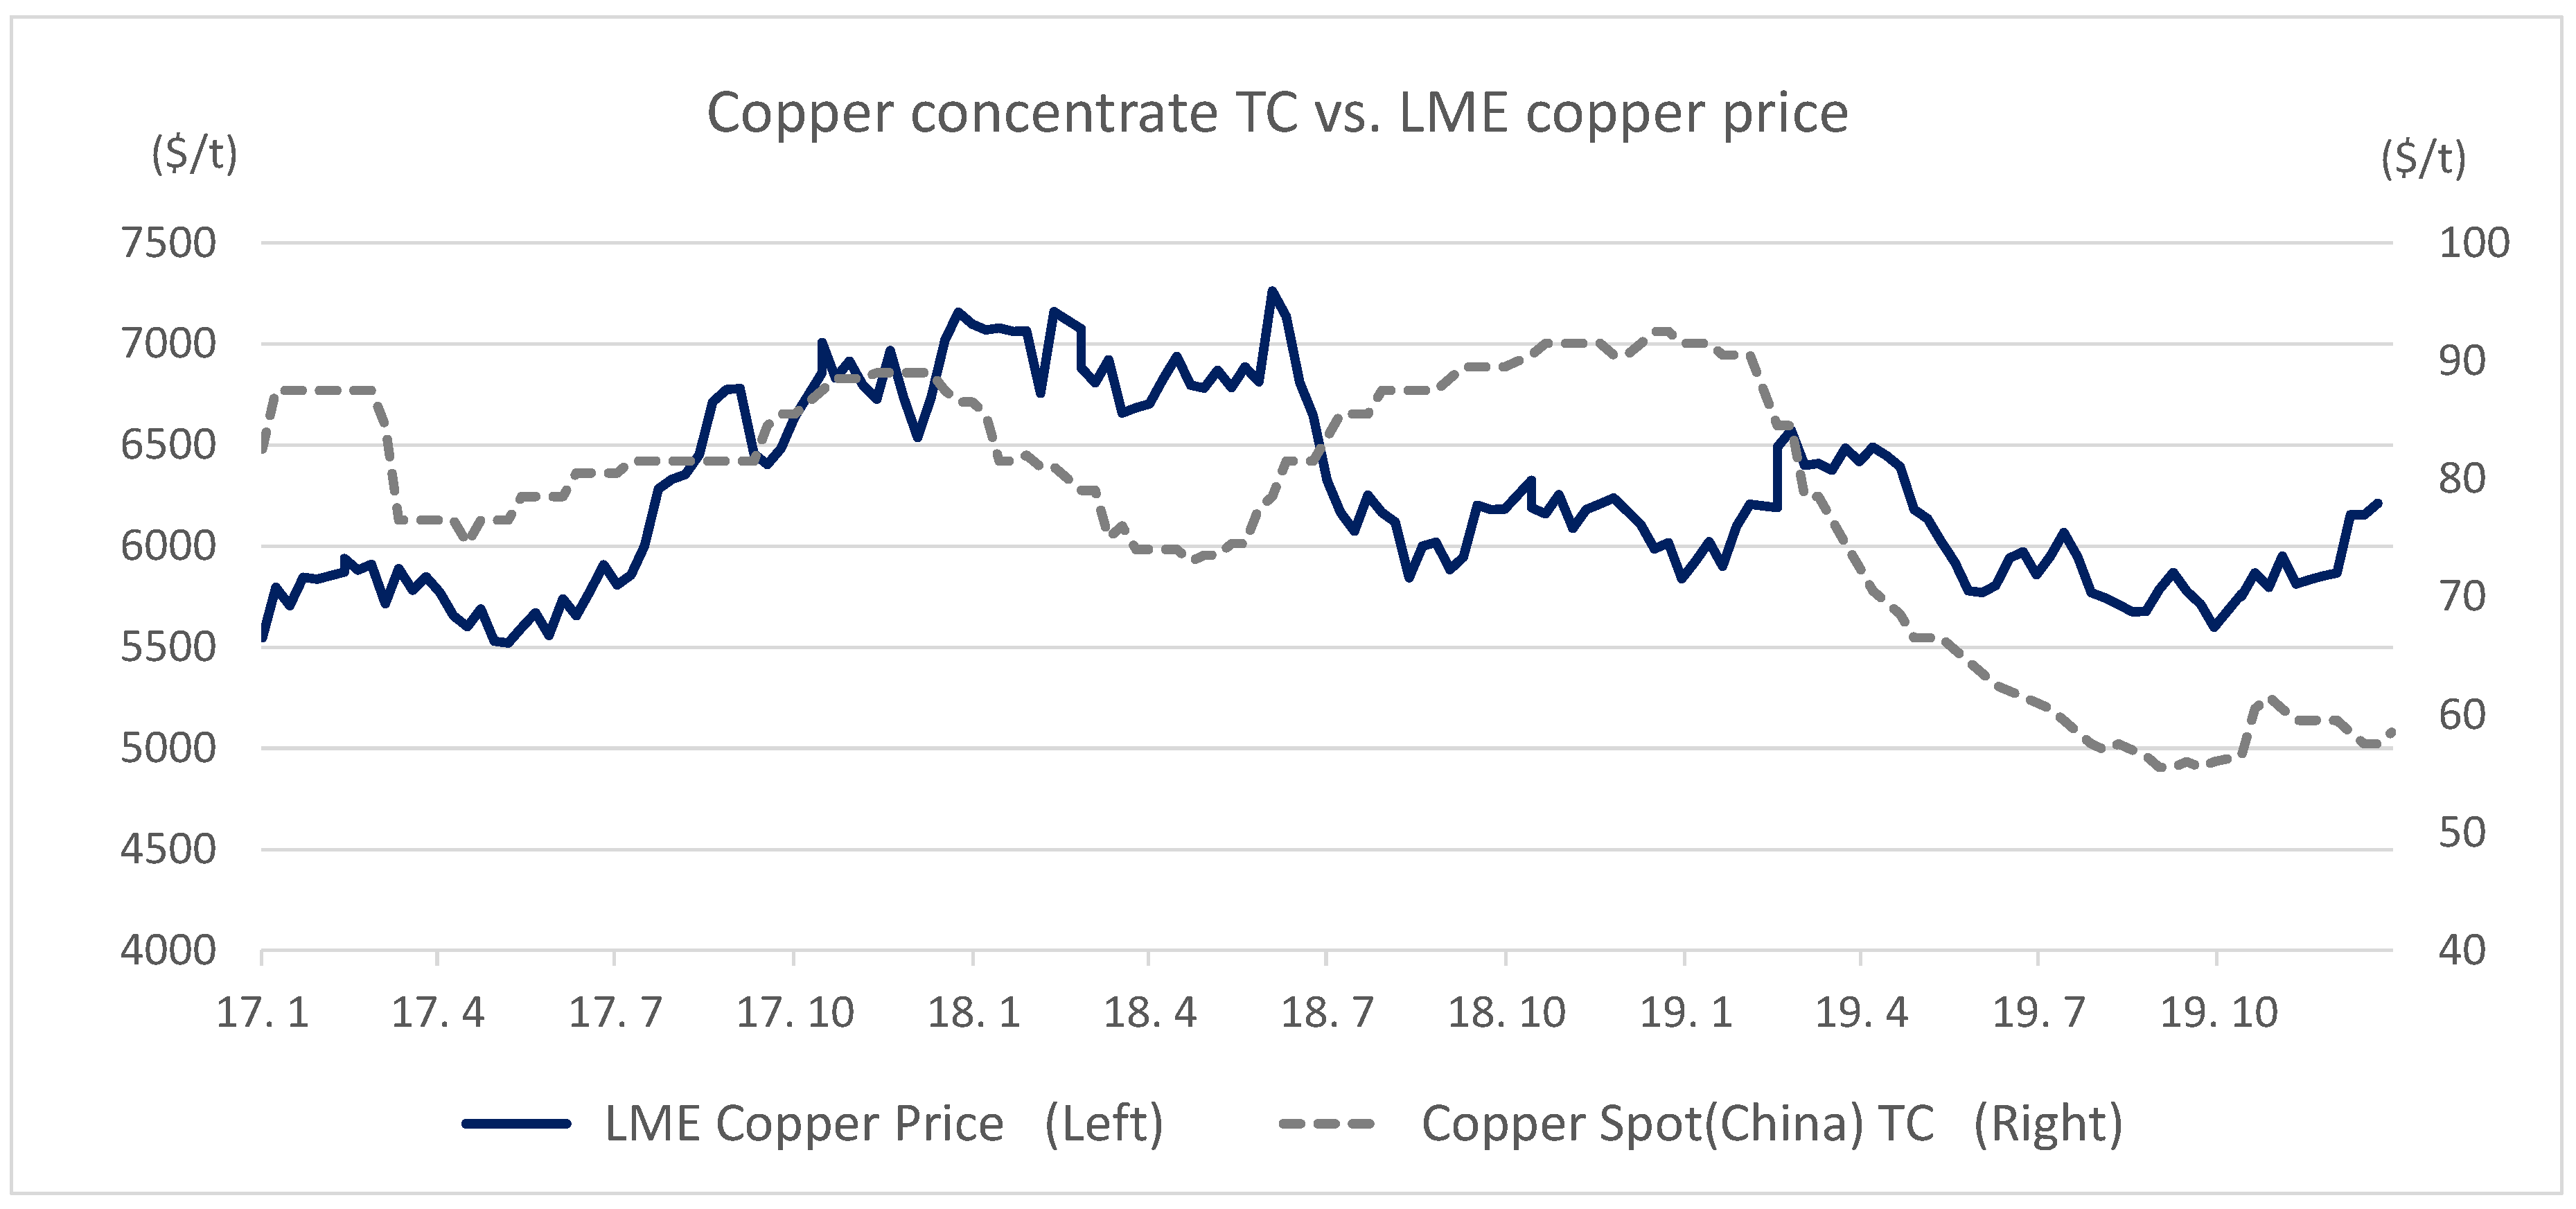
2
This information is a valuable investment factor of market supply trends, which can provide a meaningful implication of possible price direction.
3
The TC is different from region-wide, such as Europe, Asia and US. This paper examines the China copper concentrate TC as a benchmark copper TC through Bloomberg.
4
The Fastmarket data are also compared and partly reflect the data point.
5
Irwin and Sanders (2012) reported that a total of $161.2 billion was invested in commodity index investments as of March 31, 2010. Moreover, 78% of index investments were in the U.S. futures market, which invited major index funds with rising trading volumes. These are very meaningful market trends.
6
Two lags are appropriate, based on the 2 test (likelihood-ratio test).
Figure 1. Plot of copper prices and TC.
Economies 08 00036 g001
Figure 2. Plot of Residual of Regression Result.
Economies 08 00036 g002
Figure 3. Plot of Impulse Response Results. The solid blue line is the orthogonalized impulse response, while the red dotted line is the 95% confidence interval. The responses of SR to a TC shock show that they were very short lived within second period. The SR is the natural logarithm of weekly returns of copper and TC is the natural logarithm of treatment charge against previous week.
Economies 08 00036 g003
Table 1. Possible Relationship between treatment charge (TC) and Effect on Metal Price.
Metal ConcentratesTCEffect on Metal Price
UpUpNegative
DownDownPositive
Table 2. Summary Statistics. The total observation contains 155 obs. (January 2017~December 2019; weekly data), where SR is the weekly returns and TC is the natural logarithm of treatment charge against previous week in smelting industry. The natural logarithm data is applied in returns calculations. We see that the distributions for all returns and TC are skewed and fat-tailed, as indicated by the high significance of the Jarque–Bera test for normality.
VariablesMeanStandard DeviationSkewnessMaximumMinimumKurtosisJarque–Bera
SR0.00070.0220.14610.0637−0.04936.8328307.1
(0.00)
TC−0.00190.018−1.30380.0684−0.099410.4485402.2
(0.00)
Table 3. Unit root tests results. The sample consists of 155 observations. Table 3 presents the unit root tests for all the variables (null hypothesis: there is a unit root). The reported numbers represent test statistics. *** indicates the rejection of the null hypothesis at 1% level of significance, respectively.
VariablesAugmented Dickey–Fuller (ADF)Phillip–Perron (PP)Order of Integration
SR−13.30 ***−13.50 ***I(0)
TC−10.89 ***−11.02 ***I(0)
Table 4. Parameter estimates of Equation (1). The total observation contained 155 observations (January 2017~December 2019; weekly data). The natural logarithm data were applied in returns data. The reported numbers in parenthesis represent t-statistics. ** indicates statistically significant at 5% level. The returns data use the level, and the TC data employ the level reflecting the unit root test results.
Metal β 0 β 1 R 2 F-StatisticsMSE (Mean Squared Error)
copper0.0003−0.180.034.31 **0.01
(0.19)(−2.07) **

