Article

Multidimensional Inequality in Vietnam, 2002–2012

by
Thi Kim Thanh Bui
1,2,* and
Guido Erreygers
2,3,*
1
College of Economics, Can Tho University, Can Tho 94000, Vietnam
2
Department of Economics, University of Antwerp, BE-2000 Antwerpen, Belgium
3
Centre for Health Policy, University of Melbourne, Parkville, VIC 3010, Australia
*
Authors to whom correspondence should be addressed.
Economies 2020, 8(2), 29; https://doi.org/10.3390/economies8020029
Submission received: 27 January 2020 / Revised: 17 March 2020 / Accepted: 23 March 2020 / Published: 5 April 2020

Abstract

:
We investigate the evolution of multidimensional inequality of well-being in Vietnam in the period 2002–2012 using household survey data. Our study focuses on four crucial dimensions of human welfare: consumption, education, health and housing. We measure inequality by means of the multidimensional Atkinson index, which belongs to the Atkinson family of relative inequality indices. The choice of the values of two crucial parameters, with respect to the aversion to inequality on the one hand and the degree of substitutability between dimensions on the other hand, has a significant influence on the perceived trends of inequality. We consider different combinations of dimensions (two, three and four dimensions) and a wide variety of values of the parameters, with the aim of arriving at a robust understanding of the extent of inequality in Vietnam. Our results suggest that the level of multidimensional inequality in Vietnam has decreased, albeit that this is not the case for all combinations of the parameter values. Our study shows that looking at multidimensional rather than one-dimensional inequality leads to a richer understanding of the evolution of inequality, and indicates that it is important to be aware of the influence of value judgments on the assessment of inequality.

1. Introduction

The multidimensional nature of well-being has been recognized for a long time (e.g., Maasoumi and Nickelsburg 1988; Sen 1999; Stiglitz et al. 2009), and a growing body of theoretical literature on the measurement of multidimensional inequality and poverty has developed rapidly in the last 25 years (Aaberge and Brandolini 2015; Alkire et al. 2015). The most recent Human Development Report focuses explicitly on multidimensional inequality and poverty (UNDP 2019). The multidimensional approach of inequality is appealing not only because it covers more than one facet of well-being, but also because it offers the possibility to incorporate the social gradients of component attributes into the evaluation. In this way, a multidimensional assessment of inequality can reveal whether the existing inequalities in the separate dimensions of well-being (e.g., in income, health and education) reinforce or compensate one another.
In the past decades, Vietnamese society has gone through major changes highlighted by more trade openness, rapid economic growth and declining poverty (Nguyen and Pham 2018). According to the World Bank, the average growth rate of real per capita GDP in the period 1992–2018 was 5.6% (https://data.worldbank.org/). This has been accompanied by a substantial decrease of extreme poverty rates (from 52.9% in 1992 to 2% in 2016), based on the poverty threshold of 1.90 USD per day (2011 PPP). According to UNDP, health outcomes have improved considerably: in the period 1992–2018, life expectancy at birth increased from 70.6 to 75.3 years and infant mortality rates declined from 37 to 16.7 per 1000 live births (http://hdr.undp.org/en/data). Educational levels have also expanded, with tertiary enrolment ratios increasing from 3% in 1990 to 28% in 2016 and the mean years of schooling going from 4.2 years in 1992 to 8.2 years in 2018. These changes imply that Vietnam has made considerable progress in terms of the Human Development Index (HDI), the well-known multidimensional index developed by the UNDP which combines information on income, health and education, inspired by the capability approach of Sen (1995). Vietnam has reached the level of medium human development and is on the brink of reaching the level of high human development; it currently occupies position 118 in the world ranking with an index value of 0.693 (UNDP 2019). While income inequality has remained relatively stable (according to the World Bank, the Gini coefficient based on household consumption was around 0.36 in 1992 and 0.35 in 2016, after reaching a maximum of 0.39 in 2010; see also Benjamin et al. 2017), much less is known about the relative magnitudes and evolution of inequalities in the non-monetary dimensions of human well-being.
This study aims to examine the distribution of well-being in Vietnam by assessing the evolution of multidimensional inequality with regard to four crucial dimensions: consumption, health, education, and housing. We investigate the change of inequality taking into account the changes of correlations between these dimensions over time. The fact that some form of substitution is possible between the component dimensions of well-being is also considered during the process of aggregating different dimensional attainments to measure the inequality in multidimensional well-being. We measure the extent and evolution of inequality by means of the multidimensional Atkinson index (Decancq et al. 2009). We also explore the sensitivity of our measurement to changes in the degree of inequality aversion and in the degree to which well-being dimensions can compensate each other.
We start this study by introducing the literature of multidimensional inequality in Section 2. Section 3 reviews the recent studies on distribution of the multidimensional well-being in Vietnam. The method and data used to measure the multidimensional inequality are described in Section 4 and Section 5, respectively. In Section 6, we present the empirical findings. Finally, in Section 7, we discuss the results and, in Section 8, we provide the conclusions of our study.

2. Conceptual Framework

Economists have tended to study the distribution of well-being by looking at one dimension only: monetary income. Income was conceived as the most important means to attain well-being (see, e.g., Dalton 1920). It is now generally accepted, however, that well-being involves more than just money. This has led to a growing literature on multidimensional inequality (with the capability approach of Sen (1995), as an important source of inspiration) and to various attempts to extend the analysis of unidimensional inequality to a multidimensional framework. The multidimensional approach to the study of well-being was pioneered by Fisher (1956), who introduced a multidimensional distribution matrix to reflect the notion that besides monetary income other attributes also matter for individual welfare. Since then, the multidimensional aspects of inequality have received attention from many economists, such as Atkinson and Bourguignon (1982); Maasoumi (1986, 1989); Savaglio (2006); Weymark (2006) and Muller and Trannoy (2012). Cowell (2000) also mentioned briefly the multidimensional approaches in his discussion of the measurement of inequality.
Since several dimensions have to be considered simultaneously, the extension of the unidimensional approach to the multidimensional case poses a few challenges. In this section, we begin by exploring how the main properties with regard to the measurement of unidimensional inequality can be adapted to the study of multidimensional inequality (Section 2.1). After that, we discuss the methods to measure multidimensional inequality (Section 2.2).

2.1. Properties of Multidimensional Inequality Measures

When it comes to the measurement of one-dimensional inequality (typically inequality of per capita income or consumption), it is now customary to focus on measures of relative inequality that satisfy the properties of symmetry, replication invariance, mean independence and the Pigou–Dalton (or transfer) principle (Sen 1997, p. 139). Sometimes additive decomposability is added to the list of desirable properties.
The symmetry principle demands that individuals are treated anonymously; for the measurement of inequality, it should not matter which specific individual earns which specific income. Replication invariance means that the population size of the studied society should play no role in inequality measurement. According to this principle, if we construct a new distribution by merging exact replicas of a given distribution, then the new distribution is considered to have exactly the same level of inequality as the original one. The mean independence property indicates that inequality does not change when all individuals of a given society experience a change of their attainments by the same proportion. If everyone’s income doubles, the level of inequality should remain the same as before. The Pigou–Dalton principle refers to the reaction of the index to mean-preserving transfers. Suppose income is transferred from a relatively poor individual to a relatively rich individual, while everything else remains unchanged. Since the relatively poor person gets poorer and the relatively rich person richer, this is a regressive transfer: it increases the dispersion of income within society. The Pigou–Dalton principle states that a regressive transfer must lead to an increase in the measured degree of inequality (Sen 1973, p. 27). Finally, the property of subgroup decomposability deals with the relationship between the level of inequality in society as a whole, and the levels of inequality within and between subgroups of the population. Subgroup decomposability requires that it must be possible to express the degree of inequality in society as a whole as a sum of two components: the degree of inequality within the subgroups, and the degree of inequality between the subgroups. Moreover, the first component must be a simple function of the degrees of inequality within the subgroups.
It is possible to extend these properties to the multidimensional context. If we are considering g dimensions and n individuals, we have to use matrices to study the distribution of well-being. In what follows, we assume the ( n × g ) matrices X and Y represent two distributions of the g attributes of well-being (e.g., health and income) over the n individuals, with the rows corresponding to the individuals and the columns to the attributes.
Nothing essential needs to be changed to the definition of the symmetry property. Y is considered to be a permutation of X if there exists a permutation matrix P such that Y = P X . The inequality index I has the symmetry principle if for any distribution Y that is a permutation of distribution X, the two distributions have the same level of inequality: I ( Y ) = I ( X ) . Likewise, it is straightforward to generalize the replication invariance property to the multidimensional case. If distribution Z consists of m exact replicas of distribution X, the property requires the two distributions to have the same levels of inequality.
The extension of the mean independence property is also immediate. For those attributes for which it is relevant (these are typically measured by ratio-scale variables, such as income) it means that the multiplication of the corresponding columns by an arbitrary positive scalar should have no influence on the measured degree of inequality. For instance, if we want the mean independence property to hold for the first attribute, then the following two distributions should have the same level of inequality:
X = 50 80 90 20 10 50 , Y = 100 80 180 20 20 50
The extension of the Pigou–Dalton principle to more than one dimension poses a few challenges. In general, the ranking of individuals according to one dimension (say health) does not concord with the ranking according to another (say income). An individual who is top-ranked by one attribute may very well be bottom-ranked by another. It is not immediately clear how individuals should be ranked for the multidimensional Pigou–Dalton principle. For example, if in matrix X the first column refers to health and the second to income, the second individual has a lower income rank but a higher health rank in comparison to the first individual. Does an income transfer from the first individual to the second still satisfy the Pigou–Dalton principle?
There is a large literature on this topic, and a good survey was made by Aaberge and Brandolini (2015, Section 3.4.1). The adoption of the uniform majorization criterion (Kolm 1977; Marshall et al. 1979; Tsui 1995; Weymark 2006) is one way of tackling the issue. It relies on the idea that a bistochastic transformation of a matrix generalizes the concept of a progressive Pigou–Dalton transfer. If matrix Y can be obtained from matrix X by a bistochastic transformation, distribution Y is on the whole closer to the average than distribution X, and therefore Y is considered to be socially preferable to X. Uniform majorization can be illustrated by the following example from Decancq and Lugo (2012). Let us compare two matrices, X and Y, as well as the bistochastic matrix B:
X = 50 80 90 20 10 50 , Y = 60 65 80 35 10 50 , B = 0.75 0.25 0 0.25 0.75 0 0 0 1
Since Y = B X , it follows that Y should be socially preferred to X. As a result of the bistochastic transformation, every column of matrix Y has the same mean but a less severe dispersion than the corresponding column of matrix X. Uniform majorization states that on the whole well-being is more equally distributed in Y than it is in X.
Although the uniform majorization criterion succeeds in translating the idea of the Pigou–Dalton principle to a multidimensional setting, it has been criticized for its lack of taking into account the association between dimensional distributions. In reality, dimensions of well-being are often positively correlated; think of income and health. The inequality indices proposed by Hicks (1997); Foster et al. (2005) and Gajdos and Weymark (2005), as well as the poverty index suggested by Alkire and Foster (2011), also fail to capture the dimensional associations.
It has been argued that a good multidimensional index should be at least sensitive to the correlations between different welfare dimensions, since “various types of inequalities may strengthen each other” (Stiglitz et al. 2009, p. 205). This implies that an additional criterion is required which explicitly captures these correlations in the multidimensional context. Atkinson and Bourguignon (1982) and Walzer (1983) were among the first to point out that multidimensional inequality should be sensitive to such dimensional associations. Tsui (1999) formalized their intuitions by means of the criterion of correlation increasing majorization, which is motivated by the concept of correlation increasing transfer studied by Boland and Proschan (1988). Imagine that we switch the positions of elements in the first column of matrix X to form the following matrix Y:
X = 50 80 90 20 10 50 , Y = 90 80 10 20 50 50
The element switching boosts the inter-attribute association. The association between the two considered attributes is obviously higher in matrix Y than in matrix X. In matrix Y, the first individual is better placed than the others in not only one but two dimensions at the same time. In the same manner, the second and the third individuals are, respectively, the worst and the second worst off in both dimensions. In matrix X, each individual attains less in one attribute but more in the other attribute in comparison to the other individuals. This means the relative shortfall in one dimension of an individual is compensated by his or her relatively better achievement in the other dimension. Hence, no one is best (or worst) off in both dimensions simultaneously.
According to this reasoning, the two-dimensional distribution is deemed more equal in matrix X than in matrix Y. The difference between the two matrices illustrates the criterion of correlation increasing majorization: element switching which strengthens the inter-attribute correlation increases multidimensional inequality.
Finally, the definition of subgroup decomposability remains the same as before.

2.2. Multidimensional Inequality Measurement

We have considered necessary properties for the measurement of multidimensional inequality. In this subsection, we summarize the ways in which multidimensional inequality has been measured. Typically, two fundamental procedures are required to measure the distribution of individuals’ attainments in all dimensions. One procedure compares the well-being attainments across individuals and another aggregates the attainments of different dimensions. In the literature, these two procedures are incorporated into the measurement process in a different ways. Three measurement approaches can be distinguished.
The first approach executes the two mentioned procedures in two consecutive calculation stages, and is normally referred to as the two-stage measurement approach which aggregates across individuals first (Aaberge and Brandolini 2015, p. 194). In the first stage, inequality across individuals is measured for each separate dimension using the unidimensional measurement. In the second stage, these calculated levels of unidimensional inequality of all dimensions are aggregated into one summary level of multidimensional inequality. The relative importance of each dimension can be taken into account through the dimensional weights introduced in the second stage. For example, the well-known inequality-adjusted Human Development Index introduced in the 2010 edition of the Human Development Report (UNDP 2010) and the multidimensional generalized Gini indices (Gajdos and Weymark 2005) follow this approach. Since the distribution in each dimension is separately summarized before being incorporated into the multidimensional inequality, the potential correlations between component dimensions are completely ignored. The measurement cannot satisfy the criterion of correlation increasing majorization, but it still can meet the uniform majorization criterion (Aaberge and Brandolini 2015).
The second approach also needs two separate calculation stages for the two fundamental procedures and is commonly referred to as the two-stage measurement approach which aggregates across dimensions first (Aaberge and Brandolini 2015, p. 195). The first stage aggregates all dimensional attainments for each individual, and dimensional weights are incorporated into this step. The second stage measures the multidimensional inequality across individuals based on the distribution of the levels of well-being of individuals. This approach has been widely applied in a number of studies. For instance, Maasoumi (1986, 1989, 1999) employed a utility-like function to calculate well-being attainments for each individual, and then measured the inequality across individuals using unidimensional measurement. Nilsson (2010); Justino (2012) and Rohde and Guest (2013) used Theil indices, while List (1999); Banerjee (2010) and Decancq and Lugo (2012) used the Gini coefficient. By aggregating dimensional attainments for each individual, this measurement approach includes the correlations between component dimensions, hence can satisfy the correlation increasing majorization criterion, and also can satisfy the criterion of uniform majorization (Aaberge and Brandolini 2015).
The third approach incorporates the procedures of aggregating across individuals and across dimensions into a unified multidimensional inequality index in only one rather than two separate stages. For this reason, it is called the direct one-stage approach (Aaberge and Brandolini 2015, p. 196). Attainments in separate dimensions of an individual are combined into a function of well-being. This well-being function is embedded in the inequality function to form a one-stage multidimensional inequality index. In this way, the distributions of different attributes enter directly into the multidimensional inequality index. The one-stage approach can satisfy the criteria of uniform majorization and correlation increasing majorization since it takes the dimensional correlations into account while examining the attainments of individuals for all dimensions (Aaberge and Brandolini 2015). Tsui (1995, 1999) adopted this approach using the Atkinson index. List (1999), Brandolini (2008) and Decancq et al. (2009) also extended Atkinson indices for multivariate measurement. Erreygers (2013) developed the dual and joint Atkinson indices, which require a specific social evaluation function, for the measurement of socioeconomic inequality of health.
Besides measuring the multidimensional inequality by means of a normative index, many researchers have employed stochastic dominance criteria (Shorrocks 1983; Lambert 2001) to examine multidimensional inequality (Duclos et al. 2011; Muller and Trannoy 2011; Cowell et al. 2017; Petrillo 2017) and multidimensional poverty (Arndt et al. 2012; Nanivazo 2015). The advantage of this method is that it is based on the comparison of the entire distributions of different dimensions rather than on the comparison of aggregated index values. However, the drawback is that it very often leads to an incomplete ranking of distributions, which reduces its usefulness for policymakers.
3. Literature Review of Multidimensional Well-Being in Vietnam

There have been several attempts to investigate empirically the distribution of multidimensional well-being in Vietnam, focusing on inequality as well as poverty. These studies yield a broader and more nuanced picture of inequality and poverty than what the common income-based measures provide. Justino (2012) applied the stochastic dominance method to evaluate the multidimensional inequality in education, health and expenditure consumption of households. She recognized two different tendencies of change in the distribution of well-being between 1992 and 1998: non-income inequalities decreased, but expenditure inequality increased. Focusing on attainments of health, education, the possession of house assets (e.g., refrigerator, television and gas cooker) and living conditions, Phan and O’Brien (2019) investigated the inequality of well-being by means of polychromic principal component analysis (McKenzie 2005; Ward 2014) using household-level data in the period 2002–2008. They found similar evolutions of multidimensional inequality and inequality in the possession of house assets, which is commonly considered as crucial to objective well-being in developing countries. These inequalities increased in 2004 but remained stable until 2008. There was a significant difference in inequality between rural and urban areas. In the urban area, the degree of multidimensional inequality was high in 2002 and decreased thereafter, while, in the rural area, it was initially low but then started to increase. The evolutions of inequality within different regions of Vietnam were not much different, except for a pronounced rise of inequality in the Northern mountain region.
Meanwhile, multidimensional poverty has received more attention. A study covering the period 1993–1998 by Baulch and Masset (2003) found a modest correlation between monetary and nutrition poverties, at least as far as chronic poverty is concerned. Nutrition poverty showed strong persistence, and remote urban areas remained at high risk of both poverty types over time. Similarly, Tran et al. (2015) found that from 2007 to 2010 monetary poverty declined and fluctuated more than multidimensional poverty in terms of health, education and living conditions, since the high economic growth in Vietnam had a more immediate impact on income than on non-monetary well-being. Much less than 50% of the monetary poor also experienced multidimensional poverty. Focusing on education, health, living conditions, child labour and social inclusion, Roelen et al. (2012) observed that only half the number of children living in multidimensional poverty (who made up 35% of the child population) were monetary poor in 2006. More recently, Le et al. (2015) observed that monetary poverty was not very likely to be accompanied by non-monetary poverty with regards to health, education, insurance, social support, living conditions and social participation. Applying the poverty index proposed by Alkire et al. (2015), they found that overall multidimensional poverty slightly declined during 2010–2012, and lack of social insurance contributed most to poverty in general. By contrast, the work of Mahadevan and Hoang (2016) recognized a strong connection between income deprivation and multidimensional poverty in terms of food consumption, household’s assets and living conditions based on a household survey in 2010. Pham and Mukhopadhaya (2018) applied a fuzzy sets approach to study multidimensional deprivation, exploring both monetary and non-monetary aspects of deprivation. Using household survey data for the year 2012 they were able to identify several groups (e.g., ethnic minorities) who are relatively more deprived. Most recently, Pham et al. (2020) applied a multilevel model to study spatial differences in multidimensional poverty. They considered seven dimensions and used household survey data for the year 2014.

4. Methodology

Our analysis proceeds in different steps. First, we look at the average levels of well-being and of its component dimensions. For the calculation of individual well-being levels, we use a specific well-being function which we define below (see Equation (6)). Second, we study the associations between the dimensions of individual well-being, which we measure by means of coefficients of correlation. There is a substantial literature on the mutual relationships between the different aspects of well-being (Williams 1990; Smith 1999; Goldman 2001; Currie 2009; Rahman et al. 2016). The existence of high degrees of positive correlation between dimensions implies that patterns of inequality in one dimension are to a large extent replicated in other dimensions. This may be seen as a factor, which reinforces the extent of multidimensional inequality. Third, and most importantly, we calculate indices of multidimensional inequality. Our preferred inequality index is the multidimensional Atkinson index, which belongs to the Atkinson family of relative inequality indices and was suggested by Tsui (1995, 1999). The well-known unidimensional Atkinson index measuring the degree of inequality of a distribution x over n individuals is expressed as:
I = 1 1 n i = 1 n x i μ ( x ) 1 ϵ 1 1 ϵ
where x i stands for the attainment of individual i, μ ( x ) is the average attainment, and ϵ is a parameter capturing the degree of aversion to inequality. The index is derived from a social evaluation function u ϵ ( x i ) of the isoelastic type:
u ϵ ( x i ) = x i 1 ϵ 1 ϵ if ϵ 1 log ( x i ) if ϵ = 1
Parameter ϵ receives values in the range of 0 , + . A greater value of ϵ indicates a higher degree of inequality aversion. When ϵ is equal to 0, inequality is not taken into account at all: all distributions return the same inequality index equal to 0. When ϵ goes to + , the value of the index tends to 1 x 1 μ ( x ) , with x 1 being the level attained by the worst off individual in society. If this level is positive, the values of the Atkinson index lie in the range 0 , 1 .
To extend this framework to the case of multidimensional inequality, we now assume that the attainment of an individual is measured by a vector rather than a scalar. More specifically, let x i = ( x i 1 , x i 2 , , x i g ) , where x i j is equal to the attainment of individual i in dimension j. Moreover, we introduce a multidimensional individual well-being function, W β ( x i ) , which translates the multidimensional attainment vector x i into a well-being index. Following Decancq et al. (2009), we have chosen a function which measures individual well-being as a generalized weighted average of order β over g separate dimensions:
W β ( x i ) = j = 1 g w j x i j β 1 β
Parameter β captures the degree to which attainments in different dimensions can compensate each another. It is equal to 1 1 / σ , where σ is the constant elasticity of substitution between the dimensions of well-being. The value of β lies in the range , 1 (Decancq et al. 2009; Lugo 2007). The substitutability between dimensions increases with the value of β . When the value of β goes to , the dimensions are considered to be perfect complements. When β equals 0, the well-being function takes the Cobb–Douglas form. When β reaches the upper bound of 1, the dimensions are considered to be perfect substitutes of each other. The weight given to dimension j is equal to w j , and the sum of these weights is equal to 1. We assume that all studied dimensions are equally important to human lives and therefore we always take w j = 1 / g for every j.
The multidimensional Atkinson inequality index is constructed in a similar way as the one-dimensional index (see Equation (4)). Instead of the attainment levels, we now use the well-being levels as determined by the function W β ( . ) :
I = 1 1 n i = 1 n W β ( x i ) W β ( μ ) 1 ϵ 1 1 ϵ
where μ = μ ( x ( 1 ) ) , μ ( x ( 2 ) ) , , μ ( x ( g ) ) and μ ( x ( j ) ) stands for the average attainment in dimension j. The term in the denominator W β ( μ ) is equal to the level of well-being which would be achieved when an individual attained the average in all dimensions. For our specific individual well-being function, the Atkinson multidimensional inequality index is then equal to:
I = 1 1 n i = 1 n j = 1 g w j x i j β j = 1 g w j μ ( x ( j ) ) β 1 ϵ β 1 1 ϵ
The meaning of the multidimensional Atkinson index is, by construction, slightly different from that of the unidimensional Atkinson index. While the latter is based upon a comparison of the value of the equally distributed equivalent attainment to the average attainment, the former index compares the aggregate well-being of the whole population (the numerator term) to the value of the aggregate well-being if everyone attained the average in each dimension (the denominator term).
The values of the parameters β and ϵ have to be chosen by the investigator and can express different normative preferences. Thanks to the flexibility of the functional form, it is relatively easy to explore how changes of the parameters of dimensional substitutability and inequality aversion affect the results. It deserves to be mentioned that not all combinations of ϵ and β are such that the two majorization principles we have discussed earlier are satisfied. The uniform majorization principle (Kolm 1977) holds when ϵ > 0 and β < 1 . The first condition guarantees that society is averse to inequality and the second that the different dimensions are not perfect substitutes of one another. The correlation increasing majorization principle (Atkinson and Bourguignon 1982) requires ϵ + β > 1 . In our empirical analysis, we consider both cases where these principles are met and where they are not.

5. Data

5.1. Data Source

We use data from the Vietnam Household Living Standard Survey (VHLSS) conducted by the General Statistics Office of Vietnam’s government. The survey has been carried out biennially from 2002 onwards and provides a representative dataset for the whole population of Vietnam at all ages. The content and format of the survey have remained fairly constant over different waves to provide data with a significant degree of consistency over the years. The dataset includes a wide variety of variables, which we use to obtain information on what we consider to be four crucial dimensions of human welfare: consumption expenditures, education, health, and housing conditions. We acknowledge that the choice of dimensions is a value judgment (see Chapter 6 of Alkire et al. 2015 for an excellent discussion of the issues involved), and as a result others may find a different set of dimensions more appropriate than the set we have chosen. The data on expenditures, houses and dwelling facilities of the households and schooling attainments of individuals in all surveyed years are fairly rich. However, detailed information with regard to health conditions of individuals is available for some years only; for most years, the data are of poor quality.
In this study, we make use of six consecutive waves of VHLSS from 2002 to 2012. We focus on adult individuals and only include those who are at least thirty years old in our sample since people have typically reached their highest education levels at that age. We delete extreme outliers from the sample, because the Atkinson index is particularly sensitive to extreme values (Amiel et al. 1996). The number of individuals removed is for each wave less than 1%: 91 individuals for the wave 2002, 152 for 2004, 15 for 2006, 23 for 2008, 15 for 2010 and 17 for 2012. After applying our selection criteria, we have a dataset covering almost half of the original sample size of VHLSS. A few statistics on the data are provided in Table 1. All calculations have been made using the statistical software program STATA.

5.2. Indicator Construction

In this subsection, we describe how we measure individuals’ attainment for expenditure, health, housing and education. As far as the dimensions of consumption and education are concerned, we use data on expenditures and schooling years to measure the attainments of individuals. For the dimensions of housing and health, we construct two new indicators. While information on health status and education is provided for each individual, data on expenditures and housing conditions are available only at the household level. We assume that all members of the same household enjoy exactly the same level of expenditure and housing.
We calculate individual expenditure c i as the equivalized real per capita consumption expenditure excluding out-of-pocket spending on health. Let individual i be a member of household k which consists of n k members. If the consumption expenditure net of any out-of-pocket spending on health by any member of this household is equal to C k , then the equivalized per capita consumption level of each member of this household is defined as:
c i = C k ( n k ) 2
This means that we assign to all members of a given household the same amount of individual consumption, regardless of any differences in what they spend on individual health treatments. Since all households have positive expenditure levels, all individuals have positive equivalized per capita consumption levels. By excluding out-of-pocket medical expenses, we aim to avoid endogeneity as well as double uses of the same information.
With regard to health, we are severely constrained by the available data. We have looked for variables that would accurately measure the health status of individuals. For instance, for most of the survey years, the VHLSS includes a question on whether household members have visited a healthcare center. However, from that we cannot infer whether they have been ill: the visit might have been for a check-up or a vaccination. Households were also asked whether they could afford to pay the health expenses of every individual member, and if not, how they managed to find the necessary funds (e.g., by borrowing). Even though questions such as these provide useful insights into problems such as catastrophic health expenditures, they do not yield direct information on the health status of individuals. Moreover, the information is not available for all years under consideration, and the list of possible answers has not remained the same. In the absence of individual health outcome measures, we construct a health variable which measures health indirectly. The health indicator of an individual h i compares the health expenditures for this individual with his or her total expenditures. The health expenditures consist of the sum of what an individual pays out-of-pocket and what the health insurance providers pay to hospitals. The total expenditures are the equivalized per capita consumption augmented with the health expenditures. More precisely, we use the following formula to calculate the health indicator h i :
h i = 1 t i t i + c i = c i t i + c i
where t i stands for the health expenditures for individual i. Individuals with zero health expenditures are assumed to be in perfect health ( h i = 1). Given that all equivalized per capita consumption levels are positive, the values of the health indicator are strictly greater than zero for all individuals.
It should be noted that our health variable is a proxy and by no means a perfect measure of health. However, because in the VHLSS survey the only variable providing consistent information on individual health over the studied period is ‘expenses for illness treatment’, it is the most we can do for the moment. Rather than taking the absolute value of the health expenditures as a proxy for ill health, we have decided to use relative spending on health as a proxy.
For the housing dimension, we also need to create a new variable. The housing variable is a regression-based estimate of the quality of the houses in which the households are living irrespectively of whether they own or rent the houses (see Decancq and Lugo 2012 for a similar regression-based approach to the housing dimension). We first regress the logarithms of the (self-stated) housing prices on a wide range of variables such as equivalized per capita living space, quality of the building materials, sanitary conditions (e.g., tap water access and qualified toilet), availability of durable equipment, and regional dummies to identify the coefficients of these housing characteristics. The idea is to obtain the relative importance of each housing characteristic to the quality of the house. Since VHLSS provides self-stated house prices of the surveyed households for a few waves only, the house prices are considerably volatile through time and we do not have enough means to control for these changes in price, we use the observations from the survey wave in 2012 only to estimate the coefficients of these housing characteristics. The results of the regression are presented in Table A1 of Appendix A. Once we have retrieved the coefficients of housing characteristics, we estimate logarithms of the housing price for every household in all studied years based on these coefficients. We then convert these logarithms of housing prices into predicted house prices. Finally, the predicted house price of a given household is assigned to every individual of that household and treated as the housing variable d i .
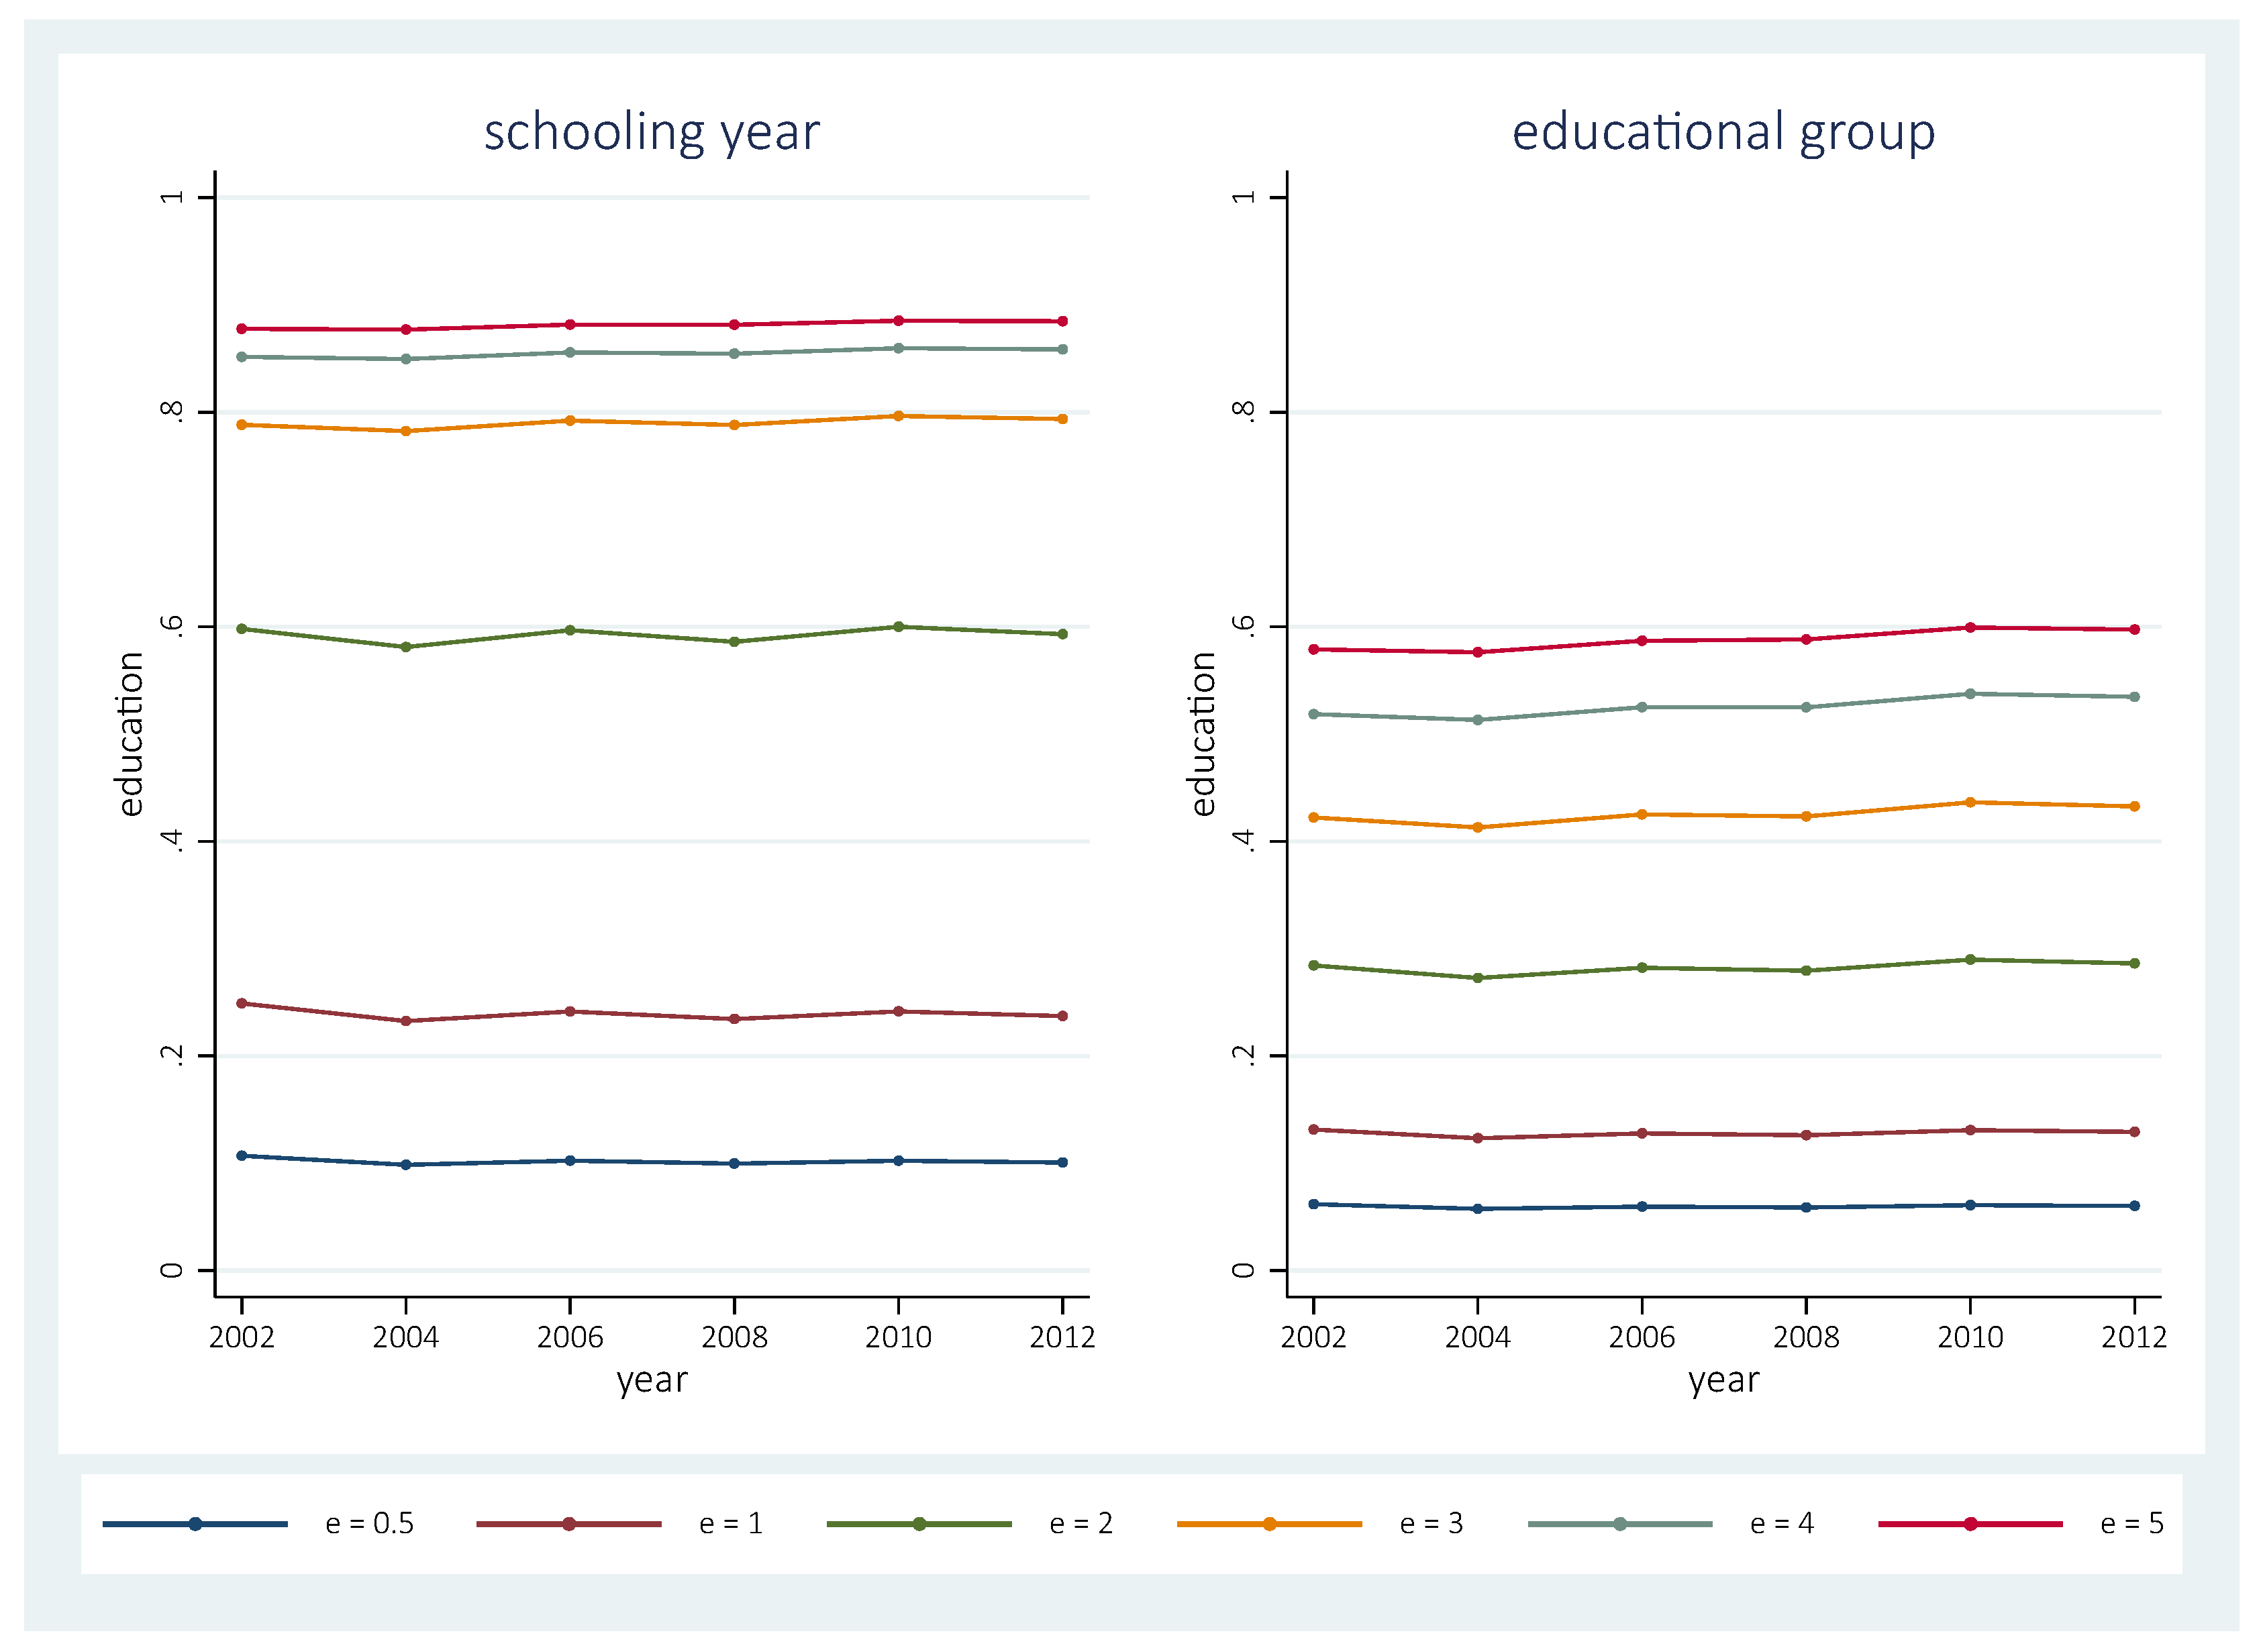
As far as education is concerned, we use nine educational levels (1,2,…,9) according to the highest achievement of schooling. The nine levels of education correspond to years of schooling in the ranges [0,1], [2,3], [4,5], [6,7], [8,9], [10,12], [13,15], [16,17] and [18,22]. The lowest three levels refer to elementary school, the middle three levels to secondary school and the top three levels to post secondary, bachelor, and master and doctoral degrees, consecutively. The value of the education attainment variable e i is therefore in the range [1,9]. Alternatively, we could have used the actual years of schooling to measure educational attainment. This would entail higher levels of educational inequality, but would have no impact on the evolution of inequality (more details can be found in Figure A1 of Appendix A).
To combine several welfare dimension indicators with different measurement scales into one inequality index, it is important to ensure that they are measured coherently. To this end, we divide them by their average value in the initial year, 2002. Our multidimensional index is calculated using the normalized values of the variables, which lie in the range (0,+). The normalization ensures that the index has the property of ratio-scale invariance. Descriptive statistics of the four non-normalized variables can be found in Table 2. Table A2 of Appendix A provides details on the normalized variables.
To obtain a general idea about the multidimensional well-being of every single person, we calculate an indicator of individual well-being synthesizing the normalized indicators of the four dimensions according to Equation (6). By assumption, each dimension enters into the well-being indicator with the same weight, while the substitutability between dimensions is flexible.

6. Empirical Findings

In this section, we present our main empirical findings on the evolution of multidimensional well-being in Vietnam. We successively discuss the average attainments of well-being in Vietnam (Section 6.1), the correlations between dimensions (Section 6.2), and our estimates of inequality of well-being (Section 6.3). We examine the sensitivity of our assessment (Section 6.4) and end by comparing our measurement of multidimensional inequality with those of the two-stage approach (Section 6.5).

6.1. Average Well-Being in Vietnam

We begin by taking an aggregate view of well-being in Vietnam by considering the average levels and their evolution over the period 2002–2012. It is worth recalling that our study is limited to the sub-population of people who are at least 30 years old.

6.1.1. Single Dimensions

With the exception of health, all the studied attributes had increasing average levels over the period 2002–2012 (see Table 2). Average individual equivalized per capita consumption expenditure increased steadily. According to our data, its average yearly growth rate was 6.4%. (For comparison, the average yearly growth rate of GDP per capita for the same period was 5.5%, according to the World Bank’s estimates (https://data.worldbank.org).) Between 2008 and 2010, equivalized per capita consumption expanded exceptionally, by more than a third. However, between 2010 and 2012, in the aftermath of the slowdown of the Vietnamese economy, the increase was much more modest. The average status of individual health remained basically unchanged; poor informative data on individual health could be the reason for the lack of variation. According to our health indicator, around 65% of the population have perfect health. The average level of housing increased considerably, especially between 2002 and 2004 when it grew by more than half. It reached a peak in 2010; between 2010 and 2012, it fell by almost 12%. Over the period 2002–2012, individuals had more space for accommodation: equivalized per capita living space expanded from 28 to 40 square meters. Safe drinking water and electricity became more accessible for all households. The numbers of durable home assets increased and people also spent more on their daily life. Educational attainment also made progress. The change in the average educational level from 4.023 in 2002 to 4.348 in 2012 reflects an increase in the average number of schooling years from 6.9 years in 2002 to 7.6 years in 2012.
Since the values of our multidimensional inequality index are based on the normalized values of the attribute variables, we report the descriptive statistics of the normalized values of these variables in Table A2 in Appendix A. By construction, the average normalized value of every attribute variable for the year 2002 is equal to 1.

6.1.2. Multiple Dimensions

To determine the evolution of the average level of well-being using our individual well-being function in Equation (6), we need to specify the number of dimensions, the value of the parameter β and the normalized values of the attribute variables of each individual. We illustrate this by choosing the value β = 0 . The results for the six possible combinations of two dimensions can be found in Table A3 and those for the four possible combinations of three dimensions in Table A4. Thanks to the improvements which have taken place in the dimensions of consumption, housing, and education, the average levels of attainment of all two- and three-dimensional combinations of well-being attributes have increased between 2002 and 2012. The highest growth rate is obtained for the combination of consumption and housing, for which the average level more than doubled between 2002 and 2012. By contrast, for the combination of health and education, the average level increased very modestly only.
The results for the combination of all four dimensions are in Table 3 and provide a synthetic view of the joint progress made in all the studied attributes. We see that the average level of attainment increased steadily, with the exception of the period 2010–2012, when it dropped slightly. Between 2002 and 2012, the average four-dimensional well-being indicator grew at a yearly rate of 4.2%. This indicates that, on the whole, average levels of well-being in Vietnam have increased considerably in the period under study. For other values of β , the results are different, but the broad tendency remains the same.

6.2. Correlations between Dimensions of Well-Being

A high degree of positive correlation also means that the multidimensional inequality index is less sensitive to changes in the degree of substitutability. In Table 4, we report the coefficients of correlation between the six pairs of two dimensions. All coefficients are positive and remain relatively steady throughout the study period. The strongest association exists between consumption expenditure and housing, although the correlation diminishes slightly over time. Both consumption and housing are moderately correlated to education, and their correlation coefficients increase over the whole studied period. This suggests an increasing importance of schooling in determining income and consumption. In other words, the social gradient in education became steeper over the studied period.
By contrast, the social gradient in health was relatively flat in our dataset. Individual health status appears to be weakly connected to the other attributes of individual well-being. When excluding individuals with perfect health condition from our calculation, we find similar values of the coefficients of correlation. The only difference is that the correlation with education switches from positive to negative in the period 2002–2008 (see Table A5 in Appendix A). However, since the health–education correlation coefficients are relatively small in absolute value, the change of sign is only of minor importance.

6.3. Inequality in Well-Being: The Reference Case

Although we allow for flexibility in the degrees of inequality aversion ( ϵ ) and substitutability ( β ), we begin our analysis of multidimensional inequality by choosing a specific value for each of these parameters. We treat this as our reference case. The chosen set of values is ϵ = 2 and β = 0 .

6.3.1. Single Dimensions

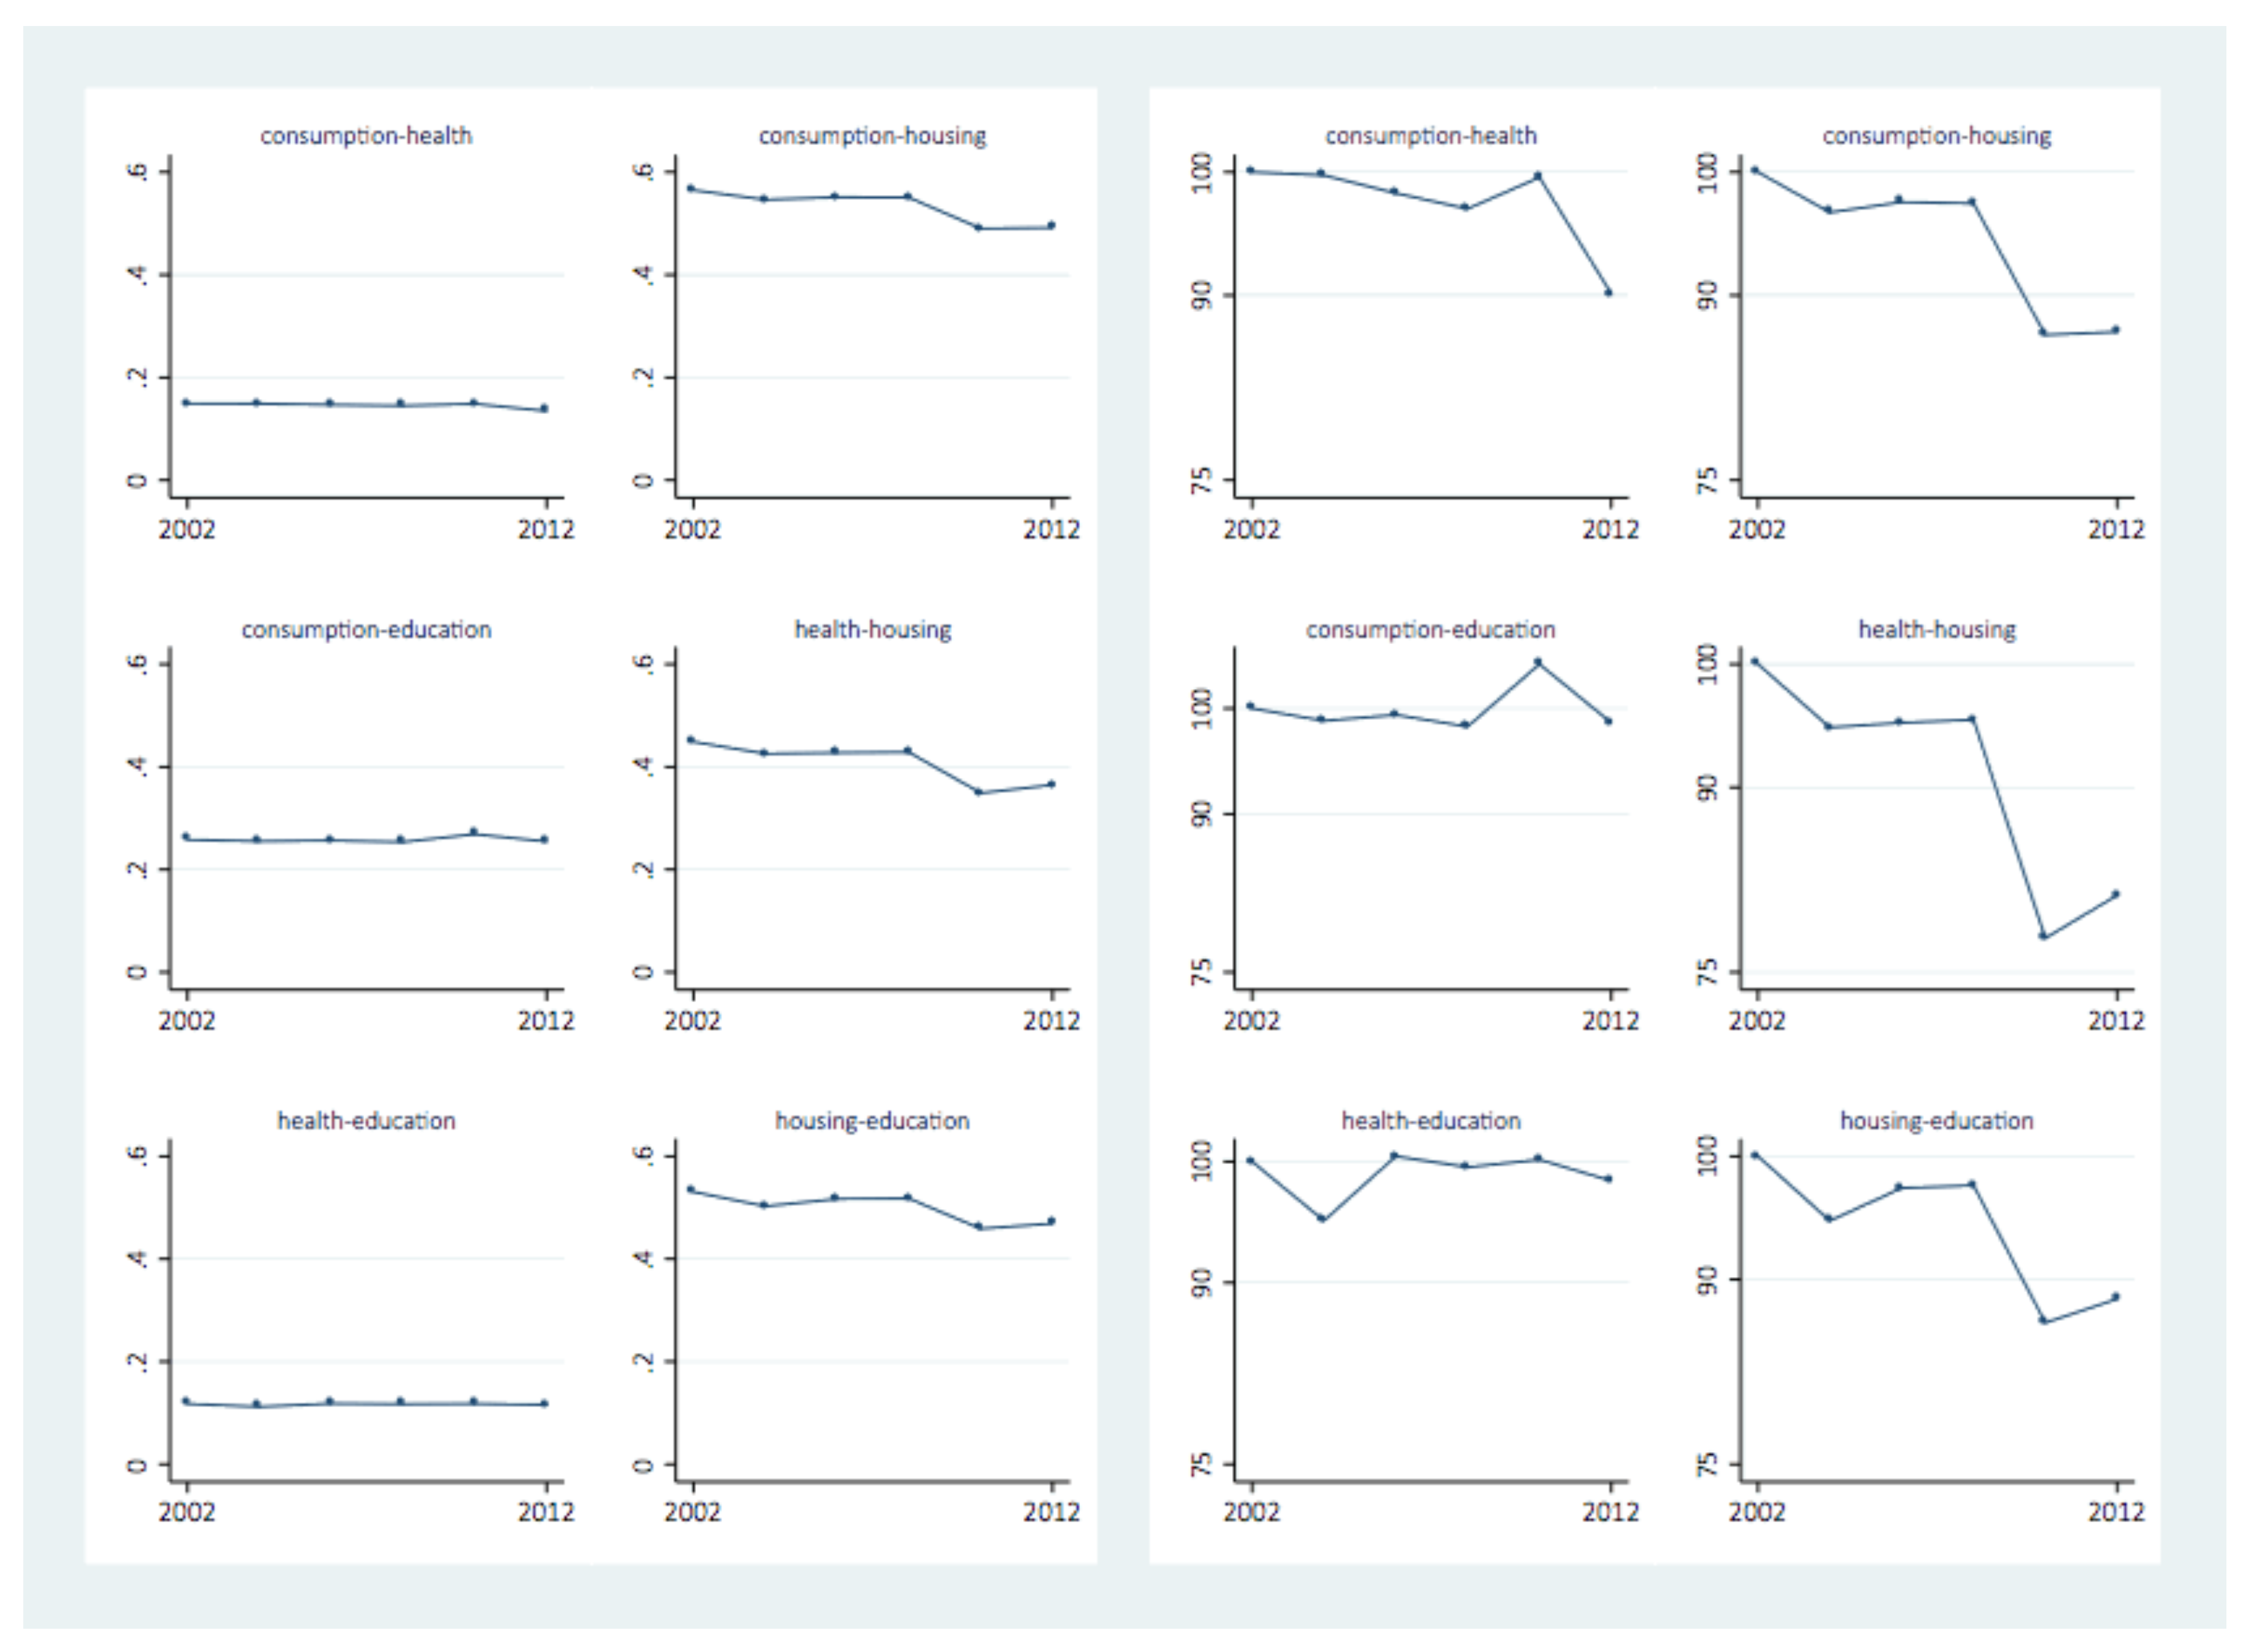
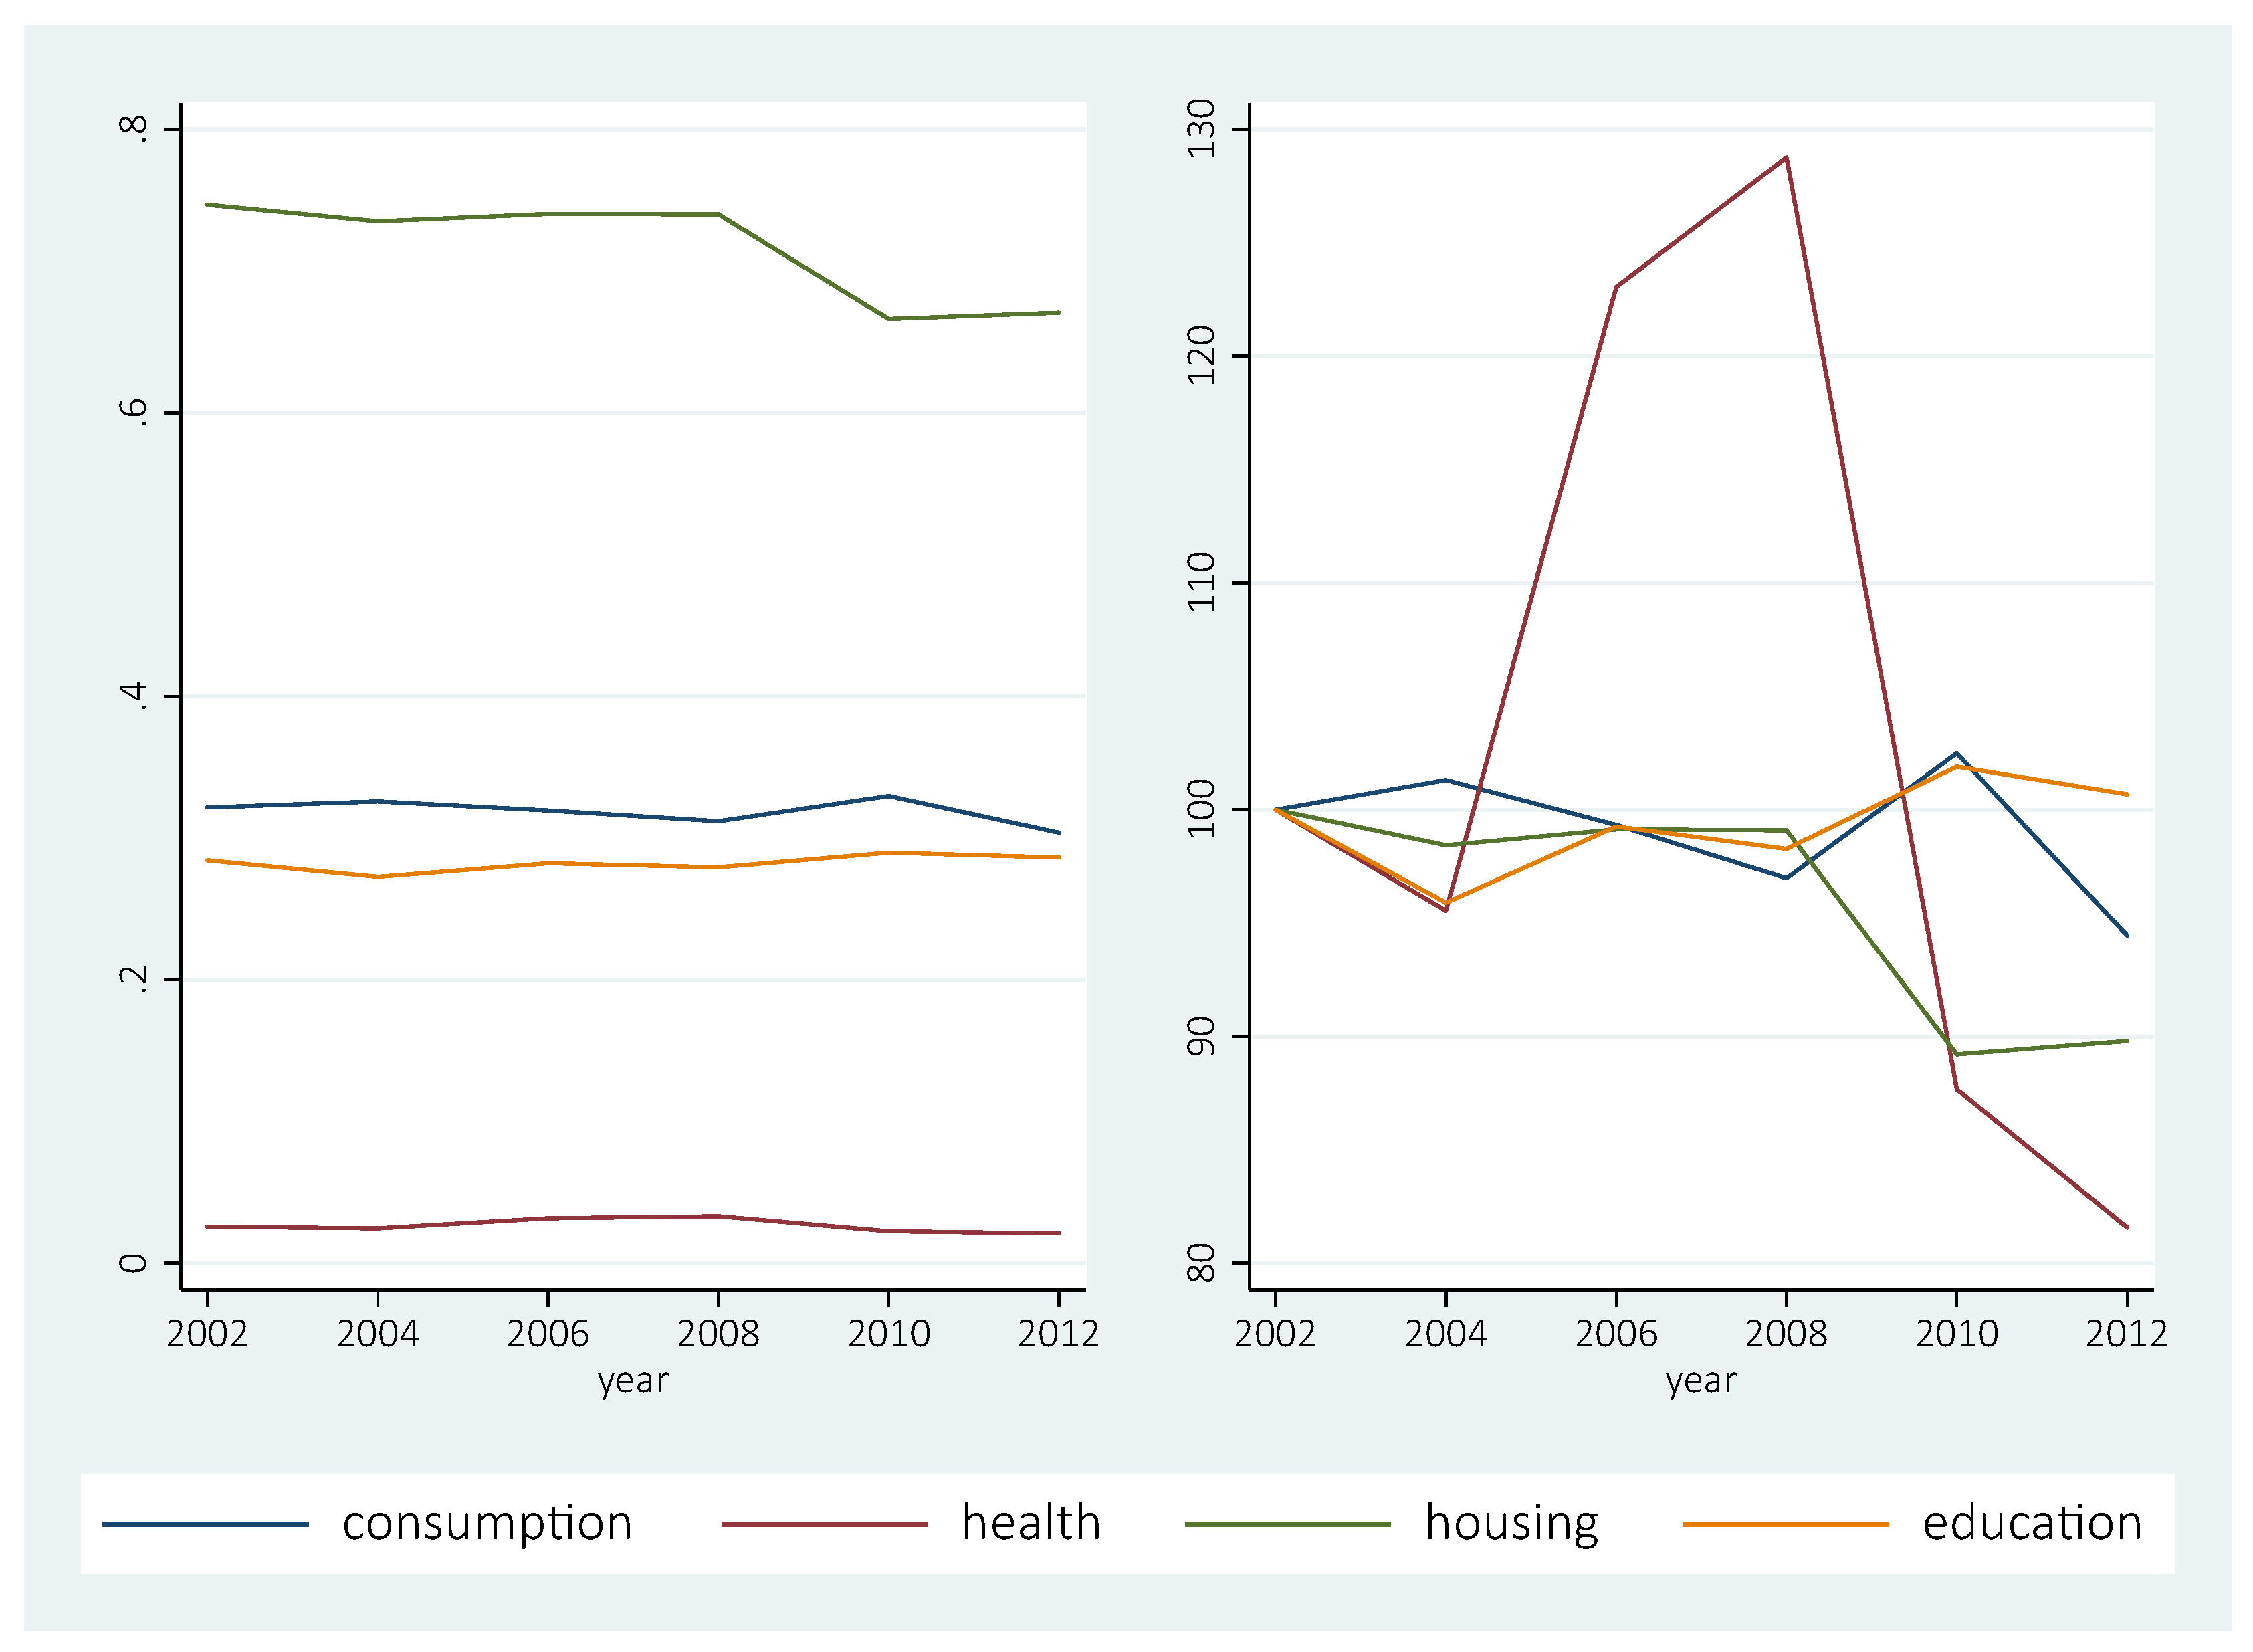
We start by looking at the level and evolution of inequality in each dimension separately. We measure inequality by means of the one-dimensional Atkinson index. The results can be found in Figure 1. The left panel shows that, throughout the study period, the highest degree of inequality was observed in the dimension of housing, and the lowest in the dimension of health. Moderate levels of inequality were present in the dimensions of consumption and education. The right panel provides evidence on the changes in inequality in comparison to the initial year of the study period. In relative terms, inequality in housing and inequality in health appear to have fluctuated most. With the exception of education, all dimensions had lower levels of inequality in 2012 than they had in 2002. On the whole, it seems that the levels of inequality in the separate dimensions remained relatively stable, with a modest tendency to decrease.
Inequality in consumption remained fairly stable between 2002 and 2008. It rose substantially between 2008 and 2010, but dropped again between 2010 and 2012. Inequality in health seems to be quite unstable over the years, but we have to take into account that its level remained very low, which means that small absolute changes are translated into great relative changes. Inequality in housing, by contrast, has remained very high throughout the study period. Remarkably, the only substantial decrease occurred between 2008 and 2010, when inequality in consumption increased considerably. Finally, inequality in education remained almost unchanged for the whole period. Given that the average level of education increased, the two facts together suggest that the progress in Vietnam’s educational achievement was not only the result of advances at the top of the distribution, but also at the bottom. This is a remarkable result in view of the fact that, as observed above, there is evidence of an increasing positive correlation between education and consumption in Vietnam (see Table 4).
A study of the distribution of each attribute separately provides only a partial view of the inequality of well-being and its evolution over time. For a more complete picture, we have to consider several attributes jointly. We do this by looking successively at combinations of two, three and four attributes.

6.3.2. Two Dimensions

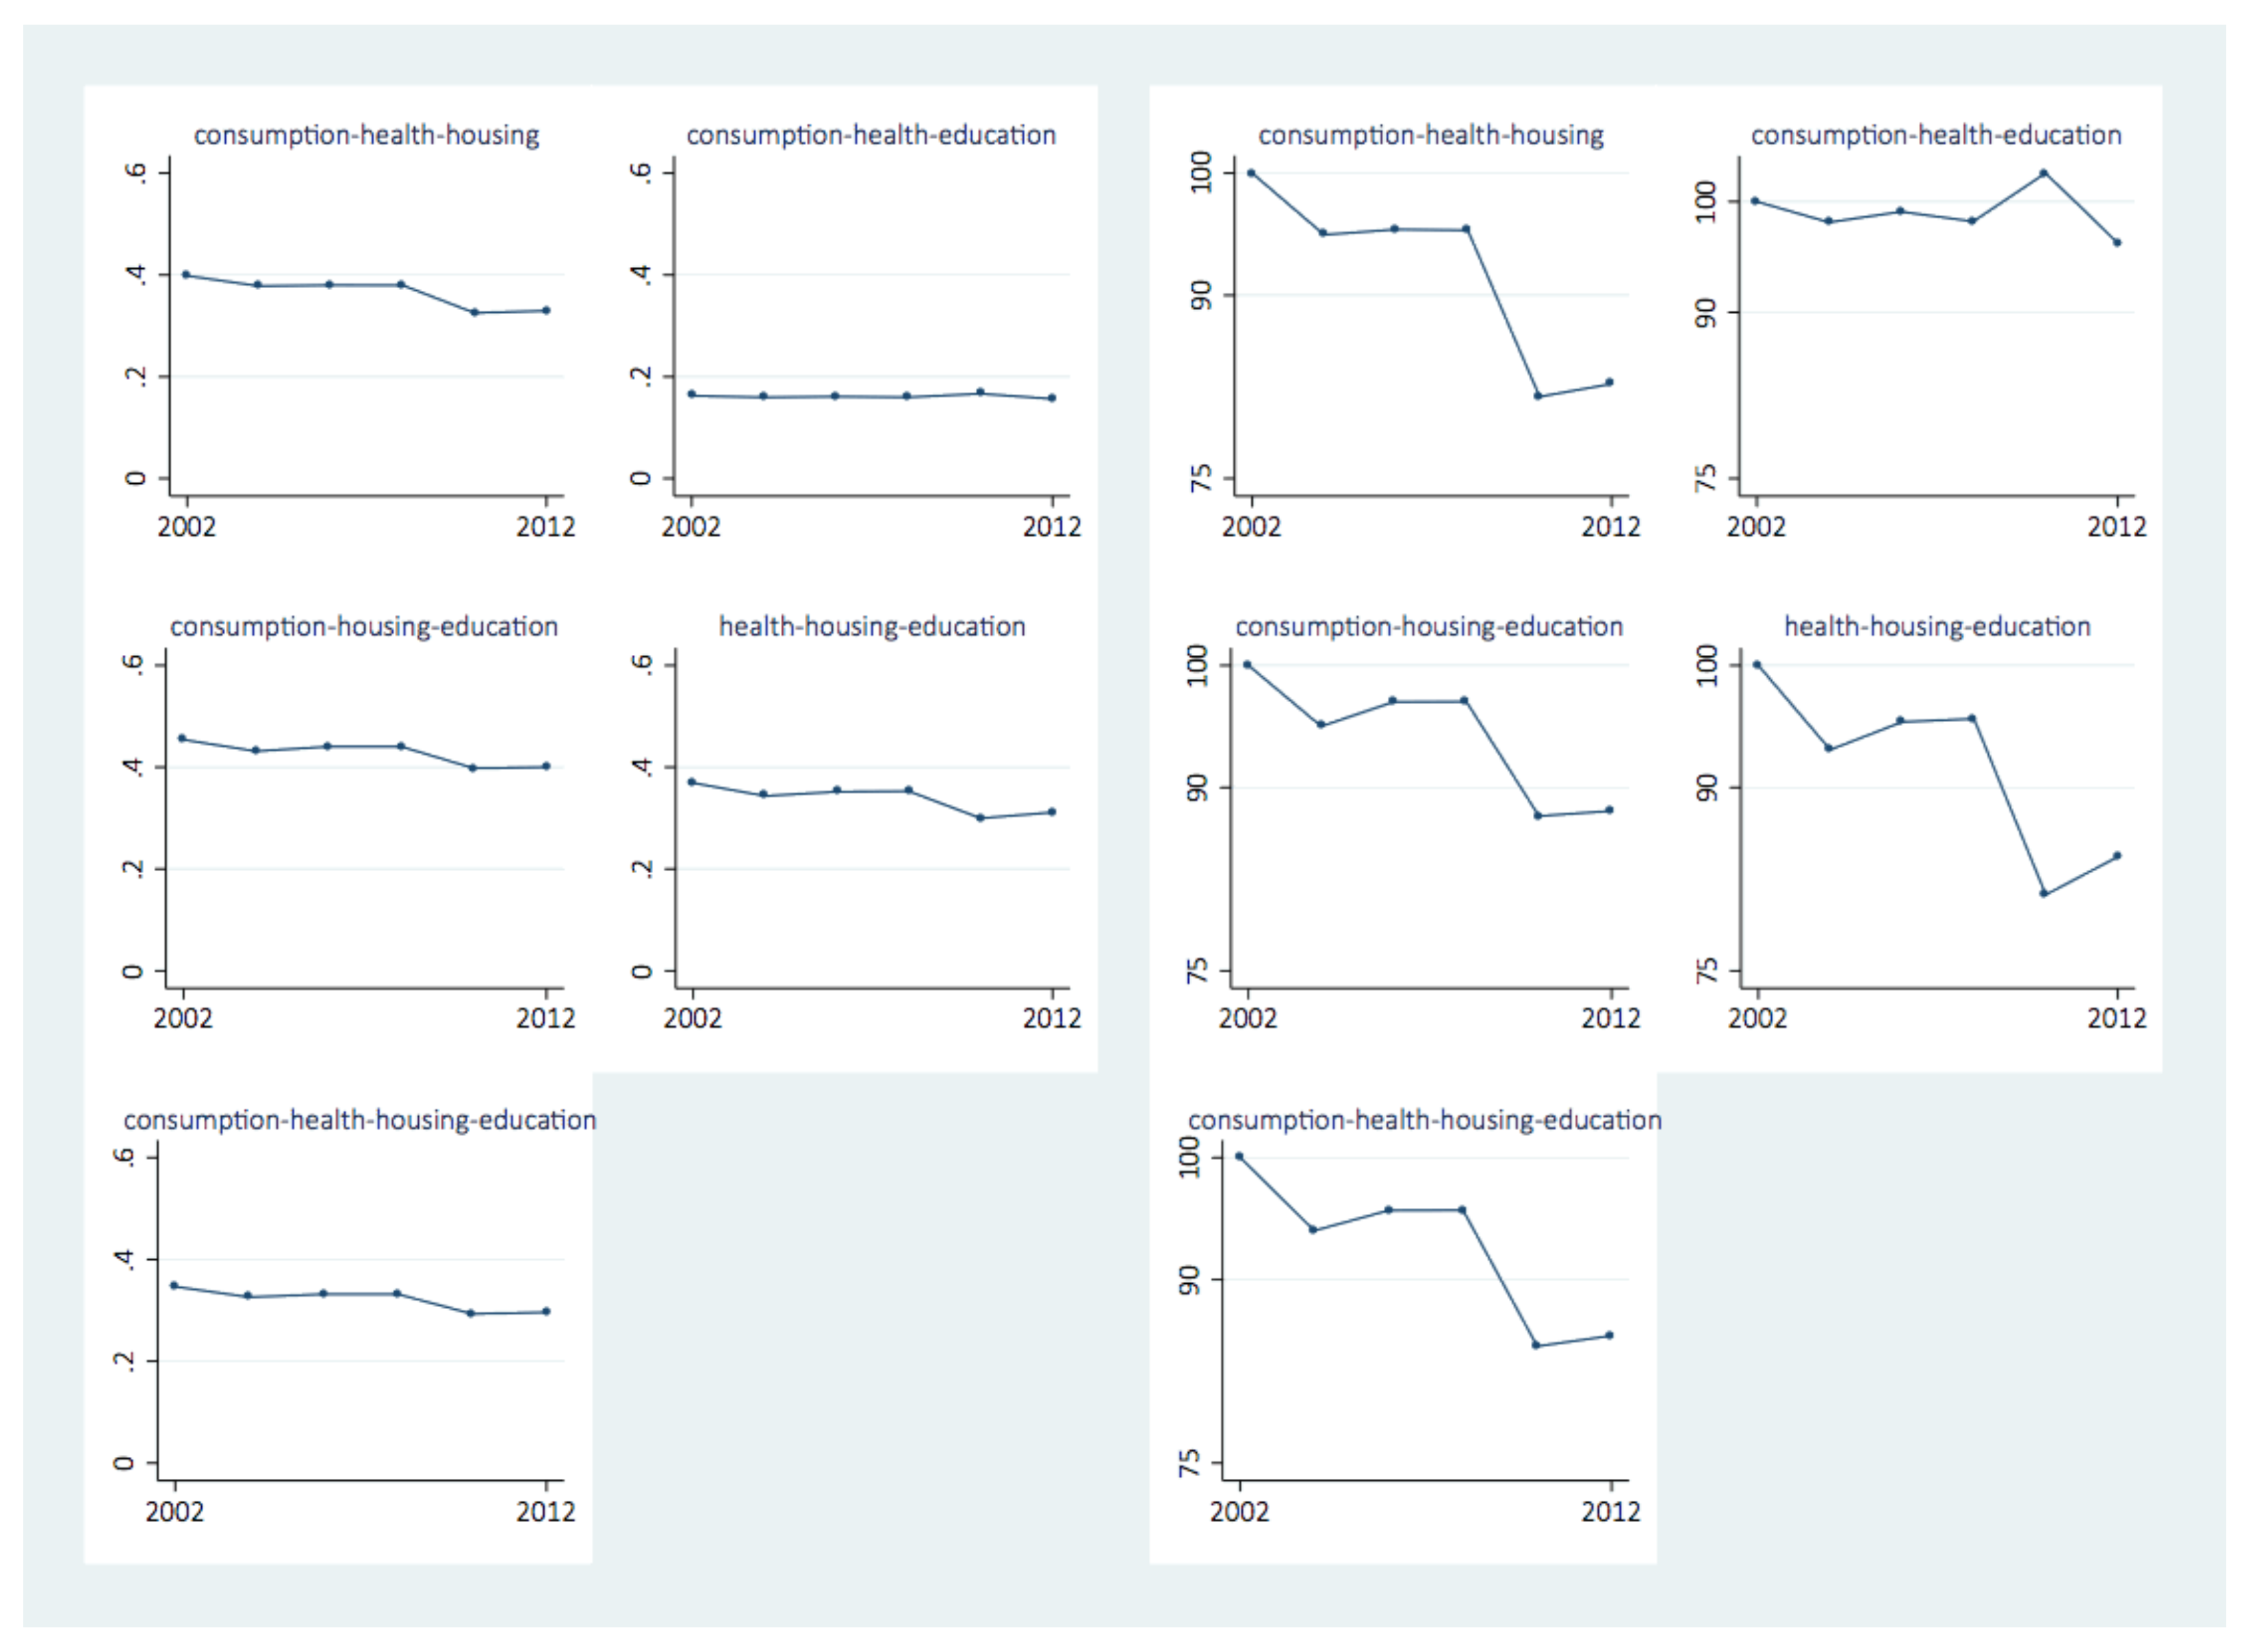
Figure 2 presents the level and evolution of the six possible types of two-dimensional inequality of well-being. The left panel makes it clear that all combinations involving housing had relatively high levels of inequality. The combinations consumption–health and health–education were characterized by relatively low levels of inequality. The right panel allows us to say more about the evolution of each type of inequality. For all combinations of two well-being attributes, the level of inequality in 2012 was lower than it was in 2002, with the strongest decreases taking place in the three combinations with housing. It is remarkable that for these combinations the level of inequality dropped sharply between 2008 and 2010 and increased between 2010 and 2012, while for the combinations consumption–health and consumption–education the opposite occurred. The level of inequality for the combination health–education remained more or less the same throughout the study period. Overall, what we see is that all types of two-dimensional inequality decreased between 2002 and 2004, increased slightly or remained roughly equal between 2004 and 2008, and fluctuated most heavily between 2008 and 2012. This suggests that the evolution of multidimensional inequality has not been uniform over the whole study period. We now have to check whether this holds true also if we take into consideration three of four dimensions.

6.3.3. Three Dimensions

The levels and evolution of the four types of three-dimensional inequality resemble those of the two-dimensional inequalities. The levels of the three types of inequality involving the housing dimension are higher than the one without housing. The highest level of inequality is observed for the consumption–housing–education combination. While inequality remained fairly stable (at a low level) for the consumption–health–education combination, it decreased substantially for the other combinations, mainly as a result of sharp drops between 2002 and 2004 and between 2008 and 2010. From 2004 to 2008, inequality remained stable or increased slightly, while, from 2010 to 2012, it increased, except for the consumption–health–education combination. The overall picture is that inequality appears to have decreased between 2002 and 2012, with the largest changes occurring between 2002 and 2004 and between 2008 and 2010.

6.3.4. Four Dimensions

This is also what we observe if we look at the evolution of the level of four-dimensional inequality (see Figure 3). Between the beginning and the end of our period of study, the level of inequality has clearly decreased. We observe a statistically significant fall from 0.34 to 0.30. The level of inequality also fluctuated a bit in between. The most substantial changes occurred between 2002 and 2004 and between 2008 and 2010. Inequality statistically significantly decreased from 0.35 to 0.33 and from 0.33 to 0.29, respectively. For the rest of the period, inequality remained more or less the same. We present the estimates of inequality for all years and their confidence intervals in Table A6 of Appendix A. The fact that multidimensional inequality attained its lowest level in 2010 is the result of both changes in the distributions of the separate well-being attributes and of changes in the way they are correlated. In other words, it is not something which can be deduced simply by looking at the levels of inequality in each single dimension. In fact, the levels of inequality in education and consumption reached a peak in 2010; only the level of housing inequality was at its lowest in 2010.

6.4. Inequality in Well-Being: Sensitivity Analysis

Thus far, we have assumed a specific set of values for the degrees of inequality ( ϵ = 2 ) and of substitutability ( β = 0 ). We now explore what is the effect of changing the values of these parameters, especially on the trends of inequality over time. Recall that higher values of the inequality parameter express more sensitivity to the bottom of the well-being distribution, while higher values of the substitutability parameter indicate more substitutability between the different dimensions taken into account to calculate individual well-being levels. A priori, it is very difficult to predict how changes in the two parameters will affect the estimated values of the multidimensional Atkinson index. In this section, we extend our empirical analysis and look at different combinations of ϵ and β in order to determine whether and how the pattern of evolution of multidimensional inequality changes. More specifically, we investigate the evolution of the 11 different types of multidimensional inequality (i.e., the six combinations involving two dimensions, the four combinations involving three dimension and the single combination involving four dimensions) for six different values of ϵ 0.5 , 1 , 2 , 3 , 4 , 5 and six different values of β 5 , 3 , 1 , 0 , 0.5 , 1 . In all cases, our focus is on the difference between the extent of inequality at the beginning of the study period (2002) and the end (2012). For each type of multidimensional inequality, we therefore have 36 estimates of the difference.
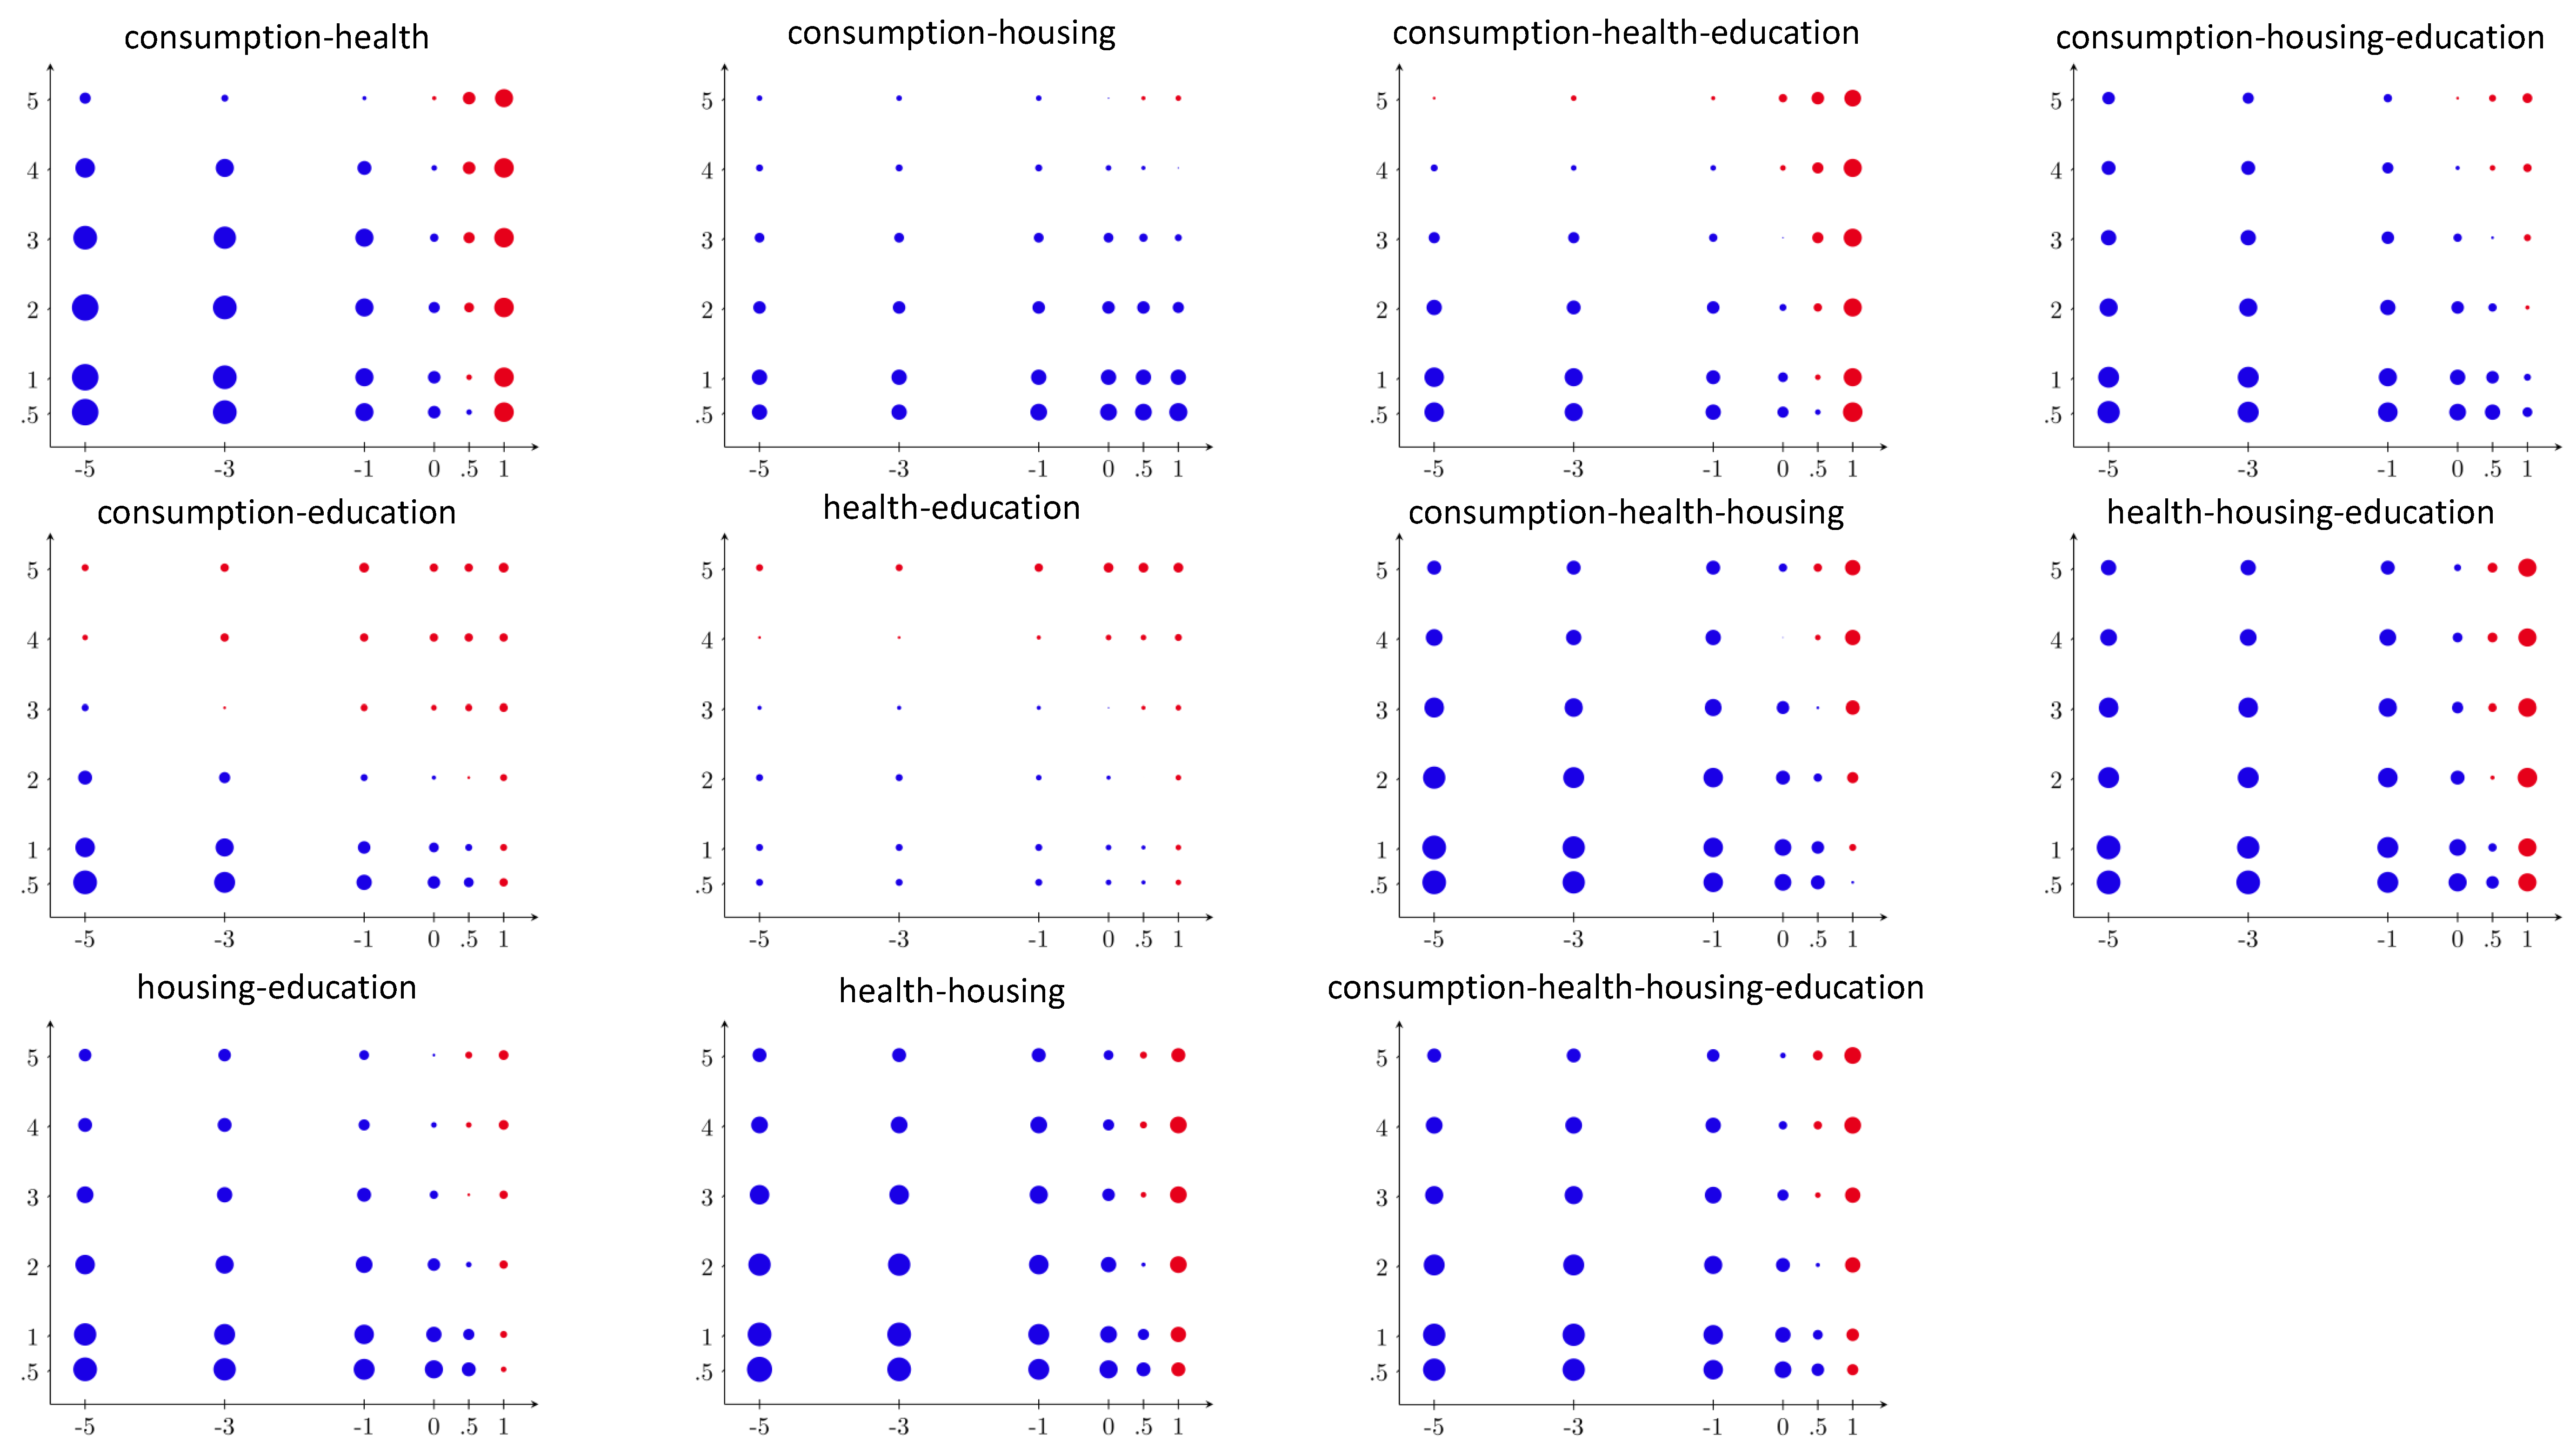
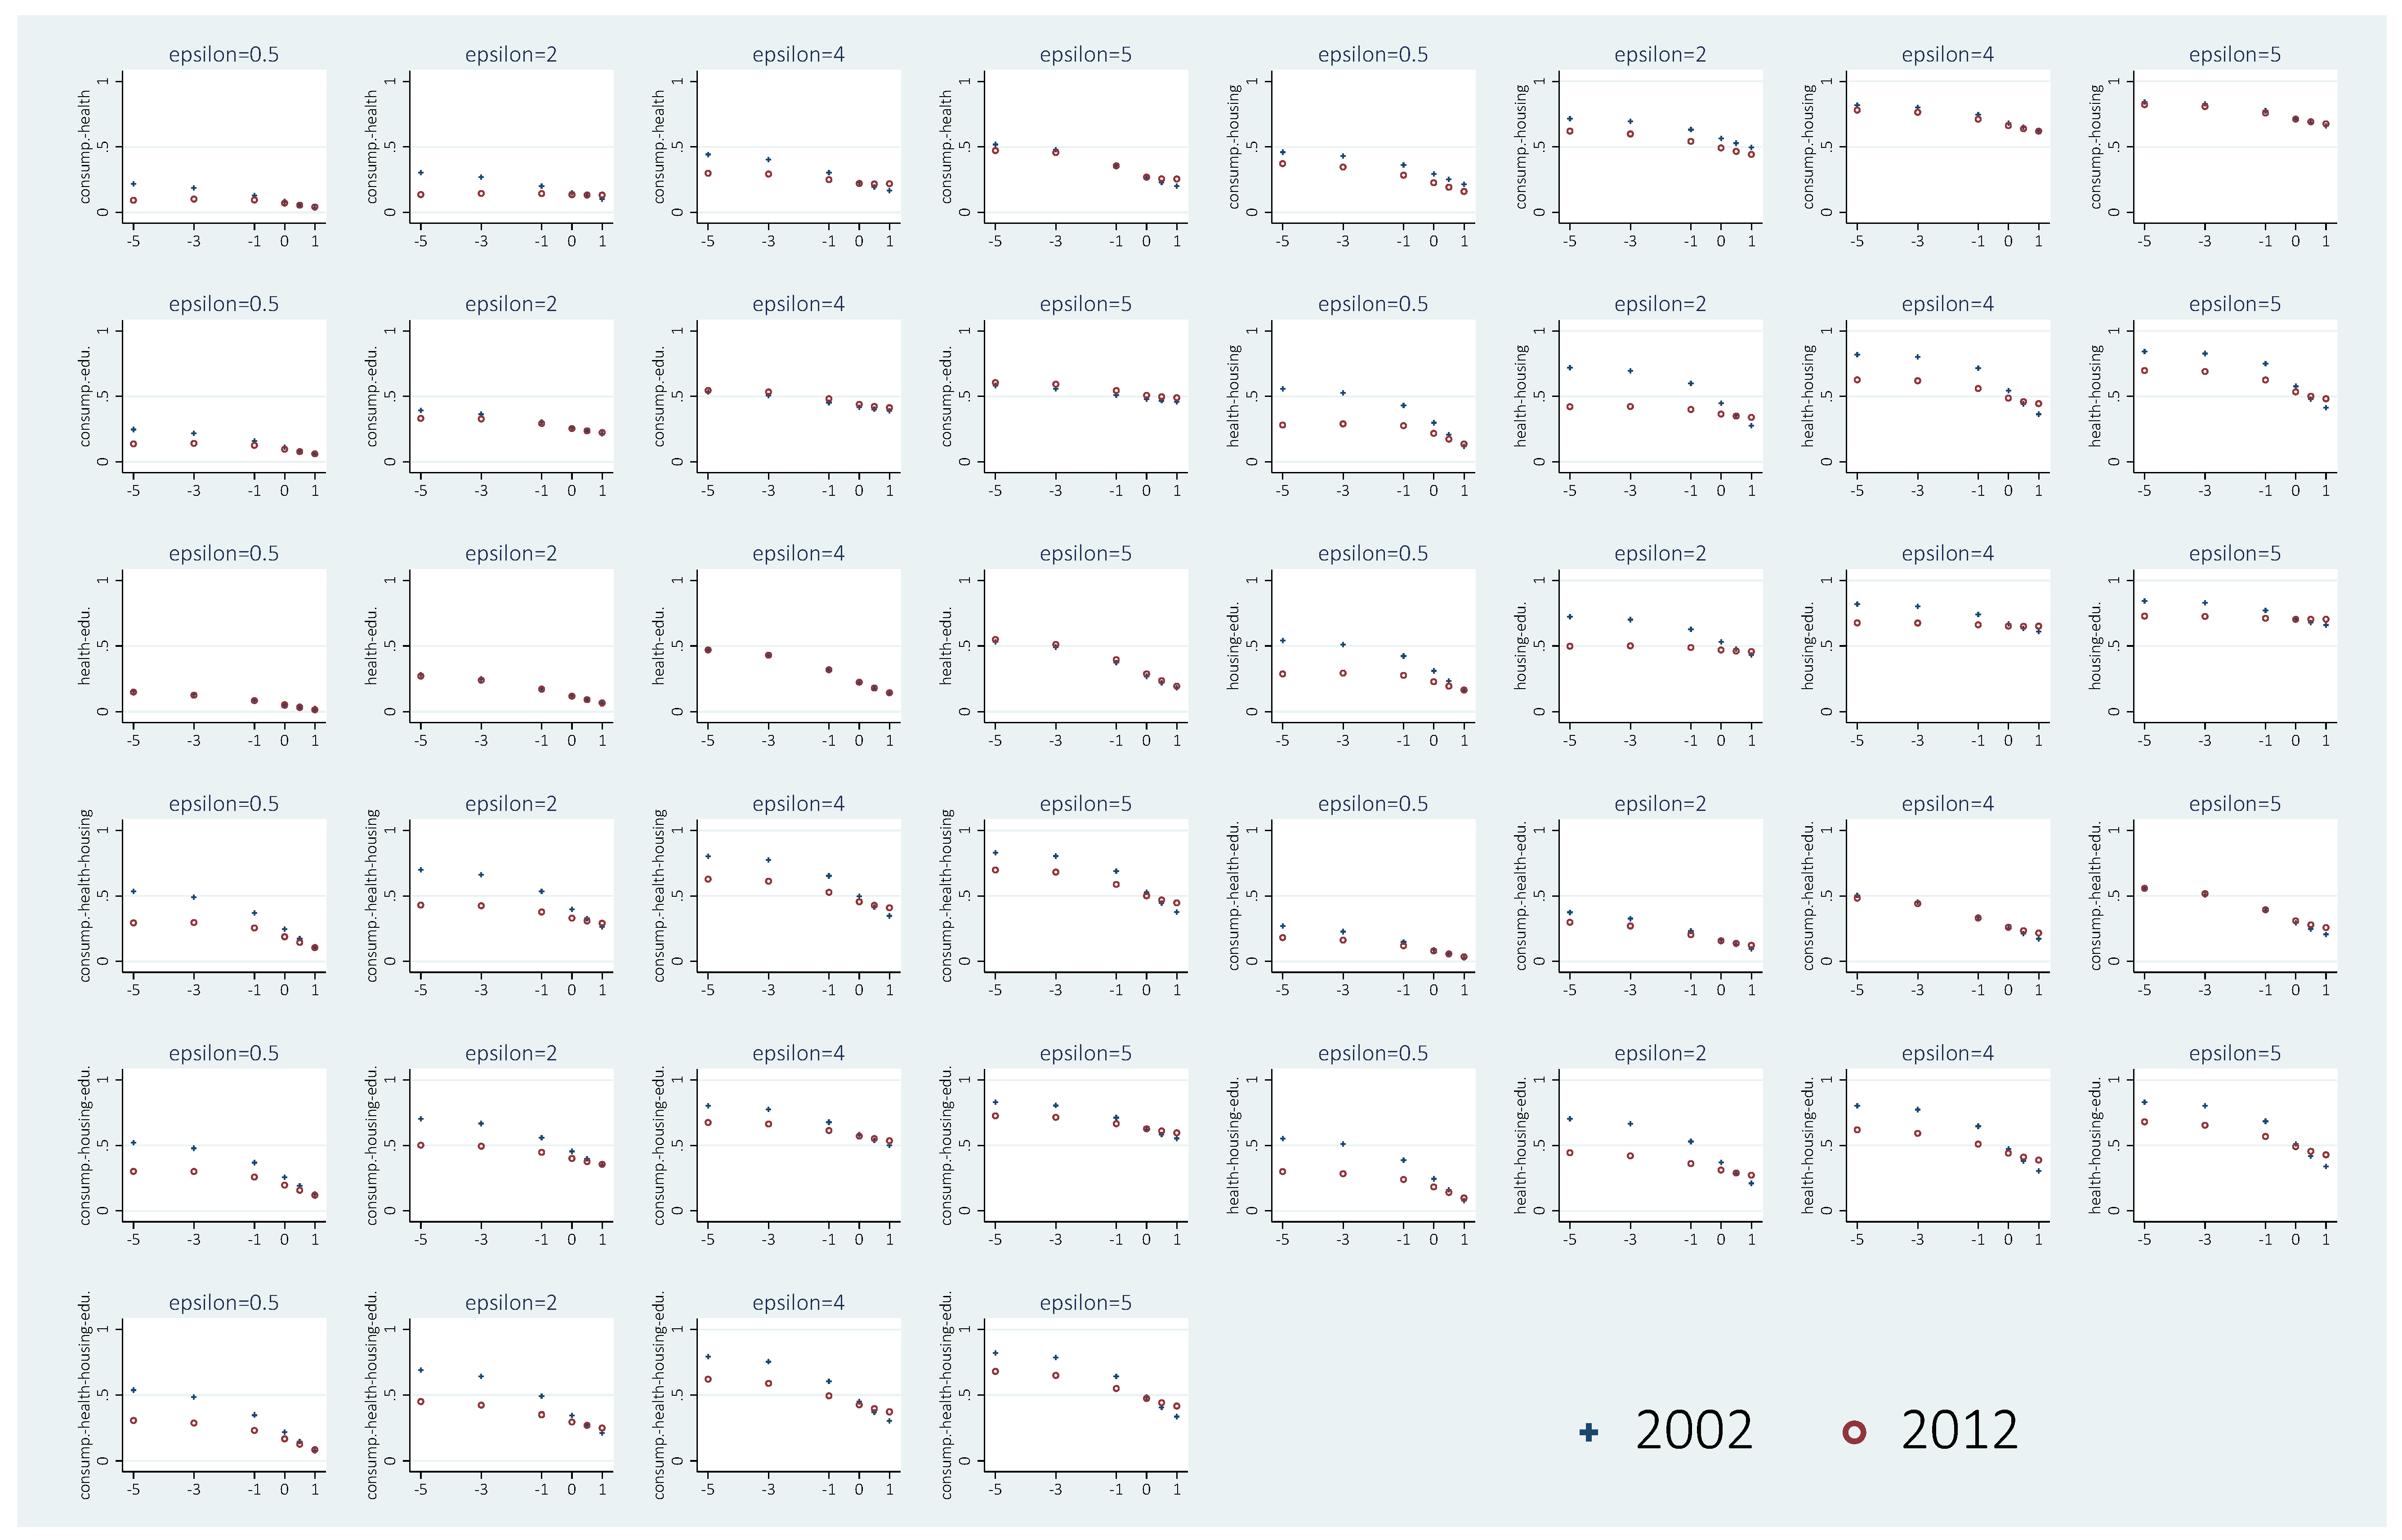
In Figure 4, we report the results by means of colored dots. The color of the dot indicates whether the level of inequality has gone up (red) or down (blue). The size of the dot is proportional to the absolute value of the relative change in inequality, i.e., I e n d I b e g i n I e n d I b e g i n I b e g i n I b e g i n . The largest dot (in the bottom left corner of the consumption–health panel) represents a relative change of 57.60 % . Let us begin by looking at the sign of the change. In the reference case ( ϵ = 2 and β = 0 ), we found that inequality decreased for all types of multidimensional inequality. This holds for 15 out of 36 cases. In 19 cases, some types of multidimensional inequality increased, while others decreases. Remarkably, in two cases, all types of multidimensional inequality increased. Obviously, we cannot claim that multidimensional inequality has decreased irrespective of the values of the two parameters. However, since there are many more cases in which all types of multidimensional inequality decreased rather than increased, what we can say is that a decrease of multidimensional inequality seems more likely than an increase. Zooming in on the individual types of inequality, we find that a decrease is most likely for the consumption–housing combination (34 out of 36 cases) but less likely for combinations including education. All combinations involving housing tend to have relatively high probabilities of decrease: consumption–housing–education (29/36), consumption–health–housing (29/36), housing–education (27/36), health–housing (27/36), consumption–health–housing–education (27/36), and health–housing–education (26/36). Lower probabilities are observed for consumption–health (24/36), consumption–health–education (20/36) and especially health–education (18/36) and consumption–education (15/36).
A clear pattern emerges from the color maps: higher values of β and ϵ seem to be associated with higher probabilities of increase. For practically all types of inequality, we find increases when β reaches its maximum value of 1, whatever the value of ϵ , and a broadly similar result holds when β = 0.5 . By contrast, when β is equal to −5, −3, −1 or 0, we find decreases for most types of inequality. As far as ϵ is concerned, when its value is equal to 5, we find increases for three types of multidimensional inequality (consumption–education, health–education and consumption–health–education), whatever the value of β . For lower values of ϵ , we tend to find more and more instances where inequality decreases. Put differently, we are more likely find decreasing inequality if we assume a relatively low degree of substitutability between the dimensions of well-being and a not very high degree of aversion to inequality.
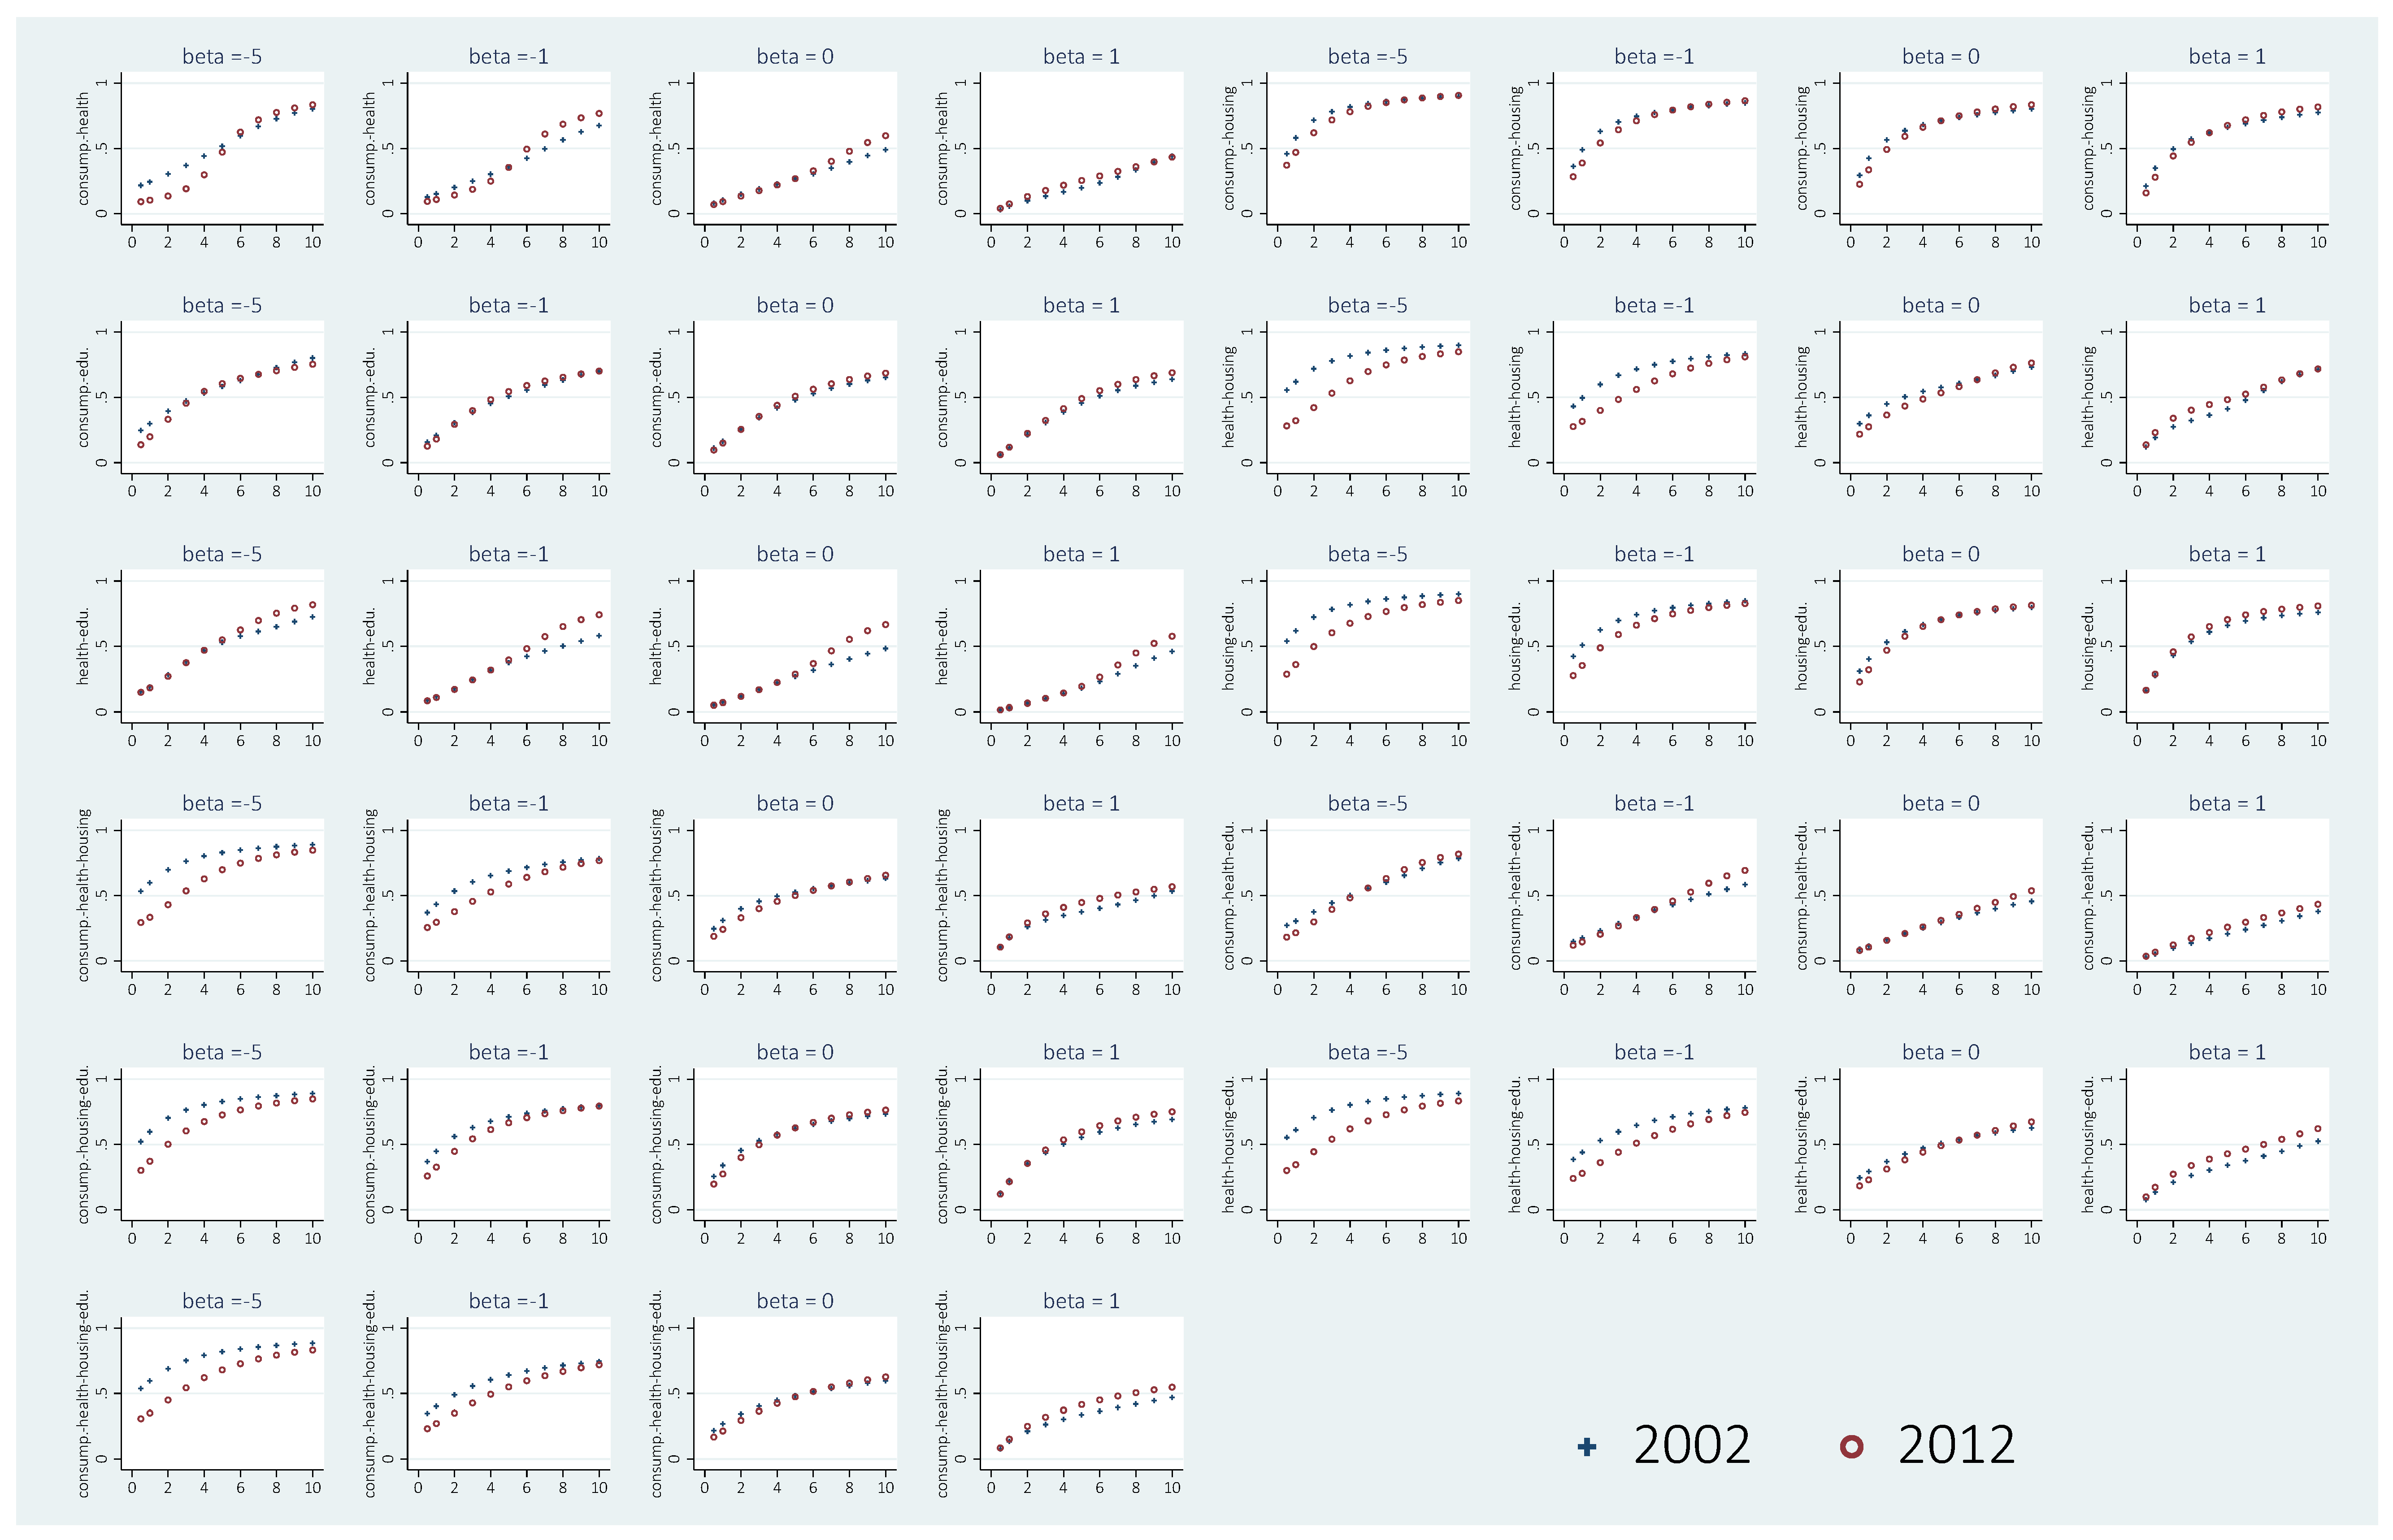
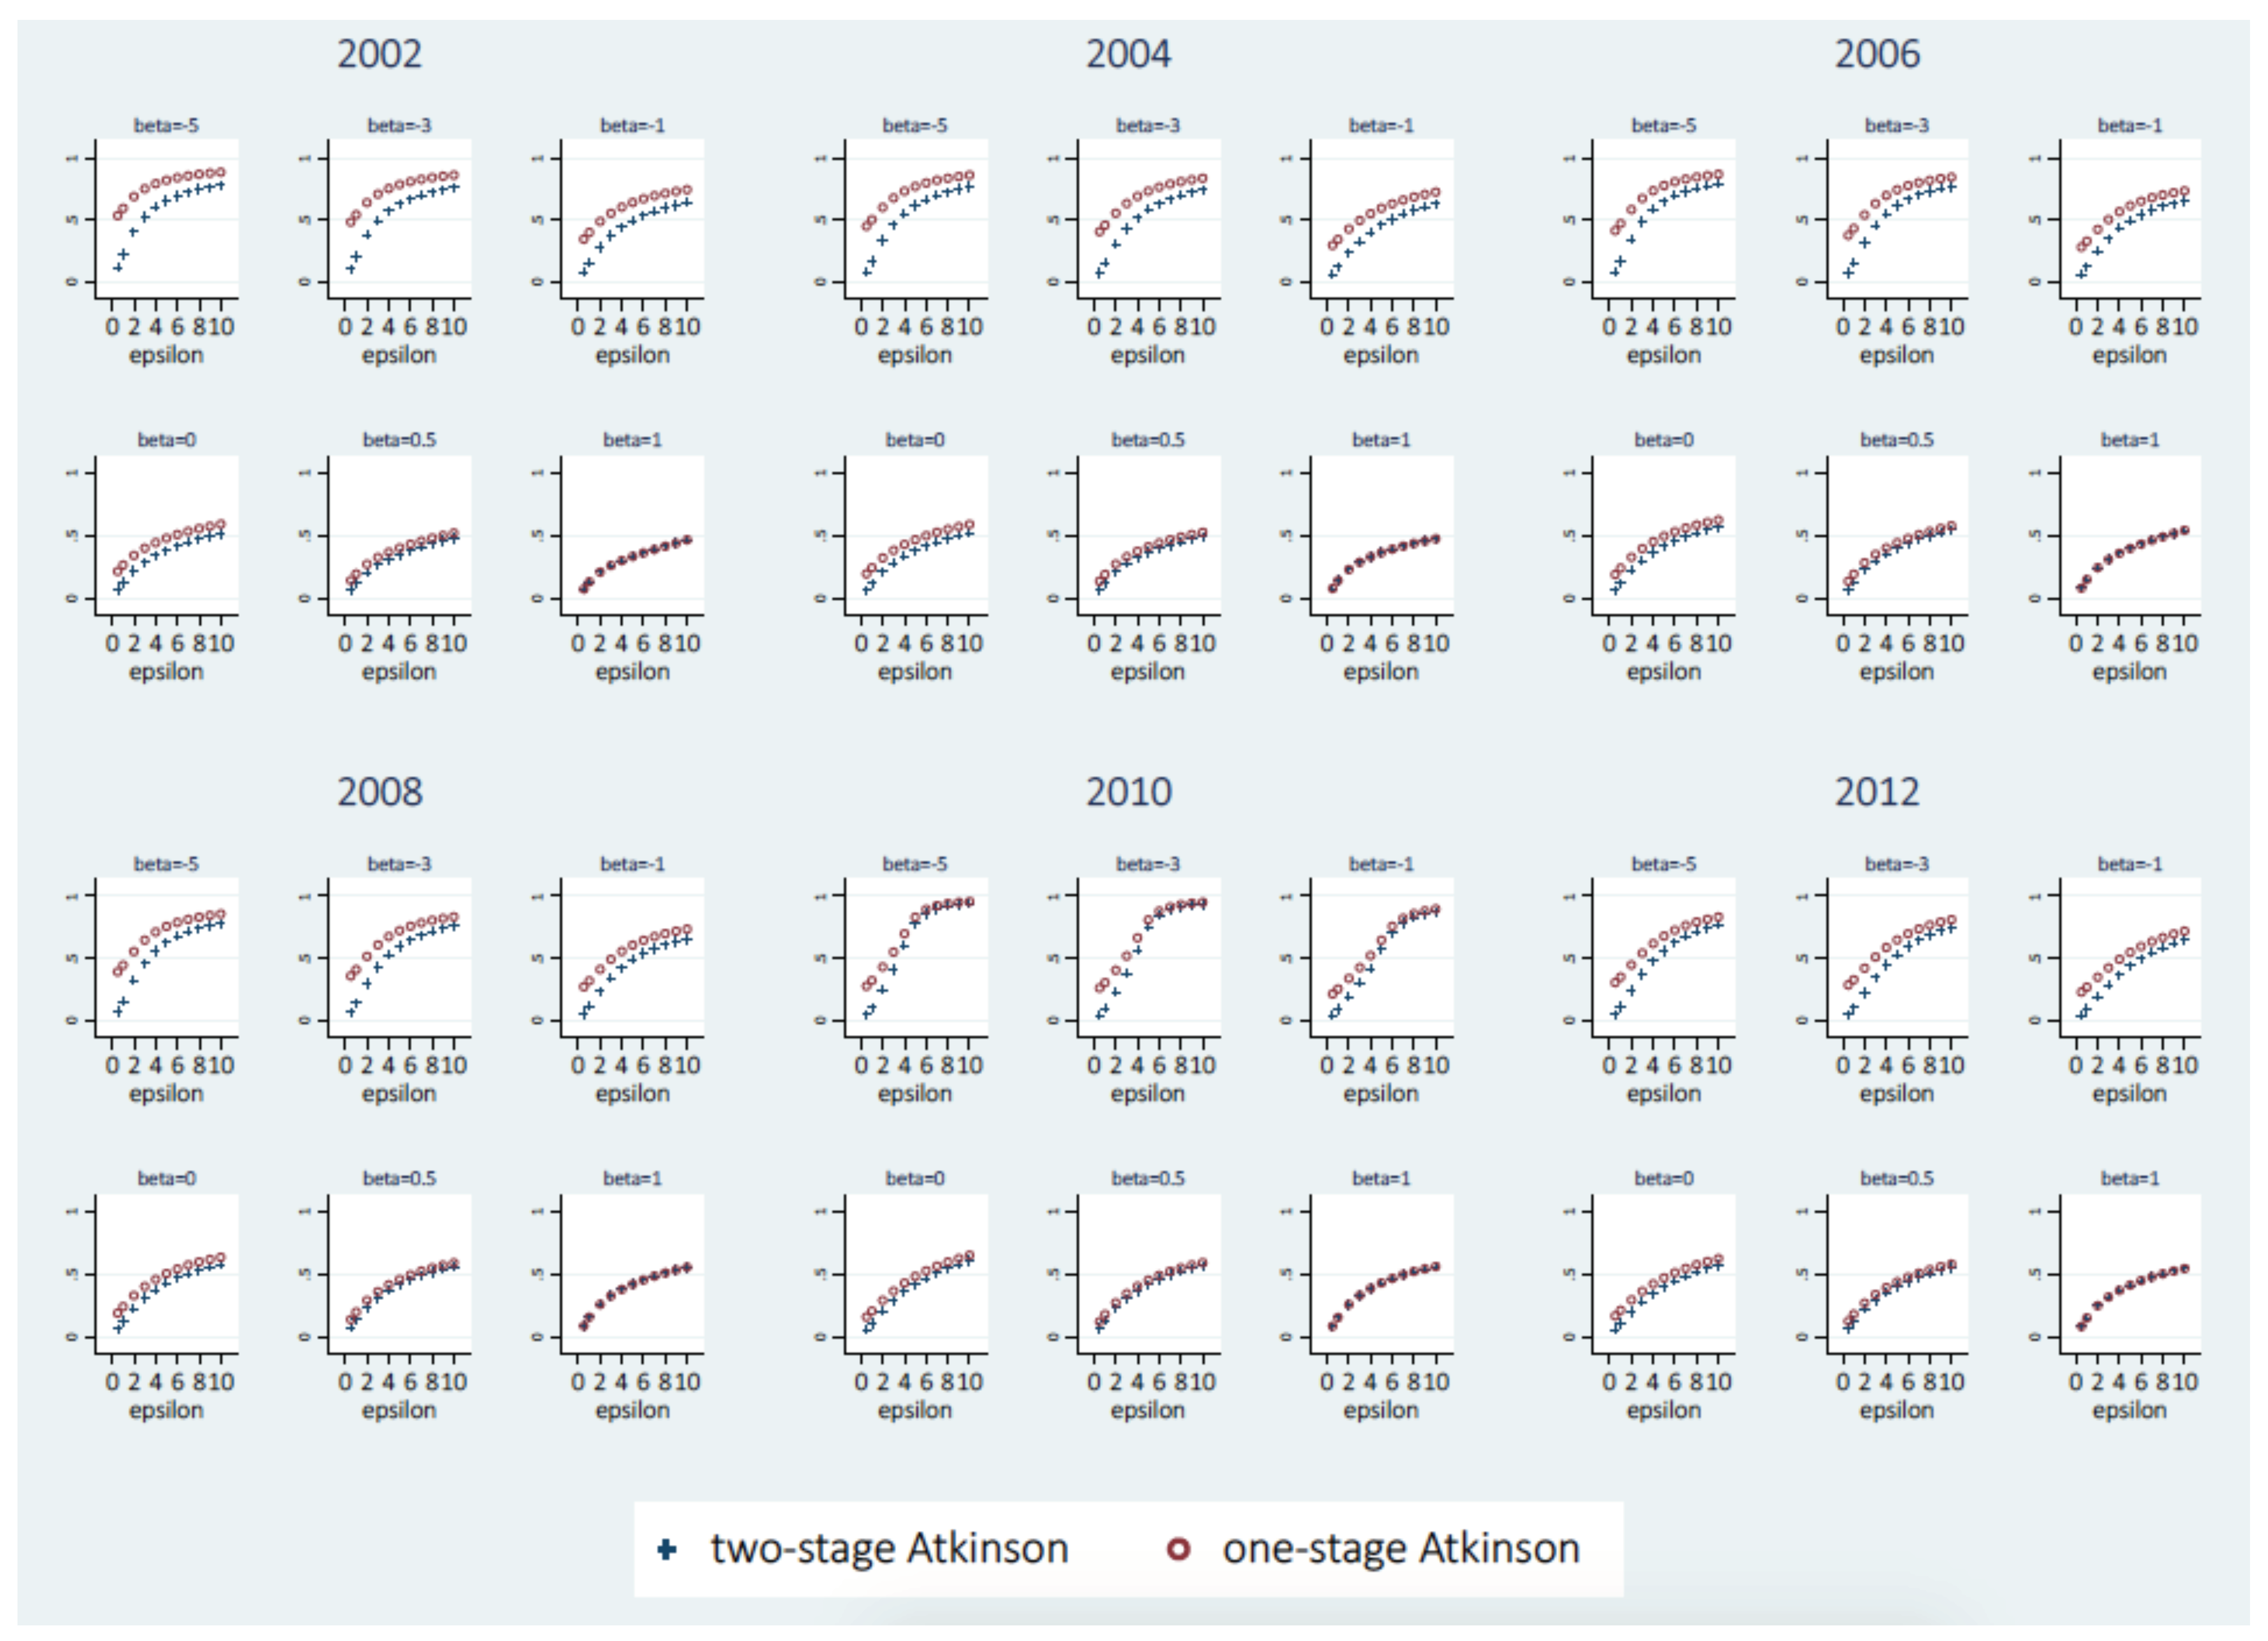
The relative magnitudes of the changes in inequality, indicated by the size of the dots, suggest that the effect of the changes in parameters are gradual. The blue dots tend to get bigger if one moves to the left (i.e., if β decreases) or to the bottom (i.e., if ϵ decreases), while the red dots tend to get bigger if one moves to the right or to the top. Additional information on the effects of changes in the two parameters can be obtained from Figure 5 and Figure 6. The first of these allows us to see how, for given values of β , changes in ϵ affect the values of selected types of multidimensional inequality at the beginning and end of the study period. The second allows us to do the same for changes in β , given values of ϵ .

6.5. Measurement Procedure Using the Atkinson Index: One-Stage vs. Two-Stage Approaches

The above empirical findings are based on the one-stage Atkinson approach, using direct calculation on the attainment levels of each dimension across individuals. As pointed out before (see Section 2.2), it is also possible to follow a two-stage measurement approach which aggregates across dimensions first, and then applies a one-dimensional inequality index to the estimated levels of individual well-being. To check the robustness of our estimates, we compare the levels of multidimensional inequality obtained by the one-stage Atkinson approach with those of the two-stage approach using the one-dimensional Atkinson index in the second stage.
We present here the results only for the case where well-being is determined by four dimensions. We observe a similar decrease in multidimensional inequality of well-being over the period 2002–2012. Figure 7 displays in detail the levels of inequality following the two approaches. The one-stage approach tends to generate higher estimates of inequality than the two-stage approach. The difference in outcome between the two measurement procedures decreases with the rise in degree of inequality aversion and substitutability, and it ceases to exist when the degree of substitutability reaches its highest level, β = 1 .

7. Discussion

7.1. Policy Aspects

Our results show that the choice of the degrees of substitutability and inequality aversion influences the magnitude and even the sign of the change in multidimensional inequality. Our estimates mostly suggest a decrease of the multidimensional inequality over the study period for all levels of dimensional substitutability when we assume a moderate degree of inequality aversion ( ϵ < 3 ). Only when we adopt the rather extreme assumption of perfect substitutability between dimensions do we almost always observe inequality increasing between 2002 and 2012. From this, we tentatively draw the conclusion that in Vietnam well-being, as determined by consumption, health, education and housing, was distributed more equally in 2012 than it was in 2002. It would of course be very interesting to know to what extent the evolution of inequality has been the determined by policies and policy changes in Vietnam. A detailed analysis of Vietnam’s policies with regard to economic growth, education, health and housing is outside the scope of this paper. As far as economic growth is concerned, Leung (2010) provided interesting insights on Vietnam’s policies in the period before 2002 and Benjamin et al. (2017) on Vietnam’s ’growth with equity’ trajectory in the period 2002–2014, including a comparison with China.
Our finding that higher degrees of inequality aversion tend to be associated with smaller decreases of inequality or even increases of inequality suggests that those who are worst off may not have made as much progress as those who are better off. If the reduction of multidimensional inequality is a policy objective, the implication for policymakers is that more attention should be given to those who are at the bottom of the well-being distribution. Often these are individuals who are deprived in a monetary sense (lack of income), but it may also be that they are in a bad position because of shortcomings in non-monetary dimensions (e.g., lack of health). In this respect, research on multidimensional poverty in Vietnam, such as those by Le et al. (2015); Pham and Mukhopadhaya (2018) and Pham et al. (2020), complements research on multidimensional inequality.
Which aspects of well-being should be targeted most depends in the first place on which dimensions are considered to be essential for individual well-being. We have concentrated on four dimensions (consumption, health, education and housing), but one might just as well choose to reduce, extend or change this set of dimensions. Given our selection of dimensions and of variables to measure attainments in these dimensions, we believe that housing needs to be treated attentively. Inequality is exceptionally high when it comes to housing. Even though this inequality has decreased over the study period, there is little doubt that further reductions in housing inequality will substantially reduce multidimensional inequality.

7.2. Limitations

We have assumed that the degree of substitutability between well-being dimensions and dimensional weights are homogenous for all individuals. This means that they are considered to be independent of the well-being levels attained by individuals and of individuals’ preferences. Our assumption could be considered arbitrary since the dimensional substitutability might be different at different attainment levels of well-being dimensions (Anand and Sen 1997; Mauro et al. 2018). The marginal utility of unidimensional attainment alters across the distribution of this dimension; hence, its relative importance and ability to compensate for shortages in other dimensions alter along the distribution of well-being. At the same time, the substitutability between and relative importance of well-being dimensions also vary across individuals. Different persons have their own perspectives on how a particular dimension contributes to their well-being. It seems impossible to determine these once and for all: there is no ultimate rule on how important one dimension is compared to others. There is a lot of diversity between individuals. If we were able to take these heterogeneities into account, it would increase the reliability of the evaluation. However, it remains impossible to determine the degree of substitutability and the dimensional weights for every particular individual because the data required to infer such information (e.g., life-satisfaction data) are not yet available for Vietnam. Given this condition, we believe that our assessment based on the above assumptions remains the best we can do.
There are a few other limitations of our study which deserve to be mentioned explicitly. We concentrate on the measurement of multidimensional inequality among individuals and do not attempt to see how this inequality can be decomposed any further. For instance, from a policy perspective, it could be interesting to shed light on the differences between inequality among households and inequality within households. This is a promising avenue fur future research. Furthermore, our decision to include only individuals who are at least 30 years old may be seen as unduly restrictive. The motivation for this choice is that we do not want our results to be biased by including individuals who have not yet reached their highest educational level. However, if a procedure can be developed to avoid this bias, it will certainly be useful to include also individuals who are still studying. Finally, we repeat that our health indicator is rudimentary and might not adequately reflect the true health condition of individuals. As a result, our finding that the level of inequality in health is fairly low is tentative at best. As far as we know, there is no study of the evolution of health inequality in Vietnam in the period 2002–2012, and therefore it is difficult to say to what extent our findings are accurate.

8. Conclusions

We observe a generally declining trend in multidimensional inequality and mixed tendencies in inequality of single dimensions of well-being for Vietnam between 2002 and 2012. A far as consumption and housing are concerned, their average attainments increased remarkably and their distributions became more equal. The average level of education increased with a basically stable degree of educational inequality. While the average status of individual health showed no notable improvement, health inequality tended to diminish. In general, multidimensional inequality has decreased with the expansion of average attainment of well-being in Vietnam. This fact can be considered as a success for the country, since socioeconomic growth is often accompanied by increasing inequality. It must be kept in mind, however, that our evaluation of multidimensional inequality is sensitive to the choice of the degrees of inequality aversion and substitutability between dimensions. Therefore, caution is needed when interpreting the results and when deriving policy implications.
The decrease in multidimensional inequality could be due to a decrease of inequality in one or more separate dimensions, but also to the weakening of the correlation between some dimensions. More evidence is required to clarify whether the changes in unidimensional distribution or dimensional correlation are the key drivers of this change, especially when the correlations show mixed evolutions. The noteworthy fact is that education had a stronger and increasing association with consumption and housing while the correlation between consumption and housing tended to be weaker over time. These associations can be clarified through further research on the causal relationship between education and monetary well-being attainments in Vietnam. Egalitarian policies targeting an attribute which has a strong influence on other attributes can have an equalizing effect on more than one attribute. For this reason, understanding the causal relationships between different attributes of well-being helps identify which attributes should be given priority if the goal is to reduce multidimensional inequality.

Author Contributions

Both authors contributed equally to the paper. All authors have read and agreed to the published version of the manuscript.

Funding

This research received no external funding.

Acknowledgments

We are grateful to Koen Decancq for discussions about the measurement of multidimensional inequality at the initial stages of this study. The remarks and observations of two anonymous reviewers have allowed us to improve the paper considerably. All errors are ours.

Conflicts of Interest

The authors declare no conflict of interest.

Abbreviations

The following abbreviations are used in this manuscript:
GDPGross Domestic Product
HDIHuman Development Index
OLSOrdinary Least Squares
UNDPUnited Nations Development Programme
USDUnited States Dollar
VHLSSVietnam Household Living Standard Survey

Appendix A

Table A1. Coefficients of regression equation on housing.
Coefficients.e
living space *0.5060.00016
asset0.1930.00006
type of house−0.2230.00011
big city0.8190.00025
urban0.4470.00020
access to tap water0.1940.00020
good WC0.4220.00020
access to electricity0.2330.00046
region 10.1110.00036
region 2−0.2330.00037
region 3−0.1950.00051
region 4−0.1210.00037
region 5−0.2590.00040
region 7−0.0720.00036
region 8−0.2970.00035
Number of observations36,623
R square0.716
Notes: The coefficients are obtained from an OLS regression of the logarithm of self-stated prices of households’ houses using sample weights and household sizes for the year 2012. (* Living space is measured by the logarithm of equivalized per capita square meter of the household’s total living space.) All coefficients are significant at the 1% level. Source: Own calculations based on VHLSS 2002–2012.
Table A2. Descriptive statistics of normalized dimensions of well-being.
YearMeanS.D.Min.Max.
Consumption20021.0000.8000.04810.200
20041.1590.8840.0749.532
20061.2500.9420.09214.270
20081.3301.0260.08813.500
20101.7931.5360.01323.537
20121.8621.4040.09122.187
Health20021.0000.1060.0641.034
20040.9940.1060.0731.034
20060.9910.1140.0771.034
20080.9890.1190.0751.034
20100.9950.1030.0781.034
20121.0010.0970.0551.034
Housing20021.0002.0830.03627.445
20041.5122.4900.05125.570
20061.6582.6760.05133.175
20081.8352.8560.05526.027
20102.4123.1750.04927.151
20122.1293.1950.06330.758
Education20021.0000.4610.2492.237
20041.0150.4470.2492.237
20061.0370.4640.2492.237
20081.0550.4700.2492.237
20101.0750.4880.2492.237
20121.0810.4880.2492.237
Source: Own calculations based on VHLSS 2002–2012.
Table A3. Descriptive statistics of well-being indicators—two dimensions, β = 0 .
WB IndicatorYearMeanS.D.Min.Max.
consumption–health20020.9440.3340.1713.248
20041.0160.3520.2023.140
20061.0560.3600.2243.842
20081.0880.3730.2093.737
20101.2630.4450.1054.933
20121.3000.4220.1874.790
consumption–housing20020.9041.1990.07013.722
20041.2051.3510.09711.851
20061.3111.4230.11319.308
20081.4231.5280.09316.272
20101.9411.9140.04721.840
20121.8211.8290.13122.106
consumption–education20020.9440.4880.1464.459
20041.0280.5130.1354.354
20061.0810.5340.1514.613
20081.1270.5620.1675.169
20101.3230.6980.1006.717
20121.3580.6750.1977.045
health–housing20020.7840.6260.0795.325
20041.0010.7100.0925.143
20061.0520.7390.1225.858
20081.1110.7750.1235.188
20101.3440.7830.1745.299
20121.2380.7800.1175.640
health–education20020.9680.2580.1981.521
20040.9750.2520.2181.521
20060.9820.2600.1871.521
20080.9900.2610.1951.521
20101.0020.2650.1611.521
20121.0070.2640.1171.521
housing–education20020.8130.7940.0997.672
20041.0370.8940.1127.130
20061.1130.9450.1128.122
20081.1901.0070.1177.194
20101.4431.0800.1107.486
20121.3351.0740.1257.940
Notes: Values of well-being indicators are calculated using normalized indicators of the four dimensions. Source: Own calculations based on VHLSS 2002–2012.
Table A4. Descriptive statistics of well-being indicators - three dimensions, β = 0 .
WB IndicatorYearMeanS.D.Min.Max.
consumption–health–housing20020.8360.6400.1355.796
20041.0270.7010.2065.231
20061.0900.7250.2007.278
20081.1530.7620.1936.494
20101.4420.8600.1217.902
20121.3840.8300.2057.966
consumption–health–education20020.9360.3180.2342.740
20040.9900.3290.2652.696
20061.0230.3400.2482.802
20081.0510.3510.2763.023
20101.1700.4060.2023.600
20121.1950.3960.2063.716
consumption–housing–education20020.8500.7480.1267.496
20041.0470.8220.1326.235
20061.1240.8600.1478.223
20081.1990.9150.1347.559
20101.5081.0770.1179.825
20121.4471.0440.16710.301
health–housing–education20020.8090.4790.1523.934
20040.9580.5210.2193.746
20061.0030.5470.1624.086
20081.0480.5740.1923.769
20101.2080.5890.2323.870
20121.1450.5860.1504.025
Notes: Values of well-being indicators are calculated using normalized indicators of the four dimensions. Source: Own calculations based on VHLSS 2002–2012.
Table A5. Pearson correlation coefficients between dimensions of well-being, excluding those with perfect health condition.
200220042006200820102012
Consumption–Housing0.7320.7210.6690.6420.5850.511
Consumption–Education0.2710.2920.2670.3260.3770.356
Education–Housing0.2140.2240.2570.3260.3590.315
Education–Health−0.002−0.021−0.012−0.0330.005−0.000 §
Consumption–Health0.0780.0170.0340.0430.0350.021
Health–Housing0.069−0.0030.0110.0210.0270.009
Share in population22.54%37.04%35.12%32.69%35.99%33.95%
Notes: The calculation is based on normalized values. (The calculation based on original values gives similar outcomes.) All correlation coefficients are significant at the 1% level, except for education–health. The symbol § indicates the coefficient is not significant at the 10% level. Source: Own calculations based on VHLSS 2002–2012.
Table A6. Confidence intervals of four-dimensional inequality, ϵ = 2 and β = 0 .
YearInequalityConfidence Interval
Lower BoundUpper Bound
20020.34670.34290.3506
20040.32580.32190.3302
20060.33160.32770.3356
20080.33170.32770.3358
20100.29310.28860.2975
20120.29610.29160.3004
Notes: The 95% confidence intervals are computed based on 1000 bootstrap replications. Source: Own calculations based on VHLSS 2002–2012.
Figure A1. Evolution of educational inequality. Notes: The values reported on the vertical axis are those of the Atkinson index, based either on schooling years (left-hand panel) or on groups of educational attainment (right-hand panel). Source: Own calculations based on VHLSS. 2002–2012.
Economies 08 00029 g0a1

References

  1. Aaberge, Rolf, and Andrea Brandolini. 2015. Multidimensional poverty and inequality. In Handbook of Income Distribution. Edited by Anthony B. Atkinson and François Bourguignon. Amsterdam: Elsevier, vol. 2A, pp. 141–216. [Google Scholar]
  2. Alkire, Sabina, Adriana Conconi, Gisela Robles, and Suman Seth. 2015. Multidimensional Poverty Index—Winter 2014/2015: Brief Methodological Note and Results. MPI Methodological Note. Oxford: University of Oxford. [Google Scholar]
  3. Alkire, Sabina, and James Foster. 2011. Counting and multidimensional poverty measurement. Journal of Public Economics 95: 476–87. [Google Scholar] [CrossRef]
  4. Alkire, Sabina, James Foster, Suman Seth, Maria Emma Santos, José Manuel Roche, and Paola Ballon. 2015. Multidimensional Poverty Measurement and Analysis. Oxford: Oxford University Press. [Google Scholar]
  5. Amiel, Yoram, Frank Cowell, and Avraham Polovin. 1996. Inequality among the Kibbutzim. Economica 63: S63–S85. [Google Scholar] [CrossRef]
  6. Anand, Sudhir, and Amartya Sen. 1997. Concepts of Human Development and Poverty: A Multidimensional Perspective. Poverty and Human Development: Human Development Papers. New York: United Nations Development Programme. [Google Scholar]
  7. Arndt, Channing, Roberta Distante, M. Azhar Hussain, Lars Peter Østerdal, Pham Lan Huong, and Maimuna Ibraimo. 2012. Ordinal welfare comparisons with multiple discrete indicators: A first order dominance approach and application to child poverty. World Development 40: 2290–301. [Google Scholar] [CrossRef] [Green Version]
  8. Atkinson, Anthony B., and François Bourguignon. 1982. The comparison of multi-dimensioned distributions of economic status. Review of Economic Studies 49: 183–201. [Google Scholar] [CrossRef]
  9. Banerjee, Asis Kumar. 2010. A multidimensional Gini index. Mathematical Social Sciences 60: 87–93. [Google Scholar] [CrossRef]
  10. Baulch, Bob, and Edoardo Masset. 2003. Do monetary and nonmonetary indicators tell the same story about chronic poverty? A study of Vietnam in the 1990s. World Development 31: 441–53. [Google Scholar] [CrossRef]
  11. Benjamin, Dwayne, Loren Brandt, and Brian McCaig. 2017. Growth with equity: Income inequality in Vietnam, 2002–14. Journal of Income Inequality 15: 1–46. [Google Scholar] [CrossRef] [Green Version]
  12. Boland, Philip J., and Frank Proschan. 1988. Multivariate arrangement increasing functions with applications in probability and statistics. Journal of Multivariate Analysis 25: 2–298. [Google Scholar] [CrossRef] [Green Version]
  13. Brandolini, Andrea. 2008. On Applying Synthetic Indices of Multidimensional Well-Being: Health and Income Inequalities in Selected EU Countries. Working Paper No. 668. Rome: Bank of Italy. [Google Scholar]
  14. Cowell, Frank. 2000. Measurement of inequality. In Handbook of Income Distribution. Edited by Anthony B. Atkinson and François Bourguignon. Amsterdam: North-Holland, vol. 1, pp. 87–166. [Google Scholar]
  15. Cowell, Frank, Martyna Kobus, and Radosław Kurek. 2017. Welfare and Inequality Comparisons for Uni- and Multi-Dimensional Distributions of Ordinal Data. Public Economics Programme Discussion Paper. London: STICERD, LSE. [Google Scholar]
  16. Currie, Janet. 2009. Healthy, wealthy, and wise: Socioeconomic status, poor health in childhood, and human capital development. Journal of Economic Literature 47: 1–122. [Google Scholar] [CrossRef] [Green Version]
  17. Dalton, Hugh. 1920. The measurement of the inequality of incomes. Economic Journal 30: 119–361. [Google Scholar] [CrossRef]
  18. Decancq, Koen, André Decoster, and Erik Schokkaert. 2009. The evolution of world inequality in well-being. World Development 37: 1–25. [Google Scholar] [CrossRef] [Green Version]
  19. Decancq, Koen, and Maria Ana Lugo. 2012. Inequality of wellbeing: A multidimensional approach. Economica 79: 721–46. [Google Scholar] [CrossRef]
  20. Duclos, Jean-Yves, David E. Sahn, and Stephen D. Younger. 2011. Partial multidimensional inequality orderings. Journal of Public Economics 95: 225–38. [Google Scholar] [CrossRef] [Green Version]
  21. Erreygers, Guido. 2013. A dual Atkinson measure of socioeconomic inequality of health. Health Economics 22: 466–79. [Google Scholar] [CrossRef]
  22. Fisher, Franklin M. 1956. Income distribution, value judgments, and welfare. Quarterly Journal of Economics 70: 380–424. [Google Scholar] [CrossRef]
  23. Foster, James E., Luis F. Lopez-Calva, and Miguel Szekely. 2005. Measuring the distribution of human development: Methodology and an application to Mexico. Journal of Human Development 6: 1–25. [Google Scholar] [CrossRef]
  24. Gajdos, Thibault, and John A. Weymark. 2005. Multidimensional generalized Gini indices. Economic Theory 26: 471–96. [Google Scholar] [CrossRef] [Green Version]
  25. Goldman, Noreen. 2001. Social inequalities in health: Disentangling the underlying mechanisms. Annals of the New York Academy of Sciences 954: 118–39. [Google Scholar] [CrossRef] [Green Version]
  26. Hicks, Douglas A. 1997. The inequality-adjusted Human Development Index: A constructive proposal. World Development 25: 1288–98. [Google Scholar] [CrossRef] [Green Version]
  27. Justino, Patricia. 2012. Multidimensional welfare distributions: Empirical application to household panel data from Vietnam. Applied Economics 44: 3391–405. [Google Scholar] [CrossRef]
  28. Kolm, Serge-Christophe. 1977. Multidimensional egalitarianisms. Quarterly Journal of Economics 91: 1–13. [Google Scholar] [CrossRef]
  29. Lambert, Peter. 2001. The Distribution and Redistribution of Income, 3rd ed. Manchester: Manchester University Press. [Google Scholar]
  30. Le, Ha, Cuong Nguyen, and Tung Phung. 2015. Multidimensional poverty: Evidence from Vietnam. Economics Bulletin 35: 2820–31. [Google Scholar]
  31. Leung, Suiwah E. 2010. Vietnam: An economic survey. Asian-Pacific Economic Literature 24: 83–103. [Google Scholar] [CrossRef]
  32. List, Christian. 1999. Multidimensional Inequality Measurement: A Proposal. Nuffield College Working Papers in Economics (1999-w27). Oxford: Nuffield College. [Google Scholar]
  33. Lugo, Maria Ana. 2007. Comparing multidimensional indices of inequality: Methods and application. In Inequality and Poverty. Papers from the Society for the Study of Economic Inequality’s Inaugural Meeting. Edited by John Bishop and Yoram Amiel. Volume 14 of Research on Economic Inequality. Amsterdam: Elsevier, pp. 213–36. [Google Scholar]
  34. Maasoumi, Esfandiar. 1986. The measurement and decomposition of multi-dimensional inequality. Econometrica 54: 991–97. [Google Scholar] [CrossRef] [Green Version]
  35. Maasoumi, Esfandiar. 1989. Continuously distributed attributes and measures of multivariate inequality. Journal of Econometrics 42: 131–44. [Google Scholar] [CrossRef]
  36. Maasoumi, Esfandiar. 1999. Multidimensioned approaches to welfare analysis. In Handbook of Income Inequality Measurement. Edited by Jacques Silber. Berlin: Springer, pp. 437–84. [Google Scholar]
  37. Maasoumi, Esfandiar, and Gerald Nickelsburg. 1988. Multivariate measures of well-being and an analysis of inequality in the Michigan data. Journal of Business & Economic Statistics 6: 327–34. [Google Scholar]
  38. Mahadevan, Renuka, and Viet Ngu Hoang. 2016. The nexus between poverty and deprivation in Vietnam. Journal of Policy Modeling 38: 290–303. [Google Scholar] [CrossRef] [Green Version]
  39. Marshall, Albert W., Ingram Olkin, and Barry C. Arnold. 1979. Inequalities: Theory of Majorization and Its Applications. Volume 143 of Mathematics in Science and Engineering. New York: Academic Press. [Google Scholar]
  40. Mauro, Vincenzo, Mario Biggeri, and Filomena Maggino. 2018. Measuring and monitoring poverty and well-being: A new approach for the synthesis of multidimensionality. Social Indicators Research 135: 75–89. [Google Scholar] [CrossRef]
  41. McKenzie, David J. 2005. Measuring inequality with asset indicators. Journal of Population Economics 18: 229–60. [Google Scholar] [CrossRef]
  42. Muller, Christophe, and Alain Trannoy. 2011. A dominance approach to the appraisal of the distribution of well-being across countries. Journal of Public Economics 95: 239–46. [Google Scholar] [CrossRef]
  43. Muller, Christophe, and Alain Trannoy. 2012. Multidimensional inequality comparisons: A compensation perspective. Journal of Economic Theory 147: 1427–49. [Google Scholar] [CrossRef]
  44. Nanivazo, Malokele. 2015. First order dominance analysis: Child wellbeing in the Democratic Republic of Congo. Social Indicators Research 122: 235–55. [Google Scholar] [CrossRef] [PubMed] [Green Version]
  45. Nguyen, Cuong V., and Nguyet M. Pham. 2018. Economic growth, inequality, and poverty in vietnam. Asian-Pacific Economic Literature 32: 45–58. [Google Scholar] [CrossRef]
  46. Nilsson, Therese. 2010. Health, wealth and wisdom: Exploring multidimensional inequality in a developing country. Social Indicators Research 95: 299–323. [Google Scholar] [CrossRef]
  47. Petrillo, Ida. 2017. Ranking Income Distributions: A Rank-Dependent and Needs-Based Approach. Dipartimento di Economia e Finanza, Working Paper 03-2017. Bari: Università degli Studi di Bari “Aldo Moro”. [Google Scholar]
  48. Pham, Anh Thu Quang, and Pundarik Mukhopadhaya. 2018. Measurement of poverty in multiple dimensions: The case of Vietnam. Social Indicators Research 138: 953–90. [Google Scholar] [CrossRef]
  49. Pham, Anh Thu Quang, Pundarik Mukhopadhaya, and Ha Vu. 2020. Targeting administrative regions for multidimensional poverty alleviation: A study on Vietnam. Social Indicators Research. [Google Scholar] [CrossRef]
  50. Phan, Van Phuc, and Martin O’Brien. 2019. Multidimensional wellbeing inequality in a developing country: A case study of Vietnam. Social Indicators Research 145: 157–83. [Google Scholar] [CrossRef]
  51. Rahman, Md. Mijan, Hafiz T. A. Khan, and Trish Hafford-Letchfield. 2016. Correlates of socioeconomic status and the health of older people in the United Kingdom: A review. Illness Crisis & Loss 24: 195–216. [Google Scholar]
  52. Roelen, Keetie, Franziska Gassmann, and Chris de Neubourg. 2012. False positives or hidden dimensions: What can monetary and multidimensional measurement tell us about child poverty in Vietnam? International Journal of Social Welfare 21: 393–407. [Google Scholar] [CrossRef]
  53. Rohde, Nicholas, and Ross Guest. 2013. Multidimensional racial inequality in the United States. Social Indicators Research 114: 591–605. [Google Scholar] [CrossRef]
  54. Savaglio, Ernesto. 2006. Multidimensional inequality with variable population size. Economic Theory 28: 85–94. [Google Scholar] [CrossRef]
  55. Sen, Amartya. 1973. On Economic Inequality. Oxford: Oxford University Press. [Google Scholar]
  56. Sen, Amartya. 1995. Commodities and Capabilities. Amsterdam: North Holland. [Google Scholar]
  57. Sen, Amartya. 1997. On Economic Inequality. Enlarged Edition with a Substantial Annexe by James E. Foster and Amartya Sen. Oxford: Clarendon Press. [Google Scholar]
  58. Sen, Amartya. 1999. Development as Freedom. Oxford: Oxford University Press. [Google Scholar]
  59. Shorrocks, Anthony F. 1983. Ranking income distributions. Economica 50: 3–17. [Google Scholar] [CrossRef] [Green Version]
  60. Smith, James P. 1999. Healthy bodies and thick wallets: The dual relation between health and economic status. Journal of Economic Perspectives 13: 145–66. [Google Scholar] [CrossRef] [Green Version]
  61. Stiglitz, Joseph, Amartya Sen, and Jean-Paul Fitoussi. 2009. The Measurement of Economic Performance and Social Progress Revisited: Reflections and Overview. Report no. 33. Paris: Commission on the Measurement of Economic Performance and Social Progress. [Google Scholar]
  62. Tran, Van Q., Sabina Alkire, and Stephan Klasen. 2015. Static and dynamic disparities between monetary and multidimensional poverty measurement: Evidence from Vietnam. In Measurement of Poverty, Deprivation, and Economic Mobility, Volume 23 of Research on Economic Inequality. Edited by Thesia I. Garner and Kathleen S. Short. Bingley: Emerald, pp. 249–81. [Google Scholar]
  63. Tsui, Kai-Yuen. 1995. Multidimensional generalizations of the relative and absolute inequality indices: TheAtkinson-Kolm-Sen approach. Journal of Economic Theory 67: 251–65. [Google Scholar] [CrossRef]
  64. Tsui, Kai-Yuen. 1999. Multidimensional inequality and multidimensional generalized entropy measures: An axiomatic derivation. Social Choice and Welfare 16: 145–57. [Google Scholar] [CrossRef] [Green Version]
  65. UNDP. 2010. Human Development Report 2010. The Real Wealth of Nations: Pathways to Human Development. New York: United Nations. [Google Scholar]
  66. UNDP. 2019. Human Development Report 2019. Beyond Income, Beyond Averages, Beyond Today: Inequalities in Human Development in the 21st Century. New York: United Nations. [Google Scholar]
  67. Walzer, Michael. 1983. Spheres of Justice: A Defense of Pluralism and Equality. New York: Basic Books. [Google Scholar]
  68. Ward, Patrick. 2014. Measuring the level and inequality of wealth: An application to China. Review of Income and Wealth 60: 613–35. [Google Scholar] [CrossRef] [PubMed]
  69. Weymark, John A. 2006. The normative approach to the measurement of multidimensional inequality. In Inequality and Economic Integration. Edited by F. Farina and E. Savaglio. New York: Routledge, pp. 303–28. [Google Scholar]
  70. Williams, David R. 1990. Socioeconomic differentials in health: A review and redirection. Social Psychology Quarterly 53: 81–99. [Google Scholar] [CrossRef] [Green Version]
Figure 1. Evolution of inequality in single dimensions: (left) the estimated values of the Atkinson index for each year; and (right) the estimated values of the Atkinson index for each year relative to the value for 2002. Notes: The values on the vertical axis of the right panel are percentages. All calculations are based on ϵ = 2 . Source: Own calculations based on VHLSS 2002–2012.
Economies 08 00029 g001
Figure 2. Evolution of two-dimensional inequality: (left) the estimated values of the Atkinson index for each year; and (right) the estimated values of the Atkinson index for each year relative to the value for 2002. Notes: The values on the vertical axes of the right panel are percentages. All calculations are based on ϵ = 2 and β = 0 . Source: Own calculations based on VHLSS 2002–2012.
Economies 08 00029 g002
Figure 3. Evolution of three-and-four-dimensional inequality: (left) the estimated values of the Atkinson index for each year; and (right) the estimated values of the Atkinson index for each year relative to the value for 2002. Notes: The values on the vertical axes of the right panel are percentages. All calculations are based on ϵ = 2 and β = 0 . Source: Own calculations based on VHLSS 2002–2012.
Economies 08 00029 g003
Figure 4. Difference in inequality, 2012 vs. 2002. Notes: A blue dot means that the level of inequality has decreased between 2002 and 2012, and a red dot that it has increased. The size of the dot represents the relative magnitude of the change. The values of β are on the horizontal axis, and the values of ϵ are on the vertical axis. Source: Own calculations based on VHLSS 2002–2012.
Economies 08 00029 g004
Figure 5. Inequality indices altering with epsilon. Source: Own calculations based on VHLSS 2002–2012.
Economies 08 00029 g005
Figure 6. Inequality indices altering with beta. Source: Own calculations based on VHLSS 2002–2012.
Economies 08 00029 g006
Figure 7. Atkinson index, two ways of estimations. Source: Own calculations based on VHLSS 2002–2012.
Economies 08 00029 g007
Table 1. Characteristics of the data sample.
YearObservationsRepresented IndividualsShare in the
Whole Population
UrbanRuralMaleFemale
200256,59133,434,12243.6526.1773.8346.7253.28
200418,22737,283,62446.0628.5271.4846.5153.49
200618,45539,758,78948.2029.1770.8346.2653.74
200818,64642,838,62749.6329.2370.7746.1353.87
201017,89542,661,65549.4731.7968.2146.7353.27
201218,53545,946,63951.4826.1773.8346.7253.28
Notes: Column 2 shows the numbers of individuals who are at least 30 years old when surveyed by VHLSS and included in the data used in this study. Column 3 displays the numbers of people these individuals represent when taking the survey weights into account. Column 4 shows the percentage of these individuals to the whole population represented by VHLSS. Columns 5–8 provide the data components based on demographic characteristics in percentage terms. Source: Own calculations based on VHLSS 2002–2012.
Table 2. Descriptive statistics of well-being dimensions.
Year MeanS.D.Min.Max.
Consumption2002 19,59815,672942199,892
2004 22,72317,3331,443186,811
2006 24,49618,4581,805279,664
2008 26,06120,0981,729264,570
2010 35,14530,094263461,285
2012 36,48827,5191,777434,820
Health2002 0.9670.1020.0621
2004 0.9610.1020.0701
2006 0.9590.1100.0751
2008 0.9560.1150.0731
2010 0.9620.1000.0751
2012 0.9680.0930.0531
Housing2002 298,627622,14710,6768,195,768
2004 451,487743,45715,1467,635,923
2006 495,055799,27415,1629,906,921
2008 548,074852,93516,5597,772,239
2010 720,370948,25614,5548,107,936
2012 635,816954,17218,8039,185,111
Education2002 4.0231.85619
2004 4.0851.79719
2006 4.1711.86919
2008 4.2451.89219
2010 4.3251.96219
2012 4.3481.96319
Notes: Consumption and housing are expressed in thousands of constant 2012 VND, health in terms of the units of the health indicator, and education in terms of educational groups. Source: Own calculations based on VHLSS 2002–2012.
Table 3. Evolution of well-being (four dimensions, β = 0 ).
YearMeanS.D.Min.Max.
20020.8400.5160.1934.569
20040.9870.5550.2213.979
20061.0420.5780.2114.897
20081.0930.6060.2224.597
20101.3070.6740.1915.596
20121.2690.6570.2155.799
Notes: The values of the well-being indicators are calculated using the normalized indicators of the four dimensions. Source: Own calculations based on VHLSS 2002–2012.
Table 4. Pearson correlation coefficients between dimensions of well-being, whole Vietnam.
200220042006200820102012
Consumption–Housing0.7530.6930.6630.6560.6360.602
Consumption–Education0.3510.3630.3620.3810.4150.422
Housing–Education0.3030.3040.3330.3670.4230.408
Health–Education0.0600.0880.0920.0890.0730.072
Consumption–Health0.0380.0300.0430.0620.0510.043
Health–Housing0.0320.0080.0290.0570.0520.033
Population33,434,12237,283,62439,758,78942,838,62742,661,65545,946,639
Notes: All coefficients are significant at the 1% level. The calculation is based on the normalized values. The original values give similar outcomes. Source: Own calculations based on VHLSS 2002–2012.