1. Introduction
The proper role of markets in the economic development process in the poorest countries has been much of the focus of international discussions since the 1950s. The Leviathan School of development sees substantial foreign government involvement in the economy of the poorest countries as the solution to the problem of underdevelopment. In this view, poor countries lack the necessary economic resources and capacity to set up their bureaucracy for a fast economic take-off. Since wealthy countries have already gone through this process, they can supposedly share their insights with their partners. This school of thought holds that a thorough development planning, combined with a large provision of physical resources and expertise, can expedite the natural entrepreneurial development process by generations. This is akin to (
Keynes 1936) concept of government intervention in the markets through regulation and active demand management.
In the case of Leviathan, a large and growing government size and scope is considered natural. Free markets are seen as riddled with problems: rules of conduct covering large numbers of people are hard to establish without a government-type organization, some desirable goods are not produced by markets or may be provided, but only well below or above the optimal amount, the established companies commonly bully the newcomers out of the markets, high unemployment can persist for long periods of time, income disparities between citizens can get uncomfortably large, negative externalities can ravage the clean environment, buyers and sellers are occasionally tricked by the other side, etc.
1On the other side of the development discussion is the Invisible Hand School, originating in the Physiocrats’ 18th century laissez-faire, laissez-passer approach, which was later further refined by
Adam Smith (
1776). It advocates free markets and maintains that government intervention will only hamper the natural dynamics of developing market institutions. While added physical resources and knowledge may be beneficial to economic growth and employment in the short run, in the long run they will also create institutionalized corruption and capital misallocation. As an alternative, they offer to help shape free market compatible institutional reforms. Free market compliant institutions would incentivize citizens to put their own resourcefulness into action through entrepreneurship (and intrapreneurship) rather than becoming dependent on government development programs.
While the two groups may disagree on the specific ways to economic prosperity and the relative importance of various economic goals (income growth, unemployment, inflation, income distribution, environmental and social sustainability), an area where the two groups agree with each other is the importance of entrepreneurship for development.
2 The aim of this study is to provide a critical analysis of, and discussions on how, the foreign aid donors’ own institutional environment matters to their development partners’ levels of business creation. It also suggests ways to steer development aid more towards creating and revitalizing entrepreneurship in aid recipient countries.
The world’s foreign aid experience comes overwhelmingly from the Leviathan-type of development aid (planning, spending heavily on material inputs). The results are mixed. In their meta-analyses of 97 and 141 countries from 1970 on, (
Doucouliagos and Paldam 2009,
2013) find that foreign aid seems to have had a statistically significant and positive effect on economic growth. The effect is so small, however, as to be economically meaningless. Furthermore, the authors uncover some evidence of publication bias—articles favorable to development aid seem to be overrepresented in academic journals, casting further doubt on the effectiveness of the Leviathan-type development aid. Whether the Invisible Hand approach—reliance on creating rules that incentivize people to action—would do better than the Leviathan approach is not as clear, due to the lack of actual evidence.
Easterly (
2007) argues that the most serious problem with foreign aid in the past has indeed been its misguided focus on material inputs rather than institutions.
Olson (
1982),
de Soto (
1989) and
North (
1990) describe in a particularly illuminating way how the institutional set-up, the rules of the game, matters in enabling and encouraging individual initiative. The commonly cited key institutions in societies include the size of government: expenditures, taxes and enterprises; legal structure and the security of property rights; access to sound money; freedom to exchange with foreigners, and; regulation of credit, labor and business. The above brings forth two questions: (1) Would the Leviathan or the Invisible Hand best help countries accelerate their business creation? (2) To create vigorous entrepreneurial activity in most developing countries, should it matter to the foreign aid recipients who their aid donor is?
Methodologically, the study mixes quantitative and qualitative reasoning. It uses the most up-to-date economic and institutional databases and research on development in its analysis, providing mostly indirect evidence related to aid donors’ and recipients’ entrepreneurial activity rates. We think that our logical arguments and discussion provide a valuable contribution to the literature on the practices of transferring institutional policies, with the hope of inspiring more future studies on the subject. In the paper, we combine the existing evidence on the workings of institutions with various economic development, entrepreneurship and social values data to provide a basis for evaluating the quality of Leviathan and Invisible Hand governments as foreign aid donors. Finally, based on the presented evidence, suggestions are provided for how to make foreign aid work more efficiently, particularly through new entrepreneurship.
2. Institutions and Entrepreneurship
For entrepreneurship to gain traction in society, incentives are needed for entrepreneurs to start and flourish. Institutions can provide those incentives, guiding people in their everyday life choices, indirectly affecting every society’s income growth and distribution, standard of living, life satisfaction, etc. To highlight this point, in a classic experimental study, two separate institutional regimes on a small island of Saint Martin/Sint Maarten were observed and the effects were then compared: the study left no unambiguity that institutions matter a lot (
Dana 1990).
Ovaska et al. (
2014) found the same comparing small communities in Estonia and South Africa.
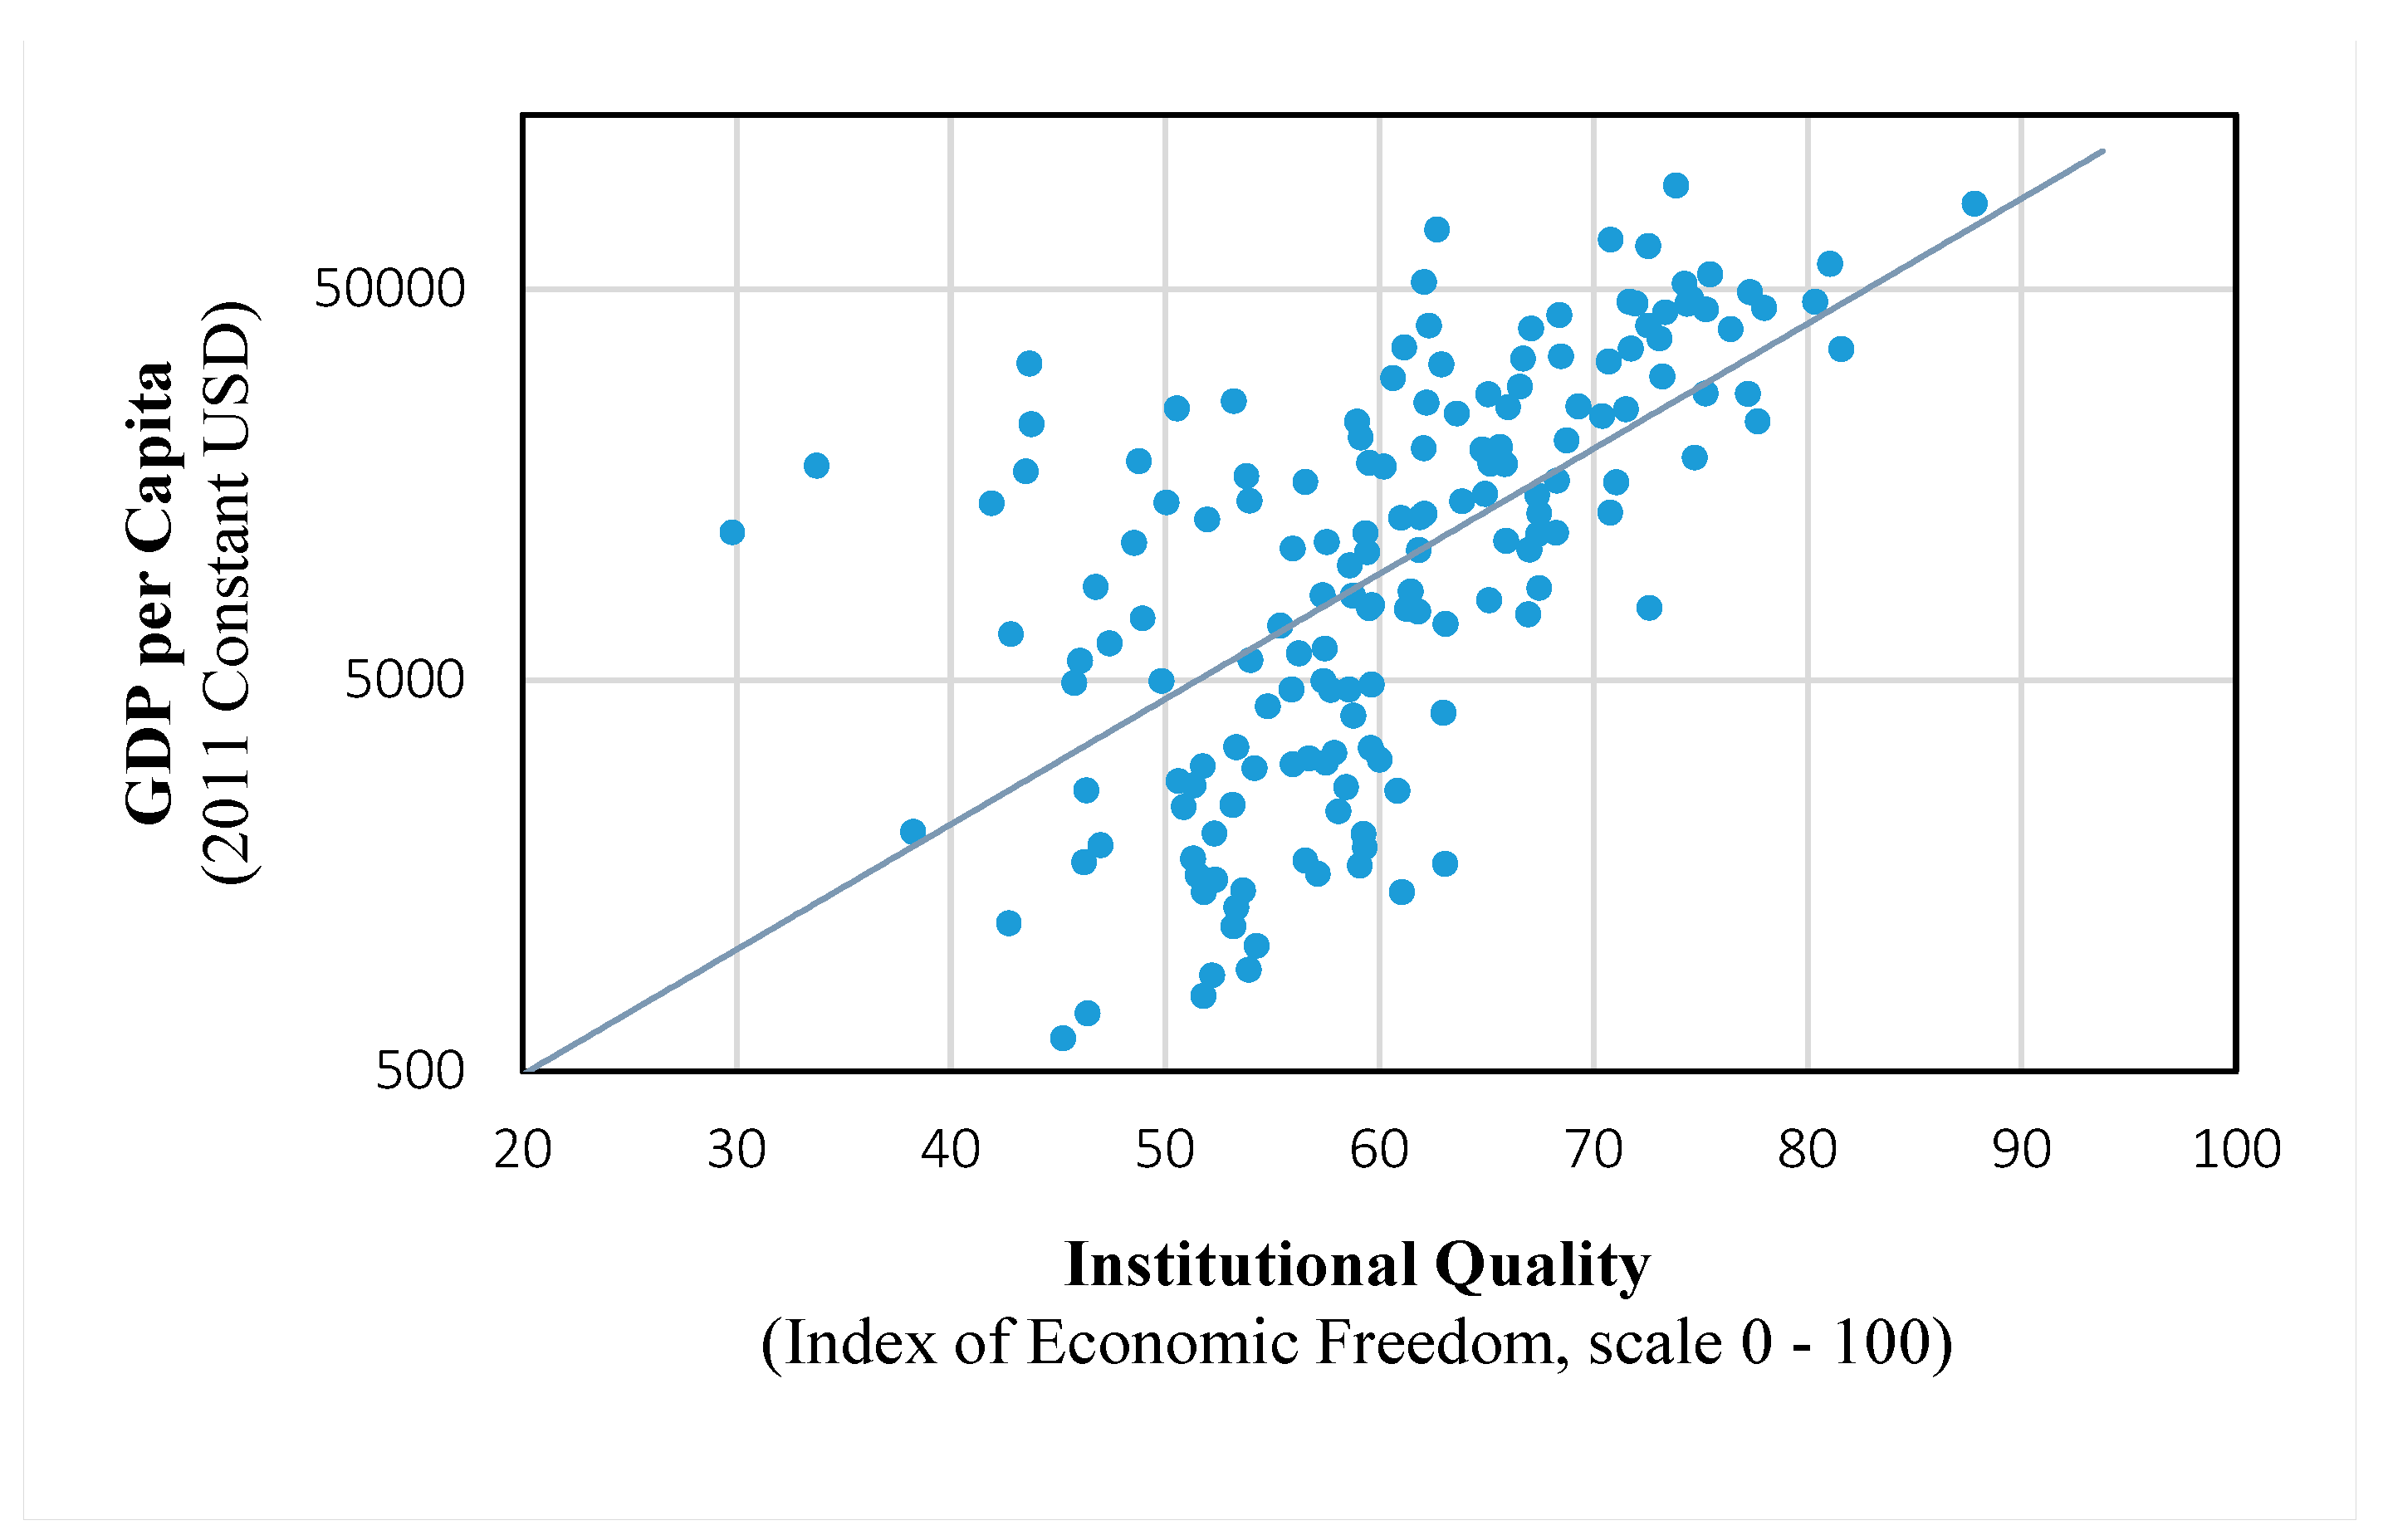
Figure 1 shows the connection between institutional quality and income per capita in a group of 166 countries in 2015. The correlation coefficient between the two is +0.62, underlining the significance of institutions on wealth creation. Furthermore, not only do a country’s institutions affect domestic entrepreneurs, but good institutions will also bring entrepreneurs from outside the country, in the form of foreign direct investment (
Zak and Knack 2001). As
Berkowitz and DeJong (
2005) show, entrepreneurial countries have an impressive record of accomplishment raising people’s incomes. Perhaps even more importantly,
Aquino et al. (
1996) point out that entrepreneurship also serves to provide the means to enhance the meaning of one’s life.
As
Acs and Virgill (
2010) and
Bjørnskov and Foss (
2016) point out, the current literature on entrepreneurship still lacks a unified theoretical and empirical model. Thus, a quite diverse set-up of models is observed among the existing studies. In what follows, we construct a typical pooled OLS entrepreneurship panel regression model, mixing macro, micro and individual-based variables to explain new firm creation. Especially in a cross-section of data with countries of different development levels, the founding of new firms is clearly visible in societies’ incomes (
Acs and Virgill 2010).
While the specifications of models vary by study, entrepreneurship regressions usually include some measure of institutional quality as one independent variable. To examine the relationship between entrepreneurship and institutional quality, the following basic equation is illuminating:
for cross-country
i and time period
t, with several macroeconomic and socio-economic control variables,
xitk, the three time periods being 2000–2004, 2005–2009 and 2010–2014.
Our measure of entrepreneurship is Total Early-stage Entrepreneurial Activity (TEA: scale 0%–100%) taken from the Global Entrepreneurship Monitor (GEM) database. It is the percentage of 18–64 aged individuals who are actively involved in business start-ups, either in the phase of starting a new firm (nascent entrepreneurs), or in the phase spanning 42 months after the birth of the firm (owner- manager of new firms).
As for the control variables, Adam Smith already noted that the quantity of mutually beneficial economic transactions (buying, selling) is sensitive to the trust among people (
Smith 1776). The prevailing trust, with respect to society’s existing rules, binds interpersonal trust and the founding of new firms naturally together (
Fukuyama 2000;
Ovaska 2014). Unemployment rate can also be a good, economically meaningful predictor of new firm creation (
Glaeser et al. 2014). If the unemployed are unable to find employment from anywhere else, necessity may force them to become entrepreneurs.
Our inclusion of service sector variables in the regression follows from the seminal entrepreneurship study by
Bjørnskov and Foss (
2008), in which they control for industry structure using the shares of agriculture and manufacturing as its proxies. Bjørnskov and Foss found that the share of agriculture and manufacturing is positively and statistically significantly related to entrepreneurship (TEA). Therefore, it would be consistent with
Bjørnskov and Foss (
2008) to expect the service sector coefficient estimate to be negative
3.
Some education also tends to have a positive effect on entrepreneurial activity (
Berglann et al. 2011). When starting a new business, the availability of financing and the real cost of capital can also be critical in the presence of mounting, high, fixed costs at the start (
Mambula 2002).
Changes in income inequality are often overlooked as a factor of entrepreneurial activity. When inequality in incomes or wealth rises, migration out of the country tends to increase. On the other hand, rising inequality may also signal to people that it is possible to become wealthy in that location (
Stark et al. 2009). Income inequality may also erode interpersonal trust, which is an important positive factor for entrepreneurship. The health of a population is just as critical for entrepreneurship as it is for society’s economic growth (
Freytag and Thurik 2007). GDP per capita is included, among others, in (
Bjørnskov and Foss 2008;
Nyström 2008). Generally, a negative relationship with GDP per capita is found in the entrepreneurship literature, and we expect the same in our setup.
4Finally, society’s attitude towards people becoming entrepreneurs is a major variable explaining entrepreneurial activity (
Heilman and Lucas 1997;
Dana 2000;
Ovaska and Anderson 2010). As
Table 1 already hints, in some regions and countries children are warned from early on about the ills of market economy and, by deduction, entrepreneurship (
Theil 2008). The net-column in
Table 1 highlights the stark differences that exist among countries in their propensity for entrepreneurship.
Table 2 shows the regression results based on the multiple regression model (1) presented earlier. The model is meant to mimic the kind of generic set-up that a typical entrepreneurship study would use as a base (
Acs and Virgill 2010). The data consist of three periods 1999–2004, 2005–2009 and 2010–2014. The data on TEA and Desirability of Entrepreneurship are from Global Entrepreneurship Monitor (GEM). Interpersonal Trust is from European Value Study (EVS) and World Value Surveys (WVS). All other control variables are retrieved from the World Development Indicators (WDI).
Here, institutional quality shows its value; one unit increase in the quality of institutions, as measured by the Index of Economic Freedom (IEF), increases the number of Total Early-stage Entrepreneurial Activity (TEA) by 0.227% points, or by 2.27% points for a ten-unit increase. For instance, the U.S. has about 204.9 million adults (18–64 of age), of which about 12% are active in TEA entrepreneurship. A ten-unit increase in IEF would increase the number of entrepreneurially active people in the U.S. by about 540,000 and create 13,000 new firms.
3. Foreign Aid Donor-Created Obstacles on Entrepreneurship
Donor countries do not always make living with the aid easy. Lower quality institutions on the donor side can lead to undesired outcomes on the recipient side. Lacking transparency in operations, the overt fragmentation of aid (lack of specialization), high administrative costs and ineffective aid channels are examples of the negative effects deficient donor side institutions can have on aid outcomes (
Easterly and Pfutze 2008).
Other known potentially negative donor side effects include giving one’s own former non-democratic colonies disproportionately more aid than democratic non-colonies, neglecting growth promotion and poverty reduction, and using the aid to further the donor’s own strategic interests. The unfortunate finding for the poorest developing countries is that private flows of investment tend to avoid countries that have low-quality institutions, yet aid donors lack the insight or willingness to deal with quality institution building (
Alesina and Dollar 2000). There is also evidence that the farther apart the donor and recipient country are from each other ideologically, the lower the trust between them, and, consequently, the less effective the aid becomes (
Dreher et al. 2015).
Aid is also often tied, calling for unnecessary (mega) project proliferation, misallocation of resources and neglect of the potential of smaller-scale entrepreneurship in raising living standards. While it is known that higher-quality aid from the donor side leads to better development results, it is the smaller recipient countries, all else being equal, which seem to benefit more from high-quality aid than their larger counterparts (
Minasyan et al. 2016). Other criteria often included in evaluating aid quality include the level of aid channel politicization, selectivity on projects, provision of global public goods and technical efficiency (
Gulrajani 2016).
In the last decade, researchers have developed several development aid donor-performance indexes. The goal of such indexes is to identify, at a high aggregate level, the best practices in aid delivery. The hope is that increased transparency in aid activities would prompt the poorly performing donors to start moving towards the identified best practices. Since entrepreneurship and the resulting innovation should be a critical part of foreign aid, the best aid practices also imply the occasional need to reduce one’s risk-aversion in order to experiment with new ideas (
Knack et al. 2011).
The Index of Economic Freedom (IEF) is one of the two best-known measures of institutional quality. It is formed of ten main components, which have been found to be the most important in shaping society’s rules and codes of conduct, and people’s incentives to work. In the index, each of the ten main institutions is further divided into sub-categories. The overall index is therefore comprised of over 40 variables. The ten equally weighted main institutions in the index are (1) property rights, (2) freedom from corruption, (3) fiscal freedom, (4) government spending, (5) business freedom, (6) labor freedom, (7) monetary freedom, (8) trade freedom, (9) investment freedom, and (10) financial freedom.
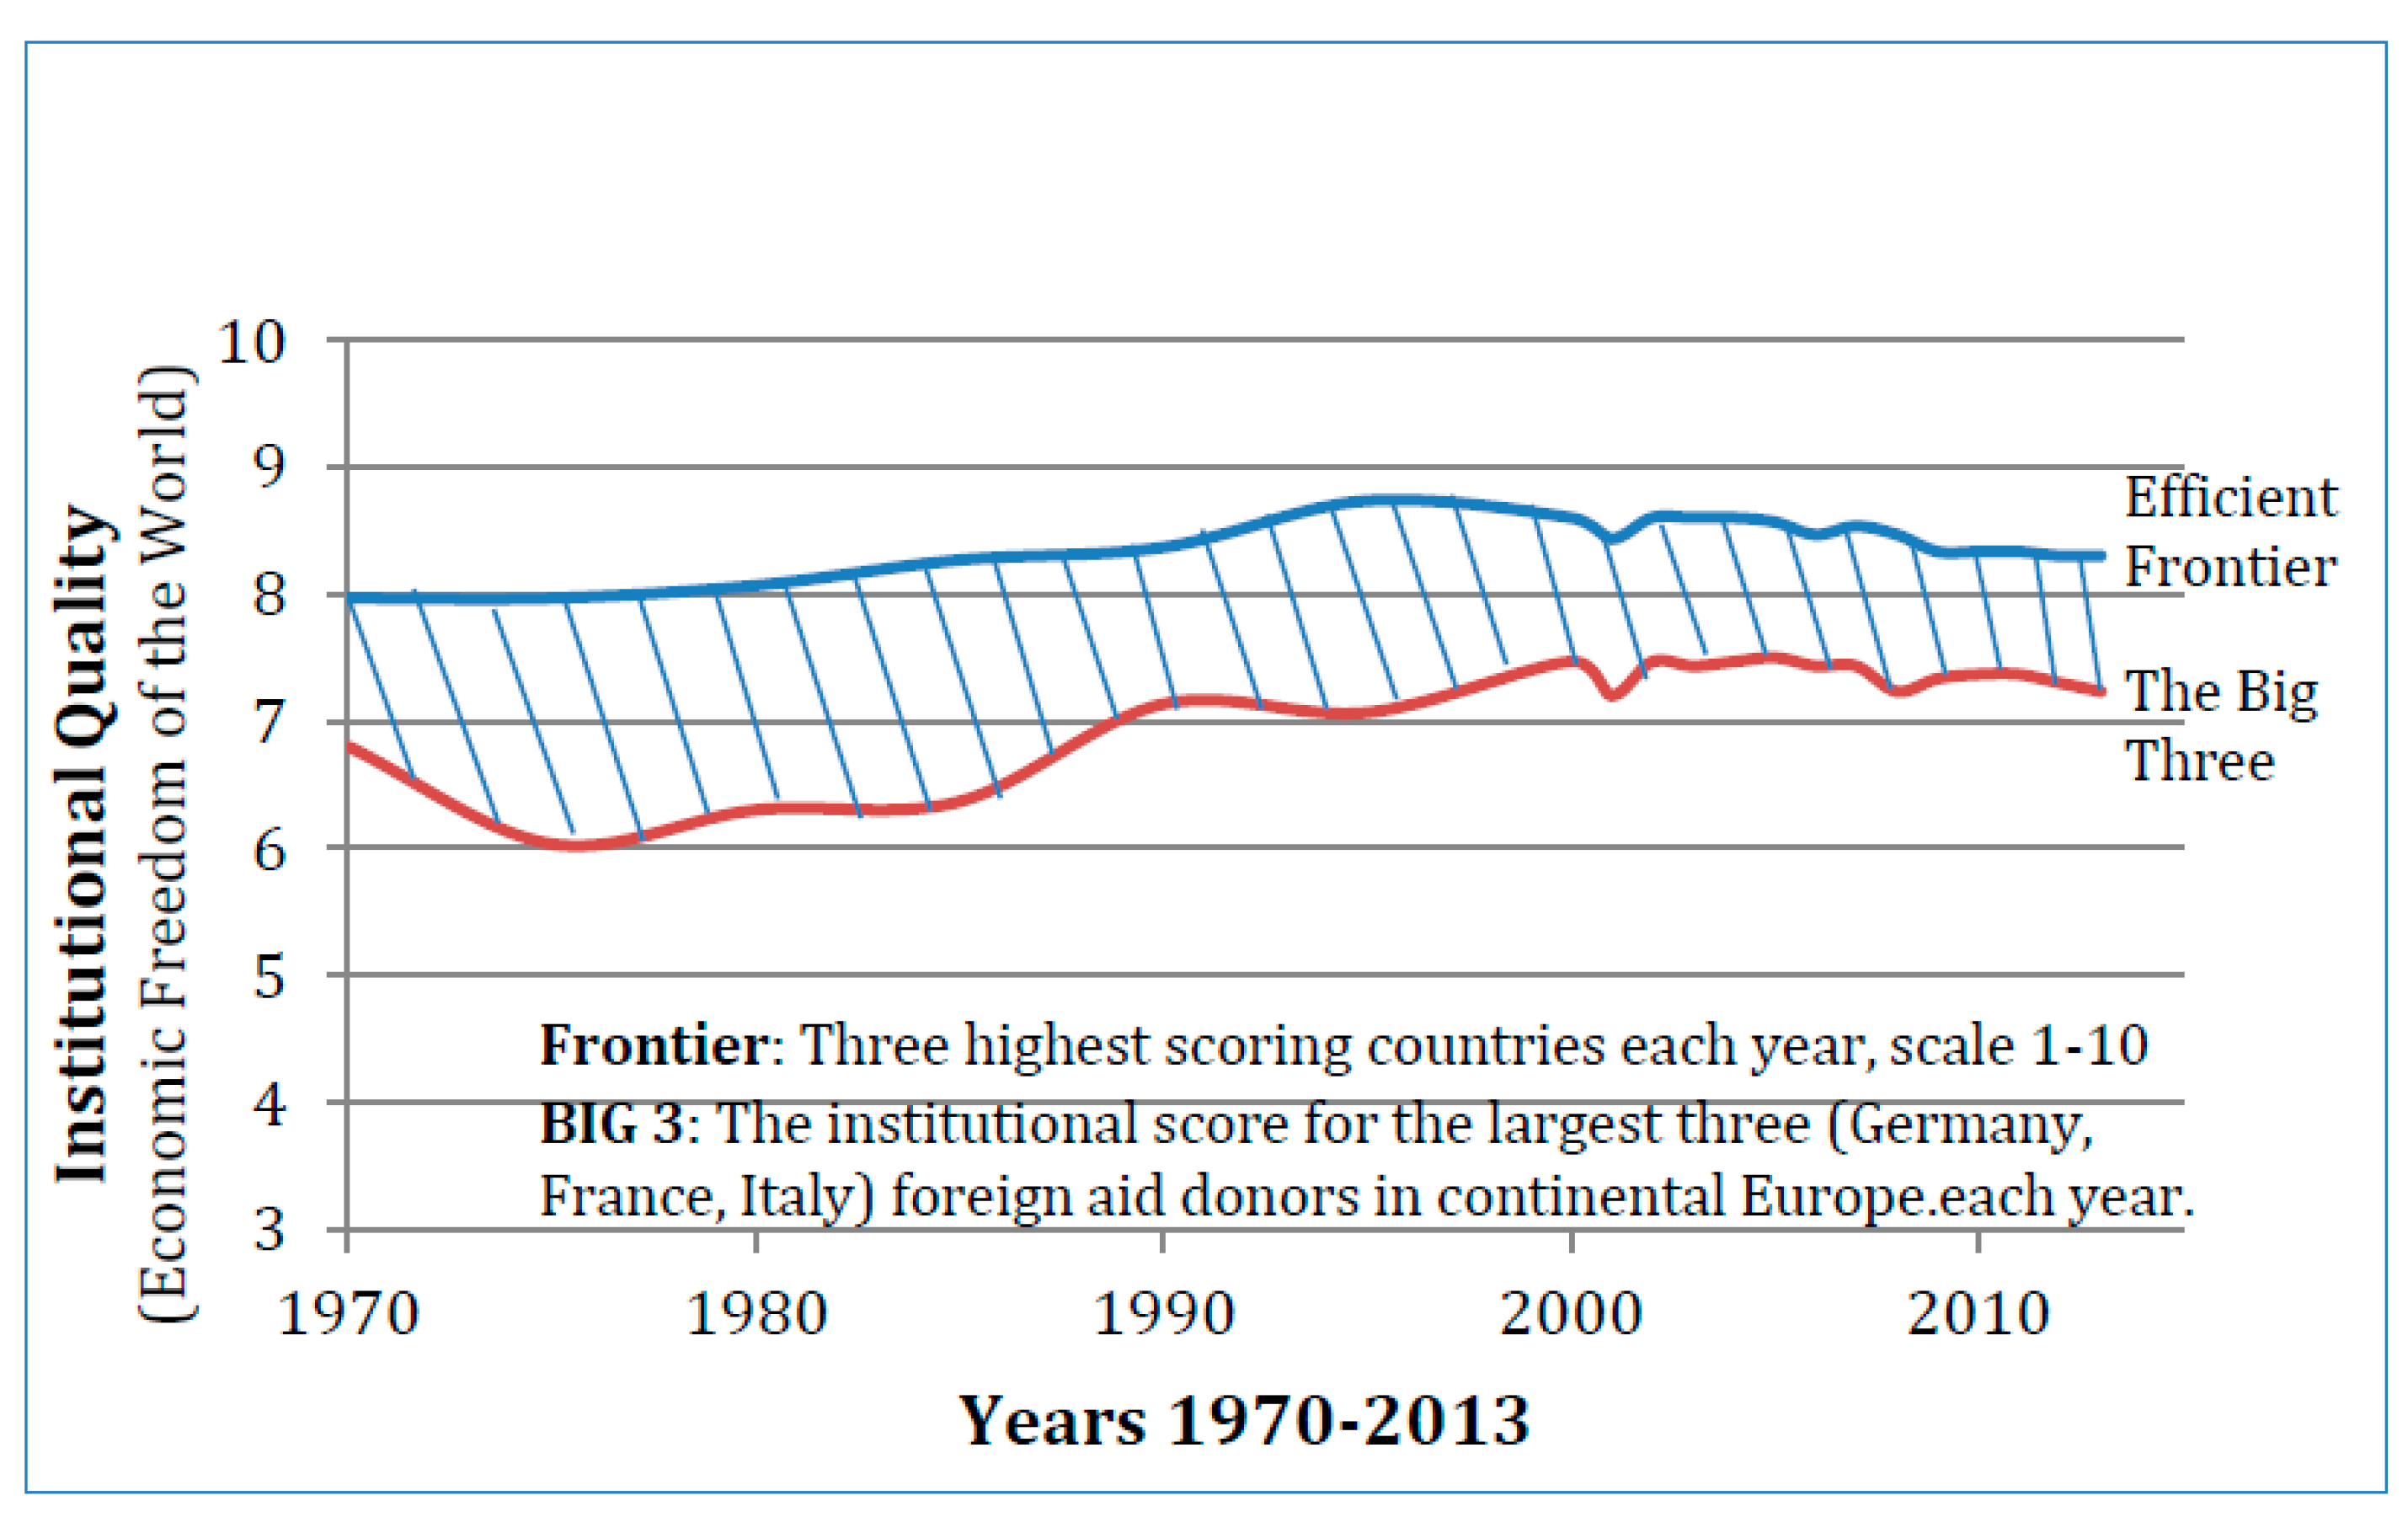
Figure 2 looks at the quality of donors’ own institutions, rather than focusing on the recipient side: how good are the donors’ own institutions? Further, how much and what type of entrepreneurship would result from a particular institutional constellation? Would the result be the Schumpeterian kind of innovative entrepreneurship, or the unemployment-fighting necessity entrepreneurship, or something else?
It is highly implausible that the donors’ domestic institutional structure would not show in their development aid policies and policy results, including new business creation. The upper curve in
Figure 2 shows the annual average score for the top three countries (“efficient frontier”) in the other well-known measure of institutional quality, the Economic Freedom of the World index (EFW), whose data on institutional quality, unlike the IEF’s, extends back all the way to 1970.
The lower curve shows the average score for Germany, France and Italy (“BIG 3”), the three largest continental European donors in the last 48 years. As the figure shows, the big Europeans have been well below the efficient frontier, living up to only between 75% and 87% of the highest scoring countries. Would the same performance gap show up in the recipient countries’ economic growth rates, these growth differences compounded will lead to large differences in the recipient countries’ level of entrepreneurship and the standard of living over time.
Table 3 breaks down in more detail how 23 DAC countries scored in each main institutional category in 2015. The scoring is this time from the IEF (Heritage Foundation) and runs from 0 to 100, higher being better. When analyzing the difference between the highest and lowest scoring group in each institutional category (Distance to Efficient Frontier), a rather unsettling picture emerges. While the difference between the vanguard and the laggards is just about 10% in monetary freedom, in half the categories it is over 40%, going up to 68% in government spending.
These are large differences, calling into serious question the notion that foreign donors are equally effective in helping developing countries with business development. Intuitively, a developing country would seem to be better off getting help in any given institutional area from the top ten percent of scorers, rather than the bottom ten percent. The good news, however, is that in relative terms even the lowest scoring donors tend to be good in some category. This suggests at least some potential for partial specialization among donor countries. Countries could try to take advantage of their relatively strong institutional strengths. That said, a strong multilateral cooperation might still be preferable, for which we will make the case in the remainder of the paper.
4. Institutions, Incentives and New Firms
Section 2 highlighted the positive connection between the quality of institutions and business creation.
Table 4 shows the relationship between the Index of Economic Freedom and the New Business Density (NBD) over three periods. The latter is internationally the most consistent measure of new business density (LLCs) across countries and over time. The correlation between the overall IEF index score and the NBD is +0.56. The correlation of property rights, the rate of corruption and regulations (business freedom) with the NBD are between +0.43 and +0.57. Except for two variables, fiscal freedom and government spending, all other variables display a positive correlation with new business creation.
The two institutions that have a negative correlation with entrepreneurship are related to government size, tax rates, debt, and the tax code complexity. Ceteris paribus, when government spending increases and tax and debt levels rise, less entrepreneurial activity takes place.
Since the IEF is an index, a government can do poorly in fiscal freedom, government spending and business freedom categories, and yet score a respectably in the overall index by doing well in the other seven areas. In practice, that is a rare occurrence. Since taxation and regulation overreaches tend to affect the other areas as well, this makes pick-and-choose strategies for business creation mostly impotent. Thus, a government wanting to increase the new business density would be well advised to move away from the lowly scoring Leviathan countries and reduce regulations where possible.
As the table shows, within the DAC group there are countries with strong institutions, while there are also countries that clearly struggle with the basic set-up. The numbers speak for themselves: the median DAC-country annual income is little short of $40,000, but the group income ranges from less than $19,000 to more than $80,000. The Total Early-Entrepreneurial Activity rates (TEA) between 2010 and 2015 vary from Canada’s 13.32% to Italy’s 3.88%. What is particularly worrisome, despite potential institutional deficiencies in aid disbursement, each DAC member country is active in multiple fronts as a foreign donor. This is true even if their own institutions are inadequately conceived for that purpose.
5. If Leviathan Donors Are to Be Avoided, Then What?
In
Table 4, evidence was provided of a positive connection between the quality of a country’s institutions and entrepreneurial activity. Furthermore, it was shown that, of the ten major institution categories in the Index of Economic Freedom, eight were positively correlated with business creation, while two were negatively correlated. Both of those categories were associated with Leviathan governments. Their characteristics include a high tax burden on income-earners and businesses, a large amount of red tape due to tax code complexity and regulations, and willingness to spend beyond their revenues, creating future tax rate uncertainty. If the aid recipient countries could make an informed choice, they would be well served to go along with donors that possess the highest institutional quality rankings.
Intuitively, recipient countries should cooperate with donor countries that have a good record of accomplishment in aid disbursement. Regrettably, currently there is little or no transparency by donors in publishing their foreign aid results, and even less in getting them verified by an independent third party (
Easterly and Pfutze 2008). The content and vagueness of the published aid results also point towards an unfortunate reality. Institutions are not on the top of donor talking points, even though the existing institutions in developing countries simply do not provide people with enough incentives to become entrepreneurs. In addition, the aid recipient countries may not be truly capable of or interested to distinguish among the effectiveness of different aid donors.
Entrepreneurial success in the aid recipient countries could emerge from at least two sources. First, learning from countries whose institutions are of high quality and who have consequently shown success in business creation and aid delivery. We assume implicitly that better aid practices extend to entrepreneurship. Second, increased experimentation is needed on both sides. The donors should play more to their own institutional strengths and focus on a more limited number of countries, moving away from the full spectrum of recipients, as is the case today (
Knack et al. 2011). Second, while incentivizing institutions are critical for entrepreneurial success, aid recipient countries should also keep in mind the statistics presented in
Table 1. Among DAC countries, there are considerable differences in attitudes towards entrepreneurship. Collaborating with a country that is domestically borderline hostile towards entrepreneurship, and where the fear of failure keeps people from even trying their hand at entrepreneurship, is not the path towards a higher level of entrepreneurial activity. Thus, a good starting point for an aid recipient country would be to look for a donor that combines both high quality institutions and an overall positive attitude towards markets and entrepreneurs.
Choosing from among the DAC members without burning all bridges is not an easy task. To start with, the aid recipients may want to try traditional diplomacy. First, identify whom you want to work with, and then reallocate appropriate diplomatic resources behind the goal of closer co-operation. An alternative way has also presented itself in the recent aid literature (see
Knack et al. 2011;
Palagashvili and Williamson 2014;
Gulrajani 2016). When both bi- and multilateral donors are compared in their efficiency in aid disbursements, the latter has, on average, been shown to be considerably more competent. Thus, moving the aid regime more towards the multilateral model could be a way to improve aid’s results without further increasing the need for resources in the system. All things being equal, resource use could even go down in the modified structure.
Take the example of the African Development Bank (AfDB). It was ranked first among 73 bi- and multilateral donors based on transparency, aid recipient’s level of democracy, level of corruption, quantity of administrative overhead and the use of effective aid channels, in
Palagashvili and Williamson (
2014). The basic structure of the organization parallels those of other regional development banks, and takes its inspiration straight from business. The development banks are typically organized as a stock corporation, where the donors have most of the shares. The share holdings are determined according to the amount of aid and other future commitments (grants, subsidized loans) a country has earmarked for the bank. The minority stake (49% or less) is divvied up among the aid recipient countries, based on a pre-determined rule like country size, average income, etc.
The Bank has an annual shareholders’ meeting, and management under the constant guidance of the Board of Directors runs its daily operations. Since the Bank has over 70 shareholding countries, it is impractical for every country to participate in the Board of Directors meetings. Thus, the banks have created subgroups from countries, each group representing a similar percentage of the total vote share. One group may consist of Denmark, Finland, Norway, Sweden and Switzerland, and it can appoint one director to the board. The position typically rotates within the group every few years. The group has frequent internal meetings of development aid officers to discuss what kind of development policy instructions to send from the donor headquarters to their board representative (Executive Director). This same process plays out in other country groups (the largest donors, like the U.S., may have a group of their own). The various policy proposals of the groups are then discussed, and policies hashed out in the board meetings to create practical instructions for the management to follow.
The system has several advantages. The process is considerably more transparent than its bilateral counterpart is. It also steers the bank away from fragmented projects, since there is just one control place that knows about all the simultaneously running projects. This provides for quite a contrast to the 23 independently operating bilateral donors, each operating in tens of countries with sometimes strikingly different policy objectives. The multilateral set-up partially solves the co-ordination problem that
von Hayek (
1945) warned about. The multi-country forum also has the benefit of giving the aid recipient countries a better chance to be heard—even if still as minority shareholders. As mentioned, one particularly valuable benefit of the multilateral system is transparency: shareholders do demand periodic public reports and high-quality audits. Paradoxically, due to internal administrative politics, it is easier to run an independent audit on others than on oneself.
Finally, good governance has been one of the operative keywords of most development banks for the last two decades. The banks now officially stand for high-quality institutions, discouraging countries from transferring their own, poor institutions to the recipient countries. The development bank model is one promising way to try to export the institutional best practices from aid donors to recipient countries, while simultaneously moving the focus of development aid from the bilateral to a multilateral direction. This change would encourage the creation of quality institutions, and thereby also promote entrepreneurship as a development strategy (
Knack et al. 2011;
Palagashvili and Williamson 2014;
Gulrajani 2016).
6. Conclusions
Despite the large number of studies in entrepreneurship literature, there is a lack of studies linking entrepreneurship with foreign aid (
Jia 2018). While the primary objectives of foreign aid often may not be a promotion of entrepreneurship, the existing literature agrees that new business creation has a great potential to raise income levels in developing countries. In the present study, we aimed to narrow this gap and provided an analysis of how institutional quality (not only of the foreign aid recipient countries, but also of the aid donor countries) plays a role in the creation of new entrepreneurial activity.
At the beginning of the paper we asked whether development aid recipients, to increase their entrepreneurship rate, should shy away from the Leviathan-type government donors? According to the evidence uncovered, the answer would have to be yes. Leviathan governments can be identified by their proclivity for high levels of government spending, debt and market regulations, and complex tax codes. These often translate into low scores in the institutional quality indices and have a negative effect on new business creation. It was also noted that aid recipients should avoid donor countries where the public has unreceptive attitudes towards markets and entrepreneurship.
We also argued that co-ordination of aid efforts among donors is critical, but it should more frequently take place within the structure of building and strengthening institutions and the multilateral aid set-up. This change would have several advantages over the current state of affairs: more openness, less project fragmentation and more co-ordination, potential for more aid specialization, and a smoother transfer of the best institutional practices from the wealthy to the poor countries. Multilateral arrangements, as described, would also dampen the individual countries’ worst instincts and tendencies for widely spread, unfocused and self-serving aid. In its first 60 years, the development policy regime has skillfully moved mostly physical inputs from the wealthy countries to the poor countries. Yet, the long-term results have been disappointing. A paradigm shift has been brewing in the background for some time now. Now seems right to start moving the focus of aid from Leviathan to Invisible Hand type of practices—from material inputs to ideas, institutions and incentives that, by design, support entrepreneurial activity.


