Article

The Evolution of the Key Sectors in the Philippine Economy Using an AHP-Based Sector Prioritization Index

by
Daryn Joy Go
1,
Michael Angelo Promentilla
2,3,
Kathleen Aviso
2,3 and
Krista Danielle Yu
1,*
1
School of Economics, De La Salle University, Manila 0922, Philippines
2
Chemical Engineering Department, De La Salle University, Manila 0922, Philippines
3
Center for Engineering and Sustainable Development Research, De La Salle University, Manila 0922, Philippines
*
Author to whom correspondence should be addressed.
Economies 2019, 7(3), 78; https://doi.org/10.3390/economies7030078
Submission received: 23 June 2019 / Revised: 21 July 2019 / Accepted: 22 July 2019 / Published: 6 August 2019

Abstract

:
Economic sectors play a vital role in ensuring that government’s goals are achieved. This study analyzes the evolution of the structure and key sectors of an economy through the use of a sector prioritization index. This methodology integrates input-output analysis and analytic hierarchy process to determine the structural changes experienced by the economy, while accounting for the changes in the government’s priorities and concerns over time. Using the case of the Philippines from 1969 to 2012, this study shows a time-series analysis of the transformation that the economy underwent alongside with the government’s prioritization mechanism. We found that the manufacturing sector had consistently received high-priority rankings, while the agriculture sector had recently moved from a high- to mid-priority ranking, indicating the country’s shift towards a more industry-driven economy. These findings were supported by the private services and trade sectors’ high-priority rankings towards the latter half of the time period. Overall, our methodology was able to identify key sectors that reflect the country’s economic and political situation across different eras.

1. Introduction

Countries often face significant economic fluctuations due to persistent changes in external factors, such as political regimes. Government priorities and policy actions play crucial roles in determining an economy’s growth and decline. Such disruptions pose a threat to resource allocation decisions because policymakers must now account for how the economy interacts with external changes, such as these, over time, to make well-informed investment and policy decisions. Hence, there is a need to evaluate the structural changes in the economy and to determine how its political factors can affect the economic landscape.
Aside from this, countries constantly face the problem of scarce resources, prompting the need for policymakers to be able to identify and invest in the country’s key economic sectors. Hence, in addition to accounting for the country’s priorities and concerns, there is also a need to identify which sectors have often or consistently played a primary role in improving the economy over time. This will allow policymakers to have a better understanding of which sectors they must prioritize, in terms of policies and resources. Proper resource allocation maximizes the impact of investments to promote economic growth and development further.
Given this, policymakers are in need of proper resource allocation techniques that account for the internal interactions within an economy, as well as the impact of its interactions with external factors, like politics and the environment. This study presents one such technique and makes use of Leontief’s (1936) Input-Output (I-O) Model as its primary methodology to fully account for the transactions and interactions among sectors within the economy. Davis (1987) also highlights this powerful tool’s ability to be extended to further account for the effects of external factors influencing the economy. Both Ferrão and Fernández (2013) and Pina et al. (2016) suggest that I-O analysis can serve as a useful tool in analyzing the evolution of economies. They propose that this can be done by generating and applying indicators from I-O analysis towards the study of economies over time. Domínguez and Mendez (2019) also used I-O tables as a basis for evaluating industrial productivity divergence and network structures over time.
In line with this, Magtibay-Ramos et al. (2011) developed a study to observe the Philippine economy’s structural evolution using I-O analysis. This was done by employing I-O linkage indicators to identify the changes in sectoral interactions from 1979 to 2000. Additionally, Ballester et al. (2013) employed the growth factor decomposition and I-O methodology to measure each sector’s contribution to the Philippine economy’s overall growth, and how these have evolved from 1961 to 2006. However, existing literature was unable to examine the economy’s structural changes thoroughly. This is because, in identifying the key economic sectors, both studies were only able to individually account for one specific factor that contributes to a sector’s importance to the overall economy. As such, there is still a need to develop a study that identifies key economic sectors, while fully accounting for an economy’s various priorities and concerns. Moreover, both studies were unable to consider the evolution of the government’s priorities in identifying the economy’s primary sectors over time.
However, researchers and policymakers are unable to resolve this research gap as they currently lack data that measure and indicate a government’s priority level for each economic and political factor. Because of the lack of information, policymakers are unable to accurately determine the key economic sectors to be prioritized in resource allocation decisions. To address this data gap, Landeta et al. (2008) suggested that researchers must maximize the knowledge and proficiency of experts to supplement objective data. They propose that integrating both types of data will improve the accuracy of a study’s results. Additionally, Wydra (2011), who studied the impact of biotechnology on Germany’s production and employment, found that integrating data generated from experts and from quantitative I-O tables expands the scope of a study’s results. Moreover, he found that this technique revealed more useful insights for the study compared to merely using objective data. As such, this study adopts Saaty’s (1980) Analytic Hierarchy Process (AHP) in order to integrate expert judgment with objective I-O data to account for a government’s preference assignments for the various priorities and concerns of a country.
The combination of I-O analysis and AHP allows us to generate a powerful tool that holistically accounts for the evolution of an economy. Through applying I-O analysis across a period of time, researchers will be able to gain insights on the structural changes experienced by the economy. These include the changes in sectoral interactions and roles within the economy as well as the changes caused by disruptions and resource allocation decisions over time. Additionally, I-O methodology allows us to generate different economic indicators to wholly account for an economy’s various concerns. On the other hand, AHP allows researchers to account for the changes in the government’s priority rankings—for these political, and economic concerns—when analyzing the evolution of economies.
Given this, the study seeks to fill the research gap by extending the use of Go et al.’s (2019) AHP-based Sector Prioritization Index to analyze the evolution of the structure and key sectors of an economy. The index identifies key economic sectors based on five sector significance measures: (1) Its degree of influence towards the rest of the economy; (2) its structural significance or contribution to overall output production; (3) its degree of interconnectedness with other economic sectors; (4) its dependence on the domestic economy; and (5) its contribution to the economy’s risk of inoperability or production failure. These five components allow the index to wholly account for an economy’s concerns. Additionally, through the AHP, the index also weighs each measure based on the assessment made by economic experts in order to account for the country’s level of priority or concern for each measure of significance. This allows us to identify the key sectors in the economy based on the government’s specific priorities and preferences during each political regime. Through this, policymakers are given a clearer picture of which sectors had been and should be given the most priority.
The remainder of the paper is structured as follows. Section 2 summarizes the mathematical formulation of the AHP-Based Sector Prioritization Index. Section 3 presents the data and the results of the Philippine case study from 1969 to 2012. Lastly, Section 4 summarizes the study’s key findings and recommendations for future research.

2. Mathematical Framework

This study makes use of an AHP-based sector prioritization index that identifies key economic sectors based on five sector significance measures, which are as follows. The sector’s relative influence over other sectors in the economy is measured by the power of the dispersion index. Its relative structural significance or output contribution is measured by the sector size. Its degree of interconnectedness as both producer and consumer in the economy is measured by the average propagation length. The sector’s dependence on domestic inputs for its output production is measured by the sectoral purchase coefficient. Lastly, its contribution to the economy’s risk of production failure (or inoperability) is measured by the inoperability multiplier. All five aforementioned measures were generated from Leontief’s (1936) Input-Output (I-O) model, which will be discussed in the following section.

2.1. Leontief Input-Output Model

Leontief (1936) formally models the interactions among economic sectors as:
x =   A x   +   f   =   ( I A ) 1 f ,
where x is the vector of total output produced by each sector and A is the technical coefficients matrix, where each element a i j is the amount of inputs sector i contributes to sector j. f is the vector of final demand for each sector’s output, and ( I A ) 1 is the Leontief inverse matrix, which measures the rate of increase in total output brought about by an increase in final demand.

2.2. Components of the Sector Prioritization Index

2.2.1. Normalization of Index Components

Aside from the I-O model, Eichhorn’s (1976) normalization process was also adopted in the formulation of the index components in order to ensure that the standards of a good index are met. Each element of a specific index component vector e i was, thus, normalized as follows:
e ¨ i = e i i = 1 n e i ,
where the normalized index component e ¨ i ranges from 0 to 1. Sectors with higher e ¨ i values are considered critical, and thus must be given priority in resource allocation and policy decisions. Given this, the following section introduces the five components of the sector prioritization index.

2.2.2. Component 1: Power of Dispersion Index (PDI)

Each sector’s degree of relative influence on the economy is defined as:
p ¨ i = p i i = 1 n p i ,
where Rasmussenís (1957) measures the relative degree of change in the economy’s overall output, caused by an increase in sector i’s final demand, as p i = j = 1 n ( I A ) 1 i j 1 n j = 1 n i = 1 n ( I A ) 1 i j . As such, higher p ¨ i values indicate that a final demand increase in sector i leads to a relatively larger increase in total economic output. Additionally, this suggests that sector i induces larger positive spillover effects relative to other sectors in the economy, thus making it a key economic sector.

2.2.3. Component 2: Sector Size (SS)

Yu et al. (2014) measure each sector’s output relative to the total economic output as:
x ¨ i = x i i = 1 n x i ,
where x i is the total output produced by sector i. Higher x ¨ i values indicate that sector i has a larger output contribution relative to the rest of the economy. As such, the sector is more structurally significant to the economy.

2.2.4. Component 3: Average Propagation Length (APL)

Yu et al. (2014) adapted Dietzenbacher et al. (2005) measure for each sector’s inter-sectoral linkages as follows:
s ¨ i = j = 1 n s j i + j = 1 n s i j 2 s i i     i = 1 n ( j = 1 n s j i + j = 1 n s i j 2 s i i     )   ,
where the backward APL j = 1 n s j i   measures the number of sectors each sector i interacts with as a result of a change in its final demand and the forward APL j = 1 n s i j   measures the number of sectors each sector i interacts with as a result of a change in its primary cost. Additionally, 2 s i i is eliminated to ensure that sector i’s interactions with itself will not be included in the measure. As such, higher s ¨ i values indicate that, as both a producer and consumer, sector i interacts with more sectors in the economy. This implies that sector i is a major economic player and has a larger scope of influence on the rest of the economy.

2.2.5. Component 4: Sectoral Purchase Coefficient (SPC)

Each sector’s relative degree of dependence on the domestic economy is defined as:
D ¨ i = D i i = 1 n D i ,
where Okuyama and Yu (2018) measure sector i’s domestic input requirements with respect to its output production as D i = 1 M i = m i j = 1 n a i j x j + f i d , m i measures sector i’s total import requirement, j = 1 n a i j x j measures the total amount of input sector i supplies to other economic sectors, f i d measures the total amount of output sector i supplies for final domestic consumption, and M i measures sector i’s import requirement relative to its output production. Higher D ¨ i values indicate that sector i has a relatively larger domestic input requirement for its output production. This means that sector i is more vulnerable to the impact of domestic shocks as these shocks may impede on the production of the domestic sectors it depends on, thus leading to greater production losses. Hence, this contributes to sector i’s significance to the rest of the economy.

2.2.6. Component 5: Inoperability Multiplier (IM)

Each sector’s relative contribution to economic risk and production failure is defined as:
g ¨ i = g i i = 1 n g i ,
where g i measures the increase in production failure caused by a reduction in sector i’s final demand. Santos and Haimes (2004) derive g i by taking the column sums of ( I A ) 1 , where I is the identity matrix and A is the interdependency matrix that measures the production failure sector i contributes to sector j. Given this, higher g ¨ i values suggest that sector i causes the economy to experience a larger degree of production failure and negative spillover effects, making it a critical sector to invest in.

2.3. Formulation of the AHP-Based Sector Prioritization Index

2.3.1. Composite Sector Prioritization Index

All five index components are then constructed into a composite sector prioritization index as follows:
R i =   W p ¨ p ¨ i +   W x ¨ x ¨ i + W s ¨ s ¨ i   +   W D ¨ D ¨ i + W g ¨ g ¨ i ,
where 0 W p ¨ , W x ¨ , W s ¨ , W D ¨ , W g ¨ 1 , and   W p ¨ +   W x ¨   +   W s ¨   +   W D ¨ + W g ¨ = 1.
R i is an index whose values range from 0 and 1. Sectors with higher R i values are identified as crucial to the economy. Additionally, the weights W were derived by adopting Saaty’s (1980) AHP, which will be discussed in the following section.

2.3.2. Analytic Hierarchy Process

Saaty’s (1980) AHP is one of the most notable contributions to the field of multi-criteria decision analysis. In this process, the weights of the index components are generated from experts’ pairwise comparisons of the five sector significance measures. These comparisons are based on each measure’s perceived importance to the economy’s specific goals and concerns. To ensure the accuracy of the study, three experts were selected based on the depth of their knowledge and expertise on the Philippine economy and structural economics1. According to Saaty (1980), the ratings—enumerated in Table 1—range from 1 (equal preference for both measures) to 9 (strong preference for one measure relative to another). Given this, the AHP framework is enumerated as follows:
Once the experts’ ratings are collected, the average of each pairwise comparison will be generated and summarized in a matrix known as the pairwise comparison matrix. Given n = 5 number of index components, the pairwise comparison matrix is constructed as follows:
O = [ o i j ] = ( 1 o 12 o 13 o 14 o 15 1 / o 12 1 o 23 o 24 o 25 1 / o 13 1 / o 23 1 o 34 o 35 1 / o 14 1 / o 24 1 / o 34 1 o 45 1 / o 15 1 / o 25 1 / o 35 1 / o 45 1 )
where o i j is the average preference rating given by the experts’ or the experts’ average preference for the ith component relative to the jth component and o j i = 1 / o i j for i , j = 1 , 2 , 3 , 4 , 5 .
The weight of each index component w i is then generated from the pairwise comparison matrix through Equation (10):
O w = λ m a x w ,
where λ m a x represents the maximum eigenvalue and w represents the vector of the index components’ weights w i .
Lastly, to ensure the consistency and reliability of the pairwise comparisons, the following condition must be satisfied:
Consistency   Ratio = C I R I 0.1 ,
where C I is the consistency index of the pairwise comparison and is defined by Equation (12):
C I = λ m a x n n 1 ,
and R I is the consistency index of a randomly generated matrix, whose values depend on the size of the pairwise comparison matrix. Table 2 summarizes the RI values specified by Saaty (2012).

3. Case Study: The Evolution of the Philippine Economy

3.1. Data

As mentioned earlier, this study aims to identify the key sectors of the Philippine economy, in the past four decades, and to determine how these have evolved over time. As such, the study’s dataset comprises of the I-O tables published by the Philippine Statistics Authority for the years 1969, 1974, 1979, 1985, 1988, 1994, 2000, 2006, and 2012. For the purpose of uniformity, the I-O tables were aggregated into eleven sector I-O tables. These eleven sectors include: (1) Agriculture, Fishery and Forestry; (2) Mining and Quarrying; (3) Manufacturing; (4) Construction; (5) Electricity, Gas and Water; (6) Transportation, Communication and Storage; (7) Trade; (8) Finance; (9) Real Estate and Ownership of Dwellings; (10) Private Services; and (11) Government Services.
The respondents’ pairwise rankings were averaged and constructed into a pairwise comparison matrix to determine each index component’s weights, which were used to generate each sector’s prioritization index value. The questionnaire administered to the experts can be found in Appendix A. The generated values then served as the basis in identifying the country’s key economic sectors during each time period. Table 3 summarizes the AHP weights generated for the years 1969 to 2012.

3.2. Sector Prioritization Results: 1969–2012

Given this, the following section features a year-by-year discussion of the key sectors in the Philippine economy based on the sector prioritization results. The discussion will be divided into six major portions representing the following significant eras in the Philippine economy: The pre-, during, and post-martial law eras, the pre- and post-Asian Financial Crisis eras, and the post-Global Financial Crisis era.

3.2.1. Sector Prioritization Results: Pre-Martial Law Era (1969)

During the late 1940s, the Philippines was heavily relying on the United States of America to overcome debts and repair damages caused by World War II. However, despite receiving financial aid, the Philippine economy inevitably experienced a financial crisis in 1949. In an attempt to address the decline in the Philippines’ balance of payments, the government resorted to importation controls, which paved the way for the country’s industrialization. However, the government abolished the trade restrictions and devaluated its currency, causing the industrial sectors to experience negative shocks. This was quickly corrected by the re-imposition of import controls in the late 1960s.
Given that the economy prioritized the sector’s scope of influence and dependence on the domestic economy, the key sectors in the 1969 Philippine economy were manufacturing, agriculture, fishery and forestry, and private services, as seen in Table 4. The manufacturing sector was deemed the most important sector in the economy, due to the import restrictions and controls in the Philippines, which pushed the manufacturing sector to grow and gain the role of one of the primary engines of development in the economy. This implies that injecting more resources to this sector will yield a higher positive spillover effect, due to its degree, reach, and scale of influence towards the other sectors in the economy and its contribution to overall economic output. Additionally, this sector must be prioritized in order to lessen the scale of the negative spillover effects that may materialize, due to its dependence on the domestic economy and contribution to the risk of inoperability. As seen in the 1960s, the negative shocks experienced by the domestic economy led to a severe decline in the growth of the manufacturing sector.
Moreover, the agriculture sector also plays a vital role in the Philippine economy as it was initially agriculturally-driven. Agriculture was the second largest sector and was, thus, responsible for a large portion of the economy’s output. In addition to this, the country’s sudden currency devaluation led to a surge in agricultural and mineral exports, which allowed the sector to gain a larger scope of influence in the economy. These, and the sector’s vulnerability to negative domestic shocks like calamities, make the agriculture sector a priority in resource allocation decisions.
Additionally, the private sector is also considered a key sector in the economy, due to its degree of interconnectedness, as a supporting structure for various economic sectors, such as the manufacturing sector. The sector’s role in ensuring the continuous operations of various industrial sectors increases its degree of influence, structural significance, and contribution to the risk of inoperability in the economy. Moreover, more resources must be allocated to this sector, especially since its interconnectedness implies its vulnerability to shocks experienced by other domestic sectors.
Lastly, results show that the trade, transportation, communication and storage, electricity, gas and water, and construction sectors are only mid-priority, while real estate and ownership of dwellings, finance, mining and quarrying, and government services are low-priority. This indicates that fewer resources need to be allocated to these sectors, possibly because these sectors may not have been as developed as the top three sectors. Hence, they only contribute to a small fraction of the economy’s output and risk of inoperability. Additionally, the nature of these sectors requires fewer interactions with other sectors in the economy, thus contributing to a lower degree of influence and interconnectedness.

3.2.2. Sector Prioritization Results: Martial Law Era (1974–1985)

In 1972, Former President Marcos declared martial law in the Philippines as a response to the uncontrollable amount of revolutions experienced by the country. This was initially met by confidence in both the foreign and domestic markets and the economy quickly escalated into an economic boom. This economic boom was heavily driven by domestic commercial banks, the influx of foreign capital, and technological innovations. However, the economy’s performance took a turn in the 1980s as corruption, the mismanagement of publicly-owned corporations, and rising foreign and national debt became apparent. The government’s attempt to respond to the crisis by encouraging foreign trade was unsuccessful and signaled the beginning of the Philippines’ economic decline.
The results of the study for this era reflect the economy’s situation during the initial boom and its subsequent decline. From Table 5, we deduce that the top two key sectors of the economy include the manufacturing and the agriculture, fishery and forestry sectors from 1974 to 1985, while the third-highest priority is the finance sector for 1974, and the trade sector for 1979 and 1985. Much like the pre-martial law era, the manufacturing sector continued to be the primary sector in the economy. The rise in the prices of raw materials in the 1970s led to an economic boom, wherein the manufacturing sector was able to maintain high growth rates. Additionally, the manufacturing sector continued to grow, due to the growing demand for manufactured exports from the Philippine economy. These contributed to the sector’s degree and scope of influence, as well as its structural significance, relative to the other sectors in the economy. The Philippine economy’s heavy reliance on the manufacturing sector and the sector’s large degree of interconnectedness with other sectors in the economy places higher risks of it causing negative spillover effects in the economy. To add, the high interconnectedness of this sector also makes it more vulnerable to domestic shocks. For these reasons, the manufacturing sector was considered to have the highest priority in terms of resource allocation decisions during the martial law era.
Aside from the manufacturing sector, the agricultural sector also experienced a period of high output growth, due to the economic boom. This, coupled with the development of agricultural technology, made agriculture one of the key sectors of the Philippine economy during the period of martial law. However, because the manufacturing sector’s export demand increased to twice as much as that of the agricultural sector, the latter sector’s output contribution and degree of influence were smaller in comparison to the former sector, making the latter a lower priority. Nevertheless, its vulnerability and contribution to negative shocks still make it a priority in resource allocation decisions.
The financial sector followed the agricultural sector in the sector prioritization scale because the Philippines depended on it to finance the economic boom in the early 1970s. Many sectors heavily relied on the financial sector in order to continue their operations. Its large degree of influence may explain why the financial sector became a highly prioritized sector in 1974 despite its smaller sector size relative to the others in the economy. Additionally, the nature of this sector makes it more vulnerable to shocks or changes experienced by other sectors in the economy as its operations and output heavily depend on the state of the different domestic industries, thus, contributing to the overall significance of the sector.
However, due to the simultaneous excessive foreign borrowing and the mismanagement of the corporations, the financial sector began to shrink and fail in the 1980s, causing it to drop in ranking. As such, the trade sector took its place as the third-highest priority sector in the economy from 1979 to 1985. This is because the Marcos Regime heavily relied on the trade industry’s large degree of interconnectedness in encouraging economic growth. This was evidenced by the sudden changes in trade policies to spur economic activity and finance growing debts. However, despite the government’s efforts, the trade industry continued to decline, which led to a sharp decline in overall economic growth and activity. This then implies that the trade sector’s large contribution to economic loss and inoperability played a large role in its high ranking in the sector prioritization scale.
Furthermore, the government sector significantly rose in ranking from eleventh in 1969 to sixth in 1974, due to the fact the Marcos Regime also heavily relied on the government to finance the economic boom during the early 1970s. However, this led to rising national and international debts, thus causing the impending decline of the sector. This resulted in the government sector reverting back to simply being a consumer rather than a producer of goods and services, causing a decline in the sector’s output contribution, as well as its interconnectedness with and ability to influence other sectors. This was evidenced by their drop in the ranking from sixth place back to the eleventh place in 1979 and 1985.
In contrast, the implementation of martial law led to a diaspora of human capital and restrictions coupled with the increased priority given to government sector brought about a significant decline in the ranking of the private services sector from three in 1969 to ten in 1974. However, as confidence in the Marcos regime regressed over time, higher priority slowly went back to the private services sector rising to sixth and fourth, in 1979 and 1985, respectively.
Lastly, the mining and quarrying and the real estate and ownership of dwellings sectors continued to have lower rankings relative to the other sectors in the economy. This may be because these sectors have fewer interactions with the rest of the economy; thus, they are less dependent on the domestic economy and less risky in terms of contributing to negative spillover effects.

3.2.3. Sector Prioritization Results: Post Martial Law (1988)

After Marcos’s Regime ended, Corazon Aquino was elected president. Much of her regime was focused on correcting the significant debt and financial decline caused by the former administration. Initially, the Aquino administration was met with uncertainty and doubt. However, this quickly took a turn as the administration’s economic policies encouraged domestic consumption, which then led to positive economic growth. This achievement rapidly increased investor confidence, thus further fueling the country’s growth. By the late 1980s, the country’s industrial capacity was almost fully utilized. However, this growth was not smooth-sailing as it was met with several shocks caused by a series of natural disasters, including drought and typhoons. The results of the study mirror the economic and political climate of this time.
Table 6 provides the sector prioritization indices of the various sectors with the highest sector prioritization ranks in 1988, namely the manufacturing, agriculture, fishery and forestry, and transportation, communication and storage sectors. During the regime of Corazon Aquino, the manufacturing sector maintained its rank as the most important sector in the economy, due to a rise in the investment and utilization of capital in the industrial sectors, most especially in manufacturing. This, coupled with its increasing output contribution and scope of influence, made the manufacturing sector a key driver of the economy. Hence, this implies that more resources needed to be allocated to this sector, due to its relative influence—in generating both positive and negative spillover effects—on the entire economy.
In addition, the agriculture, fishery and forestry sector continued to be the second-highest priority, due to the sector’s size relative to the whole economy. This may also be due to the administration’s investment in agricultural technology development. Furthermore, the sector’s vulnerability to negative shocks, also implies that a larger portion of financial aid and resources must be given to this sector to prevent large-scale economic loss and inoperability. As evidenced by history, the Philippine economy suffered greatly because of a series of natural disasters experienced by the country during the late 1980s and early 1990s. This is largely due to the fact that the agricultural sector experienced large amounts of losses, which ultimately led to widespread economic decline, thus illustrating agriculture’s role and influence on the entire economy.
Moreover, the transportation, communication and storage sector rose in terms of its relative importance to the entire economy. This may be largely caused by the rapid growth of the industrial sectors. The transportation sector plays a vital role in ensuring that various industries can continue their operations, especially since it ensures the transportation and exchange of goods and services, which is imperative for all sectors’ output production. These imply that the sector is highly interconnected with the rest of the economy, thus contributing to the sector’s overall degree and scope of influence. Hence, more resources must have been allocated to this sector in 1988, due to its vital role in generating positive and negative spillover effects.
Lastly, the real estate sector continued to have a low-level priority ranking, due to its small sector size and minimal interactions with the rest of the economy, while the government services and the electricity, gas and water sectors were found to have lower priority rankings, due to their continuous decline in output share. This was heavily caused by the country’s growing debt problem and lack of resources to generate enough power, respectively.

3.2.4. Sector Prioritization Results: Pre-Asian Financial Crisis (1994)

After the Aquino administration, the Ramos administration was characterized by economic growth and prosperity. The country was gaining its reputation as Asia’s next tiger economy as the administration’s efforts to privatize corporations, regulate monopolies, and liberalize investment controls led to rapid industrialization. The country’s growth was further fueled by the government’s efforts to improve the trade and investment climate of the Philippines through the establishment of the export processing zones. However, much like the Aquino administration, the economy’s growth was also faced with threats caused by persistent natural disasters. The ramifications of disasters and the administration’s initiatives can be seen in the results of the study.
Table 7 presents the sector prioritization indices for all economic sectors for 1994, wherein the highest priority-ranking sectors are the manufacturing, agriculture, fishery and forestry, and trade sectors, respectively. As expected, the manufacturing sector retained its position as the most important sector in the economy. Its continued influence and output contribution in the economy was further fueled by the privatization of several firms during the Ramos Administration. Additionally, Ramos’s reforms led to a sudden influx of investment, which further strengthened and increased the production capacity of the manufacturing sector. Hence, the manufacturing sector was deemed as having the highest priority in terms of resource allocation decisions as it is responsible for much of the economy’s growth. This then makes the need to prioritize the manufacturing more evident especially because of the sector’s ability to generate a wide range of positive and negative spillover effects that may lead to the rise and fall of the economy in 1994.
Aside from the manufacturing sector, much of the Philippine economy’s growth can be attributable to the agriculture sector’s increase in output production in the early 1990s. This, and the sector’s persistent vulnerability to shocks from the domestic economy, makes it the high-priority sector next to manufacturing. Additionally, because of the sector’s structural significance and riskiness in contributing to widespread inoperability, the agricultural sector must have been given more priority in resource allocation decisions to shield the economy against possible widespread losses.
Moreover, the Ramos Administration’s efforts to improve the Philippine trade and industrial centers, specifically in the Subic and Clark economic zones, is evident in the results found in this study. As seen in Table 7, the trade industry regained its position as a high-priority sector. This implies that prioritizing this sector in resource allocation decisions may yield larger positive spillover effects, due to its structural significance and influence towards the economy in the 1990s. Additionally, the trade industry is heavily reliant on other domestic sectors for its operations to continue, thus making it a key sector in the economy.
Lastly, the real estate and mining sectors remained to have low-level priority rankings, due to their lack of relative structural significance and interindustry relations in the economy. Additionally, it is interesting to note that despite the Ramos Administration’s efforts to improve the Philippine finance sector, it remains to be a low-priority sector, which indicates that the government should have allocated fewer resources towards this sector.

3.2.5. Sector Prioritization Results: Post-Asian Financial Crisis (2000 and 2006)

After the Asian Financial Crisis in the late 1990s, much of the country’s efforts were focused on hastening the economy’s relatively slow recovery. The Estrada administration was initially met with confidence as investments quickly entered the country. However, this promptly came to a halt as reports of cronyism and corruption surfaced. Despite this, the government continued its efforts to induce economic growth by easing foreign exchange and trade policies in an attempt to encourage international and domestic trade. Nevertheless, these policies were not enough to correct the economy’s slow growth, and the rising number of scandals eventually resulted in the president’s impeachment.
The presidency was then turned over to Estrada’s vice president, Gloria Macapagal-Arroyo, whose term proved to be more successful in attracting foreign investments. Although the economy’s recovery remained relatively slow, the administration’s policies successfully encouraged economic activity as output demand began to increase. This, then, led to improvements in both the industrial and agricultural sectors. However, the economy was once again faced with threats of output loss and inoperability, due to its vulnerability to natural disasters.
This turbulent economic situation is reflected in the results of the study. Table 8 presents the sector prioritization indices for 2000 and 2006. For both years, the manufacturing and trade sectors were seen to have the two highest priority rankings, while the third-highest ranking sector was private services and agriculture, fishery and forestry for 2000 and 2006, respectively.
Despite slow economic growth and recovery, due to the Asian Financial Crisis, the manufacturing sector remained to be the main driver of growth for the economy during the Estrada (2000) and Arroyo (2006) Administration. As shown above, the manufacturing sector had the highest priority level, which implies that much of the resources and government efforts must be allocated to this sector because of its continued structural significance, influence, and heavy interconnectedness with other sectors in the economy. This indicates that investments towards this sector may have been able to encourage economic activity and growth further.
Additionally, the trade industry was seen to have a high-priority ranking in both 2000 and 2006. This may be largely due to the fact that the Estrada Administration made much effort to expand and improve the Philippine trade system, thus contributing to the sector’s increase in structural significance in the economy. Furthermore, the trade sector is responsible for the exchange of the economy’s goods and services, thus implying that the sector is highly interconnected with other industries in the economy. These, then, explain why trade is such a crucial sector to the Philippines. Overall, the results support the Estrada Administration’s efforts on improving the trade industry.
Moreover, the private services sector was also seen to be one of the high-priority sectors in 2000. This is because the services it provides are necessary for various sectors to continue operations, making private services a highly interconnected sector in the economy. Its highly interconnected nature also implies that sudden shocks experienced by this sector may lead to widespread inoperability or loss towards other sectors in the economy. Hence, much of the country’s efforts must be allocated to the sector in order to prevent this from occurring.
On the other hand, the agriculture sector regained its high-priority ranking in 2006 after it fell to a mid-priority ranking in 2000. The drop in ranking may be caused by the sudden lack of investment and surge of debt, which caused the agricultural output production to plummet. However, output production was seen to improve as the agriculture sector was able to regain its structural significance and large output contribution towards the economy. Additionally, much of the economy’s resources needed to be allocated to this sector because of the risks it contributed, due to the series of disaster-related shocks experienced by the Philippines.
Lastly, the mining sector remained to be the lowest-ranking sector in the economy for both 2000 and 2006, while the real estate sector retained its low-ranking level only in 2000. Aside from this, it is important to note that the government sector regained a lower priority ranking in 2006 as opposed to its mid-priority ranking in 2000. This is attributable to the Arroyo Administration’s efforts to improve the efficiency of some of its publicly owned corporations, thus allowing the sector to become more resilient to shocks and in turn, making it less of a risk in propagating negative spillover effects.

3.2.6. Sector Prioritization Results: Post-Global Financial Crisis (2012)

After the Philippines’ sharp decline during the Global Financial Crisis, the economy began to rapidly recover under the administration of Benigno Aquino III; and in 2012, the Philippines was recognized to have the second-highest growth rate in the world. This period was characterized by growth brought about by the country’s continuous efforts towards industrialization and the amelioration of the investment climate. As such, the country was met with increasing domestic and foreign demand, which improved its manufacturing and trade industries.
The growth in these industries is evident in the results of the study. Table 9 provides us with the sector prioritization indices for 2012 with the highest priority-ranking sectors as manufacturing, private services, and trade sectors, respectively. As expected, the manufacturing sector remains to be the highest priority sector in the country, for the same reasons as was mentioned in the previous subsections. Subsequently, the private services sector received the second-highest priority ranking. This is because the economy’s industrial sectors are heavily dependent on private services to support their daily operations. Additionally, this implies that the domestic economy’s industrial operations are critical to keeping the private services sector afloat. As such, the sector is extremely susceptible to production failure in the event of domestic shocks. This gives the country another reason for increased allocation of resources.
In addition to these, the trade sector received the third-highest priority ranking because it facilitates the sale and demand for each sectors’ output. As such, the domestic economy relies on trade to fuel its production operations. Aside from this, the sector is also responsible for a large portion of the economy’s overall output production and is heavily interconnected with and dependent on the rest of the domestic economy. This makes trade a crucial sector to invest in because the sector’s wide reach and influence allow it to cascade larger positive spillover effects across the economy.
Lastly, the mining, real estate, and government sectors continue to retain their status as low-priority ranks as expected.

3.3. Summary of the Sector Prioritization Results

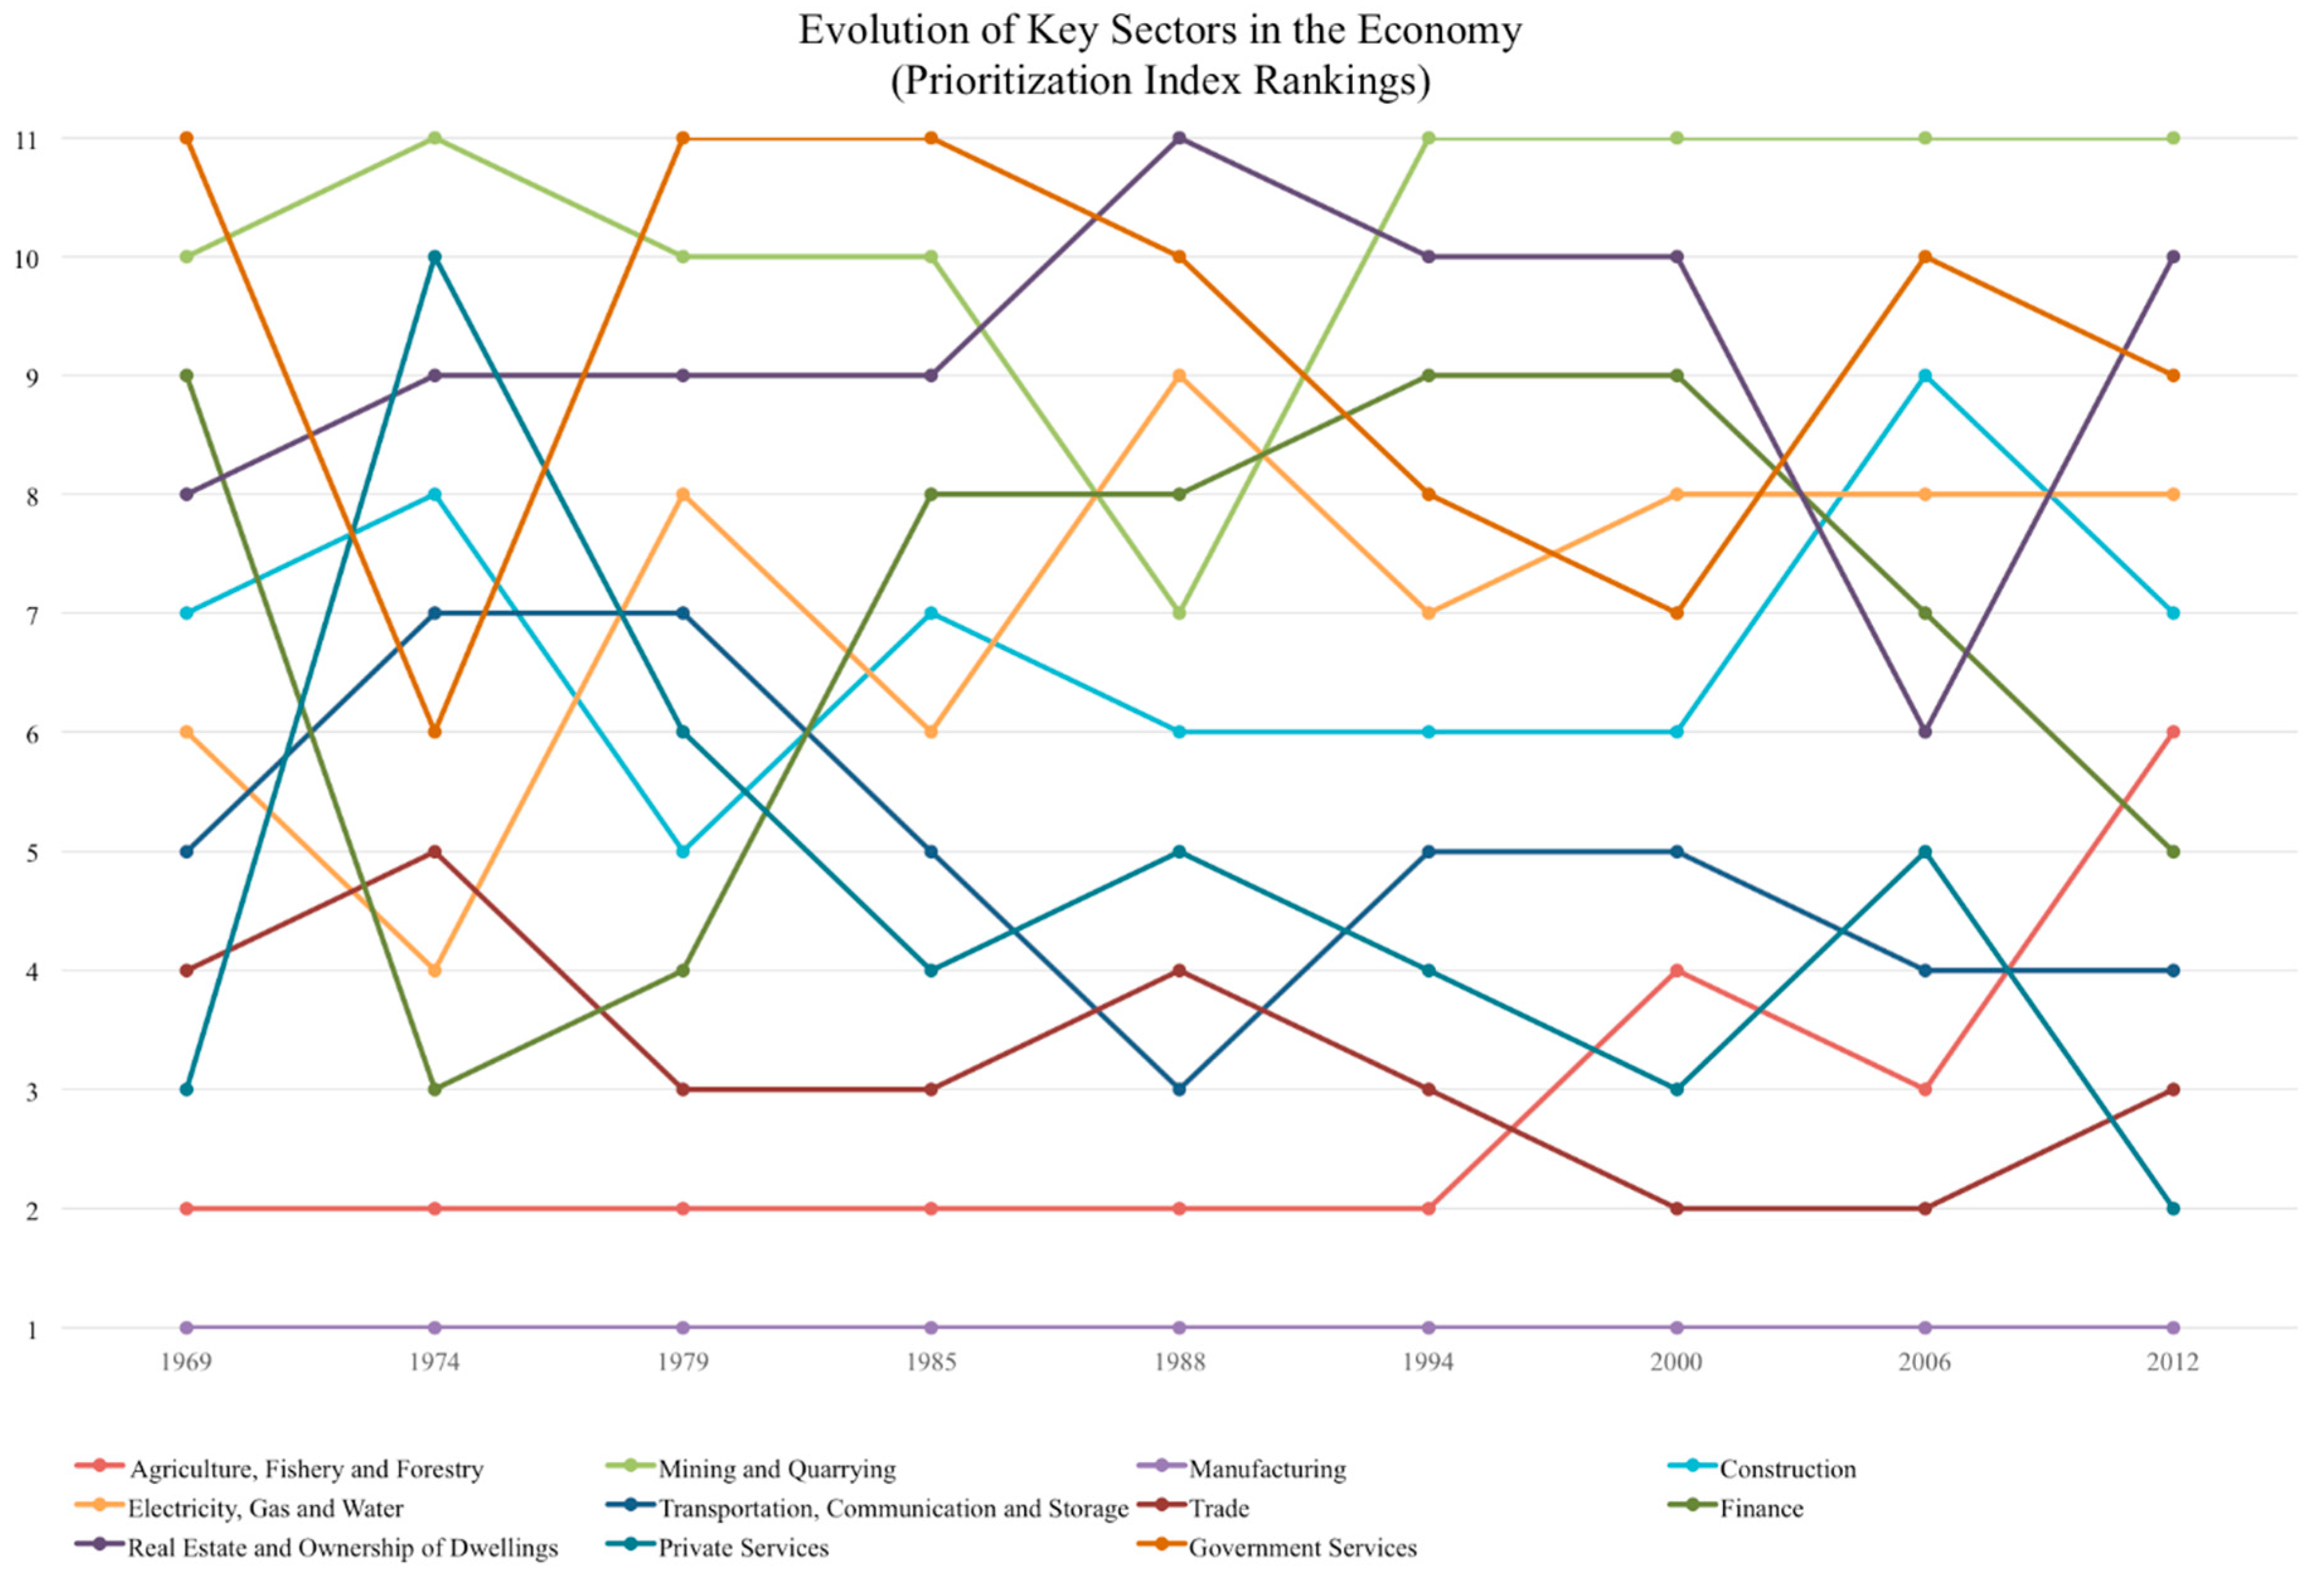
The Philippines has been largely known as an agricultural country, due to its fertile and arable land, which is evident given the agriculture sector’s large output contribution. This study’s results, which can be summarized in Figure 1, support this fact.2 We can observe that the agriculture, fishery and forestry sector had consistently been a high-priority sector from 1969 to 1994. However, its priority ranking started declining soon after 1994. As seen in Appendix B, the sector’s index value dropped from a consistent 0.1 from 1969 to 1994 to a 0.08 from 2000 to 2012. This is evidenced by the Philippines’s shift in focus towards becoming an industry-driven country.
The Philippines’ drive for industrialization has caused the agriculture sector to lose its previous status as one of the largest sources of the country’s outputs, due to the reallocation of investments towards industrial and service sectors. This is evidenced by the fact that—with the exemption of 2006—the sector did not merit a higher priority for resource allocation decisions, despite its vulnerability to disaster-related shocks, due to the country’s shift in priorities. The drop in ranking is also because of the sector’s declining output share, as well as its lack of interconnectedness and influence towards other sectors in the economy.
The 1950s marked a shift of focus from agriculture to industrialization. Protectionist policies were implemented by the early administrations in an attempt to safeguard the domestic industrial sectors against established foreign industries, paving the way for the manufacturing sector’s exponential growth in the 1960s. As shown in the graph, the manufacturing sector had consistently generated the highest sector prioritization value among all economic sectors since 1969. The results highlight the country’s industrialization drive and its heavy dependence on this sector for much of its output production and growth. This is because, aside from the sector’s relative output contribution, it also has the ability to influence the output production of the rest of the economy. It is, thus, a crucial investment choice in order to achieve sustained economic growth. Hence, the manufacturing sector consistently retained its high-priority ranking regardless of the economy’s preference assignments in the sector significance measures. As seen in Appendix B, the sector constantly generated high index values ranging from 0.15 to 0.3, from 1969 to 2012.
The country’s focus and investment in the manufacturing sector are, thus, evident in the results found in all six eras. Even after import controls were abolished, the Philippine government continued to sustain the manufacturing sector’s growth by diverting a large portion of its investment towards the sector. This was seen in Corazon Aquino’s administration, where much of the increase in investment, as well as the utilization of capital, led to the sector’s growth. This was followed by Ramos’s efforts to privatize firms, regulate monopolies, and liberalize investment controls in order to further promote industrialization. Additionally, the sector’s growing importance was made evident during the Estrada and Arroyo administration. Despite the economy’s slow recovery from the Asian Financial Crisis, the manufacturing sector was seen to be the primary source of the economy’s growth and output production. The country’s industrialization efforts became even more aggressive after the Global Financial Crisis, as seen in the administration’s focus on technological innovation and investment in the industrial sectors, which resulted in significant economic growth. Overall, these results demonstrate that the Philippines must continue to invest a larger portion of its resources towards the manufacturing sector, since this may lead to a larger return on investment given its relative output contribution and influence over the output production of the rest of the economy.
The country’s move towards industrialization is also supported by the fact that the private services sector received higher-priority rankings in the study, especially towards the latter half of the time period covered. Evidence shows that 60% of Philippine output comes from the services and contributes significantly to economic growth and poverty alleviation (Hansl et al. 2017). As mentioned earlier, the sector plays a large role in sustaining the operations of industries. This makes it a critical sector in the economy, especially since it is responsible for a large portion of the economy’s output production and can, thus, propagate widespread inoperability. Additionally, its scope of influence suggests that making investments in this sector may further encourage the shift towards becoming a more industry-driven country and may lead to greater positive spillover effects in the economy.
Aside from this, the trade industry’s results also reinforce the country’s drive towards industrialization. As shown in the graphs, the Marcos administration’s trade policies to encourage growth and finance debts resulted in the trade sector’s high-priority rankings in 1979 and 1985. Although the trade sector’s value dropped to a mid-priority level during the Aquino administration, the Ramos administration’s efforts to improve both trade and industrial centers through the establishment of economic zones allowed the sector to regain its previous high-priority ranking. This was sustained by Estrada’s efforts to improve the Philippine trade industry. Furthermore, the high-priority rank was sustained in 2012 because of the country’s significant recovery from the Global Financial Crisis, wherein much of its growth can be attributed to the country’s export and domestic demand. The trade sectors trend in priority values demonstrates how it has been a primary driver of the economy’s growth and how the country’s investment towards this sector has been crucial to the economy in the past decades.
Furthermore, it is observed that in the majority of the years, the (1) electricity, gas and water, (2) transportation, communication and storage, (3) finance, and (4) construction have had mid-priority rankings. This implies that fewer resources have been and should continue to be invested in these sectors as they are only responsible for a small portion of the economy’s overall production. Aside from this, investing in these sectors will only lead to minimal positive spillover effects as they have less inter-sectoral linkages and influence towards the rest of the economy. Additionally, it can be observed that the index values of the mid-priority sectors were consistently close to one another (See Appendix B). This indicates that policymakers may not necessarily prefer one mid-priority sector over another.
Moreover, the findings also indicate that the mining and quarrying and real estate and ownership of dwellings sectors often received low-priority rankings. This is because both sectors have relatively less inter-industry interactions, implying that the sectors are less dependent on the domestic economy and are less likely to propagate widespread risk and inoperability. This, and the fact that the sectors have only been contributing to a small portion of the economy’s output, indicate that the sectors need not be prioritized in resource allocations decisions as they only produce minimal spillover effects.
Finally, the results emphasize the government sector’s tendency to fluctuate from a mid- to low-priority ranking, suggesting that the Philippine government often takes the role of a final consumer in the economy. Hence, its role prevents it from establishing strong linkages with the rest of the economy. This then weakens its influence and its ability to propagate positive spillover effects from the small investments made towards this sector. As such, the Philippines can serve as an example of how the government sector does not necessarily need to be given the most priority in resource allocation decisions.

4. Conclusions

This study provides an analysis of the evolution of economies by identifying an economy’s key sectors and how they have changed over time. Using an AHP-based sector prioritization index developed in Go et al. (2019), we identify key sectors based on five sector significance measures: (1) Its degree of influence towards the rest of the economy; (2) its structural significance or contribution to overall output production; (3) its degree of interconnectedness with other economic sectors; (4) its dependence on the domestic economy; and (5) its contribution to the economy’s risk of inoperability or production failure. In addition, expert judgement is integrated to account for the changes in government priorities and preferences across time.
This case study highlighted the tool’s ability to identify key sectors, which reflect the Philippines’ economic and political situation across different eras. The results of the study suggest that the manufacturing sector consistently received high priority rankings regardless of the economy’s preference assignments of the sector significance measures. This demonstrates the country’s shift towards becoming an industry-driven economy. In addition, the private services and trade sectors also often received high-priority rankings, indicating that much of the country’s investments must be and have been reallocated towards these sectors to further promote the Philippine industrialization efforts. This was also supported by the findings related to the agriculture sector, whose recent decline in priority rankings further illustrate the country’s shift in focus. Moreover, the government sector’s low priority rankings demonstrate how the Philippines is a prime example that, while the government sector is typically prioritized for resource allocation decisions, this may not always be true for all countries. Overall, the results suggest that the country must continue to prioritize its efforts and resources towards the manufacturing, private services, and trade sectors in order to further establish the Philippines as an industry-driven economy.
Through indicators derived from input-output tables combined with expert judgment, the ability to illustrate the evolution of an economy over time is integral in developing future policies. Further research may also explore the application of this methodology in developing a sector prioritization index that includes other indicators deemed important to the specific country of choice. Furthermore, researchers may also integrate more socioeconomic indicators to extend the scope of priorities and concerns accounted for by the index.

Author Contributions

Conceptualization, D.J.G. and K.D.Y.; methodology, M.A.P.; software, M.A.P.; validation, K.A., M.A.P. and K.D.Y.; formal analysis, D.J.G.; investigation, D.J.G.; resources, D.J.G.; data curation, D.J.G.; writing—original draft preparation, D.J.G.; writing—review and editing, K.A., M.A.P., K.D.Y.; visualization, D.J.G.; supervision, K.D.Y.; project administration, K.D.Y.; funding acquisition, K.D.Y.

Funding

This research was funded by the Philippine Commission on Higher Education via the PHERNet Sustainability Studies Program and the Philippine Department of Science and Technology via the Grants for Outstanding Achievements in Science and Technology Program. The authors are grateful to the respondents for sharing their expertise in answering our survey.

Conflicts of Interest

The authors declare no conflict of interest.

Appendix A. Analytic Hierarchy Process Questionnaire

QUESTIONNAIRE
In (year), which of the attributes contributes more to the significance of a sector to the entire economy and by how much?
Power of Dispersion Indexvs.Sector Size
98765432123456789
Extremely higher Very significantly higher Significantly higher Moderately higher Equal Contribution Moderately higher Significantly higher Very significantly higher Extremely higher
Power of Dispersion Indexvs.Average Propagation Length
98765432123456789
Extremely higher Very significantly higher Significantly higher Moderately higher Equal Contribution Moderately higher Significantly higher Very significantly higher Extremely higher
Power of Dispersion Indexvs.Sectoral Purchase Coefficient
98765432123456789
Extremely higher Very significantly higher Significantly higher Moderately higher Equal Contribution Moderately higher Significantly higher Very significantly higher Extremely higher
Power of Dispersion Indexvs.Inoperability Multiplier
98765432123456789
Extremely higher Very significantly higher Significantly higher Moderately higher Equal Contribution Moderately higher Significantly higher Very significantly higher Extremely higher
Sector Sizevs.Average Propagation Length
98765432123456789
Extremely higher Very significantly higher Significantly higher Moderately higher Equal Contribution Moderately higher Significantly higher Very significantly higher Extremely higher
Sector Sizevs.Sectoral Purchase Coefficient
98765432123456789
Extremely higher Very significantly higher Significantly higher Moderately higher Equal Contribution Moderately higher Significantly higher Very significantly higher Extremely higher
Sector Sizevs.Inoperability Multiplier
98765432123456789
Extremely higher Very significantly higher Significantly higher Moderately higher Equal Contribution Moderately higher Significantly higher Very significantly higher Extremely higher
Average Propagation Lengthvs.Sectoral Purchase Coefficient
98765432123456789
Extremely higher Very significantly higher Significantly higher Moderately higher Equal Contribution Moderately higher Significantly higher Very significantly higher Extremely higher
Average Propagation Lengthvs.Inoperability Multiplier
98765432123456789
Extremely higher Very significantly higher Significantly higher Moderately higher Equal Contribution Moderately higher Significantly higher Very significantly higher Extremely higher
Sectoral Purchase Coefficientvs.Inoperability Multiplier
98765432123456789
Extremely higher Very significantly higher Significantly higher Moderately higher Equal Contribution Moderately higher Significantly higher Very significantly higher Extremely higher

Appendix B. Prioritization Index Results

Table A1. Sector prioritization index (PI) summary (1969–2012).
Sector196919741979198519881994200020062012
PIRankPIRankPIRankPIRankPIRankPIRankPIRankPIRankPIRank
Agriculture, Fishery and Forestry0.123520.114720.117720.110820.105220.105820.081940.089830.08396
Mining and Quarrying0.0596100.0522110.0549100.0667100.077870.0564110.0431110.0547110.056411
Manufacturing0.158510.194910.209710.192110.206410.240110.301110.255410.18601
Construction0.082670.063480.088550.077070.079960.074360.067960.068490.08177
Electricity, Gas and Water0.086360.109640.079180.077360.070890.067370.064780.069680.07508
Transportation, Communication and Storage0.089650.069670.081470.084950.089030.081250.079150.081240.08504
Trade0.094140.092350.094530.099130.087640.099830.089420.099220.10843
Finance0.077990.112230.090240.070580.071680.064090.064690.070570.08405
Real Estate and Ownership of Dwellings0.080680.059790.057890.069190.0596110.0569100.0538100.077060.060610
Private Services0.099830.0584100.082860.086040.085550.088740.088630.078550.11402
Government Services0.0474110.073060.0434110.0665110.0666100.065480.065970.0559100.06499

References

  1. Ballester, Richard Emerson D., Jessie Ruth G. Granadillos, Melanie A. Quintos, and Marphil Dela Cruz. 2013. Evolution of the Philippine economy as seen through the time-series input-output tables (1961 to 2006). Paper presented at the 12th National Convention on Statistics, Mandaluyong City, Philippines, October 1–3. [Google Scholar]
  2. Davis, H. Craig. 1987. Accounting for technical substitution in the input-output model. Technological Forecasting and Social Change 32: 361–71. [Google Scholar] [CrossRef]
  3. Dietzenbacher, Erik, Isidoro Romero Luna, and Niels S. Bosma. 2005. Using average propagation lengths to identify production chains in the Andalusian economy. Estudios de Economia Aplicada 23: 405–22. [Google Scholar]
  4. Domínguez, Alvaro, and Carlos Mendez. 2019. Industrial Productivity Divergence and Input-Output Network Structures: Evidence from Japan 1973–2012. Economies 7: 52. [Google Scholar]
  5. Eichhorn, Wolfgang. 1976. Fisher’s Tests Revisited. Econometrica: Journal of the Econometric Society 44: 247–56. [Google Scholar] [CrossRef]
  6. Ferrão, Paulo, and John E. Fernández. 2013. Sustainable Urban Metabolism. Cambridge: MIT press. [Google Scholar]
  7. Go, Daryn Joy, Michael Angelo Promentilla, Kathleen Aviso, and Krista Danielle Yu. 2019. An AHP-based composite index for sector prioritization. International Journal of Analytic Hierarchy Process 11: 42–66. [Google Scholar] [CrossRef]
  8. Hansl, Birgit, Ndiame Diop, Kevin Chua, and Kevin Thomas Garcia Cruz. 2017. Philippine Economic Update: Preserving Consistency and Policy Commitment. Washington, DC: World Bank Group. (In English) [Google Scholar]
  9. Landeta, Jon, Jesús Matey, Vicente Ruíz, and Jordi Galter. 2008. Results of a Delphi survey in drawing up the input–output tables for Catalonia. Technological Forecasting and Social Change 75: 32–56. [Google Scholar] [CrossRef]
  10. Leontief, Wassily W. 1936. Quantitative input and output relations in the economic system of the United States. Review of Economics and Statistics 18: 105–25. [Google Scholar] [CrossRef]
  11. Magtibay-Ramos, Nedelyn, Gemma Esther Estrada, and Jesus Felipe. 2011. Exploring the Philippine economic landscape and structural change using the input-output framework. International Journal of Development Issues 10: 34–59. [Google Scholar] [CrossRef]
  12. Okuyama, Yasuhide, and Krista Danielle Yu. 2018. Return of the inoperability. Economic Systems Research, 1–14. [Google Scholar] [CrossRef]
  13. Pina, André, Paulo Ferrão, Daniela Ferreira, Luís Santos, João FD Rodrigues, and Samuel Niza. 2016. The physical structure of urban economies—Comparative assessment. Technological Forecasting and Social Change 113: 220–29. [Google Scholar] [CrossRef]
  14. Rasmussenís, Poul Nørregaard. 1957. Studies in Inter-Sectoral Relations. Amsterdam: North-Holland. [Google Scholar]
  15. Saaty, Thomas L. 1980. Analytic Hierarchy Process. New York: McGraw-Hill, p. 320. ISBN 096203178X. [Google Scholar]
  16. Saaty, Thomas L. 2012. Decision Making for Leaders: The Analytic Hierarchy Process for Decisions in a Complex World, 3rd Revised ed. Pittsburgh: RWS Publications. [Google Scholar]
  17. Santos, Joost R., and Yacov Y. Haimes. 2004. Modeling the demand reduction input-output (I-O) inoperability due to terrorism of interconnected infrastructures. Risk Analysis 24: 1437–51. [Google Scholar] [CrossRef] [PubMed]
  18. Wydra, Sven. 2011. Production and employment impacts of biotechnology—Input–output analysis for Germany. Technological Forecasting and Social Change 78: 1200–9. [Google Scholar] [CrossRef]
  19. Yu, Krista Danielle S., Raymond R. Tan, Kathleen B. Aviso, Michael Angelo B. Promentilla, and Joost R. Santos. 2014. A vulnerability index for post-disaster key sector prioritization. Economic Systems Research 26: 81–97. [Google Scholar] [CrossRef]
1
Two School of Economics professors from distinguished Philippine universities—De La Salle University and University of the Philippines—and an assistant director of the country’s economic development planning body—National Economic Development Authority—were selected as the key respondents of the study.
2
A summary table of the composite index values can be found in Appendix B.
Figure 1. Summary graph of the prioritization index ranking from 1969 to 2012.
Economies 07 00078 g001
Table 1. Saaty’s scale of relative importance.
RatingPreference
1Equal Importance
3Moderate Importance
5Strong Importance
7Very Strong Importance
9Extreme Importance
2,4,6,8Intermediate Values
Table 2. Consistency indices for random matrices.
n23456789
RI00.580.91.121.241.321.411.45
Table 3. Analytic Hierarchy Process weights (summary).
196919741979198519881994200020062012
Power of Dispersion Index0.17170.33070.17120.17040.18480.25180.14740.15230.1524
Sector Size0.17580.27570.22620.17360.16990.34310.26260.23530.1269
Average Propagation Length0.31610.15880.24740.24760.28520.14820.12990.22320.2296
Sector Purchase Coefficient0.25040.15170.21190.18540.09460.08570.16480.13500.1375
Inoperability Multiplier0.08590.08320.14320.22300.26540.17130.29520.25420.3535
Table 4. Sector prioritization indices for 1969.
SectorPrioritization IndexRank
Agriculture, Fishery and Forestry0.12352
Mining and Quarrying0.059610
Manufacturing0.15851
Construction0.08267
Electricity, Gas and Water0.08636
Transportation, Communication and Storage0.08965
Trade0.09414
Finance0.07799
Real Estate and Ownership of Dwellings0.08068
Private Services0.09983
Government Services0.047411
Table 5. Sector prioritization indices for 1974, 1979, and 1985.
Sector197419791985
Prioritization IndexRankPrioritization IndexRankPrioritization IndexRank
Agriculture, Fishery and Forestry0.114720.117720.11082
Mining and Quarrying0.0522110.0549100.066710
Manufacturing 0.194910.209710.19211
Construction0.063480.088550.07707
Electricity, Gas and Water0.109640.079180.07736
Transportation, Communication and Storage0.069670.081470.08495
Trade0.092350.094530.09913
Finance0.112230.090240.07058
Real Estate and Ownership of Dwellings0.059790.057890.06919
Private Services0.0584100.082860.08604
Government Services0.073060.0434110.066511
Table 6. Sector prioritization indices for 1988.
SectorPrioritization IndexRank
Agriculture, Fishery and Forestry0.10522
Mining and Quarrying0.07787
Manufacturing0.20641
Construction0.07996
Electricity, Gas and Water0.07089
Transportation, Communication and Storage0.08903
Trade0.08764
Finance0.07168
Real Estate and Ownership of Dwellings0.059611
Private Services0.08555
Government Services0.066610
Table 7. Sector prioritization indices for 1994.
SectorPrioritization IndexRank
Agriculture, Fishery and Forestry0.10582
Mining and Quarrying0.056411
Manufacturing0.24011
Construction0.07436
Electricity, Gas and Water0.06737
Transportation, Communication and Storage0.08125
Trade0.09983
Finance0.06409
Real Estate and Ownership of Dwellings0.056910
Private Services0.08874
Government Services0.06548
Table 8. Sector prioritization indices for 2000 and 2006.
Sector20002006
Prioritization IndexRankPrioritization IndexRank
Agriculture, Fishery and Forestry0.081940.08983
Mining and Quarrying0.0431110.054711
Manufacturing0.301110.25541
Construction0.067960.06849
Electricity, Gas and Water0.064780.06968
Transportation, Communication and Storage0.079150.08124
Trade0.089420.09922
Finance0.064690.07057
Real Estate and Ownership of Dwellings0.0538100.07706
Private Services0.088630.07855
Government Services0.065970.055910
Table 9. Sector prioritization indices for 2012.
SectorPrioritization IndexRank
Agriculture, Fishery and Forestry0.08396
Mining and Quarrying0.056411
Manufacturing0.18601
Construction0.08177
Electricity, Gas and Water0.07508
Transportation, Communication and Storage0.08504
Trade0.10843
Finance0.08405
Real Estate and Ownership of Dwellings0.060610
Private Services0.11402
Government Services0.06499

