Article

Detrended Correlation Coefficients Between Exchange Rate (in Dollars) and Stock Markets in the World’s Largest Economies

by
Paulo Ferreira
1,2,3,*,
Marcus Fernandes da Silva
4 and
Idaraí Santos de Santana
5
1
VALORIZA—Research Center for Endogenous Resource Valorization, 7300-110 Portalegre, Portugal
2
Instituto Politécnico de Portalegre, 7300-110 Portalegre, Portugal
3
CEFAGE-UE, IIFA, Universidade de Évora, Largo dos Colegiais 2, 7000 Évora, Portugal
4
Instituto Federal da Bahia, R. Emídio dos Santos, s/n—Barbalho, Salvador—BA 40301-015, Brazil
5
Secretaria de Educação do Estado da Bahia, 3a Avenida Centro Administrativo da Bahia, 550—5a—Centro Administrativo da Bahia, Salvador—BA 41745-004, Brazil
*
Author to whom correspondence should be addressed.
Economies 2019, 7(1), 9; https://doi.org/10.3390/economies7010009
Submission received: 20 September 2018 / Revised: 27 December 2018 / Accepted: 9 January 2019 / Published: 1 February 2019
(This article belongs to the Special Issue Impact of Macroeconomic Indicators on Stock Market)

Abstract

:
The purpose of this paper is to verify the long-range correlation between the stock markets of the largest economies in the world and the respective exchange rate with the USD. According to theory, a negative correlation is expected, meaning that an increase in the return of one of the assets will cause a decrease in the return of the other. Using detrended cross-correlation and detrended moving average cross-correlation analyses and the respective correlation coefficients, we analysed this possibility, analysing behaviour according to different time scales. Our main results showed that in European markets, the exchange rate does not have a significant effect. This significant effect just occurs in the case of the Indian stock market, while in the case of the Japanese one, the relationship is positive. Japanese authorities’ monetary policy could be the reason for this different result.

1. Introduction

According to theory, a negative correlation could be expected between exchange rates and stock markets, since these are substitute assets, i.e., if one of them is valorised, investors will be expected to change their positions to that one.
In this paper, we want to analyse the exchange rate of the US dollar (USD), as one of the main world currencies, against the stock markets of the other 6 countries of the G7 group (considering the GDP level). We want to evaluate if investors see the USD as a safe investment, when compared with the stock markets of other major economies. Moreover, at times of international crisis, which affect international stock markets (an example being the subprime crisis in 2008), investors would be willing to sell their positions in that particular market, acquiring other assets which they consider less risky. Thus, we can also evaluate if the USD is seen by investors as a less risky option.
In order to attain our objectives, we used the detrended cross-correlation coefficient proposed by Zebende (2011) and the detrended moving average cross-correlation proposed by Kristoufek (2014a). The results allowed us to understand the influence of the North American currency on the global economy.
Study of the relationship between stock prices and exchange rates is not new. One of the first studies on this theme did not find a relevant relationship between markets (Frank and Young 1972), with later work producing similar results (see Bodnar and Gentry 1993 or Bartov and Bodnar 1994). However, most of the work we review in the next section shows contrary results.
Studies involving financial markets have increased sharply in recent years. Increased data availability as well as increased computational capacity have made this possible. At the same time, physicists’ increased interest in economic problems created a new research field called econophysics. This research field contains many studies on financial markets, but also relating exchange rates and stock markets. Studies such as those by Vandewalle and Ausloos (1998), Onnela et al. (2003, 2004), Di Matteo et al. (2003, 2005), Bonanno et al. (2004), Norouzzadeh and Rahmanic (2006), Mizuno et al. (2006), Naylor et al. (2007), Tumminello et al. (2007), Eom et al. (2009), Barunik and Kristoufek (2010), Kristoufek (2010a, 2010b, 2016), Keskin et al. (2011) or Nobi et al. (2014) are just some examples of this linkage. Using several methodologies, countries, and time samples, these studies generally point to the existence of a relationship between these two specific markets. Our work could be included in this research field, related to the methodologies used to evaluate the relationship between exchange rates and stock markets. Not only do we use a longer sample, but we also apply two methodologies, which could give new insights to the literature. Firstly, both methodologies are based on a detrended approach, which eliminates possible trends which could affect the behaviour of the series. Secondly, they allow to study the behaviour of the correlations in different time scales, distinguishing between short- and long-run correlations. These features combine to present a different way of studying the correlation between exchange rates and stock markets.
Our main results indicated that, except in the case of the Japanese currency, the others do not show significant correlations or even have negative results (in the case of the Indian currency). This information could be interesting for investors in the forex markets. For example, considering the currencies with no correlation or the Indian one with a negative correlation, they could be used for hedging/diversification purposes, because they do not move in the same way as the stock markets. In the case of the Japanese market, investors should be careful if the objectives are those referred to in the previous statement. This information could also be used by regulators, for example, in order to confirm if the use of monetary policies is having the desired results.
The remainder of this study is structured as follows: Section 2 reviews the literature on the topic; in Section 3, we briefly describe the methodology and data used; Section 4 shows the results and Section 5 concludes.

2. Literature Review

As previously mentioned, one of the first studies analysing the relationship between exchange rates and stock markets was that of Frank and Young (1972), finding no relevant relationship between the variables. In the 1980s, some studies searched for a possible relationship between these assets and tried to find its direction. For example, Dornbusch and Fischer (1980) showed that some causality occurs from exchange rates to stock markets, while Branson (1983) and Frankel (1983) suggested the opposite result. However, it is common to find works relating them, without aiming to determine the direction of causality, which is also our intention in this paper.
The possible relationship between stock prices and exchange rates has received considerable attention. Studying the relationship in the US market, Aggarwal (1981) found a significant and positive correlation between stock prices and the US exchange rate, confirmed, for example, by Giovannini and Jorion (1987). However, Soenen and Hennigar (1988) concluded that the result depends on the sample chosen. Bahmani-Oskooee and Sohrabian (1992), using cointegration techniques, found the variables were not related in the long run (although, in the short run, some relations exist). Najand and Seifert (1992), employing a GARCH (Generalized Autoregressive Conditional Heteroskedasticity) framework for daily data from the US, Canada, the UK, Germany, and Japan, showed that absolute differences in stock returns have positive effects on exchange rate volatility.
Ajayi and Mougoue (1996) took daily data from 1985 to 1991 for eight economically advanced countries, used an error correction model and causality test, and discovered that an increase in aggregate domestic stock price has a negative short-run effect and a positive long-run effect on domestic currency value. Abdalla and Murinde (1997) used data from 1985 to 1994, giving results for India, Korea, and Pakistan that suggested exchange rates Granger-cause stock prices. In the case of the Philippines, stock prices had an effect on exchange rates. Qiao (1997) used data from Asian markets and found a significant relationship between the variables.
Ajayi et al. (1998) investigated the causal relations for seven advanced markets from 1985 to 1991 and eight emerging Asian markets from 1987 to 1991 and supported unidirectional causality in all the advanced economies but no consistent causal relations in the emerging ones. They explained the different results by the differences in the structure and characteristics of financial markets between these groups. Morley and Pentecost (2000) conducted a study of G-7 countries, concluding that the reason for the lack of 7 strong relationships between exchange rates and stock prices may be due to the exchange controls that were in effect in the 1980s. Similarly, Nieh and Lee (2001) examined the relationship between stock prices and exchange rates for the G-7 countries for the period from 1 October 1993 to 15 February 1999. They claimed no long-run equilibrium relationship for all G-7 countries. While a one-day, short-run, significant relationship has been found in certain G-7 countries, there is no significant correlation in the United States. These results might be explained by each country’s differences in economic development, government policy or expectation pattern.
Kim (2003) showed that S&P’s common stock price is negatively related to the exchange rate. Contemporarily, Smyth and Nandha (2003) studied the relationship for Pakistan, India, Bangladesh, and Sri Lanka over the period 1995–2001 and proved no long-run relationship between variables. Unidirectional causality was seen running from exchange rates to stock prices for only India and Sri Lanka. Ibrahim and Aziz (2003) analysed dynamic linkages between the variables for Malaysia, using monthly data for the period 1977–1998, their results showing that the exchange rate is negatively associated with stock prices. Phylaktis and Ravazzolo (2005) used US stock prices but related this to five Pacific exchange rates and found a lack of relationship between the variables.
Gordon and Gupta (2003) and Babu and Prabheesh (2008) claimed bidirectional causality, stating that foreign investors are able to play the market given their volume of investments. Additionally, Griffin et al. (2004) stated that foreign flows are significant predictors of returns in Thailand, India, Korea, and Taiwan, while Doong et al. (2005) showed that these financial variables are not co-integrated. Bidirectional causality could be detected in Indonesia, Korea, Malaysia, and Thailand and a significantly negative relation between stock returns and the contemporary change in exchange rates for all countries except Thailand.
Ozair (2006) and Vygodina (2006) worked with US data. Ozair (2006) proved no causal linkage and no co-integration between these two financial variables, while the latter claimed causality from large-cap stocks to exchange rates. Kurihara and Nezu (2006) took Japanese stock prices, US stock prices, exchange rates and the Japanese interest rate (period March 2001–September 2005) and showed that exchange rates and US stock prices affected Japanese stock prices.
Pan et al. (2007) used data from seven East Asian countries over the period from 1988 to 1998, proving a bidirectional causal relation for Hong Kong before the 1997 Asian crisis and a unidirectional causal relation from exchange rates to stock prices for Japan, Malaysia, and Thailand and from stock prices to exchange rates for Korea and Singapore. During the Asian crisei, only a causal relation from exchange rates to stock prices was seen for all countries except Malaysia.
Okuyan and Erbaykal (2008) studied 13 developing economies, using different periods of time, and indicated causality relations for eight economies—unidirectional from stock price to exchange rates in five of them and bidirectional for the remaining three. No causality was detected in Turkey; the reason for the difference may be the period used. The work by Ülkü and Demirci (2012) used several emerging markets’ exchange rates, also finding a relationship between the markets.
Specifically, for the crisis period between 2007 and 2010, Caporale et al. (2014) analysed stock market prices and exchange rates in the US, the UK, Canada, Japan, the Eurozone, and Switzerland, revealing some relationships in all markets. The most interesting finding in this study was the fact that dependence among markets increased during the crisis, meaning less diversified opportunities for investors.
To summarize, even though the theoretical explanation is simple, empirical results have always been mixed and the existing literature is inconclusive regarding the relationship between exchange rates and stock markets. The use of different methodologies and time samples could explain these results. This paper attempts to investigate the relationship between the two variables, relating stock markets with the USD, due to its importance. As reported in the introduction, we used a longer sample and added to the existent literature an approach using two different detrended methodologies which allowed us to differentiate between different time scales.

3. Methodology and Data
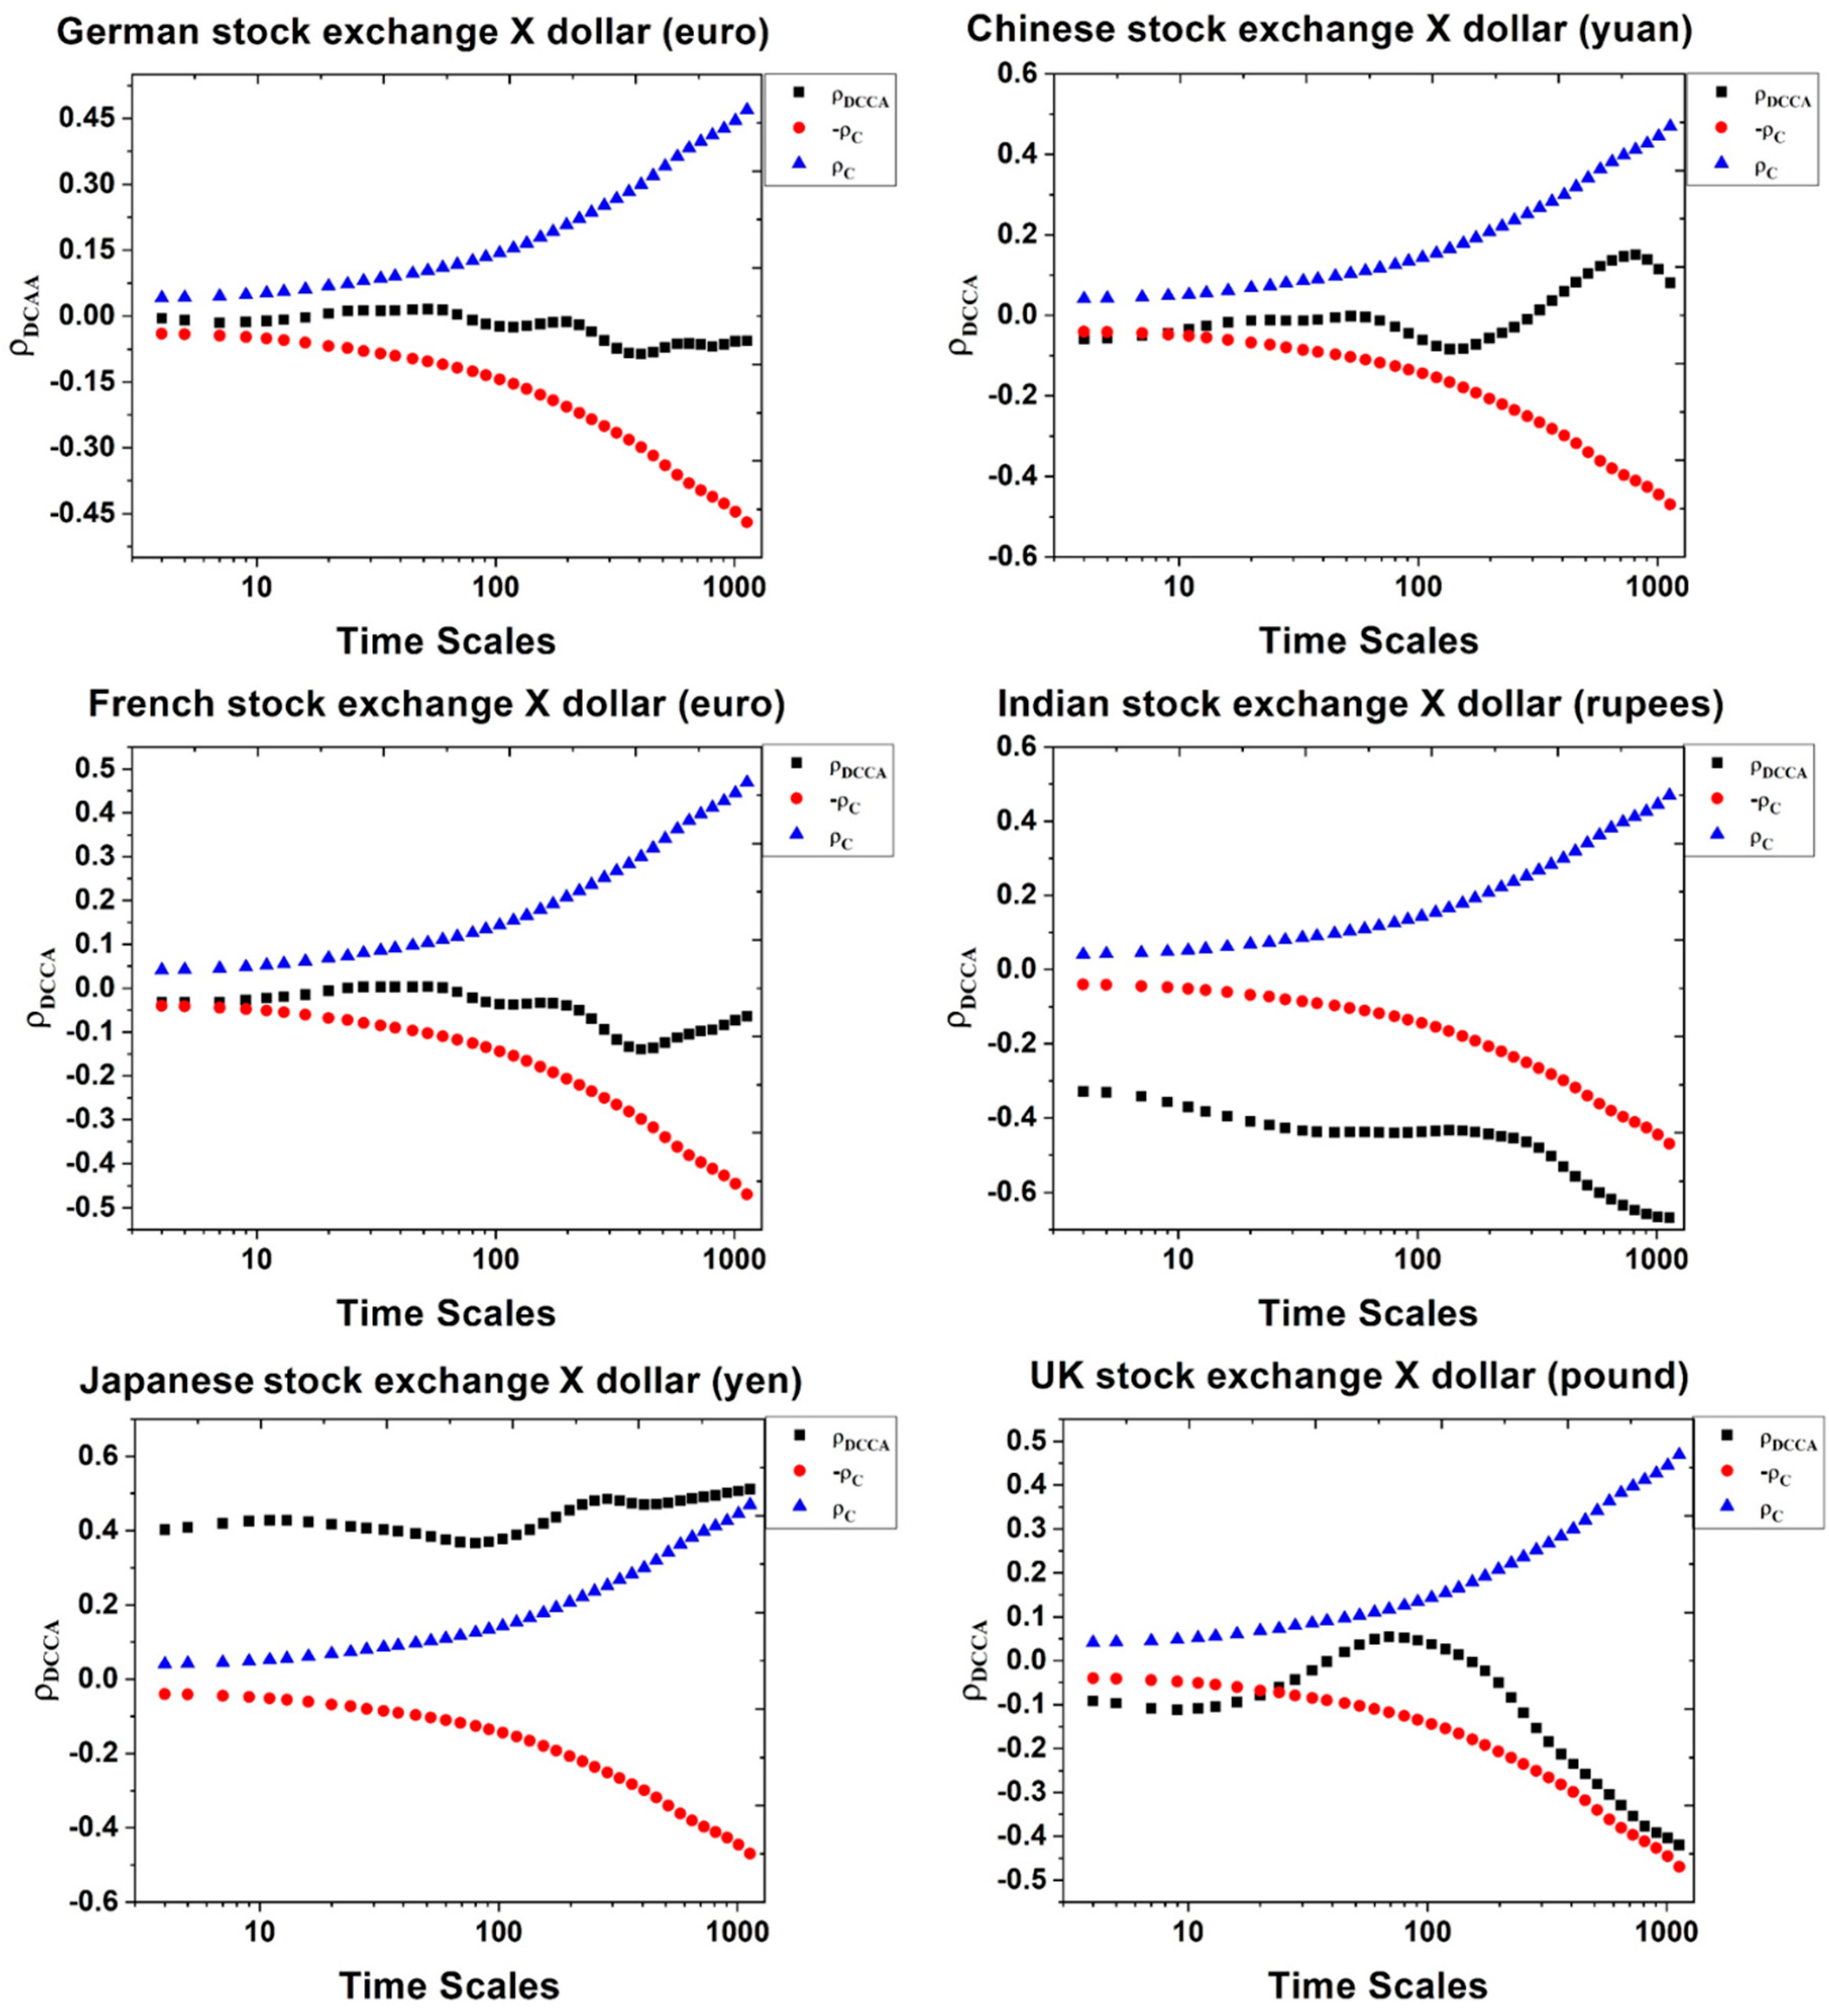
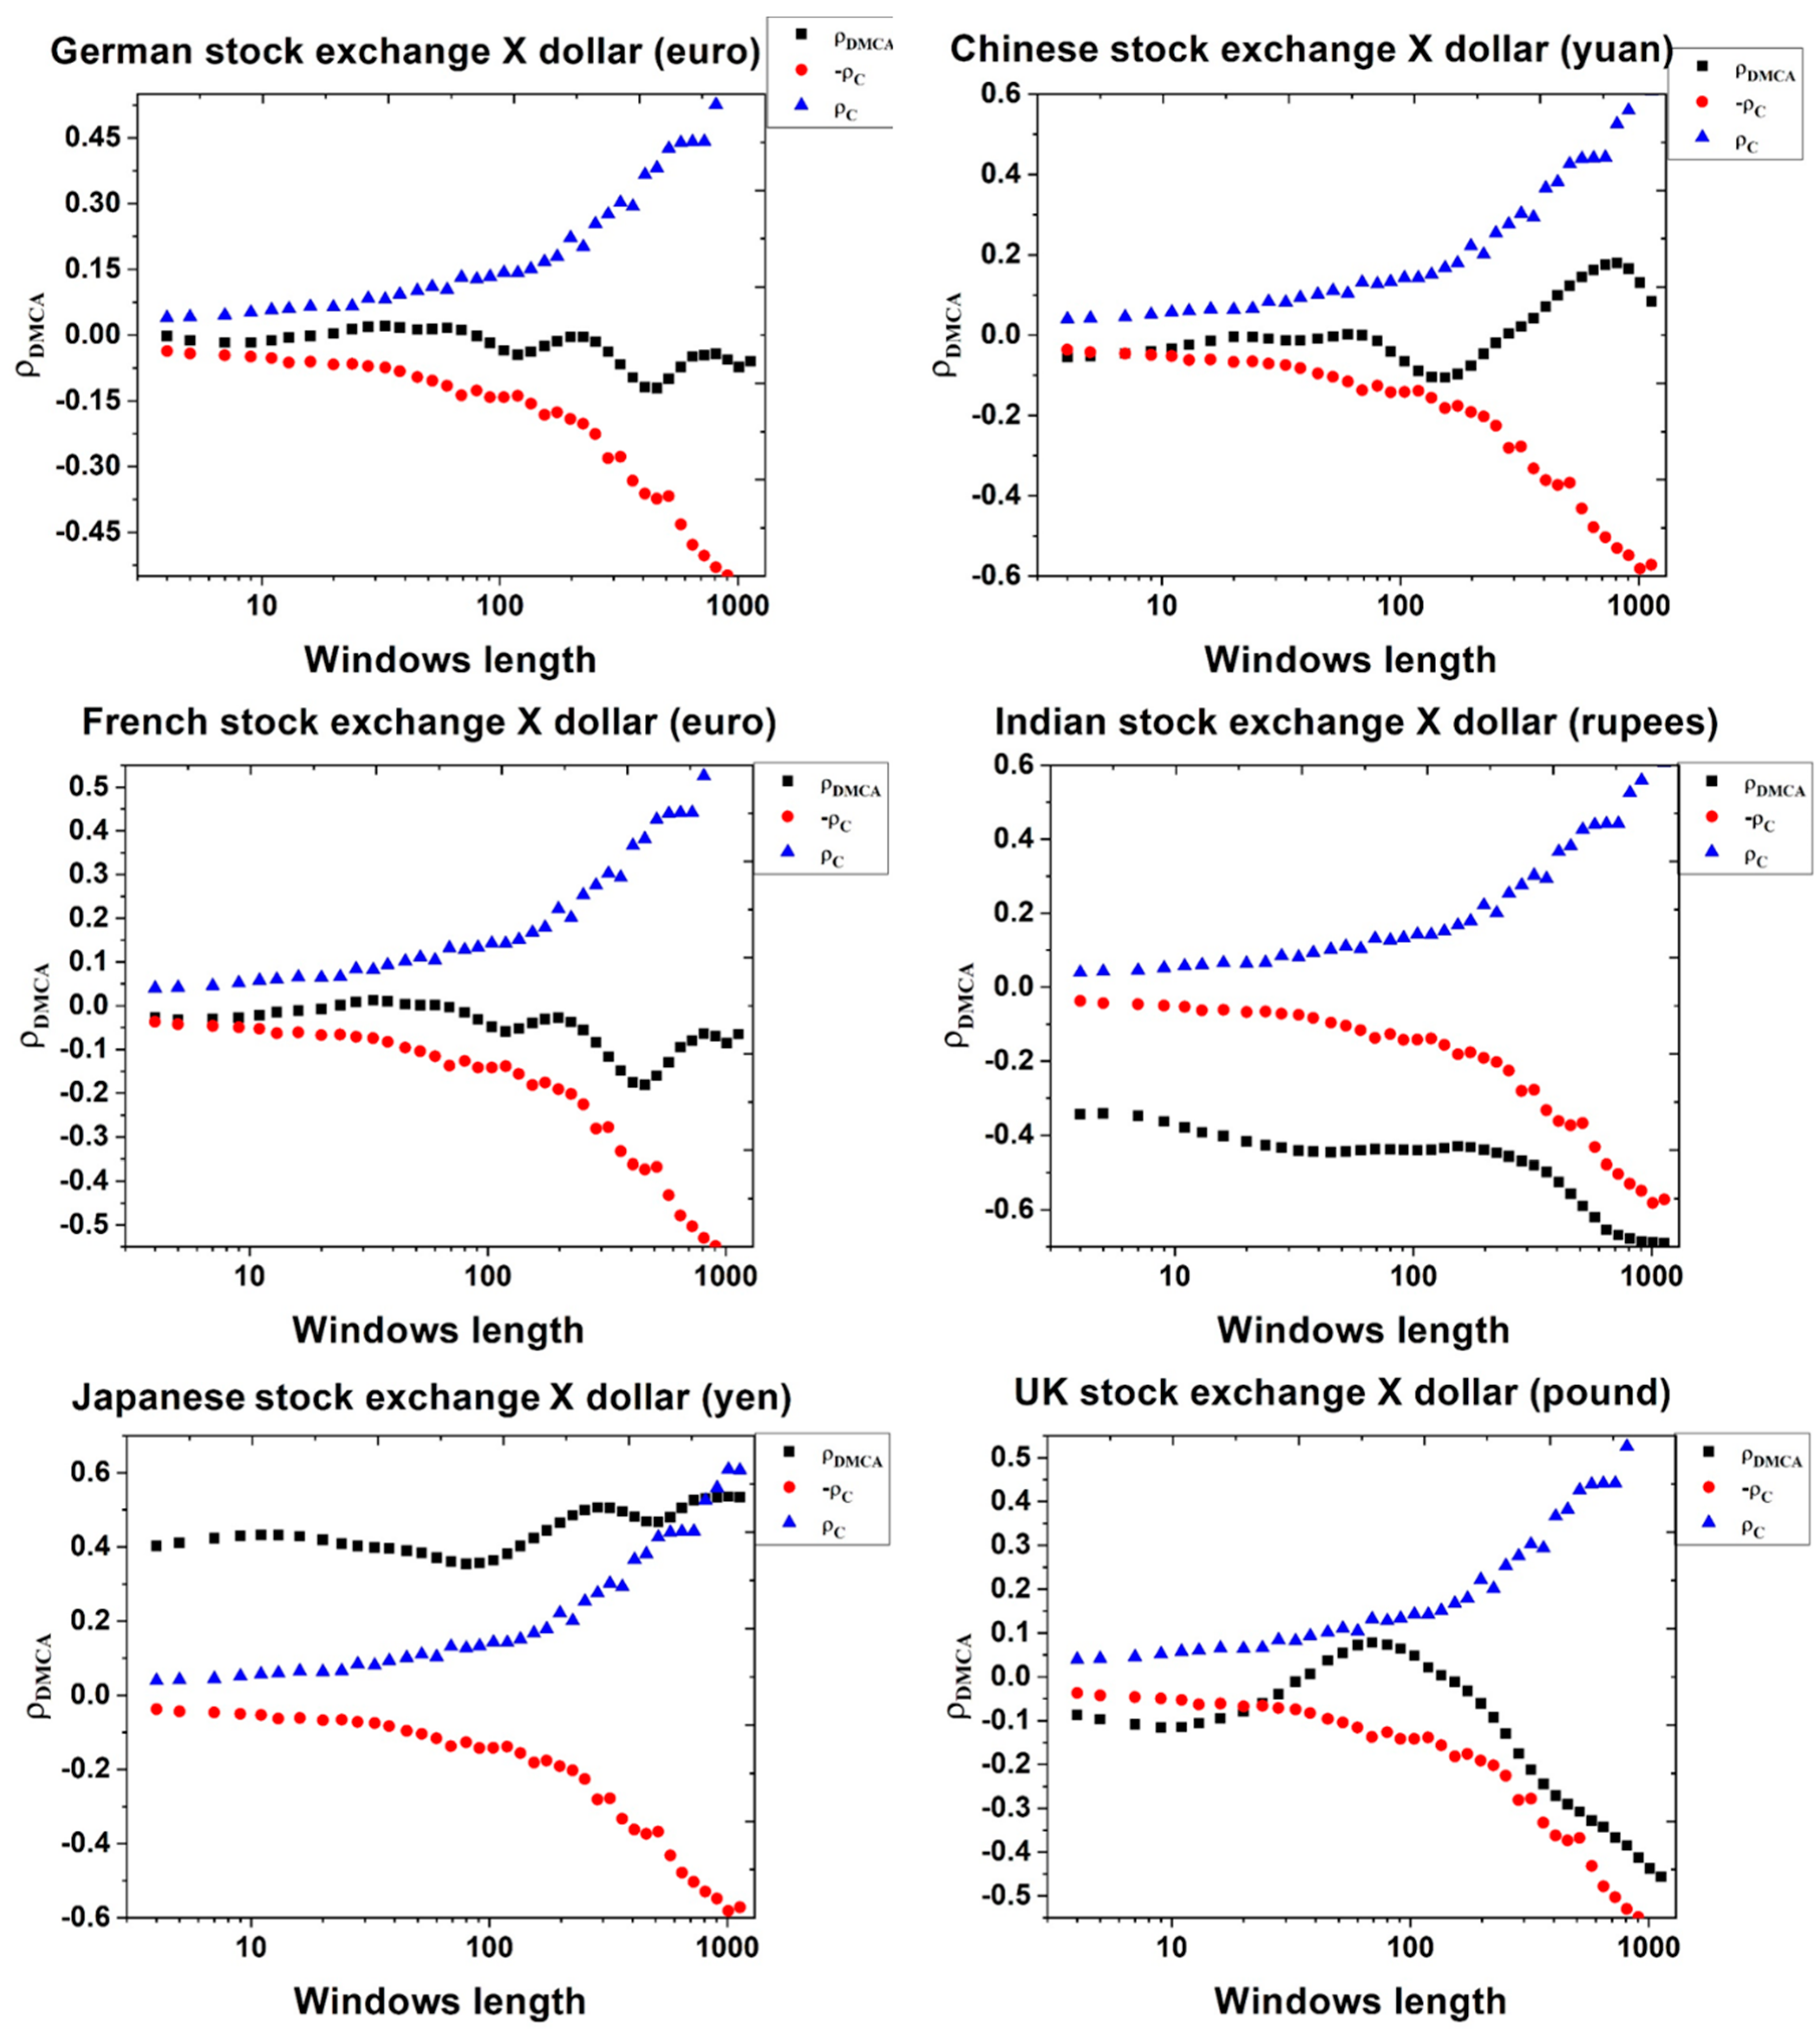
We used two different methodologies in this paper: Detrended cross-correlation analysis (DCCA) and detrended moving average cross-correlation (DMCA) as well as the respective correlation coefficients. These are general correlation coefficients and can be used for both linear and nonlinear purposes, also giving information for different time scales. Another advantage of DCCA and DMCA is the possibility of also using them also with nonstationary data, although they could be freely used with stationary data.
The original DCCA was proposed by Podobnik and Stanley (2008), with the following steps: (i) Considering time series x k and y k with k = 1, 2, …, t equidistant observations (in our case, daily data), we calculated x ( t ) = k = 1 t x k and y ( t ) = k = 1 t y k ; (ii) samples were divided in equal length boxes of dimension n and divided in N–n overlapping boxes, with the objective of calculating x ˜ k and y ˜ k , which are the local trends, calculated from the ordinary least squares. The size of the boxes ranges from 4 to N/4 and the local trends are linear, according to the original approach; (iii) from the difference between the original series and the previously calculated trend, we obtained the detrended time series used to calculate the covariance of the residuals in each box, given by f D C C A 2 = 1 n 1 k = 1 i + n ( x k x ˜ k ) ( y k y ˜ k ) ; (iv) sum the covariance for all boxes of size n, obtaining the detrended covariance given by F D C C A 2 ( n ) = 1 N n i = 1 N n f D C C A 2 ; (v) repeat the procedure for all length boxes, to identify the relationship between DCCA fluctuations as a function of n, F D C C A ( n ) , which could be represented by the power law F D C C A ( n ) n λ . The estimated λ is the parameter of interest of the DCCA and equals 0.5 when two time series are random cross-correlated, is greater than 0.5 when they have a persistent long-range cross-correlation, and lower than 0.5 when series have an antipersistent cross-correlation.
Based on the DCCA and the detrended fluctuation analysis (DFA—see Peng et al. 1994), Zebende (2011) created a correlation coefficient able to measure the magnitude of the long-range cross-correlation, which is given by ρ D C C A = F D C C A 2 F D F A { x } F D F A { y } , where DFA{x} and DFA{y} measure the long-range dependence of each individual time series. The correlation coefficient proposed by Zebende (2011) is an efficient coefficient (Kristoufek 2014b) with the desired properties of 〖 1 ρ D C C A 1 , being null when variables are noncorrelated, while a positive (negative) correlation means that the compared time series show evidence of persistent (antipersistent) correlation. According to Podobnik et al. (2011), the significance of that coefficient can be tested, a procedure that we used in this paper.
On the other hand, DMCA was created by Kristoufek (2014a), based on the detrended moving average (DMA) method proposed by Vandewalle and Ausloos (1998). It considers the same integrated series, and defines the fluctuation functions given by F D M A { x i } 2 = 1 T δ + 1 k = [ δ θ ( δ 1 ) ] [ T θ ( δ 1 ) ] ( x k x ˜ k , δ ) 2 and F D M A { y i } 2 = 1 T δ + 1 k = [ δ θ ( δ 1 ) ] [ T θ ( δ 1 ) ] ( y k y ˜ k , δ ) 2 , where δ is the moving average window length and θ the type of moving average (forward if θ = 0, centred if θ = 0.5, and backward if θ = 1). x ˜ k , δ and y ˜ k , δ are the moving averages of a window size δ. We used the centred moving average because it shows better results (Kristoufek 2014a). Based on the DMA, He and Chen (2011) proposed the extension for the DMCA, with a bivariate fluctuation given by F D M C A 2 = 1 T δ + 1 k = [ δ θ ( δ 1 ) ] [ T θ ( δ 1 ) ] ( x k x ˜ k , δ ) ( y k y ˜ k , δ ) and, from this, Kristoufek (2014a) created the DMCA correlation coefficient, similar to the DCCA and given by ρ D M C A ( δ ) = F D M C A 2 ( δ ) F D M A { x i } ( δ ) F D M A { x i } ( δ ) . This correlation coefficient also shows the desirable property of being compounded between −1 and 1. According to Kristoufek (2014b), despite the differences between these methods, they could be used complementarily.
Our data were retrieved from Datastream, from January 1999 until January 2018, and correspond to the daily price of the dollar in the world’s other 6 largest economies, as well as the respective main stock market indices. We calculated the usual log-returns, given by r t = ln ( P i t ) ln ( P i t 1 ) , where Pit is the value of the time series i in moment t. Each time series has a total of 4973 observations. See Supplementary Materials for data availability.

4. Results

We started our analysis by calculating the descriptive statistics for the return rates, for the period from January 1999 until January 2018, splitting them for the stock markets (Table 1) and exchange rates (Table 2). Note that in Table 2 we just have five currencies, because Germany and France share the Euro. The tables present the mean, minimum, and maximum levels and the standard deviation of the return rates, as well as skewness and kurtosis levels and the number of observations.
Regarding the stock markets, the indices showed a slight increase over the period analysed. Note that in that period, the economies studied suffered a crisis with their respective recovery. Two other interesting features are the predominance of negative skewness levels for most of the indices and exchange rates, which means more negative returns than positive ones, and the high kurtosis levels, a very well-known feature in the financial literature: The existence of fat tails (see, for example, Cont 2001). This shows that return rates do not follow normal distribution.
Regarding exchange rates, the mean values are very near to 0. This means that, over the period of analysis, the relationship of the exchange rates in respect to the USD is mean reverting. The Euro behaved consistently with normal distribution, while the remaining exchanges also showed leptokurtic distributions. Regarding skewness levels, the results were mixed.
We went on to calculate the DCCA and DMCA correlation coefficients between the USD exchange rate and the stock markets studied, as well as calculating the critical values, essential to test the existence of significant correlations between the variables or otherwise. The DCCA and DMCA correlation coefficients are shown in Figure 1 and Figure 2, respectively. The estimated critical values allowed us to identify if the correlation coefficients were significantly equal to, or different from zero (if the correlation coefficients are outside the bounds, a given coefficient is significantly different from zero). All figures consider critical values at a 99% level.
Results were qualitatively similar, independently of using DCCA or DMCA. When analysing the results, we found that the USD has no statistically significant correlation with the stock markets of Germany, China, France, and the UK. This means that the referred assets are seen by investors as separated (in financial language, those are segmented assets). The fact that the European currencies studied (pound sterling and the Euro) are also very strong currencies could be an explanation, currencies which could be seen as an alternative to the USD. Previous results contradict the theoretical expectation of a negative correlation. However, these are all mature markets, with high transaction volumes, which could explain these results. The same evidence of absence of correlation occurs between the USD and the Chinese stock market. In addition to the increased importance of the Chinese market, the control of the currency of this country in relation to the US exchange rates could explain the results.
In the case of India, a negative and significant correlation was found, i.e., when one of the markets appreciated (the rupee market or the Indian stock market), the other market decreased in value. As previously identified, this is the theoretically expected relationship between those variables, because they can be seen as substitute assets. If in the previous cases, the correlation is not verified, the fact that the Indian market is less developed could probably lead investors to consider it differently.
Finally, the Japanese currency showed a positive correlation with its stock market. i.e., when the USD appreciated (relative to the Japanese yen), the Japanese stock market also increased its value. This is a very interesting result as Japan lives with a continuous economic condition known in Macroeconomics as the “liquidity trap”. Described originally by Keynes (1936), it identifies a situation characterized by low nominal interest rates but a high balance sheet of central banks, making it impossible for monetary policies to promote economic growth. Thus, the constant increase of money supplied to the Japanese economy should have a direct effect on the exchange rate, which could be reflected in an effect of an equal sign in the Japanese stock market.
Another possible explanation is the existence of home bias, i.e., most investments made by national investors are in local assets, which avoids the full exploitation of investment benefits.

5. Concluding Remarks

This work aimed to analyse if the United States currency could be considered a safer investment when compared to the risk of investment in the stock exchange indices of the other 6 largest economies. In order to do so, we evaluated the cross-correlation between the stock exchange indices of these economies and their respective currencies converted into United States dollars, based on two different methodologies.
The use of both methodologies revealed that this hypothesis was not sustained in most of the countries considered, namely European ones. The fact that those countries’ currencies are also strong could lead to that result. For example, in the case of the Indian economy, the correlation was as expected. Finally, the results for Japan showed a positive correlation between the exchange rate and the respective market, with that country’s monetary policy being a possible explanation. Another conclusion is the fact that, except for the UK (but even in this case, to a limited extent), there is no significant difference of the behaviour of the correlations, depending on the time scales used.
Based on the results, this study can be useful in the sense of being another alternative in allocating investments in the stock exchanges of the world’s major economies. It could be used not only to understand the behaviour of these important economic variables, but this information could also help in the construction of portfolios.
Note that in this paper, we used a bivariate methodology to assess the correlation between stock markets and exchange rates. As referred to previously, the main objective of this study was to identify the relationship between those two financial markets, using alternative methodologies when compared to previous studies. Although the use of a detrended and multiscale correlation could be seen as an advantage, it remains as a limitation due to still being a bivariate correlation. We are aware of this fact and our conclusions should be made cautiously and limited to the possibility of comparing the risk of stock and exchange markets. Further work could consider the use of multivariate models, allowing the use of other possible variables, which could overcome this limitation, including the extension of the DCCA proposed by Zebende and Filho (2018).

Supplementary Materials

Both data and the code used for the estimations are available online at https://www.mdpi.com/2227-7099/7/1/9/s1.

Author Contributions

Conceptualization, P.F., M.S. and I.S.; methodology, P.F., M.S. and I.S.; formal analysis, P.F., M.S. and I.S.; investigation, P.F., M.S. and I.S.; data curation, P.F., M.S. and I.S. writing—original draft preparation, P.F., M.S. and I.S.; writing—review and editing, P.F., M.S. and I.S.; visualization, P.F., M.S. and I.S.; supervision, P.F., M.S. and I.S.; funding acquisition, P.F., M.S. and I.S.

Funding

Paulo Ferreira is pleased to acknowledge financial support from Fundação para a Ciência e a Tecnologia (grant UID/ECO/04007/2013) and FEDER/COMPETE (POCI-01-0145-FEDER-007659). Marcus Fernandes da Silva and Idaraí Santos de Santana acknowledge the financial support from Fundação de Amparo e Pesquisa do Estado da Bahia—FAPESB (grant Nº BOL 0261/2017).

Conflicts of Interest

The authors declare no conflict of interest.

References

  1. Abdalla, Issam, and Victor Murinde. 1997. Exchange rate and stock price interactions in emerging financial markets: Evidence on India, Korea, Pakistan and the Philippines. Applied Financial Economics 7: 25–35. [Google Scholar] [CrossRef]
  2. Aggarwal, Raj. 1981. Exchange Rates and Stock Prices: A Study of the US Capital Markets under Floating Exchange Rates. Akron Business and Economic Review 12: 7–12. [Google Scholar]
  3. Ajayi, Richard, and Mbodja Mougoue. 1996. On the Dynamic Relation between Stock Prices and Exchange Rates. Journal of Financial Research 19: 193–207. [Google Scholar] [CrossRef]
  4. Ajayi, Richars, Joseph Friedman, and Seyed Mehdian. 1998. On the relationship between stock returns and exchange rates: Tests of granger causality. Global Finance Journal 9: 241–51. [Google Scholar] [CrossRef]
  5. Babu, M. Suresh, and K. P. Prabheesh. 2008. Causal relationships between Foreign Institutional Investments and stock returns in India. International Journal of Trade and Global Markets 1: 259–65. [Google Scholar] [CrossRef]
  6. Bahmani-Oskooee, Mohsen, and Ahmad Sohrabian. 1992. Stock Prices and the Effective Exchange of the Dollar. Applied Economics 24: 459–64. [Google Scholar] [CrossRef]
  7. Bartov, Eli, and Gordon Bodnar. 1994. Firm Valuation, Earnings Expectations, and the Exchange-rate Exposure Effect. Journal of Finance 49: 1755–85. [Google Scholar] [CrossRef]
  8. Barunik, Jozef, and Ladislav Kristoufek. 2010. On Hurst exponent estimation under heavy-tailed distributions. Physica A: Statistical Mechanics and its Applications 389: 3844–55. [Google Scholar] [CrossRef]
  9. Bodnar, Gordon, and William Gentry. 1993. Exchange rate Exposure and Industry Characteristics: Evidence from Canada, Japan, and the USA. Journal of International Money and Finance 12: 29–45. [Google Scholar] [CrossRef]
  10. Bonanno, Giovanni, Guido Caldarelli, Fabrizio Lillo, Salvatore Micciche, Nicolas Vandewalle, and Rosario Mantegna. 2004. Networks of Equities in Financial Markets. European Physical Journal B 38: 363–71. [Google Scholar] [CrossRef]
  11. Branson, William. 1983. Macroeconomic Determinants of Real Exchange Rates. In Managing Foreign Exchange Rate Risk. Edited by R. J. Herring. Cambridge: Cambridge University Press, pp. 33–74. [Google Scholar]
  12. Caporale, Giuglielmo, John Hunter, and Faek Ali. 2014. On the Linkages Between Stock Prices and Exchange Rates: Evidence from the Banking Crisis of 2007–2010. International Review of Financial Analysis 33: 87–103. [Google Scholar] [CrossRef]
  13. Cont, Rama. 2001. Empirical properties of asset returns: stylized facts and statistical issues. Quantitative Finance 1: 223–36. [Google Scholar] [CrossRef]
  14. Di Matteo, Tiziana, Tomaso Aste, and Michel Dacorogna. 2003. Scaling Behaviors in Differently Developed Markets. Physica A: Statistical Mechanics and its Applications 324: 183–88. [Google Scholar] [CrossRef]
  15. Di Matteo, Tiziana, Tomaso Aste, and Michel Dacorogna. 2005. Long-term memories of developed and emerging markets: Using the scaling analysis to characterize their stage of development. Journal Banking & Finance 29: 827–51. [Google Scholar]
  16. Doong, Shuh-Chyi, Sheng-Yung Yang, and Alan Wang. 2005. The Dynamic Relationship and Pricing of Stocks and Exchange Rates: Empirical Evidence from Asian Emerging Markets. Journal of American Academy of Business 7: 118–23. [Google Scholar]
  17. Dornbusch, Rudiger, and Stanley Fischer. 1980. Exchange rates and the current account. The American Economic Review 70: 960–71. [Google Scholar]
  18. Eom, Cheoljun, Gabjin Oh, Woo-Sung Jung, Hawoong Jeong, and Seunghwan Kim. 2009. Topological properties of stock networks based on minimal spanning tree and random matrix theory in financial time series. Physica A: Statistical Mechanics and Its Applications 388: 900–6. [Google Scholar] [CrossRef]
  19. Frank, Peter, and Allan Young. 1972. Stock Price reaction of Multinational Firms to Exchange Realignments. Financial Management 1: 66–73. [Google Scholar] [CrossRef]
  20. Frankel, Jeffrey. 1983. Monetary and Portfolio Balance Models of Exchange Rate Determination. In Economic Interdependence and Flexible Exchange Rates. Edited by J. Bhandari and B. Putnam. Cambridge: MIT Press, pp. 84–115. [Google Scholar]
  21. Giovannini, Alberto, and Philippe Jorion. 1987. Interest Rates and Risk Premia in the Stock Market and in the Foreign Exchange Market. Journal of International Money and Finance 6: 107–24. [Google Scholar] [CrossRef]
  22. Gordon, James, and Poonam Gupta. 2003. Portfolio Flows into India: Do Domestic Fundamentals Matter? Washington, DC: International Monetary Fund. [Google Scholar]
  23. Griffin, John, René Stulz, and Federico Nardari. 2004. Are Daily Cross-Border Equity Flows Pushed or Pulled? Review of Economics and Statistics 86: 641–57. [Google Scholar] [CrossRef]
  24. He, Ling-Yun, and Shu-Peng Chen. 2011. A new approach to quantify power-law cross-correlation and its application to commodity markets. Physica A: Statistical Mechanics and its Applications 390: 3806–14. [Google Scholar] [CrossRef]
  25. Ibrahim, Mansor, and Hassanuddeen Aziz. 2003. Macroeconomic Variables and the Malaysian Equity market: A Rolling through Subsamples. Journal of Economic Studies 30: 6–27. [Google Scholar] [CrossRef]
  26. Keskin, Mustafa, Bayram Deviren, and Yusuf Kocakaplan. 2011. Topology of the correlation networks among major currencies using hierarchical structure methods. Physica A: Statistical Mechanics and its Applications 390: 719–30. [Google Scholar] [CrossRef]
  27. Keynes, John. 1936. The General Theory of Employment, Interest and Money. London: Macmillan. [Google Scholar]
  28. Kim, Ki-ho. 2003. Dollar exchange rate and stock price: Evidence from multivariate cointegration and error correction model. Review of Financial Economics 12: 301–13. [Google Scholar] [CrossRef]
  29. Kristoufek, Ladislav. 2010a. On Spurious Anti-Persistence in the US Stock Indices. Chaos Solitons Fractals 43: 68–78. [Google Scholar] [CrossRef]
  30. Kristoufek, Ladislav. 2010b. Long-range dependence in returns and volatility of Central European Stock Indices. Bulletin of the Czech Econometric Society 17: 50–67. [Google Scholar]
  31. Kristoufek, Ladislav. 2014a. Detrending moving-average cross-correlation coefficient: Measuring cross-correlations between non-stationary series. Physica A 406: 169–75. [Google Scholar] [CrossRef]
  32. Kristoufek, Ladislav. 2014b. Measuring correlations between non-stationary series with DCCA coefficient. Physica A: Statistical Mechanics and its Applications 402: 291–98. [Google Scholar] [CrossRef]
  33. Kristoufek, Ladislav. 2016. Scaling of Dependence between Foreign Exchange Rates and Stock Markets in Central Europe. Acta Physica Polonica A 129: 908–12. [Google Scholar] [CrossRef]
  34. Kurihara, Yutaka, and Eiji Nezu. 2006. Recent stock price relationships between Japanese and US stock markets. Studies in Economics and Finance 23: 211–26. [Google Scholar] [CrossRef]
  35. Mizuno, Takayuki, Hideki Takayasu, and Misako Takayasu. 2006. Correlation Networks Among Currencies. Physica A: Statistical Mechanics and its Applications 364: 336–42. [Google Scholar] [CrossRef]
  36. Morley, Bruce, and Eric Pentecost. 2000. Common trends and cycles in G-7 countries exchange rates and stock prices. Applied Economics Letters 7: 7–10. [Google Scholar] [CrossRef]
  37. Najand, Mohammad, and Bruce Seifert. 1992. Volatility of Exchange Rates, Interest Rates, and Stock Returns. Journal of Multinational Financial Management 2: 1–19. [Google Scholar]
  38. Naylor, Michael, Lawrence Rose, and Brendan Moyle. 2007. Topology of foreign exchange markets using hierarchical structure methods. Physica A: Statistical Mechanics and its Applications 382: 199–208. [Google Scholar] [CrossRef]
  39. Nieh, Chien-Chung, and Cheng-Few Lee. 2001. Dynamic relationship between stock prices and exchange rates for G-7 countries. The Quarterly Review of Economics and Finance 41: 477–90. [Google Scholar] [CrossRef]
  40. Nobi, Ashadun, Seong Maeng, Gyeong Ha, and Jae Lee. 2014. Effects of global financial crisis on network structure in a local stock market. Physica A: Statistical Mechanics and its Applications 407: 135–43. [Google Scholar] [CrossRef]
  41. Norouzzadeh, Payam, and Bahareh Rahmanic. 2006. A Multifractal Detrended Fluctuation Description of Iranian Rial–US Dollar Exchange Rate. Physica A: Statistical Mechanics and its Applications 367: 328–36. [Google Scholar] [CrossRef]
  42. Okuyan, Hasan, and Erman Erbaykal. 2008. The Relationship Between FDI and Economic Growth in Developing Countries. Economic Approach 19: 47–58. [Google Scholar] [CrossRef]
  43. Onnela, Jukka-Pekka, Anirban Chakraborti, Kimmo Kaski, Janos Kertesz, and A. Kanto. 2003. Dynamics of market correlations: Taxonomy and portfolio analysis. Physical Review E 68: 1–12. [Google Scholar] [CrossRef] [PubMed]
  44. Onnela, Jukka-Pekka, Kimmo Kaski, and Janos Kertesz. 2004. Clustering and information in correlation based financial networks. European Physical Journal B 38: 353–62. [Google Scholar] [CrossRef]
  45. Ozair, Amber 2006. Causality between Stock prices and Exchange Rates: A Case of The United States. Master of Science Thesis, Florida Atlantic University, Boca Raton, FL, USA.
  46. Pan, Ming-Shiun, Robert Fok, and Ya-Chiu Liu. 2007. Dynamic Linkages between exchange rates and stock prices: Evidence from East Asian markets. International Review of Economics and Finance 16: 503–20. [Google Scholar] [CrossRef]
  47. Peng, C.-K., Sergey Buldyrev, Shlomo Havlin, Michael Simons, Harry Eugene Stanley, and Ary Goldberger. 1994. Mosaic organization of DNA nucleotides. Physical Review E 49: 1685–89. [Google Scholar] [CrossRef]
  48. Phylaktis, Kate, and Fabiola Ravazzolo. 2005. Stock Prices and Exchange rate Dynamics. Journal of International Money and Finance 24: 1031–53. [Google Scholar] [CrossRef]
  49. Podobnik, Boris, and Harry Eugene Stanley. 2008. Detrended Cross-Correlation Analysis: A New Method for Analyzing Two Nonstationary Time Series. Physical Review Letters 100: 1–11. [Google Scholar] [CrossRef] [PubMed]
  50. Podobnik, Boris, Zhi-Qiang Jiang, Wei-Xing Zhou, and Harry Eugene Stanley. 2011. Statistical tests for power-law cross-correlated processes. Physical Review E 84: 1–8. [Google Scholar] [CrossRef] [PubMed]
  51. Qiao, Yu. 1997. Stock Prices and Exchange Rates: Experience in Leading East Asian Financial Centres: Tokyo, Hong Kong and Singapore. Singapore Economic Review 41: 47–56. [Google Scholar]
  52. Smyth, Russell, and Mohan Nandha. 2003. Bivariate causality between exchange rates and stock prices in South Asia. Applied Economics Letters 10: 699–704. [Google Scholar] [CrossRef]
  53. Soenen, Luc, and Elizabeth Hennigar. 1988. An analysis of exchange rates and stock prices—The U.S. experience between 1980 and 1986. Akron Business and Economic Review 19: 7–16. [Google Scholar]
  54. Tumminello, Michele, Tiziana Di Matteo, Tomaso Aste, and Rosario Mantegna. 2007. Correlation based networks of equity returns sampled at different time horizons. European Physical Journal B 55: 209–17. [Google Scholar] [CrossRef]
  55. Ülkü, Numan, and Ebru Demirci. 2012. Joint Dynamics of Foreign Exchange and Stock Markets in Emerging Europe. Journal of International Financial Markets, Institutions and Money 22: 55–86. [Google Scholar] [CrossRef]
  56. Vandewalle, Nicolas, and Marcel Ausloos. 1998. Crossing of two Mobile Averages: A method for Measuring the Roughness Exponent. Physical Review E 58: 6832–34. [Google Scholar] [CrossRef]
  57. Vygodina, Anna. 2006. Effects of size and international exposure of the US firms on the relationship between stock prices and exchange rates. Global Finance Journal 17: 214–23. [Google Scholar] [CrossRef]
  58. Zebende, Gilney. 2011. DCCA cross-correlation coefficient: quantifying level of cross-correlation. Physica A: Statistical Mechanics and its Applications 390: 614–18. [Google Scholar] [CrossRef]
  59. Zebende, Gilney, and Aloísio Filho. 2018. Detrended Multiple Cross-Correlation Coefficient. Physica A: Statistical Mechanics and its Applications 510: 91–97. [Google Scholar] [CrossRef]
Figure 1. Detrended cross-correlation analysis (DCCA) correlation coefficients between the exchange rates and the respective stock market, versus time scales (in days). Dashed lines represent lower and upper critical values (99%), for the test of hypothesis H0: ρ D C C A = 0 and H1: ρ D C C A 0 .
Economies 07 00009 g001
Figure 2. Detrended moving average cross-correlation (DMCA) coefficients between the exchange rates and the respective stock market, versus window length (in days). Dashed lines represent lower and upper critical values (99%), for the test of hypothesis H0: ρ D M C A = 0 and H1: ρ D M C A 0 .
Economies 07 00009 g002
Table 1. Descriptive statistics for returns for each stock market in the period.
MeanMaximumMinimumStd. Dev.SkewnessKurtosis
China0.00020.0940−0.09260.0154−0.30905.3316
Germany0.00020.1080−0.08870.0147−0.05074.5560
France0.00010.1059−0.09470.0147−0.03865.0776
Japan0.00010.1323−0.12110.0146−0.39146.8036
India0.00060.1503−0.12880.01470.47917.9063
United Kingdom0.00010.0938−0.09270.0117−0.15826.3288
Table 2. Descriptive statistics for returns for each exchange rate in the period.
MeanMaximumMinimumStd. Dev.SkewnessKurtosis
Chinese Yuan−0.00010.0182−0.02030.0011−0.680354.4709
Euro0.00000.0384−0.04620.0062−0.15672.4937
Japanese Yen0.00000.0384−0.03570.0064−0.09433.0115
Indian Rupee0.00000.0325−0.03060.00370.29088.2795
Pound Sterling0.00000.0831−0.04470.00590.588111.6940

