Abstract
Prior economic research emphasized land, labor and physical capital as the primary drivers of growth, but contemporary work highlights the pivotal role of human capital. Investments in education, health and governance are now regarded as central to sustainable development; yet important questions remain regarding their effectiveness and context-specific impact. This study investigates how human capital investment influences labor force participation and income growth within the ASEAN nine economies for the period from 2000 to 2022 which provides a rich example of contrast in economic and governance outcomes within a single geographic region. Impacted units of measurement of labor force participation and income growth are evaluated using the Bayesian Additive Regression Trees model to select the most important variables, the Bayesian Dynamic Nonlinear Multivariate panel model to estimate regional effects, and the Time-varying Seemingly Unrelated Regression Equations model to evaluate country-specific dynamics, which considers not just the influence of investments in health and education but also the context of rule, law, and governance. The findings indicate that human capital investments exhibit heterogenous effects across economic tiers and the need for strategies and future study of preconditions to improve returns particularly in low-tier economies. Accordingly, mid-tier, emerging economies exhibit the greatest benefit from human capital investments while top-tier exhibit the probable impact of the law of diminishing returns as their human capital development is already well underway. Despite the limited scope, this study still has the potential to draw constructive theoretical and practical implications.
1. Introduction
Contrary to the earlier era of economic research and analysis (Smith, 1776; Ricardo, 1817), in which economic development was viewed as largely dependent upon land, labor, and capital, in the modern era over the last 60 years, the study of the role of human capital in development has come to the fore. Broadly speaking, this body of work has evolved from identifying investments in education, health, and governance as important building blocks of development to identifying why and how these investments pay off and in what contexts. Despite the arc of high-level research, there remains much to learn regarding how to optimize the efficacy of these investments. Many scholars believe that investments in human capital development help countries sustain long-term economic growth. The early human capital theory of Schultz (1963) and Becker (1964) emphasizes skills, knowledge, and education as driving engines of greater productivity and higher income, thereby improving the overall well-being of the population and contributing to economic growth. Educational spending is an endogenous factor for a new growth model (Saiti & Chletsos, 2024). Bajanerjee and Duflo (2011) have also highlighted that education investments, especially for girls, result in improved economic well-being. However, lower-than-expected returns on educational investment and unequal access to quality healthcare in developing countries, including ASEAN countries, have raised concerns about the efficacy of these investments (Lim et al., 2022; Jakovljevic et al., 2022). Plus, Acemoglu et al. (2001, 2005), Acemoglu et al. (2014), and Tasane and Srun (2023) have found no support for human capital development in countries with weak institutional levels. Therefore, this present study examines human capital development-driven labor force participation and income growth models using microdata of ASEAN, except for Brunei Darussalam, to determine if there are diminishing benefits from health and education investments between 2000 and 2022.
The endogenous growth models by Lucas (1988) and Romer (1990) added depth to the investigation. For example, human capital is very important in the production function of the Lucas growth model (Lucas, 1988), showing that knowledge and education fuel growth through productivity gains as training and skills enhance individual productivity and higher earning potential. The per capita production function of the Lucas growth model (Lucas, 1988) is expressed as , where h is human capital and u is the fraction of total labor time allocated to productive work. Romer (1990) furthered this by integrating human capital into the innovation process. In his new growth model, human capital drives the creation of new ideas accumulating long-term growth. Assuming no population growth, the per capita output function of this model is , where new ideas increase output per person at share of labor allocated to research and development. So, both models highlight human capital as fundamental to endogenous growth in labor economics.
The growing consensus on the importance of these factors for sustainable growth shows that human capital development varies due to economic diversity in ASEAN countries. Countries like Singapore and Malaysia invest heavily in health and education while others like Laos, Myanmar, and Cambodia are left behind. Labor markets also face challenges as skill mismatches and low health outcomes limit labor force participation in some nations. Income inequality also reflects disparities in health and education. FDI inflows and internet use support growth but inflation and economic disruptions limit progress. Understanding these dynamics informs effective policy interventions for sustainable growth. At USD 4 trillion, ASEAN is the sixth largest economy or economic bloc in the world (USA, China, EU, India, Japan, ASEAN). However, relative to any other bloc or region in the world, ASEAN is extremely diverse, both economically and in terms of governance. The gap between Singapore and Myanmar is by any measure—such as per capita GDP, USD 91k Singapore vs. estimated USD 1.5k Myanmar, or rule of law—immense. Excluding Brunei, as it is a true outlier, ASEAN-9 is markedly stratified as far as a disparity country in terms of economic outcomes. Therefore, it provides a unique laboratory for evaluating the impact of human capital investments over a variety of economic and social contexts. To allow for better contextual comparison, ASEAN is divided into top-, mid-, and low-tier groupings, as follows: (1) Singapore and Malaysia; (2) Thailand, Viet Nam, Philippines, and Indonesia; and (3) Cambodia, Laos, and Myanmar. Figure 1 presents the Human Development Index of selected ASEAN countries for 23 years from 2000 to 2022. While low-tier economies like Cambodia, Laos, and Myanmar remain lowest with an HDI sitting below 0.6, Singapore followed by Malaysia achieves the highest values. These indexes also underscore the need for tier-specific investigations. Beyond that, the perception of the corruption index shows large gaps across countries from 2012 to 2024 (Figure 2). Singapore and Malaysia are the least corrupt countries while Laos, Cambodia, and Myanmar are the most corrupt. From 1996 to 2023, Singapore and Malaysia remained politically stable (Figure 3). Some countries improved after 2010, but instability still blocks progress. Countries with high corruption and political instability might not turn investments into growth. The positive correlation between high levels of corruption and low per capita GDP is evident in comparative data. These two figures certify the diversity within the ASEAN region, with both being important for maintaining consistent policies and strong institutions that support effective investments.
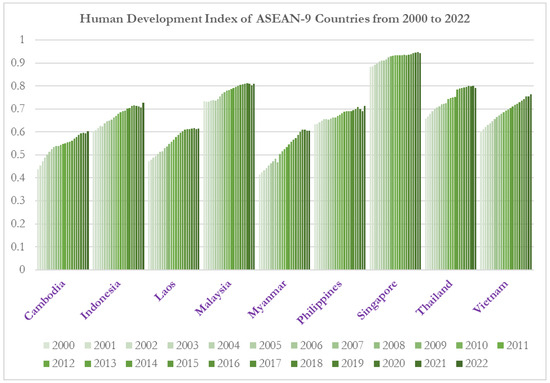
Figure 1.
The Human Development Index (HDI) of ASEAN-9 countries (2000–2022). Notes: HDI is a summary metric of human development based on mean and expected years of schooling, logged GNI per capita, and mean of life expectancy. The authors adjusted the data obtained from UNDP database accessed on 19 June 2025 for educational purposes.

Figure 2.
The perception of corruption (POC) in ASEAN-9 countries (2012–2024). Notes: POC scores range from 0 (highly corrupt) to 100 (least corrupt). The authors adjusted the data obtained from CEIC database for educational purposes.
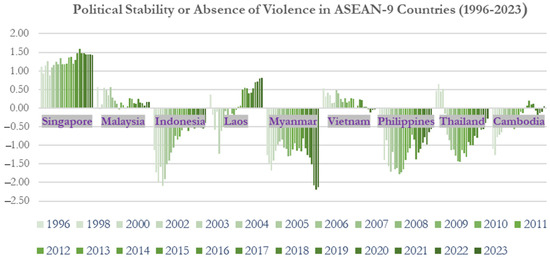
Figure 3.
The political stability of the absence of violence in ASEAN-9 countries (1996–2023). Notes: Political stability or the absence of violence can serve as a proxy for the rule of law and government effectiveness in absolute terms and in trends. Absence of violence scores range from −2.5 to 2.5 and reflect the likelihood of political instability or violence including terrorism. The authors adjusted the data obtained from CEIC for educational purposes.
In general, there is a list of existing studies that found a positive effect of human capital on economic growth in ASEAN countries. Human capital positively contributes to economic growth in Cambodia, Indonesia, Malaysia, Philippines, Thailand, and Vietnam for the period from 1995 to 2017 (Rahman et al., 2022). Between 1985 and 2015, the same authors found that human capital does not have a long−term impact on growth in Malaysia but it does in Indonesia and Thailand (Muhamad et al., 2018). In Vietnam, education spending positively correlated with economic growth between 2020 and 2022 (Ngan & Do Khoa, 2024). Previously, these authors reported a positive impact of human capital and education spending on growth in Indonesia, Malaysia, and Thailand for the periods from 1985 to 2018 (Sulaiman et al., 2021). Thinagar et al. (2021) also found that health expenditure has a positive impact on growth across four ASEAN countries, namely Thailand, Philippines, Malaysia, and Indonesia, between 1995 and 2014. Another study showed that a rise in human capital increased both GDP and per capita GDP in ASEAN countries between 1990 and 2018 (Budsayaplakorn & Sompornserm, 2021). Additionally, education investments have been found to have a positive effect on growth in Indonesia (Widarni & Bawono, 2021).
In sum, despite the positive effects of human capital in most past studies on cross-sectional and time series regression analyses, we find that they have overlooked the diverse structural characteristics and varying relationships within the ASEAN region. Furthermore, no prior study has identified variable selection methods and included both health and education investments as well as institutional quality. Thus, this study explores the impact of human capital investments on both labor participation and income across the ASEAN region by economic (top-, mid and low) tier. For country-specific analysis, we estimate the effect of education expenditure and health spending on labor participation and income for each selected ASEAN country using a TVSURE model to fill these gaps.
2. Methods of Study
In this study, we first used the Bayesian Additive Regression Trees (BART) model to select the most important variables at a chosen threshold. Then, we applied the Bayesian Dynamic Nonlinear Multivariate (BDNM) panel model for tier-based estimation. This panel model is a type of system-of-equations method for panel study which can be used to study both time-invariant and time-varying effects at the same time. These methods have gone beyond average linear effects. They have revealed heterogeneous dynamics and addressed possible endogeneity issues. Prior studies have mostly used linear panel regressions (fixed/random effects) and dynamic panel GMM but they assumed linearity, homogeneous effects, and time-invariance. For example, previous studies have employed a range of econometric models to examine the effect of human capital on economic growth in ASEAN countries, including ARDL (Sulaiman et al., 2021; Widarni & Bawono, 2021), panel fixed effects (Sulaiman et al., 2021), pooled OLS and panel FMOLS (Rahman et al., 2022), FMOLS (Thinagar et al., 2021), and Granger causality tests (Budsayaplakorn & Sompornserm, 2021). So, this model has overcome these limitations. Finally, we used the Time-varying Seemingly Unrelated Regression Equations (tvSURE) model for analyzing the country-specific effects.
2.1. Variable Selection by Using Bayesian Additive Regression Trees Model
Empirical research requires data-driven variable selection particularly when theoretical guidance is fractional. With a data-driven variable selection approach, it can identify the main drivers of outcomes, support predictive accuracy, and even reduce overfitting. In most cases, linear models have been found to be sensitive to multicollinearity and model misspecification. Chipman et al. (2010) have proposed a non-parametric method called Bayesian Additive Regression Trees (BART) to deal with this issue effectively. BART models the response variable as a sum of multiple regression trees and each tree contributes modestly to the overall fit. This model works well on both linear and nonlinearities by incorporating prior distributions and MCMC sampling to obtain a posterior inclusion of joint trees. It also downweighs irrelevant predictors automatically through its hierarchical prior structure. This way, it enhances uncertainty quantification and robust inference. Kapelner and Bleich (2014) have extended BART in the “bartMachine” R package implemented in R 4.5.1, which makes model implementation available and conducts hyperparameter tuning and variable importance ranking. For the present empirical work studying human capital investments in ASEAN-9 countries, BART has effectively ranked variables based on their posterior inclusion probabilities.
2.2. Tier-Based Study Using Bayesian Dynamic Nonlinear Multivariate Panel Model
This study used the Bayesian Dynamic Nonlinear Multivariate panel model recently developed by Tikka and Helske (2024) and Helske and Tikka (2024) to examine the impact of human capital investments on labor force participation and income growth across ASEAN-9 countries. This is a multivariate Bayesian panel model that can be used to study dynamic, nonlinear, and time-varying effects. Unlike traditional system-of-equations models, this model is specified as a factorized conditional distribution for responses that allows for methodical dependencies among simultaneous outcomes. The model defines response vectors
where orders the number of c responses (income and labor), and each depends on prior responses in the ordering and covariates . And each c response is modeled for combined effects grouped by covariates:
where is the time-varying intercepts, is the time-invariant coefficients for k covariates, is the time-varying coefficients for k covariates, is group-level random effects, is unobserved time-specific shocks, and models correlated dynamic effects across c to induce cross-variable correlation.
The two systems of equations used in this study are defined as follows:
Here the conditional means are specified as follows:
In this model, time-varying coefficients are estimated with Bayesian panelized spines, as shown in Equation (3).
where is the Bayesian panelized spine, are spine coefficients, and controls the smoothness of spline curves. Helske and Tikka (2024) noted that the number of D is not important. This model is well suited to study joint dynamics of human capital investments across countries that accounts for both structural covariates and shifting relationships within the Bayesian framework while flexibly capturing nonlinear dynamics between human capital investments and macroeconomic outcomes across three tiers of ASEAN economies.
2.3. Estimating Country-Specific Effects Using tvSURE Model
For country-specific analysis in this study, we have employed the Time-varying Seemingly Unrelated Regression Equations (tvSURE) model proposed by Casas et al. (2019). This method is an extension of the classical SURE model developed by Zellner (1962), which incorporates parameters and error variances that vary smoothly over time. tvSURE is a system-of-equations model which can be used to study the varying response patterns of shared covariates (e.g., health and education) on multiple outcome variables (e.g., labor and income). Unlike fixed-parameter models, tvSURE estimates the system jointly while allowing for heterogeneity and interdependence across equations. This model was implemented in the R package “tvReg” (Casas & Fernandez-Casal, 2022) and applied to assess how health and education investments influenced labor participation and income between 2000 and 2022.
We specified the following system-of-equations for this objective:
With this assumption, we estimated the model coefficients using the Time-Varying Feasible Generalized Least Squares (tvFGLS) method. This approach began with tvOLS estimation for each regression equation to obtain initial coefficient estimates and residuals using local linear kernel smoothing function. Then, the time-varying residual covariance matrix is estimated using a kernel-weighted estimator:
At any normalized time point each element of the matrix is estimated.
where K(.) is a symmetric kernel function and b is the bandwidth. Finally, time-varying coefficients of the system are estimated using GLS with time-varying weights derived from .
3. Data
This study used annual secondary time series data obtained from three open sources. The sample study covered the periods from 2000 to 2022 for nine ASEAN countries. There were two main dependent variables, namely labor force participation growth and per capita GDP growth rates. The two main independent variables were current health expenditure and government total expenditure on education. The selection of these variables aligns with the existing literature (Bloom et al., 2003; Barro & Sala-i-Martin, 2004; Becker, 1964; Psacharopoulos & Patrinos, 2018; Tasane & Srun, 2023). Additionally, six exogenous variables take into consideration external influences. Rule of law and government effectiveness estimates are considered to be the most important components for assessing institutional quality. They determine whether human capital investments succeed or fail. The inclusion of the rule of law and government effectiveness variables is to account for institutional quality, as Acemoglu et al. (2001) and Tasane and Srun (2023) found that human capital increases growth only in countries with higher institutional quality. The inflow of foreign direct investment is added as it creates job opportunities in labor markets and drives growth (Alfaro et al., 2004). Inflation is chosen because it diminishes real income (Barro, 1995). In addition, it is suitable for the presence of volatile markets across ASEAN countries. Internet use as percentage of population is also selected due to the emergence of digital economy in the region, and digital access provides job opportunities (Chinn & Fairlie, 2007). Moreover, it provides education opportunities, especially to those from far destinations. Lastly, major economic disruptions such as financial crises, civil wars, and the COVID-19 pandemic are acknowledged as factors that significantly intermediate the relationships among studied variables. They moderate the effect of human capital development on labor force dynamics and growth; however, these variables are understudied particularly in ASEAN countries. To ensure robust analysis aligning with human capital theory, this study initially identified whether these six variables influence shifts in labor markets and income levels by using a Bayesian Additive Regression Tree model. As previously stated, investments in health and education boost individual productivity and economic growth according to human capital theory. Symbols, the units and sources of variables and data used are summarized in Appendix A.1 while a summary of the statistics is provided in Appendix A.2.
4. Findings of Results
This section provides the empirical findings on the dynamic correlations between human capital investments proxied by health and education spending and labor force participation growth and income growth across ASEAN-9 countries from 2000 to 2022. For the Bayesian variable selection, the panel dataset included rule of law, government effectiveness, consumer price inflation, FDI net inflows percentage of GDP, internet use percentage of population, and a dummy for economic disruption crises. For the robust variable selection, BART ran 20 repeats and variables were selected based on a median-based threshold (50th percentile) of posterior inclusion probabilities. The BART model selected rule of law, government effectiveness, and FDI net inflows with the estimated posterior means of 0.2566, 0.2162, and 0.2092, respectively. These three exogeneous variables were determined to be important in exploring a human capital-led driven labor force participation growth model. In contrast, BART estimated that internet use (0.2279), economic disruption dummy (0.1867), and rule of law (0.1715) had the highest posterior inclusion probabilities for the income growth model. We can conclude that different structural and macroeconomic factors affect labor force participation and income levels for selected ASEAN-9 countries during studied periods. Since it reveals the importance of those selected variables on human capital-driven growth models, we add them in addition to our main independent variables (health and education) in our panel dynamic analysis for robust findings.
Table 1 and Figure 4 present Bayesian estimates of posterior means, standard deviations, posterior intervals, values, and effective sample sizes from the Bayesian Dynamic Nonlinear Multivariate panel model for ASEAN-9 countries for the period 2000–2022. This model comprises both time-invariant and time-varying effects to evaluate how human capital investments influence labor force participation and income growth. Human capital variables in the income growth model include education, health, internet use, rule of law, government effectiveness, and economic disruption dummy. The labor force participation growth model includes education, health, FDI inflows, government effectiveness, and rule of law. In terms of time-invariant effects, human capital investments ( = −0.249; = −0.522) and institutional quality ( = −0.0686) negatively correlated with income growth. On the other hand, an increase in internet use percentage of total population increases income but the effect is small (). Surprisingly, the economic disruption dummy ( = 1.86) is found to have a positive link with income growth. For the same periods, government expenditure on education ( = 0.427), FDI inflows ( = 0.106), and government effectiveness () are positively associated with labor force participation growth while government expenditure on public health () and rule of law () had negative effects. The time-varying effects further support these findings. The economic disruptions () on income growth declined sharply from 2000 to 2015 until it reversed direction after 2015 toward 2022. Human capital investments () and () as well as internet use () show that the influence of education, health, and internet use on income growth was weak and stable between 2000 and 2022. However, the time-varying coefficient of rule of law () declined from 2000 to around 2013 then increased toward 2022. This indicates that the institutional quality had a stronger effect on income growth in the early and later years. In addition, education investment (), FDI inflows () and rule of law (), had a relatively flat time-varying effect on labor force participation growth throughout the studied periods. The time-varying effect of government effectiveness () on labor force participation gradually increased starting in 2010 while the health spending effect began to decline after 2017.

Table 1.
Estimated results for ASEAN-9 countries using Bayesian DNMPM.

Figure 4.
Time-varying coefficients estimated for ASEAN-9 countries using Bayesian DNMPM.
Table 2 shows the estimated posterior means, standard deviations, posterior intervals, values, and effective sample sizes for ASEAN top-tier economies, specifically Malaysia and Singapore, from 2000 to 2022. Regarding time-invariant effects, human capital investments in education () and health () show negative correlations with income growth. Economic disruptions () and internet use ( = −0.0013) also negatively affect income growth. Rule of law () positively affects income growth. Education () and health () have positive effects on labor force participation growth. Government effectiveness () boosts labor force participation. FDI inflows () and rule of law () negatively influence labor force participation. Figure 5 displays the posterior means and 90% credible intervals of time-varying effects for Malaysia and Singapore from 2000 to 2022. Economic disruptions () initially harm income growth but show recovery after 2015. Education () and health () show low variation effects on income. Internet use () and rule of law () on income growth had a positive and slowly increasing effect on income growth. The effects of education () and government effectiveness () on labor force participation did not vary significantly over time. FDI inflows () had a slightly increasing impact on labor force participation starting in 2013 while rule of law () had a gradually decreasing effect after 2014.

Table 2.
Estimated results for ASEAN top-tier economies using Bayesian DNMPM.
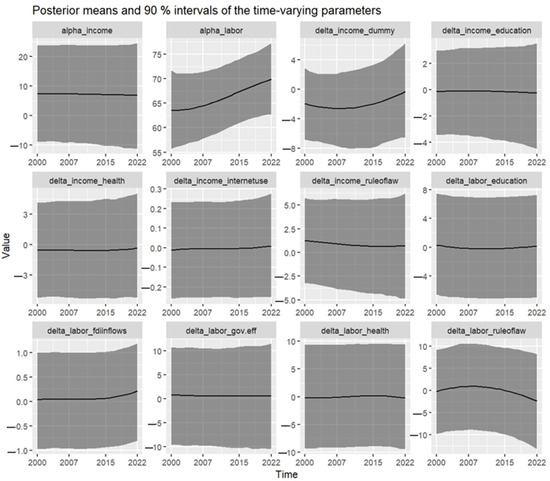
Figure 5.
The time-varying coefficients estimated for ASEAN top-tier economies using Bayesian DNMPM.
Figure 4 shows the posterior means of time-varying regression coefficient in black lines at 90% posterior intervals in gray shaded areas. Each panel from left to right shows the time-varying intercept for income and labor force participation followed by shifting relationships between response and covariates (, , , , , , , , , and ).
Figure 5 shows the posterior means of time-varying regression coefficient in black lines at 90% posterior intervals in gray shaded areas. Each panel from left to right shows the time-varying intercept for income and labor force participation followed by shifting relationships between response and covariates (, , , , , , , , , and ).
Table 3 provides the estimated posterior means, standard deviations, posterior intervals, values, and effective sample sizes for ASEAN mid-tier economies, specifically Indonesia, Philippines, Thailand, and Vietnam, from 2000 to 2022. Among the time-invariant effects, economic disruptions () had a positive effect on income growth. Education expenditure () had a very small negative impact on income while health () showed a very small positive effect. Internet use () showed a very small negative effect on income growth while rule of law () had a positive effect. Among the labor force participation effects, education (= −0.497) and FDI inflows (= −0.907) had small negative effects. Government effectiveness (= 1.01), public health expenditure (= 1.00), and rule of law (= 0.746) had small positive impacts. Figure 6 presents the posterior means and 90 percent credible intervals of the time-varying effects for ASEAN mid-tier economies from 2000 to 2022. Economics disruptions reduced income growth starting in 2000 but show a slow recovery trend after 2018. Education and health spending exhibit minimal effects on both income and labor force participation with little variation over time. Rule of law on income and government effectiveness on labor force participation have slight downward trends. Internet use on income and FDI inflows on labor force participation have slight upward trends. Surprisingly, the time-varying effect of rule of law on labor force participation remained constant.

Table 3.
Estimated results for ASEAN mid-tier economies using Bayesian DNMPM.

Figure 6.
The time-varying coefficients estimated for ASEAN mid-tier economies using Bayesian DNMPM.
Figure 6 shows the posterior means of time-varying regression coefficient in black lines at 90% posterior intervals in gray shaded areas. Each panel from left to right shows the time-varying intercept for income and labor force participation followed by shifting relationships between response and covariates (, , , , , , , , , and ).
Table 4 provides the estimated posterior means, standard deviations, posterior intervals, values, and effective sample sizes for ASEAN low-tier economies, specifically Cambodia, Laos, and Myanmar, from 2000 to 2022. Among the time-invariant effects, economic disruptions (= 0.941) had a positive impact on income. Education (= −0.417) and health (= −0.424) had small negative effects on income. Internet use (= 0.0404) had a very small positive impact. Rule of law (= −1.15) showed a negative effect on income growth. For labor force participation, education (= −0.670), FDI inflows (= −0.176), government effectiveness (= −0.217), and rule of law (= −2.07) had negative effects. Public health expenditure (= 0.220) had a small positive effect. Figure 7 presents the posterior means and 90% credible intervals of time-varying effects from 2000 to 2022. Economic disruptions initially impact income growth negatively but trend upward after 2015. Education and health spending have negative and minimal varying effects on income growth and labor force participation. Internet use shows a slight decline in its influence on income while rule of law exhibits a gradual increase. The influence of FDI inflows, government effectiveness, and rule of law on labor force participation grow steadily in late periods.

Table 4.
Estimated results for ASEAN low-tier economies using Bayesian DNMPM.

Figure 7.
The time-varying coefficients estimated for ASEAN low-tier economies using Bayesian DNMPM.
Figure 7 shows the posterior means of time-varying regression coefficient in black lines at 90% posterior intervals in gray shaded areas. Each panel from left to right shows the time-varying intercept for income and labor force participation followed by shifting relationships between response and covariates (, , , , , , , , , and ).
Finally, this study conducted time-varying country-level estimates using the tvSURE model to support the summary of findings for tier-based analysis presented in Table 5. In this subsection, Table 6 provides estimated means to assess the impact of human capital development on income growth and labor force participation in selected ASEAN countries for the same periods. Health investments had positive effects on labor force participation in Indonesia, Laos, Malaysia, Singapore, and Vietnam. It had negative effects in Cambodia, Myanmar, Philippines, and Thailand. Education investments showed mixed results. It had negative effects in Cambodia, Indonesia, Laos, Malaysia, Myanmar, Philippines, Singapore, and Vietnam. It was positive in Thailand. Health investments had positive effects on income growth in Indonesia, Philippines, Singapore, and Vietnam. It was negative in Cambodia, Laos, Malaysia, Myanmar, and Thailand. Education investments had positive effects on labor force participation in Cambodia, Laos, and Philippines. It was negative in Indonesia, Malaysia, Singapore, Thailand, and Vietnam. The estimated shifting relationships between investments in human capital development, labor force participation, and income growth for all selected ASEAN countries are presented for the periods from 2000 to 2022 in Figure A1, Figure A2, Figure A3, Figure A4, Figure A5, Figure A6, Figure A7, Figure A8 and Figure A9 in Appendix B. The effects are estimated using the tvSURE model with 95% bootstrap confidence intervals.

Table 5.
Summary of findings for tier-based estimates using BDNM panel model.

Table 6.
Mean estimates for each ASEAN country using tvSURE model.
5. Conclusions, Limitations, and Implications
This paper explores the shifting relationships between human capital investments and the chosen variables of the study for the period between 2000 and 2022 in the ASEAN-9 countries. Dividing the ASEAN nine into three groups (top-, mid-, low-tier) allowed for more nuanced appreciation of the impact the two independent variables and the six exogenous variables had on human capital proxies (dependent variables). As suspected, not only do different inputs (variables) have different outcomes, but they often have uniquely different outcomes within each tier. For example, we know that the top-tier countries are presently the most developed, which means they have the highest level of the existing governments’ effectiveness, education, health, etc., and that the mid-tier are generally speaking developing these attributes, whereas the low-tier are indeed quite undeveloped. We can therefore think of the top-tier as high-income (Singapore) or middle-income (Maylasia) countries, the mid-tier as emerging economies, and the lowest tier as “frontier” economies. In this light, it is not illogical to expect the highest relative returns of investment in human capital in the mid-tier emerging economy group.
It is regrettable to see low relative return on HC investment in the lowest tier, as they are certainly most in need, but the results are what they are, and it may conversely be understandable that further HC investments in the top tier might be confronting diminishing returns. The “soft” returns in the low-tier group obviously pose a new set of questions (outside of the scope of this study) as to better understanding the “preconditions”—social, infrastructure, government, etc.—to help ensure a stronger response to HC investments, and indeed a better understanding of the relative prioritization of said investments in the future. Still, our findings are consistent with the findings of (Acemoglu et al., 2001; Tasane & Srun, 2023).
An important “tactical outtake” from this study is that an addition to heterogenous results by economic tier is the heterogeneity evidenced by the human capital investment type. This suggests that future practitioners of human capital investment would be well suited to analyze country-specific results by type at a very early stage to best focus their efforts on the highest possible return on said investments. Doing so would likely leverage or build upon the work conducted by Banerjee, Duflo, and Kremer through their randomized controlled trials (RCTs) and micro-level experiment protocol to better analyze efficacy.
We acknowledge that this paper has several limitations. First, trade openness, migration, and fertility rate factors are not examined, even though they can influence labor dynamics. Trade openness drives market expansion and job creation. Migration affects labor supply and skill distribution. Both Singapore and Thailand currently have negative fertility rates, with Singapore severely so. Future research should include these variables to understand their effects on the link between labor force participation and human capital investments. Second, the variable selection process can be improved. Future studies should consider combining two or more selection methods for robust and optimal specifications, as suggested by Pastpipatkul and Ko (2025). Third, this study does not explore the effect of health and education investments on the Human Development Index (HDI). If these investments significantly improve the HDI, future research should include it as a mediating variable. This approach helps understand how human capital development affects income, labor participation, and growth. This study covers only nine ASEAN countries from 2000 to 2022. The findings may not apply beyond this region. Future research could expand the geographic scope to test broader applicability.
This study also revealed that investments in health and education exhibit heterogeneous and sometimes counterintuitive effects across ASEAN countries. In some cases, these investments have limited or negative short-term effects on income growth or labor force participation. This can occur for several reasons. First, returns on human capital investments are often delayed; benefits may only appear after several years. Second, measurement issues in spending or service quality may distort observed impacts. Third, in more developed economies, diminishing returns may limit the observable short-term effects of additional investments. Finally, short-run adjustments to shocks such as economic disruptions can temporarily alter the effects. These explanations help interpret the negative coefficients for health or education in some tiers and the positive effects of crises observed in the model. Policymakers should consider these factors, as the benefits of human capital investments may materialize over the medium to long term.
Despite the limitations, this paper provides theoretical and practical implications. The study shows that human capital effectiveness varies with institutional levels, as heterogeneous effects are observed. It also highlights the link between perceived corruption, macroeconomic factors, and HDI outcomes. Governments and policymakers should design human capital policies carefully. They should consider investments in secondary or tertiary education, hospital infrastructure, and other targeted areas. Micro-level approaches, such as randomized controlled trials (RCTs) used in Kenya, can improve impact. Human capital strategies that match investment type with country-level economic structure likely increase marginal benefits. Finally, weak returns in low-tier countries suggest a need to examine the structural conditions required for successful investment. Since health investment shows positive income effects but education has weakened after 2015, policymakers should strengthen lifelong learning systems and workforce reskilling to complement strong healthcare systems. This can sustain productivity gains in top-tier countries (Singapore and Malaysia). For mid-tier countries (Indonesia, Philippines, Thailand, and Vietnam), education investments deliver diminishing returns while health spending improves income. Governments and policymakers should prioritize public health expansion (e.g., universal coverage, rural clinics) while improving education quality over quantity through curriculum reform and teacher training. For low-tier countries (Cambodia, Laos, and Myanmar), both education and health show very weak returns under current conditions. Governments and policymakers should focus first on institutional strengthening, corruption reduction, and basic infrastructure. Only after creating supportive conditions can large-scale education or health investments generate positive growth and greater labor participation outcomes.
Author Contributions
Conceptualization, Visualization, Investigation, Formal Analysis, H.K. and G.R.D.; Methodology, Validation, Supervision, Project Administration, Funding Acquisition, P.P.; Software, Data Curation, Writing—Original Draft, H.K.; Writing—Review and Editing, P.P., H.K., and G.R.D. All authors have read and agreed to the published version of the manuscript.
Funding
No external funding was received for this work.
Data Availability Statement
This study used secondary data obtained from open sources.
Acknowledgments
The corresponding author gratefully acknowledges the support provided by the Chiang Mai University Presidential Scholarship during the course of doctoral studies at the Faculty of Economics, Chiang Mai University.
Conflicts of Interest
The authors declare no conflicts of interest.
Appendix A
Appendix A.1

Table A1.
Symbol, units, and source of data and variables used in study.
Table A1.
Symbol, units, and source of data and variables used in study.
| Variable | Symbol | Unit | Data Source |
|---|---|---|---|
| GDP per capita growth rates | income | % | WDI |
| Labor force participation rates, ages 15–64% of population | labor | % | WDI |
| Current health expenditure % of GDP | health | % | WDI |
| Total expenditure on education % of GDP | education | % | WDI, UNESCO |
| Rule of law * | ruleoflaw | Score | CEIC |
| Government effectiveness ** | gov.eff | Score | CEIC |
| Consumer prices inflation rates | inflation | % | WDI |
| Foreign direct investment net inflows % of GDP | FDIinflows | % | WDI |
| Individuals using the internet % of population | internetuse | % | WDI, MDJ |
| A dummy accounting economic disruption events *** | dummy | 0 and 1 | WDI |
Notes: *** 0 indicates no economic disruption in that year; * score of −2.5 to 2.5 reflect trust in laws, courts, property rights, and crime control; ** score of −2.5 to 2.5 reflect quality of public services, civil services, and policy implementation; data used were obtained from open sources available for WDI at https://data.worldbank.org; UNESCO at https://data.uis.unesco.org; MDJ at https://mydatajungle.com; and CEIC at https://ceicdata.com.
Appendix A.2

Table A2.
Summary statistics of data and variables used in study.
Table A2.
Summary statistics of data and variables used in study.
| Variable | N | Mean | Median | Minimum | Maximum | SD | Skewness | Ex. Kurtosis | IQR |
|---|---|---|---|---|---|---|---|---|---|
| Top-Tier Economies | |||||||||
| income | 46 | 69.360 | 69.478 | 64.185 | 76.847 | 3.7195 | −1.0112 | −1.0112 | 7.0392 |
| labor | 46 | 3.0407 | 3.1040 | −6.7093 | 14.362 | 3.8861 | 1.4675 | 1.4675 | 2.3838 |
| health | 46 | 3.5518 | 3.3761 | 2.5146 | 5.6161 | 0.66308 | 1.0031 | 1.0031 | 0.78064 |
| education | 46 | 4.1028 | 3.9185 | 2.4889 | 7.6579 | 1.3745 | 0.34139 | 0.34139 | 1.8584 |
| ruleoflaw | 46 | 1.9044 | 1.6428 | −1.1387 | 6.6278 | 1.7430 | 0.48424 | 0.48424 | 2.2681 |
| gov.eff | 46 | 11.977 | 6.0350 | 0.056692 | 31.621 | 10.015 | −1.3196 | −1.3196 | 18.097 |
| inflation | 46 | 66.537 | 69.000 | 21.400 | 97.400 | 19.804 | −0.63102 | −0.63102 | 26.725 |
| FDIinflows | 46 | 0.17391 | 0.0000 | 0.0000 | 1.0000 | 0.38322 | 0.96053 | 0.96053 | 0.0000 |
| internetuse | 46 | 1.0063 | 0.83500 | −0.90000 | 1.8400 | 0.69279 | −0.86746 | −0.86746 | 1.3025 |
| dummy | 46 | 1.5885 | 1.5150 | 0.60000 | 2.4700 | 0.62702 | −1.8066 | −1.8066 | 1.2400 |
| Middle-Tier Economies | |||||||||
| income | 92 | 71.919 | 72.424 | 56.681 | 82.855 | 7.1640 | −0.21656 | −1.3209 | 14.081 |
| labor | 92 | 3.6723 | 4.2077 | −10.549 | 7.3148 | 2.5932 | −2.6354 | 10.416 | 2.1827 |
| health | 92 | 3.7221 | 3.7654 | 1.8530 | 5.9750 | 0.87321 | 0.10224 | −0.58352 | 1.3283 |
| education | 92 | 3.2537 | 3.3302 | 0.86394 | 5.3000 | 0.97726 | −0.46291 | 0.40525 | 1.1021 |
| ruleoflaw | 92 | 4.4675 | 3.7392 | −1.7103 | 23.115 | 3.8346 | 1.9920 | 6.4490 | 3.8206 |
| gov.eff | 92 | 2.6250 | 2.3286 | −2.7574 | 9.6630 | 1.8865 | 0.62133 | 2.4304 | 2.3409 |
| inflation | 92 | 28.875 | 23.800 | 0.25400 | 88.000 | 24.047 | 0.70791 | −0.56453 | 37.430 |
| FDIinflows | 92 | 0.19565 | 0.0000 | 0.0000 | 1.0000 | 0.39888 | 1.5344 | 0.35435 | 0.0000 |
| internetuse | 92 | −0.36598 | −0.40000 | −0.97000 | 0.58000 | 0.28803 | 0.57562 | 0.33741 | 0.40000 |
| dummy | 92 | −0.02424 | 0.030000 | −0.60000 | 0.44000 | 0.26017 | −0.38093 | −0.90364 | 0.43750 |
| Low-Tier Economies | |||||||||
| income | 69 | 71.963 | 69.159 | 59.352 | 87.661 | 8.9557 | 0.45372 | −1.4139 | 18.668 |
| labor | 69 | 5.8398 | 6.0476 | −12.627 | 12.784 | 4.3437 | −1.7451 | 5.6362 | 3.0583 |
| health | 69 | 3.9407 | 4.0790 | 1.9446 | 6.9206 | 1.5164 | 0.27112 | −1.2871 | 2.7830 |
| education | 69 | 2.0410 | 1.9000 | 0.57000 | 4.2500 | 0.71057 | 0.69272 | 0.83182 | 0.88005 |
| ruleoflaw | 69 | 8.0665 | 5.0215 | −1.2417 | 57.075 | 10.013 | 2.6071 | 7.9891 | 5.3436 |
| gov.eff | 69 | 5.0664 | 4.2013 | 0.25318 | 11.152 | 2.9966 | 0.40972 | −1.0646 | 5.0824 |
| inflation | 69 | 15.454 | 3.5500 | 0.00020000 | 62.700 | 20.842 | 1.1552 | −0.19964 | 27.185 |
| FDIinflows | 69 | 0.21739 | 0.0000 | 0.0000 | 1.0000 | 0.41549 | 1.3703 | −0.12222 | 0.0000 |
| internetuse | 69 | −1.1468 | −1.0900 | −1.7400 | −0.66000 | 0.26200 | −0.61968 | −0.38748 | 0.30000 |
| dummy | 69 | −0.96725 | −0.91000 | −1.6900 | −0.30000 | 0.35249 | −0.32906 | −0.63098 | 0.48000 |
Notes: In top-tier economies, income, health, and education are fairly stable. Labor, inflation, and government effectiveness vary widely. FDI inflows and the dummy variable highlight extreme cases. In middle-tier economies, income, health, and education remain moderately stable. Labor, rule of law, government effectiveness, and inflation show high variation. FDI inflows and some normalized variables are skewed. In low-tier economies, income, labor, and rule of law exhibit wide variation. Health and education are moderately dispersed. Inflation and FDI inflows are skewed due to extreme values. Internet use and the dummy variable are mostly negative. Overall, the datasets show diverse economic, social, and institutional conditions across top-, middle-, and low-tier economies with differences in variability and skewness reflecting heterogeneity within each tier.
Appendix B
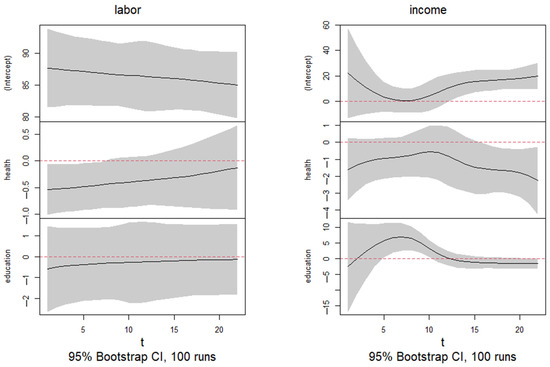
Figure A1.
Time-varying effects of human capital investments on labor force participation (left) and income growth (right) in Cambodia (2000–2022).
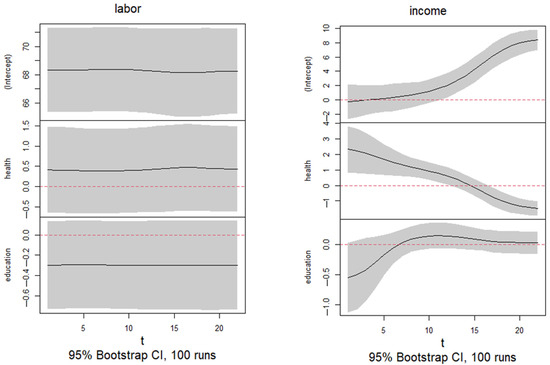
Figure A2.
Time-varying effects of human capital investments on labor force participation (left) and income growth (right) in Indonesia (2000–2022).
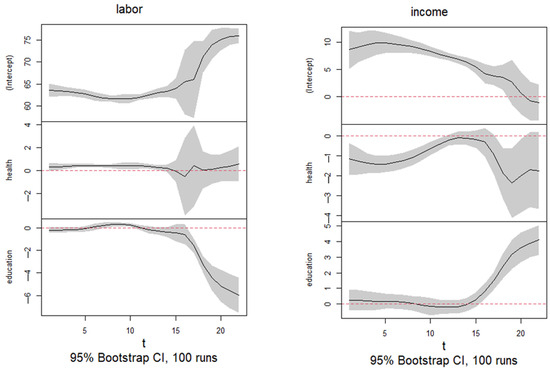
Figure A3.
Time-varying effects of human capital investments on labor force participation (left) and income growth (right) in Laos (2000–2022).
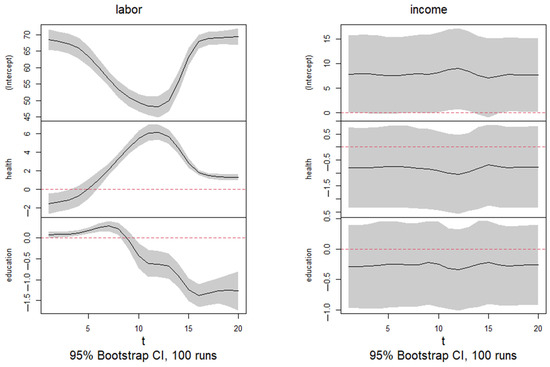
Figure A4.
Time-varying effects of human capital investments on labor force participation (left) and income growth (right) in Malaysia (2000–2022).
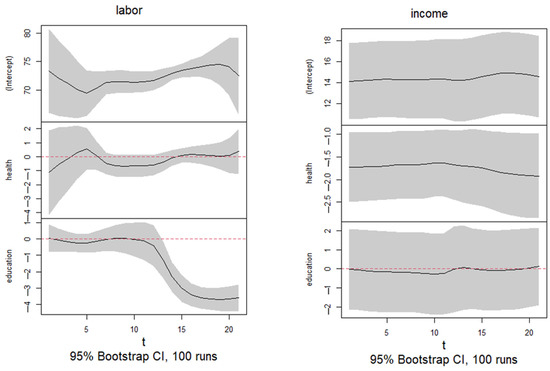
Figure A5.
Time-varying effects of human capital investments on labor force participation (left) and income growth (right) in Myanmar (2000–2022).
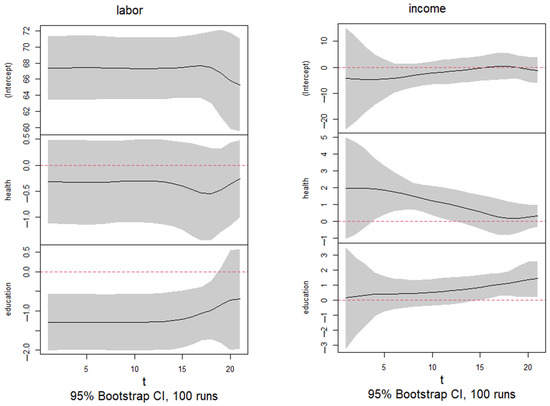
Figure A6.
Time-varying effects of human capital investments on labor force participation (left) and income growth (right) in Philippines (2000–2022).
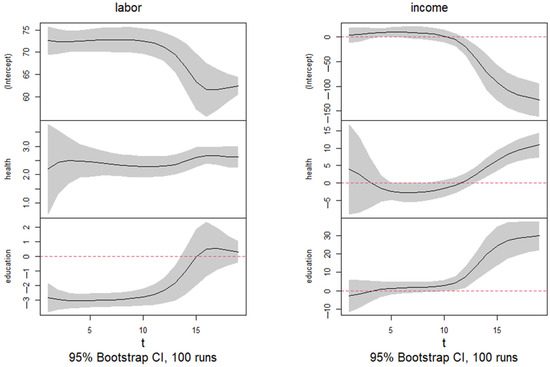
Figure A7.
Time-varying effects of human capital investments on labor force participation (left) and income growth (right) in Singapore (2000–2022).
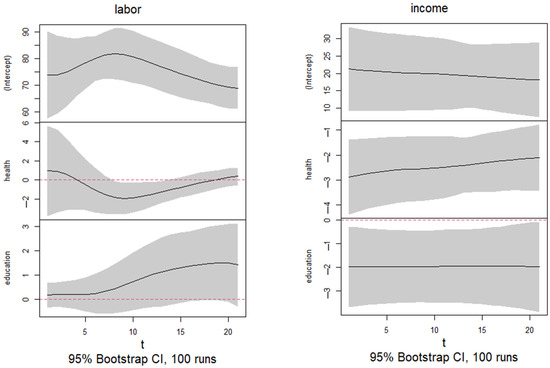
Figure A8.
Time-varying effects of human capital investments on labor force participation (left) and income growth (right) in Thailand (2000–2022).
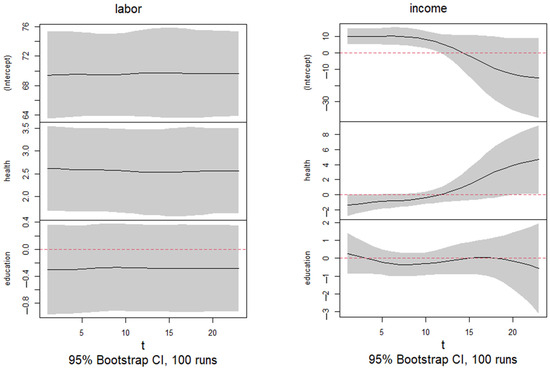
Figure A9.
Time-varying effects of human capital investments on labor force participation (left) and income growth (right) in Vietnam (2000–2022).
References
- Acemoglu, D., Gallego, F. A., & Robinson, J. A. (2014). Institutions, human capital, and development. Annual Review of Economics, 6, 875–912. [Google Scholar] [CrossRef]
- Acemoglu, D., Johnson, S., & Robinson, J. A. (2001). The colonial origins of comparative development: An empirical investigation. American Economic Review, 91(5), 1369–1401. [Google Scholar] [CrossRef]
- Acemoglu, D., Johnson, S., & Robinson, J. A. (2005). Institutions as a fundamental cause of long-run growth. In Handbook of economic growth (Vol. 1, pp. 385–472). Elsevier. [Google Scholar] [CrossRef]
- Alfaro, L., Chanda, A., Kalemli-Ozcan, S., & Sayek, S. (2004). FDI and economic growth: The role of local financial markets. Journal of International Economics, 64(1), 89–112. [Google Scholar] [CrossRef]
- Bajanerjee, A., & Duflo, E. (2011). Poor economics: A radical rethinking of the way to fight global poverty. Population and Development Review, 37, 796–797. [Google Scholar] [CrossRef]
- Barro, R. J. (1995). Inflation and economic growth. Bank of England Quarterly Bulletin, 35, 166–176. [Google Scholar] [CrossRef]
- Barro, R. J., & Sala-i-Martin, X. (2004). Economic growth (2nd ed.). The MIT Press. [Google Scholar]
- Becker, G. S. (1964). Human capital: A theoretical and empirical analysis, with special reference to education. University of Chicago Press. [Google Scholar]
- Bloom, D. E., Canning, D., & Sevilla, J. (2003). The effect of health on economic growth: A production function approach. World Development, 32(1), 1–13. [Google Scholar] [CrossRef]
- Budsayaplakorn, S., & Sompornserm, T. (2021). Human capital development via education and economic growth in ASEAN economic community. Kasetsart Journal of Social Sciences, 42(3), 473–481. [Google Scholar] [CrossRef]
- Casas, I., & Fernandez-Casal, R. (2022). tvReg: Time-varying coefficients in multi-equation regression in R. The R Journal, 14(1), 79–100. [Google Scholar] [CrossRef]
- Casas, I., Ferreira, E., & Orbe, S. (2019). Time-varying coefficient estimation in sure models. application to portfolio management. Journal of Financial Econometrics, 19(4), 707–745. [Google Scholar] [CrossRef]
- Chinn, M. D., & Fairlie, R. W. (2007). The determinants of the global digital divide: A cross-country analysis of computer and internet penetration. Oxford Economic Papers, 59(1), 16–44. [Google Scholar] [CrossRef]
- Chipman, H. A., George, E. I., & McCulloch, R. E. (2010). BART: Bayesian additive regression trees. The Annals of Applied Statistics, 4(1), 266–298. [Google Scholar] [CrossRef]
- Helske, J., & Tikka, S. (2024). Estimating causal effects from panel data with dynamic multivariate panel models. Advances in Life Course Research, 60, 100617. [Google Scholar] [CrossRef]
- Jakovljevic, M., Pallegedara, A., Vinayagathansan, T., & Kumara, A. S. (2022). Inequality in healthcare utilization and household spending in developing countries. Frontiers in Public Health, 10, 970819. [Google Scholar] [CrossRef] [PubMed]
- Kapelner, A., & Bleich, J. (2014). bartMachine: Machine learning with Bayesian additive regression trees. Journal of Statistical Software, 70(4), 1–40. [Google Scholar] [CrossRef]
- Lim, M. A., Anabo, I. F., Phan, A. N. Q., Elepano, M. A., & Kuntamarat, G. (2022, August). Graduate employability in ASEAN. The contribution of student mobility. Available online: https://asean.org/wp-content/uploads/2023/08/Graduate-Employability-in-ASEAN_The-Contribution-of-Student-Mobility_2022.pdf (accessed on 1 June 2025).
- Lucas, R. E. (1988). On the mechanics of economic development. Journal of Monetary Economics, 22(1), 3–42. [Google Scholar] [CrossRef]
- Muhamad, S., Sulaiman, N. F. C., & Saputra, J. (2018). The role of human capital and innovation capacity on economic growth in ASEAN-3. Jurnal Ekonomi Malaysia, 52(1), 253–264. [Google Scholar] [CrossRef]
- Ngan, N. V., & Do Khoa, L. N. (2024). The roles of human capital dynamics and health status in vietnam’s economic growth. In P. K. Nam, & A. Heshmati (Eds.), Recent trends in Vietnam’s rapid economic development (Frontiers in South and Southeast Asian Development Research). Springer. [Google Scholar] [CrossRef]
- Pastpipatkul, P., & Ko, H. (2025). The efficacy of monetary and fiscal policies on economic growth: Evidence from Thailand. Economies, 13(1), 19. [Google Scholar] [CrossRef]
- Psacharopoulos, G., & Patrinos, H. A. (2018). Returns to investment in education: A decennial review of the global literature. Education Economics, 26(5), 445–458. [Google Scholar] [CrossRef]
- Rahman, M. M., Vu, X. B., & Nghiem, S. (2022). Economic growth in six asean countries: Are energy, human capital and financial development playing major roles? Sustainability, 14(8), 4560. [Google Scholar] [CrossRef]
- Ricardo, D. (1817). On the principles of political economy and taxation. John Murray. [Google Scholar]
- Romer, P. M. (1990). Endogenous technological change. Journal of Political Economy, 98(5), S71–S102. [Google Scholar] [CrossRef]
- Saiti, A., & Chletsos, M. (2024). Microeconomic and macroeconomic consideration of education (Theories of economics of education). In Management and economics of education. Springer. [Google Scholar] [CrossRef]
- Schultz, T. W. (1963). The economic value of education. Columbia University Press. [Google Scholar]
- Smith, A. (1776). An inquiry into the nature and causes of the wealth of nations. W. Strahan and T. Cadell. [Google Scholar]
- Sulaiman, N. F. C., Saputra, J., & Muhamad, S. (2021). Effects of human capital and innovation on economic growth in selected asean countries: Evidence from panel regression approach. Journal of Asian Finance, Economics and Business, 8(7), 43–54. [Google Scholar] [CrossRef]
- Tasane, H., & Srun, S. (2023). The institutional environment, human capital development, and productivity-enhancing factors: Evidence from ASEAN countries. TRaNS: Trans-Regional and -National Studies of Southeast Asia, 11(2), 159–174. [Google Scholar] [CrossRef]
- Thinagar, S., Ismail, M. K., Vy, L. A., & Haron, A. A. (2021). Human capital investment and economic growth: A study on ASEAN countries. International Journal of Academic Research in Business and Social Sciences, 11(8), 12–24. [Google Scholar] [CrossRef]
- Tikka, S., & Helske, J. (2024). Dynamite: An R package for dynamic multivariate panel models. arXiv, arXiv:2302.01607. [Google Scholar] [CrossRef]
- Widarni, E. L., & Bawono, S. (2021). Human capital, technology, and economic growth: A case study of Indonesia. The Journal of Asian Finance, Economics and Business, 8(5), 29–35. [Google Scholar] [CrossRef]
- Zellner, A. (1962). An efficient method of estimating seemingly unrelated regressions and tests for aggregation bias. Journal of the American Statistical Association, 57(298), 348–368. [Google Scholar] [CrossRef]
Disclaimer/Publisher’s Note: The statements, opinions and data contained in all publications are solely those of the individual author(s) and contributor(s) and not of MDPI and/or the editor(s). MDPI and/or the editor(s) disclaim responsibility for any injury to people or property resulting from any ideas, methods, instructions or products referred to in the content. |
© 2025 by the authors. Licensee MDPI, Basel, Switzerland. This article is an open access article distributed under the terms and conditions of the Creative Commons Attribution (CC BY) license (https://creativecommons.org/licenses/by/4.0/).