1. Introduction
With the intensification of global warming, carbon reduction has become a critical issue of global concern. To address global climate change and environmental pollution, countries announced their carbon emission reduction targets at the United Nations Climate Change Conference held in Paris in 2015. As a major energy consumer in the world, China has made active efforts to reduce carbon emissions, and has set the goal of reaching a carbon peak by 2030 and carbon neutrality by 2060. Achieving the net-zero carbon emission goal will require long-term sustained efforts to transform the energy supply and demand system, reduce carbon emissions, and conserve energy. Improving energy efficiency is widely regarded as one of the important measures for energy conservation and emission reduction. However, it is worth noting that the existence of the rebound effect poses potential challenges to energy-saving policies that solely rely on increasing energy efficiency (
Lin & Zhu, 2021;
Shao et al., 2019).
Since energy systems are closely linked with economic systems, improvements in energy efficiency may lead to changes in the relative prices of energy services compared to other goods or services. This could potentially alter the budgets of consumers and producers, which may directly or indirectly increase energy use to some extent. Therefore, for the entire economy, the actual energy savings may be less than the potential savings that could have been achieved from improved energy efficiency. This phenomenon is known as the energy rebound effect. Due to the presence of the rebound effect, the potential energy savings that could result from improvements in energy efficiency are partially offset, which leads to inconsistency between energy efficiency improvement and energy-saving targets. Therefore, a viable climate change mitigation strategy should take into account the energy rebound effect.
In light of the importance of the energy rebound effect, scholars have carried out meaningful explorations into the issue of energy rebound over the past few years. These studies have primarily focused on evaluating the size and extent of the energy rebound in different countries or regions, industries, and sectors using different approaches and made interesting comparative analyses from different perspectives. However, a relatively unexplored question concerns the drivers of the energy rebound and the channels through which they might take effect. As the rebound effect can diminish the impact of energy efficiency enhancement on energy conservation and emission reduction (
Belaïd et al., 2020), it is crucial to address these issues in order to effectively control energy rebound and enhance the carbon reduction benefits of energy efficiency improvement.
Notably, with the continuous development and application of new generation information technologies, economic development is facing a digital transformation represented by the digital economy. According to the “Global Digital Economy White Paper (2023)”, the digital economy of 47 countries worldwide reached a scale of USD 32.6 trillion by 2022, with a year-on-year growth of 3%, accounting for 43.7% of GDP. Among them, China, as the world’s second-largest economy, has seen a rapid growth in its digital economy in recent years. The “2023 China Internet Development Report” indicates that in 2022, China’s digital economy reached 50.2 trillion yuan, accounting for 41.5% of GDP, with an actual growth rate of 15.5% compared to 2021. In the context of such a booming digital economy, the following issues deserve special attention: Does the development of the digital economy boost or inhibit the energy rebound effect? Is there a nonlinear impact between the two? What are the pathways of influence? However, these questions have not received systematic exploration by scholars to date. Given that the rapid development of the digital economy itself requires a large amount of energy input, one has to wonder whether it could be one of the factors driving the energy rebound effect. On the other hand, the advanced digital technologies, intelligent production, and digital lifestyle modes brought about by the development of the digital economy are conducive to energy conservation, reducing unnecessary energy waste, and maximizing the actual energy savings from energy efficiency improvements, which may help to inhibit energy rebound. Therefore, the overall impact of the digital economy on energy rebound is uncertain, and further empirical research is called for.
To fill the above research gaps, this study carries out a systematic exploration of the underlying impacts of the digital economy on energy rebound for the first time, using a panel dataset from China. The main contributions of this study concentrate on three aspects. Firstly, plentiful research has been done on the energy rebound in the past few years; however, to the best of our knowledge, there have been no studies that have explored the potential impacts of a digital economy—a new driving force of economic growth—on energy rebound and its underlying impact mechanisms. To fill this research gap, we carry out a systematic exploration on the nexus between a digital economy and energy rebound. This is particularly useful for an in-depth understanding of the potential drivers of the energy rebound effect, thereby helping policymakers to develop targeted and efficient policies to reasonably control the energy rebound effect. Secondly, the intrinsic impact mechanism of a digital economy on energy rebound has often been overlooked in the previous research. To fill this research gap, we further carry out a mediation effect analysis based on an intermediate-STIRPAT model. Thirdly, the threshold effects of a digital economy on energy rebound in terms of energy efficiency have been examined for the first time by establishing a dynamic threshold-STIRPAT model. In this way, more specific and effective policy implications can be drawn, which will be beneficial for achieving the sustainable development of energy systems, mitigating the environmental impacts of energy rebound, and ensuring the long-term viability of energy policies.
The rest of the study is arranged as follows.
Section 2 presents a review of the existing literature. In
Section 3, we discuss the theoretical mechanism and put forward hypotheses.
Section 4 presents methodology and data sources. In
Section 5, we conduct a benchmark estimation and robustness check. The mediating effect of energy efficiency and threshold effect are further examined in
Section 6.
Section 7 summarizes the main conclusions and policy implications of this study.
2. Literature Review
2.1. Studies on Energy Rebound Effect
The concept of energy rebound was first introduced by
Jevons (
1865) in his book named
The Coal Question. He analyzed that the invention of the steam engine greatly improved the efficiency of coal utilization and led to a large increase in the use of steam engines. As a result, coal consumption rose sharply even though the new steam engines used less energy per unit of work. This phenomenon is known as “the rebound effect”; in other words, as the efficiency of a resource increases, so does the demand for that resource (
L. G. Brookes, 1978). After that,
Khazzoom (
1980) and
L. Brookes (
2000) tried to explain the rebound effect from the perspective of microeconomic utility theory, and proposed that an increase in energy efficiency does not necessarily lead to a decrease in energy demand when the total utility level of the consumer remains unchanged, but instead may lead to an increase in energy demand due to a decrease in the marginal cost of energy services. Since then, an increasing number of scholars have begun to pay attention to energy rebound, especially its size and scope (
Chen et al., 2021;
Craglia & Cullen, 2020;
Li, 2021).
To date, numerous studies have been conducted to measure the size of the rebound effect in different countries (
Belaïd et al., 2020;
Craglia & Cullen, 2020), regions (
Shao et al., 2019;
Stern, 2020), industries (
Abudureheman et al., 2022a;
Lin et al., 2017) or sectors (
S. Zhang & Lin, 2018;
Y.-J. Zhang & Peng, 2016) based on different approaches, which can be categorized into the following four strands. The first strand is mainly concentrated on estimating the magnitude of energy rebound in various countries around the world. For example,
Adetutu et al. (
2016) measured the energy rebound effects of 55 countries during 1980–2010 based on the stochastic frontier analysis (SFA) approach and conducted a comparative analysis among different countries. His research findings show that the energy rebound effect in developing countries is greater than in developed countries due to the increasing demand for energy inputs needed for economic growth in developing countries. By employing the output-oriented data envelopment method,
T. Jin and Kim (
2019) estimated the energy rebound effect in South Korea over the period 1971–2012, and found that the average rebound effect was close to 100% during this period, with the highest results occurring in 1980 and 1998, which were correlated with economic shocks and international recessions at that time. Furthermore,
J. Zhang and Lin Lawell (
2017) evaluated the energy rebound effect in China from 1991 to 2009 by using a constant elasticity of substitution (CES) production function, and found that there was a backfire effect in the energy rebound during the sample. The second strand of literature mainly concentrated on exploring the rebound effect of different sectors, such as electricity, transportation, household sector, and industries, etc. For instance, by employing the stochastic frontier model,
Meng and Li (
2022) estimated the rebound effect in electricity sector in 30 provinces of China from 2009 to 2018. The research findings show that during this period, the average rebound effect in the electricity sector reached 75.21%, with only 24.79% actual energy savings achieved, and that there were significant regional differences in the rebound effect among different areas. Using the same method,
Du et al. (
2021) explored the rebound effect of the urban residential sector in China during the period 2001–2014 and found that the average rebound effect of residents reached 65.4% during this period, in which energy prices and residents’ income level were the main factors affecting the energy rebound.
In addition, based on the index decomposition model,
Y.-J. Zhang et al. (
2017) investigated the rebound effect of energy use in Chinese industrial sectors during the period of 1994–2012, and found that the rebound effect ranged from 20% to 76% during the sample period, among which the manufacturing industry exhibited an average rebound effect of 28%. Moreover,
Zheng et al. (
2022) explored the rebound effect of the transportation sector in 30 provinces of China from 2003 to 2017 by using the nonlinear least square method. His research findings indicate that the short-term rebound effect of China’s transportation industry reached 82%, while in the long term, it reached 123%. The substitution effect of factors was identified as the primary driving force behind the rebound effect in the transportation sector. In addition, another group of literature mainly focuses on the rebound effect of specific areas. For example,
Shao et al. (
2019) assessed the energy rebound effect of Shanghai (China) by using a state space model and discovered that the average rebound effect of the region reached 93.96%, among which the secondary industry presented an average rebound of 73.10%, while the tertiary industry reached 146.61%. The expected energy savings brought about by improved energy efficiency are largely offset by the additional energy consumption resulting from technological progress.
Cansino et al. (
2022) evaluated the rebound effect in Spain over the period 2000–2014 based on a structural decomposition method and found that the total rebound effect ranged from 10% to 50% during the sample period and that economic recession has led to an increase in the rebound effect. In summary, most of the previous research mainly focuses on measuring the size and extent of the energy rebound from the perspective of different countries, regions, and industries based on various approaches; however, very few studies have focused on the drivers of the energy rebound, especially the impacts of a digital economy—a new business model and a new driving force of economic growth—on the energy rebound effect.
2.2. Studies on the Digital Economy
With the rapid development of the digital economy, an increasing number of studies are focusing on measuring the level of digital transformation and its potential impacts on society, economy, and the environment. The existing literature mainly uses two methods to measure the level of a digital economy. The first is to take a single indicator as a proxy variable to measure the development level of a digital economy. The specific proxy variables applied in the literature mainly include Internet penetration (
Lyu et al., 2022), the number of mobile phones or computers per 10,000 people (
L. Wang & Shao, 2023), the revenue of the post and telecommunications industry (
W. Zhang et al., 2022), and added new operating income of the ICT industry (
Zou & Deng, 2022). Although the calculation of a single indicator is simple and the data is easily accessible, the limitations arising from heterogeneity and singularity in indicator selection result in considerable disparities among the findings of different studies. Furthermore, given the rich and complex connotation of the digital economy, a single indicator is insufficient to comprehensively and accurately reflect the development level of a digital economy (
Abudureheman et al., 2023). The second approach is to construct a multidimensional comprehensive indicator system to measure the level of a digital economy. Scholars and some institutions have constructed a comprehensive index system from different dimensions for measuring the development level of a digital economy. For example, in 2017, the Organization for Economic Cooperation and Development (OECD) focused on the ICT industry and proposed a total of 38 sub-indicators from the dimensions of investment in intelligent infrastructure and innovation capacity to measure the comprehensive development level of the digital economy (
Pan et al., 2022). In the same year, the China Academy of Information and Communications Technology established the leading index, consistent index, and lagging index to measure the digital economy, which reflects the necessary infrastructure, industrial digitalization, and digital industrialization for the development of the digital economy (
Luo et al., 2022). Afterwards, many scholars constructed a comprehensive indicator system to evaluate the digital economy from dimensions such as industrial digitization (
Dong et al., 2022), digital industrialization (
Hong Nham & Ha, 2022), digital trade (
Yuan et al., 2021), digital finance (
Hosan et al., 2022), and network development (
Herman & Oliver, 2023), etc. So far, although much exploratory research has been conducted on the construction of a comprehensive indicator system for the digital economy, no universally unified evaluation standard has been formed to date due to the complexity and diversity of the digital economy.
As a new development mode based on high-end information technologies, the potential socio-economic and environmental impacts of a digital economy have also attracted close attention from scholars. Existing research mainly focused on exploring the effects of the digital economy on innovation efficiency (
Hojnik et al., 2023), economic growth (
Razzaq & Yang, 2023), employment (
B. Wu & Yang, 2022), welfare (
Horoshko et al., 2021), inclusive growth (
Ma et al., 2024), and carbon emissions (
M. Jin et al., 2024), etc. To be specific, by studying a panel dataset at the micro-enterprise level,
Hojnik et al. (
2023) found that the digital economy improves the innovation efficiency of enterprises by promoting the flow of digital elements among enterprises, improving the quality of human capital, expanding the boundaries of technological innovation, and changing the mode of innovation management. Based on a panel data at the urban level in China,
Razzaq and Yang (
2023) discovered that the digital economy enhances residents’ income levels, particularly benefiting lower-income groups significantly, through channels such as inclusive digital finance, digital technology, and digital skills. The positive impact of digital economy on employment have also been investigated by scholars. For example, by conducting a household-level survey in China,
J. Lu et al. (
2023) found that the digital economy significantly promotes female employment. They argue that the dividends of the digital economy tilt towards vulnerable groups in the labor market, including the low-skilled, the elderly, and rural labor, and have a positive effect on employment for women without childcare burdens. In addition, the environmental effects of the digital economy have also received close attention from academia in recent years, particularly regarding its impact on carbon emissions. Specifically, on the basis of a panel dataset from 277 Chinese cities over the period 2011–2019,
W. Zhang et al. (
2022) found that the digital economy contributes significantly to improving urban carbon emission performance. Their research findings indicate that a digital economy enhances urban carbon emission performance mainly through pathways such as reducing energy intensity and the scale of energy consumption, as well as promoting urban greening.
Dong et al. (
2022) studied the panel data of 60 countries and discovered that the development of a digital economy significantly reduced carbon emission intensity, and that this reduction was mainly achieved through the positive intermediary role of financial development and industrial structure upgrading. Furthermore, the impacts of a digital economy on income inequality (
M. Wu et al., 2024), energy transition (
L. Lu et al., 2023), ecological footprint (
Dai et al., 2023), and total factor productivity (
Abudureheman et al., 2022b;
X. Wang et al., 2023b) have also been widely discussed by scholars. However, it is noteworthy that there is a scarcity of research focusing on the potential effects of a digital economy on energy rebound and the transmission channels through which these effects might operate.
2.3. Research Gaps
According to the above literature review (i.e.,
Section 2.1 and
Section 2.2), it is evident that previous studies have carried out extensive exploration on the energy rebound effect and the digital economy from different perspectives. However, the potential relationship between digital economy development and the energy rebound remains underexplored, presenting several critical research gaps. First, it is unclear whether the digital economy exacerbates or mitigates the energy rebound effect, or whether their relationship follows a nonlinear pattern. While the digital economy’s energy-intensive infrastructure may drive rebound effects, its advancements in smart technologies and efficient resource allocation could suppress them. Existing studies have not systematically examined this duality, leaving the net effect unresolved. Second, the mechanisms through which a digital economy influences energy rebound lack empirical scrutiny. Previous research has overlooked the underlying pathways, hindering a nuanced understanding of causality. Third, no prior study investigates potential nonlinearities (e.g., threshold effects) in the digital economy–energy rebound nexus, particularly how energy efficiency levels might modulate this relationship. Such insights are vital for context-specific policy design.
3. Theoretical Analysis and Hypotheses
3.1. Direct Impact of Digital Economy Development on Energy Rebound
With the rapid development of the digital economy, high-end digital technologies, such as artificial intelligence (AI), big data, and cloud computing, have enhanced the overall competitiveness of enterprises, improved their research and development, design, manufacturing, market operations, and management models. Moreover, the extensive use of digital technologies facilitates the frequency of information exchange, effectively addressing the imbalance between the supply and demand for energy in both production and daily life, thereby minimizing unnecessary energy waste and improving energy use efficiency. At the same time, the development of the digital economy accelerates the spread of digital infrastructure, and the construction of network equipment, data centers, and ICT (Information and Communication Technology) industries; these need a large amount of energy input, which inevitably increases energy consumption. This will, to some extent, offset the potential energy savings that could have been achieved through improved energy efficiency, thereby potentially leading to an energy rebound effect. A study by
B’echir Ben Lahouel et al. (
2021) simulated energy consumption in the ICT sector and found that the ICT sector’s share of electricity consumption will increase to 6–21% in 2025 and 8–51% in 2035. Similarly,
Hu and Man (
2023) also found that the application of information technologies increased the energy consumption of the power sector. Therefore, we propose the following hypothesis:
Hypothesis 1. The development of a digital economy has a positive impact on the energy rebound effect.
3.2. Indirect Impact of Digital Economy Development on Energy Rebound
With the continuous development of digital technology and the deepening expansion of its applications, the impact of digital transformation on energy efficiency becomes increasingly pronounced and far-reaching (
J. Wu et al., 2023). By introducing advanced technologies such as AI, big data, and IoT, energy systems have undergone a comprehensive intelligent upgrade from production to consumption (
Huang et al., 2023). This transformation significantly enhances the precision and transparency of energy use, leading to a notable improvement in energy efficiency (
Q. Wang et al., 2023a). For instance, big data analytics helps identify inefficient links in energy use, providing strong support for energy conservation and consumption reduction. Through machine learning algorithms, AI systems are capable of continuously learning and refining strategies for energy dispatch, enhancing both the utilization efficiency and stability of energy resources (
Abudureheman et al., 2023). Notably, improved energy efficiency leads to a decrease in the cost of production factors, enabling profit-maximizing firms to substitute more energy inputs for other production factors, thereby increasing production scale and profits. Ultimately, the potential energy savings from improved energy efficiency are partially or fully offset by additional energy consumption, thus resulting in a certain degree of energy rebound effect. Accordingly, this study puts forward the following hypothesis:
Hypothesis 2. The digital economy indirectly influences the energy rebound effect by impacting energy efficiency.
4. Methodology and Data
4.1. Econometric Methodology
4.1.1. Benchmark Model
To examine how a digital economy affects the energy rebound effect, this study constructs an Extended-STIRPAT environmental impact assessment model based on the STIRPAT model developed by Dietz and Rosa in 1997. The specific formula for the STIRPAT model is as follows,
where
i and
t represent region and time;
represents environmental impact; and
P,
A, and
T represent population, affluence, and technological level, respectively.
are the corresponding parameters to be measured.
is the constant term and
represents the random disturbance term.
Considering the potential heteroscedasticity issue, this study takes the logarithm of both sides of Equation (1) as follows.
We incorporate the energy rebound effect, the digital economy, and other potential factors that may influence energy rebound into the STIRPAT model (i.e., Equation (2)), and construct an Extended-STIRPAT model in this study. To be specific, environmental impact (
I) is represented by energy rebound (
RE); and Population (
P) and affluence (
A) are denoted by population size (
Pop) and economic growth (
GDP), respectively. Since the digital economy is based on advancements and innovations in digital technology, its development level can to some extent reflect the technological development level of a region. Therefore, this paper uses the development level of a digital economy (
DIG) to represent the technological level (
T). In addition, considering potential factors that may affect energy rebound, we also introduce some control variables to the model, such as energy prices (
Epr), industrial structure (
Str), and environmental regulations (
ENR). Finally, to dynamically capture the changing characteristics of energy rebound over time, this study constructs the following dynamic Extended-STIRPAT model:
where
is the energy rebound effect, and
represents the digital economy;
,
and
denote economic growth, population, and energy prices, respectively.
is the industrial structure and
indicates environmental regulation;
are the coefficients to be estimated. The meanings of other parameters are similar to Equation (2).
4.1.2. Model of the Mediating Effect
To examine the influencing mechanism of a digital economy on the energy rebound effect, this study constructs the following intermediate-STIRPAT model:
where
lnDEPI is the mediating variable (i.e., dynamic comprehensive energy efficiency) and
represents all the control variables included in the model;
are the parameters to be estimated; and
is the disturbance term. If the key observed parameters
and
are all significant, it indicates that
lnDEPI can be an effective mediator in the nexus between digital economy and energy rebound.
4.1.3. Dynamic Threshold Model
We establish a dynamic threshold-STIRPAT model to test the nonlinear effect of a digital economy on energy rebound as follows,
where
represents the explicit function, and
is the threshold value;
denotes the threshold variable, that is, the dynamic comprehensive energy efficiency.
,
are the parameters to be estimated;
and
express the constant term and disturbance term, respectively. The meanings of other symbols are similar to Equation (3).
4.2. Explanation of the Variables
4.2.1. Core Explained Variable—Energy Rebound Effect
This study constructs a rebound effect measurement model based on the neoclassical economic theory framework, which focuses on energy efficiency elasticity and energy consumption. Assuming the elasticity of energy consumption with respect to an increase in energy efficiency per unit is
, then we have
where
E represents energy consumption, and
represents energy efficiency. Then, the rebound effect (
RE) can be expressed as the following:
Accordingly, the rebound effect (RE) can be obtained by estimating the elasticity of energy consumption to energy efficiency.
The optimal energy consumption of a business depends on factors such as energy prices, output levels, and energy efficiency. Therefore, this paper assumes the following natural logarithmic function relationship:
where
indicates energy consumption;
,
,
represent energy price, real GDP, and energy efficiency, respectively.
is the constant term, and
denotes perturbation term. For a certain degree of improvement in energy efficiency, firms need a period of adjustment to change their energy usage rather than an immediate response. Therefore, this paper also takes into account the actual energy consumption during the dynamic adjustment process:
where
represents the adjustment ratio. By combining Equation (11) with Equation (12), we obtain the following:
where
,
. Performing a second-order Taylor expansion on
yields the following:
By estimating the stochastic frontier model (Equation (14)), the energy efficiency elasticity in the short run (
) and long run (
) can be obtained.
Finally, based on Equation (10), we can calculate the energy rebound effect in both the short and long term.
4.2.2. Core Explanatory Variable—Digital Economy
The core explanatory variable of this study is digital economy (denoted as Dig). At present, there is no unified standard for measuring the level of a digital economy globally; besides, the development patterns of a digital economy vary from country to country. Therefore, it is necessary to build a comprehensive indicator system for the assessment of a digital economy based on the country’s actual situation. The “14th Five-Year Plan of China for the Digital Economy Development” clearly states that it is necessary to strengthen the construction of the digital infrastructure, improve the development environment of the digital economy, accelerate the pace of industrial digitization and digital industrialization, continuously improve the level of digital economy development, and achieve the goal of becoming a world leading digital economy power by 2035. Digitalization has become the main direction of China’s economic development in the future. Therefore, based on the “14th Five-Year Plan of China for the Digital Economy Development”, this study constructs a comprehensive indicator system for the assessment of the digital economy in China from the perspectives of the digital economy carrier, industrial digitalization, digital industrialization, and the digital economy development environment. One of the important innovations of our indicator system is that we evaluated the industrial digitalization from the perspectives of the development and application of cutting-edge digital technologies in industries for the first time, as no previous research has measured it from this dimension before. The specific explanation of the indicator system is as follows.
Firstly, the carrier of the digital economy serves as the foundation for the development of the digital economy; therefore, this study employs the digital infrastructure as a measure of the digital economy carrier, which include 3 measurements as shown in
Table 1. Secondly, industrial digitalization and digital industrialization are the ultimate goal of the digital economy development. Regarding industrial digitalization, the cutting-edge digital technologies, such as artificial intelligence (AI), big data, cloud computing, and Internet of Things (IoT), are the core technologies in the digital transformation of industries. However, to date there is no precedent for studies to try to quantitively evaluate the industrial digitalization from the insights of the development and application of these cutting-edge digital technologies in industries. To fill this research gap, we creatively evaluated the level of industrial digitalization from the perspectives of the development and application of the high-end digital technologies (i.e., AI, big data, cloud computing, and IoT) in industries for the first time, which include 4 sub-indicators and 12 measurements as shown in
Table 1.
As regards the digital industrialization, considering the availability of data, this study measures it with representative digital industries, namely the electronic information manufacturing industry, telecommunications industry, and Internet industry, which consists of 3 sub-indicators and 7 measurements as shown in
Table 1. In addition, a favorable environment for the development of the digital economy is a crucial guarantee for the sustainable development of the digital economy. Therefore, we measure the development environment of the digital economy from the perspectives of the market environment and innovation environment as shown in
Table 1. In summary, the indicator system for the evaluation of digital transformation consists of 4 categories, 10 sub-indicators, and 24 specific measurements (as shown in
Table 1), which can effectively and comprehensively reflect the digitalization level of China.
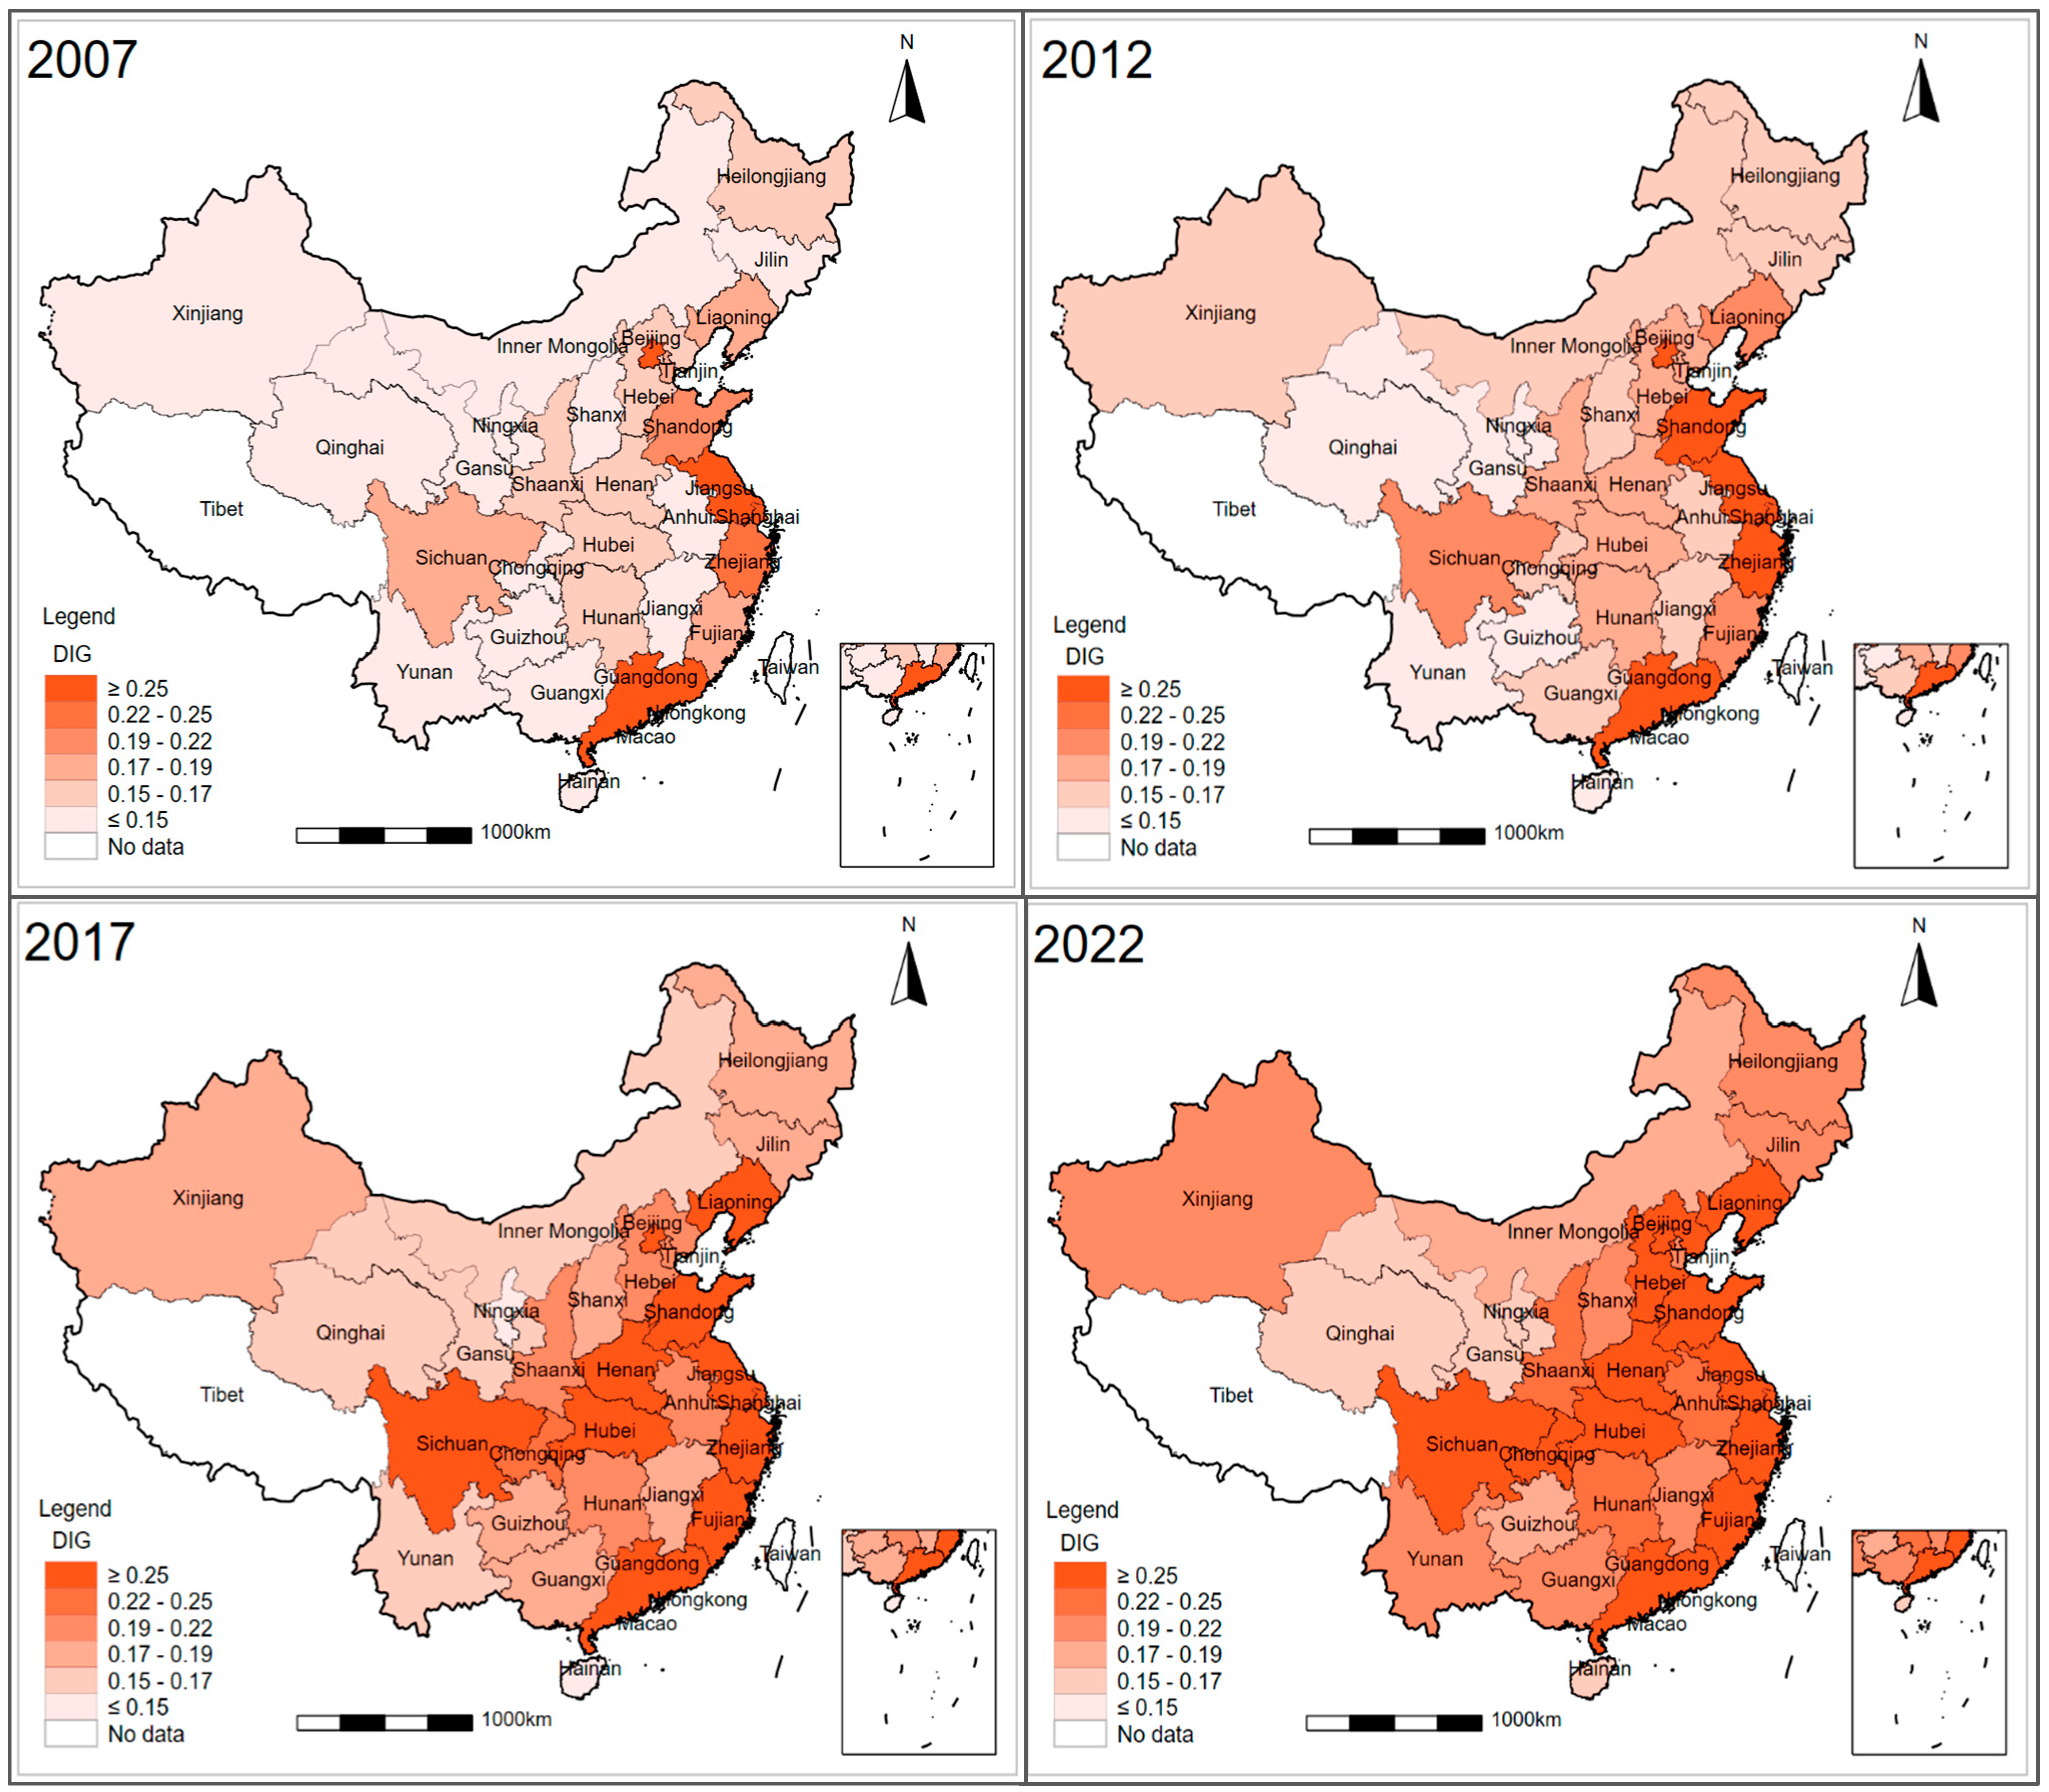
Figure 1 depicts the measurement results of the digital transformation for 30 Chinese provinces over the sample year. From
Figure 1, it can be observed clearly that the level of digitalization in China has been increasing significantly in recent years, and provinces with higher levels of digital economy are mainly concentrated in the eastern region, while provinces with a lower level of digital economy are mainly distributed in the central and western regions, showing an obvious spatial agglomeration effect.
4.2.3. Mediating Variable
According to the analysis in
Section 3, energy efficiency can be a potential mediator between the digital economy and energy rebound. Regarding the measurement of energy efficiency, most of the previous studies have adopted single-factor or static energy efficiency indicators to represent the level of energy efficiency. Different from these studies, this paper creatively constructs a dynamic comprehensive energy efficiency index that fully considers various input factors such as capital, labor, and energy consumption and changes in energy technology progress, as well as the energy utilization efficiency, to assess the level of energy efficiency. Therefore, the dynamic comprehensive energy efficiency index can comprehensively and dynamically reflect energy efficiency performance, overcoming the limitations of the single-factor and static energy efficiency indicators used in previous research. We assume that the production function is as follows,
where the input factors K, L, and E represent capital, labor, and energy consumption, respectively. Y denotes the desired output factor—GDP. Capital investment and GDP are converted using constant prices at the base year.
To measure the dynamic comprehensive energy efficiency of each province, it is first necessary to estimate the Shephard energy distance function. The Shephard energy distance function is used to measure the maximum possible reduction in energy input while keeping other input factors constant within the production possibility set. According to
Boyd and Pang (
2000), the Shephard energy distance function is defined as
The reciprocal of the Shephard energy distance function can be used to measure the energy efficiency of different units at the same time scale, which is thus referred to as static energy efficiency. In this study, we construct a dynamic comprehensive energy efficiency index (DEPI) to reflect the dynamic changes in energy efficiency over time as follows,
where
(or
) indicates the improvement of energy efficiency (or the deterioration).
can be further decomposed into
where the first term (
) represents the static efficiency changes of each unit, while the second term (
) denotes the changes in energy technological progress from period
t to
t + 1. Considering the significant advantages of the Stochastic Frontier Analysis (SFA) method in handling statistical noise and addressing technological heterogeneity, this study employs the SFA technique to estimate the Shephard energy distance function and express the estimation model as follows,
where
is an unknown function,
represents the unobserved individual effects, and
denotes the random disturbance term. By using a second-order Taylor series expansion to approximate Equation (21), we obtain the following:
Since the Shephard energy distance function is linearly homogeneous with respect to energy input factors, the following relationship can also be derived.
Combining Equations (22) and (23) yields the following:
where
represents the energy inefficiency term, which follows an independent positive normal distribution
. Based on the estimation results of Equation (24), we can calculate the static energy efficiency of each unit using the following equation:
where
. Therefore, the change in static energy efficiency is computed according to the following equation:
The change in energy technology progress is further obtained by calculating the following equation:
Finally, the dynamic comprehensive energy efficiency (
DEPI) can be obtained as the product of
and
:
4.2.4. Control Variables and Data Sources
Considering potential factors that may affect energy rebound, this study also introduced some control variables to the model, such as economic growth, energy prices, industrial structure, population level, and environmental regulations. Specifically, economic growth (
lnGDP) is represented by provincial GDP, which is deflated using constant prices with 2006 as the base year. Regarding energy prices, since official data on energy prices at the provincial level has not yet been released, this study takes the fuel and power purchase price index as a proxy for energy prices (
lnEpr). The industrial structure (
lnStr) is represented by the ratio of the added value of the secondary industry to that of the tertiary industry. The population level (
lnPop) is denoted by the year-end population of each province. As for the environmental regulation (
lnENR), this study measures it by the proportion of pollution control investment to total output in each province. The data for the above variables are sourced from the
China Energy Statistical Yearbook,
China Statistical Yearbook,
China Environmental Statistical Yearbook,
China Science and Technology Statistical Yearbook, and the statistical yearbooks of each province.
Table 2 reports the descriptive statistics of each variable.
5. Estimation Strategies and Empirical Results
5.1. Analysis of Energy Rebound Effect in China
We calculated the economy-wide rebound effect in different regions of China employing the SFA technique, and
Table 3 displays the average values and rankings over 2007–2022. It can be observed that the average economic rebound effect in China reached 77.14%, indicating a significant partial rebound effect. This implies that the expected energy savings from improved energy efficiency were partially offset by the additional energy consumption, resulting in a discounted realization of the expected energy savings. The top five provinces with the largest rebound effects were Guangxi (92.16%), Henan (88.97%), Sichuan (87.08%), Anhui (86.35%), and Guizhou (85.85%), all of which exceed the national average and are located in the western region except for Henan and Anhui. Conversely, the five provinces and municipalities with the lowest rebound effects are Shanghai (52.89%), Beijing (57.63%), Hainan (61.89%), Tianjin (62.31%), and Inner Mongolia (65.89%), all of which are below the national average and located in the eastern coastal region except for Inner Mongolia.
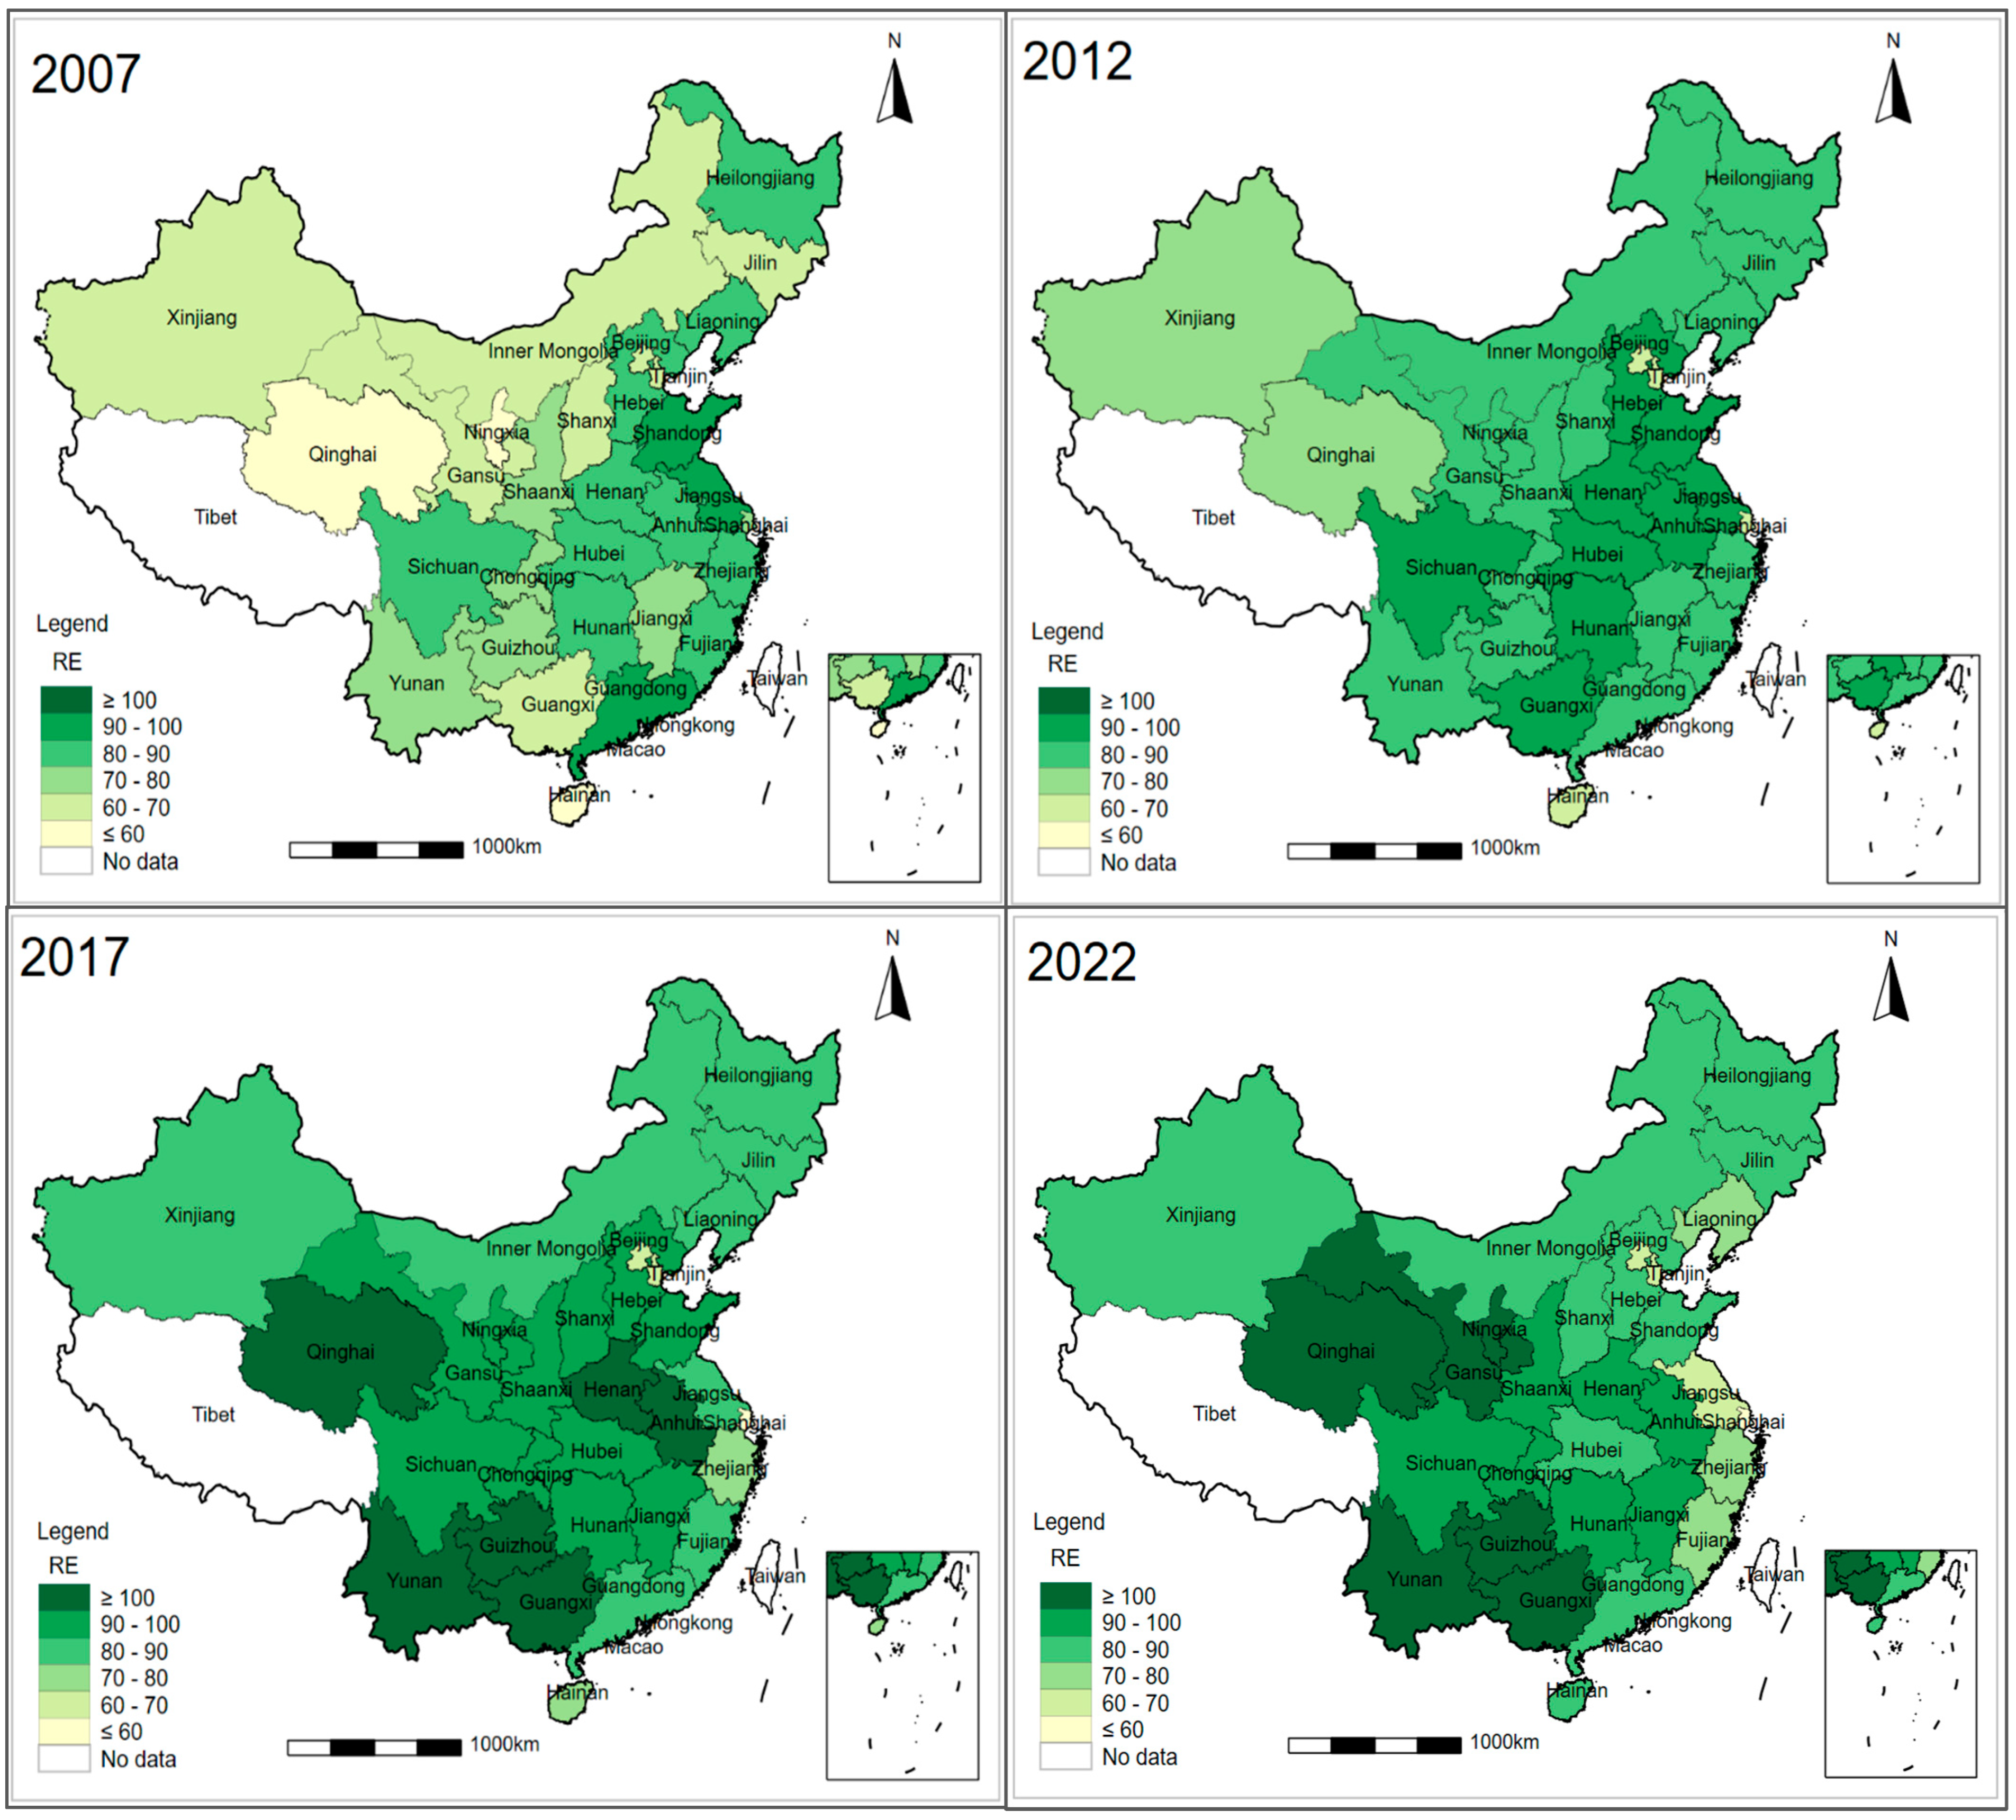
Figure 2 more intuitively illustrates the temporal and spatial trends of energy rebound effect across different regions of China. From the perspective of temporal evolution, within the sample period, the energy rebound effects in provinces showed a gradually increasing trend. From the perspective of spatial distribution, provinces with a higher level of energy rebound are concentrated in the western regions of China, whereas previously such concentration was in the eastern region to central region. This shift may be due to the rapid economic growth of western regions in recent years. In December 2016, the National Development and Reform Commission of China released the “Thirteenth Five-Year Plan for the Large-Scale Development of the Western Region” emphasizing a comprehensive deepening of reform and opening up, promoting infrastructure construction in the western region, striving to enter a new stage of industrial development, and advancing new achievements in the economic development of the western region. Driven by these policies, the economy of the western region has experienced rapid growth in the past few decades. However, the development of the economy requires a large amounts of energy input, and as the western region is the least developed area in China with great potential for economic growth. It therefore exhibits a high elasticity of energy consumption in response to the reduction in energy usage costs brought about by increased energy efficiency, which leads to a significant energy rebound in the region.
5.2. Benchmark Regression Analysis
In this Section, we proceed to explore how digital economy development affects the energy rebound effect. Before conducting the benchmark regression analysis, it is necessary to test the stationarity and cross-sectional correlation of the variables to ensure the validity and reliability of the estimation results. Ignoring the correlation between cross-sectional units in panel data may affect the validity of the estimation results, leading to inconsistent estimates (
Abudureheman et al., 2022b). Therefore, this study employs the Breusch-Pagan LM test (
Breusch & Pagan, 1980), the Pesaran CD test (
Pesaran, 2004), Friedman test (
Friedman, 1937), and the Frees test (
Frees, 2004) to examine cross-sectional correlation. The test results are presented in
Table 4. As can be seen from the table, all the four tests reject the null hypothesis of no cross-sectional correlation at the 1% significance level, indicating that there is significant correlation among the cross-sectional units in the sample panel data. Therefore, it is necessary to consider the correlation between cross-sectional units in the subsequent empirical estimation.
To ensure the stationarity of each variable, this study further conducts unit root tests for all observed variables. Taking into account the aforementioned cross-sectional correlation in the panel data, this study employs the Pesaran CADF and CIPS tests proposed by
Pesaran (
2007) to conduct unit root tests for each variable. The test results are presented in
Table 5. It can be observed that only some of the variables are significant at their original levels, hence, first differencing is required for each variable. After first differencing, all variables pass the significance tests, rejecting the null hypothesis of the existence of a unit root. This implies that the variables used in this study need to be first differenced.
After checking the stationarity and cross-sectional correlation of the variables, we proceed to estimate the baseline model (i.e., Equation (3)) in this step. Considering that the baseline model (i.e., Equation (3)) is a dynamic model, traditional ordinary least squares (OLS) regression may lead to biased estimates, and there might be interactions between the lagged dependent variable and the random error term. Therefore, this study employs the system generalized method of moments (Sys-GMM), which is suitable for dynamic models. Sys-GMM can estimate both the horizontal and differential equations simultaneously, and introduce more instrumental variables to improve the estimation efficiency.
Table 6 displays the corresponding estimation results. It can be seen that AR (1) passes the significance test while AR (2) does not, indicating that the disturbance term meets the requirement of no autocorrelation. Moreover, the
p-values for the Hansen test are all greater than 0.1, indicating that the instrumental variables selected by the model are valid, which supports the effectiveness of the Sys-GMM estimation results.
From
Table 6, we can see that the elasticity coefficient of the digital economy on energy rebound is 0.062, which is significant at the 1% statistical level. When control variables are sequentially added to the model, the coefficient still remains significantly positive, suggesting that the development of the digital economy positively affects energy rebound, which supports Hypothesis 1. The possible reason for this is that the development of the digital economy promotes the improvement of energy efficiency through various channels such as facilitating technological innovation, human capital accumulation, and industrial digitalization. Improved energy efficiency leads to a decrease in the cost of production factors, enabling profit-maximizing firms to substitute more energy inputs for other production factors, thereby increasing production scale and profits. Ultimately, the potential energy savings from improved energy efficiency are partially or fully offset by additional energy consumption, thus resulting in a significant energy rebound effect.
With respect to the control variables, the elasticity coefficients of economic growth (lnGDP) and population (lnPop) on energy rebound are both significantly positive, indicating that population and economic growth will have a positive impact on energy rebound. Since the processes of population and economic growth are accompanied by a substantial consumption of energy resources, the growth of population and economy will promote energy rebound. The coefficient of the energy price (lnEpr) is significantly negative at 1% level, suggesting that energy price negatively influences energy rebound. When the level of energy efficiency improves, the cost of energy factors decreases, leading to a reduction in energy prices. The decrease in energy prices leads to an increase in energy consumption, which in turn offsets the expected energy savings that could have been achieved through increased energy efficiency, ultimately causing an energy rebound. The coefficient of the industrial structure (lnStr), represented by the proportion of the added value of the secondary industry to tertiary industry, is significantly positive. This implies that the increase in the share of the secondary sector is not conducive to mitigating the energy rebound. Given that the secondary industry accounts for a large proportion of China’s economic structure and that most industries within the secondary sector are high-energy-consuming and high-emission industries, the increase in the share of the secondary industry will not be conducive to effectively mitigating energy rebound. The coefficient of environmental regulation (lnENR) is significantly negative, indicating that environmental regulation is conducive to inhibiting energy rebound. With the strengthening of environmental supervision, enterprises will have increased awareness of environmental protection, energy conservation, and emission reduction. By setting sustainable and eco-friendly production goals and continuously optimizing their production processes, enterprises can effectively utilize energy resources and prevent excessive energy use and waste, thereby helping to mitigate energy rebound.
5.3. Robustness Analysis
To ensure the robustness of the benchmark estimation results, we carried out robustness checks from the following three perspectives. (i) The comprehensive indicator of the digital economy was recalculated using the entropy-TOPSIS method, and we re-estimated the benchmark model Equation (3). The corresponding results are shown in the first column of
Table 7, from which we can see that the coefficient of the digital economy is significantly positive, supporting the robustness of the benchmark estimation results in
Table 6. (ii) A new control variable,
lnEnst, representing the energy structure (denoted by the proportion of fossil energy in total energy consumption), was added to the model, and we re-estimated the benchmark model (i.e., Equation (3)) again. The estimated results are reported in the second column of
Table 7. We found that the core explanatory variable (i.e., digital economy) still showed a positive value, which again supports the main conclusions of the benchmark estimation in
Section 5.2. (iii) The digital economy variable was substituted with indicators of digital industrialization and industrial digitalization, and we re-estimated the baseline model Equation (3). The third and fourth columns of
Table 7 show the corresponding estimation results, from which we can see that the coefficient of the digital economy still remains significantly positive. The magnitude and significance of the coefficient are largely consistent with the benchmark regression results in
Table 6 in
Section 5.2, indicating that the estimation results of this study are robust.
5.4. Endogeneity Analysis
Due to the potential reverse causality between economic variables, it is necessary to check endogeneity in order to obtain effective and consistent estimation results. We employed the instrumental variable method to effectively address the potential endogeneity problem. The interaction term between the number of postal and telecommunications bureaus in each province in 1984 and the number of telephones per 100 people lagged by one period was used as an instrumental variable for the digital economy. From the perspective of relevance, the distribution of post offices may affect the distribution of fixed telephones, thus affecting the accessibility of the early Internet and the popularity and growth of the Internet (
Xue et al., 2022). Therefore, it may affect the development of the digital economy and digitalization process. From the exogenous perspective, there has historically been little effect between the number of post offices and the energy rebound effect. Accordingly, the instrumental variable selected in this study can meet the two important conditions of externality and correlation. We employed the two-stage least squares method (2SLS) for the endogeneity test and the corresponding results are reported in the last column of
Table 7 from which we can see that the F-statistic value in the first stage is much greater than the empirical value of 10, indicating that there is no weak instrumental variable problem. Secondly, the Hansen test results support the null hypothesis that instrumental variables are exogenous. Therefore, the instrumental variable selected in this study is valid. The 2SLS estimation results show that the coefficient of the digital economy is significantly positive at the 1% level, and the coefficient size is basically consistent with the benchmark estimation outcomes in
Table 6, thus reconfirming the effectiveness of our findings against potential endogeneity concerns.
6. Further Discussion
6.1. Mediating Effect of Energy Efficiency
In
Section 3, we theoretically analysed the influencing mechanism of a digital economy on energy rebound, and proposed a mechanism hypothesis that the digital economy affects energy rebound effect through its impact on energy efficiency. To test whether energy efficiency serves as a mediator between the digital economy and energy rebound effect, we will next establish the mediation-STIRPAT effect model (as shown in
Section 4.1.2) to further examine the intrinsic influence mechanism of the digital economy on the energy rebound.
Table 8 displays the examination results.
Model (4) in
Table 8 presents the overall impact of the digital economy on energy rebound. From the estimation results, it can be seen that the coefficient of the digital economy is significantly positive at the 1% level, indicating that the development of the digital economy positively affects energy rebound, which once again supports the conclusions of the benchmark model. Model (5) shows the estimation results of the digital economy on the key mediator—energy efficiency, from which we can see that digital economy has a significant positive impact on energy efficiency at the 1% level. This demonstrates that the development of the digital economy contributes to the improvement of energy efficiency. Model (6) explains the potential impacts of energy efficiency on the energy rebound effect. From its examination results we can see that the estimated value of energy efficiency on energy rebound is significantly positive, suggesting that energy efficiency has a positive impact on the energy rebound. Model (7) incorporates the main explanatory variable (i.e., digital economy) and the mediator (i.e., energy efficiency) at the same time and examines their comprehensive effect on energy rebound. From the estimation results we can see that both the coefficients of the digital economy and energy efficiency are significantly positive at the 1% level, indicating that energy efficiency plays a mediating role between the digital economy and energy rebound. Based on the above examination results, it can be concluded that the digital economy not only directly impacts the energy rebound but also indirectly influences it through the mediating effect of energy efficiency, which confirms Hypothesis 2. The development and application of emerging digital technologies promote intelligentization and digitalization of production, manufacturing, and consumption processes. This leads to the intelligent management and monitoring of energy supply and consumption systems, improving the efficiency of resource allocation and energy utilization. At the same time, increased energy efficiency reduces the cost of using energy resources for producers and consumers. This reduction in costs incentivizes profit-maximizing firms and utility-maximizing consumers to substitute more energy inputs (or services) for other production factors (or services), aiming to maximize production profits and individual utility. As a result, the expected energy savings from increased energy efficiency are partially or fully offset by additional energy consumption, leading to a certain degree of energy rebound effect.
6.2. Threshold Effect Analysis
As demonstrated in
Section 6.1, the indirect impact of the digital economy on energy rebound is mediated by energy efficiency, and the increase of energy efficiency positively affects the energy rebound. To this end, another question sparks our interest: Could the influence of the digital economy on energy rebound have a threshold effect regarding energy efficiency? However, to date, there has been no pioneering research that has explored this question. Therefore, this paper, for the first time, investigates the threshold effect of the digital economy on energy rebound from the perspective of energy efficiency based on a dynamic threshold-STIRPAT model (as shown in
Section 4.1.3).
Before estimating the model, a series of statistical tests need to be conducted to determine whether there is a threshold effect and the number of thresholds for the threshold variable. In this study, we set energy efficiency (
lnDEPI) as the threshold variable, and employed the Bootstrap technique and Likelihood Ratio test (LR) to determine the existence of a threshold effect and the number of thresholds.
Table 9 displays the corresponding results, from which it can be observed that the single threshold passed the significance test at 1% level, while the double threshold did not, indicating that the threshold variable only has a single threshold. Moreover, based on the LR test results, the corresponding single threshold for the threshold variable (
lnDEPI) is −0.193 within the 95% confidence interval.
Based on the above test results, a single-threshold STIRPAT model estimation was conducted with energy efficiency (denoted as
lnDEPI) as the threshold variable. The estimation results are shown in the first column of
Table 10. An interesting finding from the results is that the impact of the digital economy on the energy rebound differs significantly depending on the level of energy efficiency, which can be divided into two stages. First, when
lnDEPI is less than −0.193, the elasticity coefficient of the digital economy on energy rebound is 0.127, which is statistically significant at the 1% level, indicating that in this stage, the development of the digital economy significantly promotes energy rebound. When
lnDEPI exceeded the threshold of −0.193, the coefficient of the digital economy on energy rebound became negative (−0.013) and passed the statistical test at the 10% significance level, meaning that in this stage, the development of the digital economy helps to suppress energy rebound. In other words, the impact of the digital economy on energy rebound creates a threshold effect with regard to energy efficiency. One possible reason is that when the level of energy efficiency is low, due to the process of infrastructure construction, digital technology and equipment application required in the early development of the digital economy will require a large amount of energy input; the energy efficiency benefits brought about by digital economy development at this stage are offset by the increased energy consumption, resulting in a larger energy rebound. However, when the level of energy efficiency increases and surpasses a certain critical threshold, the advanced digital technologies, smart production, and digital lifestyles associated with a higher level of digital economy development can fully leverage their energy-saving potential. Therefore, at this stage, the benefits of energy efficiency improvement brought about by the digital economy outweigh the additional energy consumption, effectively reducing unnecessary energy waste and maximizing the actual energy savings achieved through efficiency improvements, thereby helping to mitigate the energy rebound effect. In addition, to ensure the robustness and validity of the above estimation results, this study uses the digital economy comprehensive index (
lnDIG) measured by entropy-TOPSIS method and the first-order lag term of
lnDIG to replace the digital economy variable, and re-estimates the dynamic threshold-STIRPAT model again. The corresponding results are shown in the second and third columns of
Table 10. From the results of Model (9) and (10), it can be observed that the threshold effect of energy efficiency still exists. The magnitude and significance of the coefficients for
lnDIG, as well as the number and size of the thresholds, remain basically consistent with those in Model (8). This supports the main finding that the impact of the digital economy on energy rebound creates an inverted “U-shaped” trend, initially positive and then turning negative. Therefore, the regression results of the threshold-STIRPAT model are robust.
7. Conclusions and Policy Implications
This study carried out a systematic exploration of the underlying impacts of the digital economy on energy rebound for the first time, using a panel dataset from China. The transmission mechanism and threshold effects of the digital economy on energy rebound have also been discussed. There are several noteworthy findings.
First, most of the regions in China exhibited a partial rebound effect over the period 2007–2022, meaning that the potential energy savings expected from improvements in energy efficiency were partially offset by the rebound effect, resulting in a discounted realization of theoretical energy savings. This reveals that despite the continuous improvement in energy efficiency over the past decade, energy consumption in China has still been on the rise. On the other hand, it also implies the importance of considering the rebound effect in energy-saving policies.
Second, the estimation results of benchmark model indicate that the digital economy positively impacts the energy rebound effect, and this influence is mainly mediated through improvements in energy efficiency.
Third, the threshold-STIRPAT model estimates suggest that the impact of the digital economy on energy rebound creates a threshold effect with regard to energy efficiency. In other words, when the energy efficiency is low, digital economy development positively impacts the energy rebound; however, as the energy efficiency increases and surpasses a certain critical threshold, the digital economy can help mitigate the energy rebound effect.
Several policy implications are highlighted based on the primary findings of this study.
Firstly, the energy rebound effect should be raised from the theoretical discussion to the policy level. So far, the concept of the energy rebound effect remains largely within the realm of theoretical research and has not been integrated into policy-making, often being overlooked in the formulation of energy and environmental policies. Given that the existence of the rebound effect undermines the potential energy savings that could result from improved energy efficiency, leading to inconsistencies between efficiency improvements and energy conservation targets, a viable strategy for climate change mitigation should take the energy rebound effect into account and elevate it to the policy level. With the assistance of digital technologies such as big data, artificial intelligence, and cloud computing, we could simulate the additional energy consumption resulting from improvements in energy efficiency, and then design corresponding policy measures to curb excessive energy consumption in advance in order to prevent a large energy rebound and the environmental damage it may cause.
Secondly, the primary findings of this study illustrate that when energy efficiency is low, digital economy development positively impacts the energy rebound; however, as the energy efficiency increases and surpasses a certain critical threshold, the digital economy can help mitigate the energy rebound effect. As the digital economy promotes improvements in energy efficiency, it is important to advance both the development of the digital economy and energy efficiency. This combined effort will maximize the energy-saving effects of energy efficiency improvements and ultimately reduce the energy rebound effectively. On one hand, local governments should strengthen the construction of new types of digital infrastructure, especially to increase investment in various digital platforms based on high-end digital technologies such as big data, blockchain, and 5G base stations. It is crucial not only to focus on the quality of digital infrastructure but also to enhance its accessibility, especially in rural and remote areas. By establishing incentive mechanisms such as subsidies, tax reductions, and special funds, the government should encourage local enterprises to accelerate their digital transformation and upgrade. In addition, local governments should further increase the quantity and quality of digital industries, such as ICT companies, internet firms, and electronic information enterprises. Through information technology advancements and digital management innovations, they could form digital supply chains and clusters of digitalized industries, and continuously enhance the breadth and depth of digital industrialization. On the other hand, it is necessary to strengthen the level of innovation in the energy sector, accelerate the pace of energy technology advancement, and improve the energy utilization efficiency. At the government level, increase investments in energy-saving technologies and provide enterprises with policy supports such as tax incentives and subsidies. At the enterprise level, corporates should actively engage in independent research and development while also introducing high-efficiency energy-saving technologies to continuously reduce energy consumption per unit of production and improve energy efficiency.
Thirdly, the empirical results show that energy prices and environmental regulations can significantly mitigate the energy rebound effect. Therefore, an effective mechanism should be established for energy prices to self-adjust in a timely manner according to market fluctuations, to avoid overly reductions in energy prices that could lead to a significant increase in energy consumption and consequently result in a substantial energy rebound. In addition, it is necessary to fully leverage the mitigating effect of environmental regulation on energy rebound by moderately increasing the stringency of environmental regulations to stimulate enterprises to innovate in energy technologies, improve their energy usage efficiency, and reduce excessive energy use and waste, thereby inhibiting the occurrence of a large energy rebound.


