Abstract
Economic growth can bring material prosperity and improvements in public services to a country yet can simultaneously lead to environmental pollution that threatens population health, which has important implications for shaping macro-level policies. Here, we investigate the relationship between economic growth and mortality attributable to air pollution in China from 2002 to 2021, using data analyzed with Stata 18 software. We identify a counterintuitive U-shaped relationship between the two, with the coefficient of the primary term for economic growth at −1.222 and the quadratic term at −0.053, both statistically significant at the 1% level. The inflection point, with accounting for control variables, is calculated to be 99,708 yuan (CNY) per person. These results withstand different empirical testing. We then perform heterogeneity analyses at the city level and find that disparities in social, economic, and physical geographical conditions lead to an unequal mortality burden that persists. Economic growth may have negative impacts on population health after crossing a certain threshold, although the effects vary across different regions. Our findings reveal that the benefits of economic growth may not “trickle down” to improve population health. Policymakers cannot take economic growth as an intrinsic good that would inevitably lead to better population health. Greater emphasis should be placed on egalitarian welfare systems, investments in environmental improvements, and other life-supporting priorities, as these measures could mitigate the negative health impacts of economic growth and promote a virtuous cycle between the economy and population health.
1. Introduction
Air pollution has become a major threat to global population health, increasing the risks of hospitalization and premature mortality. In 2019 alone, there were 6.67 million life losses due to air pollution, making it the fourth-leading cause of deaths worldwide (Health Effects Institute, 2020). Epidemiological studies have established robust causal associations between long-term exposure to ambient particulate matter (PM) with diameter less than or equal to 2.5 µm (PM2.5) and mortality burden from a variety of diseases, including cardiovascular disease, respiratory disease, lung cancer, and lower respiratory infection, thereby substantially reducing life expectancy (Apte et al., 2015; Brook et al., 2010; Southerland et al., 2022). Although stern policies on end-of-pipe pollution abatement have been implemented to reduce the concentration of PM2.5, 99% of the world population was living in places where the World Health Organization’s (WHO’s) strictest air quality guideline (5 µg/m3) were not met (Air pollution note—Data you need to know, 2021). To make things worse, the global imbalance in regional development and aging population are making this problem more intractable, particularly to low- and middle-income countries (LMICs) (Rentschler & Leonova, 2023). As the largest emerging economy in the world, China has experienced remarkable economic transition over the past decades, providing improved nutrition, medical, and public health services to its citizens. However, along with vigorous development of industrialization and high spatial concentration of economic activities, air pollution, especially the high PM2.5 concentration, has always been a thorny issue. Nowadays, air pollution in China causes more than 1 million premature deaths each year and ranks first among many environmental concerns in terms of health (Shen et al., 2017; Y. Liu et al., 2022). The Chinese government has made great efforts in addressing this problem, but the outcomes have fallen short of expectations (J. Wang et al., 2017; C. Q. Lin et al., 2018). According to the Bulletin on the State of the Environment in China, only 121 of 338 cities met the Chinese Ambient Air Quality Standards (CAAQS) in 2018 (Chen & Chen, 2021). Studies have found that, without ambitious actions, deaths related to PM2.5 exposure in China might not always decrease—and might often grow—by 2050 compared with the base year of 2015 (Y. Liu et al., 2022). Moreover, there remains significant disparity in regional socioeconomic development in China. The heterogeneous development status allows some regions to benefit from economic growth in terms of population health, while others must strike a balance between the two, which makes the situation even more complex. Considering its huge energy consumption (Mo et al., 2022), rapid urbanization process (Shen et al., 2021), and ever-growing aging population (Xu et al., 2023), dealing with air pollution has become increasingly urgent. Addressing PM2.5 pollution is of strategic importance for improving public health and promoting sustainable development in China.
In former studies, health effects from PM2.5 exposure have already been estimated at various spatial scales, which depicts the global distribution of air pollution pressure (Cohen et al., 2017; Burnett et al., 2018; Lu et al., 2019; Southerland et al., 2022). But for those calculated on global or country levels, little indication was provided about where actions were more urgently needed to reduce the adverse health effects (Khomenko et al., 2021). Since human activities take place predominantly in cities (W. Liu et al., 2020), plenty of researches have been done at city level (Kahraman & Sivri, 2022; C. Liu et al., 2019; Nair et al., 2021). Considering PM2.5 is largely a derivative of development of human society, many scholars are interested in the relationship between PM2.5-attributable mortality burden and socioeconomic factors. Their research covers realms such as urbanization (Han et al., 2016; Lu et al., 2019, 2021), rural-to-urban migration (Y. Wang et al., 2022), SES factors (education, occupation, and income) (Y. Wang et al., 2022), ethic differences (van den Brekel et al., 2024), environmental governance policy (Fang et al., 2016; Mo et al., 2022; Y. Liu et al., 2022), planned urban forms (size, fragmentation, shape, and dispersion) (Gao et al., 2023), poverty (Rentschler & Leonova, 2023), the COVID-19 quarantine (Shen et al., 2021), and so on, revealing many deep-seated problems in social governance in population health. At the same time, air pollution exposure data is critical to studies that assess the adverse health impacts of PM2.5. Traditionally, regional and national ground monitoring networks were the best means to provide PM2.5 estimates (Ma et al., 2022). However, the scattered and uneven spatial distribution of the stations makes large-scale monitoring difficult (Zhu et al., 2023) and also systematically underestimates the long-term exposure (C. Lin et al., 2016). To overcome this limitation, satellite-based remote sensing of aerosols (aerosol optical depth, AOD) has been widely used to estimate PM2.5 (Yan et al., 2020; Ma et al., 2022; Kibirige et al., 2023). Various remote sensing approaches have been developed to retrieve PM2.5 data from satellite-derived AOD, which is a good predictor for estimating PM2.5 concentration and a good complement for ground monitoring networks, both spatially and temporally (Ma et al., 2022).
Current understanding of the relationship between PM2.5-attributable mortality burden and economic growth is significantly limited. A bulk of studies focusing on specific regions (M. Liu et al., 2017; Lu et al., 2017; Kahraman & Sivri, 2022) either overlook regional development heterogeneity, leading to imprecise identification of the relationship, or lack a sufficiently long time span to fully describe this connection. Furthermore, some socioeconomic indicators like urbanization only capture certain aspects of economic growth, failing to represent its entire structure in relation to PM2.5 mortality. Additionally, mortality estimates based on country-level baseline disease rates (Southerland et al., 2022) tend to overlook regional characteristics, potentially introducing endogeneity bias when employing ordinary regression methods. Accordingly, this study employs city-level data over an extended time horizon to investigate the causal relationship between the two, aiming to address the limitations of previous research. Based on the Environmental Kuznets Curve (EKC) hypothesis and prior scholarly research, we propose the following two hypotheses:
H1:
There exists a quadratic nonlinear relationship between economic development and PM2.5-attributable mortality.
H2:
The heterogeneity in natural geographic conditions and socioeconomic factors gives rise to variations in the relationship between the two.
Conducting empirical analysis based on long-term time series data to identify the robust relationship between economic development and PM2.5-attributable population health losses—while accounting for regional heterogeneity—is an urgent research need. This effort not only addresses the limitations of previous studies but also holds significant practical implications for regional development policy. Accordingly, we position this issue as the central focus of the present research. Specifically, we used high-resolution satellite-retrieved PM2.5 concentration data, epidemiologically derived exposure-response functions, and country-level baseline disease rates to estimate population-weighted PM2.5 concentrations and cause-specific mortality across 274 cities in China from 2002 to 2021. We then employed a two-way fixed effect model to investigate the potential relationship between PM2.5-attributable mortality burden and economic growth and instrumental variable (IV) method to eliminate the interference of endogeneity. Furthermore, we categorized cities based on different socioeconomic and physical geographical criteria to examine the heterogeneity among these groups. Our results were subjected to empirical testing, demonstrating their robustness (Table 1).

Table 1.
Representative research studies related to the paper.
2. Research Plan
2.1. City Definition
Given that China officially joined the World Trade Organization (WTO) in 2001, which was followed by a period of rapid economic growth and a significant increase in air pollutant emissions, we select 2002 as the starting point for our empirical analysis. This allows us to capture the development trajectory under globalization and systematically examine the relationship between economic expansion and environmental health. Meanwhile, to ensure data availability and maximize the length of the time series, we set 2022 as the endpoint of the study period.
We retrieved Chinese cities data from the China City Statistical Yearbook. This dataset contained 4 municipalities directly under the central government, 15 vice-provincial cities, 278 prefecture-level cities, and 394 county-level cities (statistics of Hong Kong, Macau, and Taiwan were not included). We excluded all the county-level cities for their being under the jurisdiction of prefecture-level cities and the lack of relevant socioeconomic statistics. We also excluded cities that underwent adjustment of administrative divisions during this period. To ensure the reliability of the study results, we also removed those cities for which no continuous air pollution data estimates were available. The analysis was done for the remaining 274 cities in China. The relevant data are all sourced from the China Statistical Yearbook, China City Statistical Yearbook, China Population Statistical Yearbook, as well as statistical yearbooks and statistical bulletins of various provinces and cities.
2.2. Population-Weighted Annual Average Concentrations
In our study, we used datasets of population and PM2.5 concentrations of China at a 0.01° × 0.01° (approximately 1 km2) resolution instead of the Global Burden of Disease (GBD)-provided datasets, which have a resolution of 0.1° × 0.1°, to provide better fits. For PM2.5 concentrations, annual ground levels were estimated by combining aerosol optical depth (AOD) retrievals from the National Aeronautics and Space Administration (NASA) Moderate Resolution Imaging Spectroradiometer (MODIS), Multi-angle Imaging SpectroRadiometer (MISR), Sea-viewing Wide Field-of-view Sensor (SeaWIFS), and Visible Infrared Imaging Radiometer Suite (VIIRS) instruments with the GEOS–Chem chemical transport model and subsequently calibrating to global ground-based observations using a geographically weighted regression (GWR). Compared with former estimates, there are improvements, including a resolution-tiered approach for retaining fine resolution while combining multiple AOD datasets, representation of missing or limited ground-based monitor data, additional observation-based predictor variables of residual bias in PM2.5 estimates, and temporal variation in predictor coefficients at a global scale (van Donkelaar et al., 2021). Gridded population estimates were available from the LandScan Global Population Database at a 1 km2 resolution, which was widely used in exposure and health burden analysis (Lu et al., 2017, 2019). We also calibrated the annual cumulative population of cities with reported number in the government yearbook.
To address the uneven distribution of PM2.5 concentration in urban areas, such as the variation between city centers and suburbs, we computed population-weighted annual average concentrations for each city. This approach corrects potential biases that may arise from assuming equal weight across all areas. For each city, we divided the sum of the product of concentration estimates at the grid cell (k) by population at the grid cell (k) within each urban area (i), divided by the sum of population per grid cells (k) of each urban area (i) (Southerland et al., 2022):
2.3. Quantitative HIA
Following previous studies (Lu et al., 2019; Y. Liu et al., 2022), we applied the health impact function developed by GBD2019 to estimate PM2.5-attributable mortality burden. The health impact function incorporates annual average PM2.5 concentrations, population counts, baseline mortality rates, and epidemiologically derived exposure response functions (ERFs) relating PM2.5 concentrations and health outcomes (Southerland et al., 2022). The mortality burden was calculated through the following equation:
In the equation above, indicates the number of cases of cause-specific mortality endpoint (h) attributable to PM2·5 exposure for each city (i) and age group (a); indicates the baseline disease rate for each cause-specific mortality endpoint (h) for each city (i) and age group (a), where we used the country-level baseline disease rates instead; stands for the population-attributable fraction, which is to quantify the proportion of cause-specific mortality endpoint (h) attributable to PM2.5 exposure for each city (i) and age group (a) (Plass et al., 2022). The PAF can be calculated from relative risk (RR) estimates derived from epidemiological literature. The calculation formula is as follows:
In our study, we derived baseline RR estimates from the GBD2019 for mortality from stroke, ischaemic heart disease, lung cancer, type 2 diabetes, chronic obstructive pulmonary disease, and lower respiratory infections. For stroke and ischaemic heart disease, age-specific RR estimates were applied for people between 25 and 99 years old in 5-year increments. The GBD studies applied an ensemble of meta-regression tools to evaluate epidemiological parameters, which results in 1000 splined estimates covering 385 integer exposure levels ranging from 0 µg/m3 to 2500 µg/m3 (Vos et al., 2020). In keeping with GBD2019 studies, we adopted the theoretical minimum risk exposure level (TMREL), assuming a uniform distribution with lower and upper boundary corresponding to 2.4 μg/m3 and 5.9 μg/m3. We also presented the 95% confidence intervals (CIs) of mortality burden, using the 2.5th and 97.5th percentiles of RR estimates. Then we summed cause-specific estimates to yield total mortality counts. Python, version 3.10, was used for our analyses.
2.4. Econometrics Analysis Design
2.4.1. Baseline Regression Model Design
This study aims to identify causal relationships and correlations between variables using structured and quantifiable data, making econometric models particularly suitable. By controlling for confounding factors, these models enable robust estimation of marginal effects and causal mechanisms, thereby offering empirical support for policy formulation. Therefore, econometric models are employed to conduct the empirical analysis.
According to previous scholars’ research, relationships between economic growth and population health are mostly characterized by a positive linear (Sacks et al., 2012), negative linear (Mathers et al., 2002), or quadratic (Nagano et al., 2020) trend. Environmental exposures to pollutants have a direct correlation with the incidence of certain epidemics and, in turn, on the mortality burden from them. Economic growth, as the prominent driver of PM2.5 concentration, is also likely to have an impact on PM2.5-attributable mortality burden. Referring to the Environmental Kuznets Curve (EKC) theory, which suggests that while economic growth typically causes environmental degradation in its early stages, the most effective—and likely the only—way for most countries to achieve a sustainable environment is through wealth accumulation (Beckerman, 1992), we posit that a similar quadratic relationship exists between economic growth and mortality burden. In our study, we constructed a two-way fixed-effect model to probe the possible nonlinear relationship between PM2.5-attributable mortality burden and economic growth.
In the equation above, indicates the mortality burden of each city (i) in each year (t); indicates the economic growth of each city (i) in each year (t); indicates a covariate matrix that incorporates population size, digitization, average annual temperature level, average annual wind speed, infrastructure, technological development, and normalized difference vegetation index (NDVI) of each city (i) in each year (t); indicates the entity fixed effect; indicates the time fixed effect. We converted some of the variables to a natural logarithmic format to reduce possible data outliers and avoid multicollinearity issues. Given its widespread consensus as a reliable measure and broad availability across regions and time, we selected GDP per capita as the core explanatory variable, using data adjusted to constant 2002 Chinese yuan.
2.4.2. Endogeneity, Robustness, and Heterogeneity Test Design
The theory of “virtuous and vicious cycles” between growth and health (Ranis & Stewart, 2000) suggests that there’s a bidirectional relationship between the two (Swift, 2011; French, 2012). To tackle potential endogeneity problems, we applied the instrument variable (IV) regression model, taking DMSP-OLS night light data (Wu et al., 2022) as the instrument variable of economic development. We also used the first-order and second-order time lagged term of economic growth and their quadratic term as the core explanatory variables to run the regression. For robustness test, we first performed a variable substitution, replacing mortality burden with the PM2.5 concentration level to act as the explained variable. Then we adjusted the time window of our study to the period from 2013 to 2021, when China issued the most stringent Air Pollution Prevention and Control Action Plan in its history. We completed heterogeneity analysis to evaluate the effects of location-specific or development-specific characteristics on the significance and magnitude of the mortality–economy relationship. Considering the socioeconomic and physical geographical differences among cities, four dimensions were investigated, which were mortality burden, population size, income level, and coastal or non-coastal regions.
3. Results
3.1. PM2.5 Concentration in China
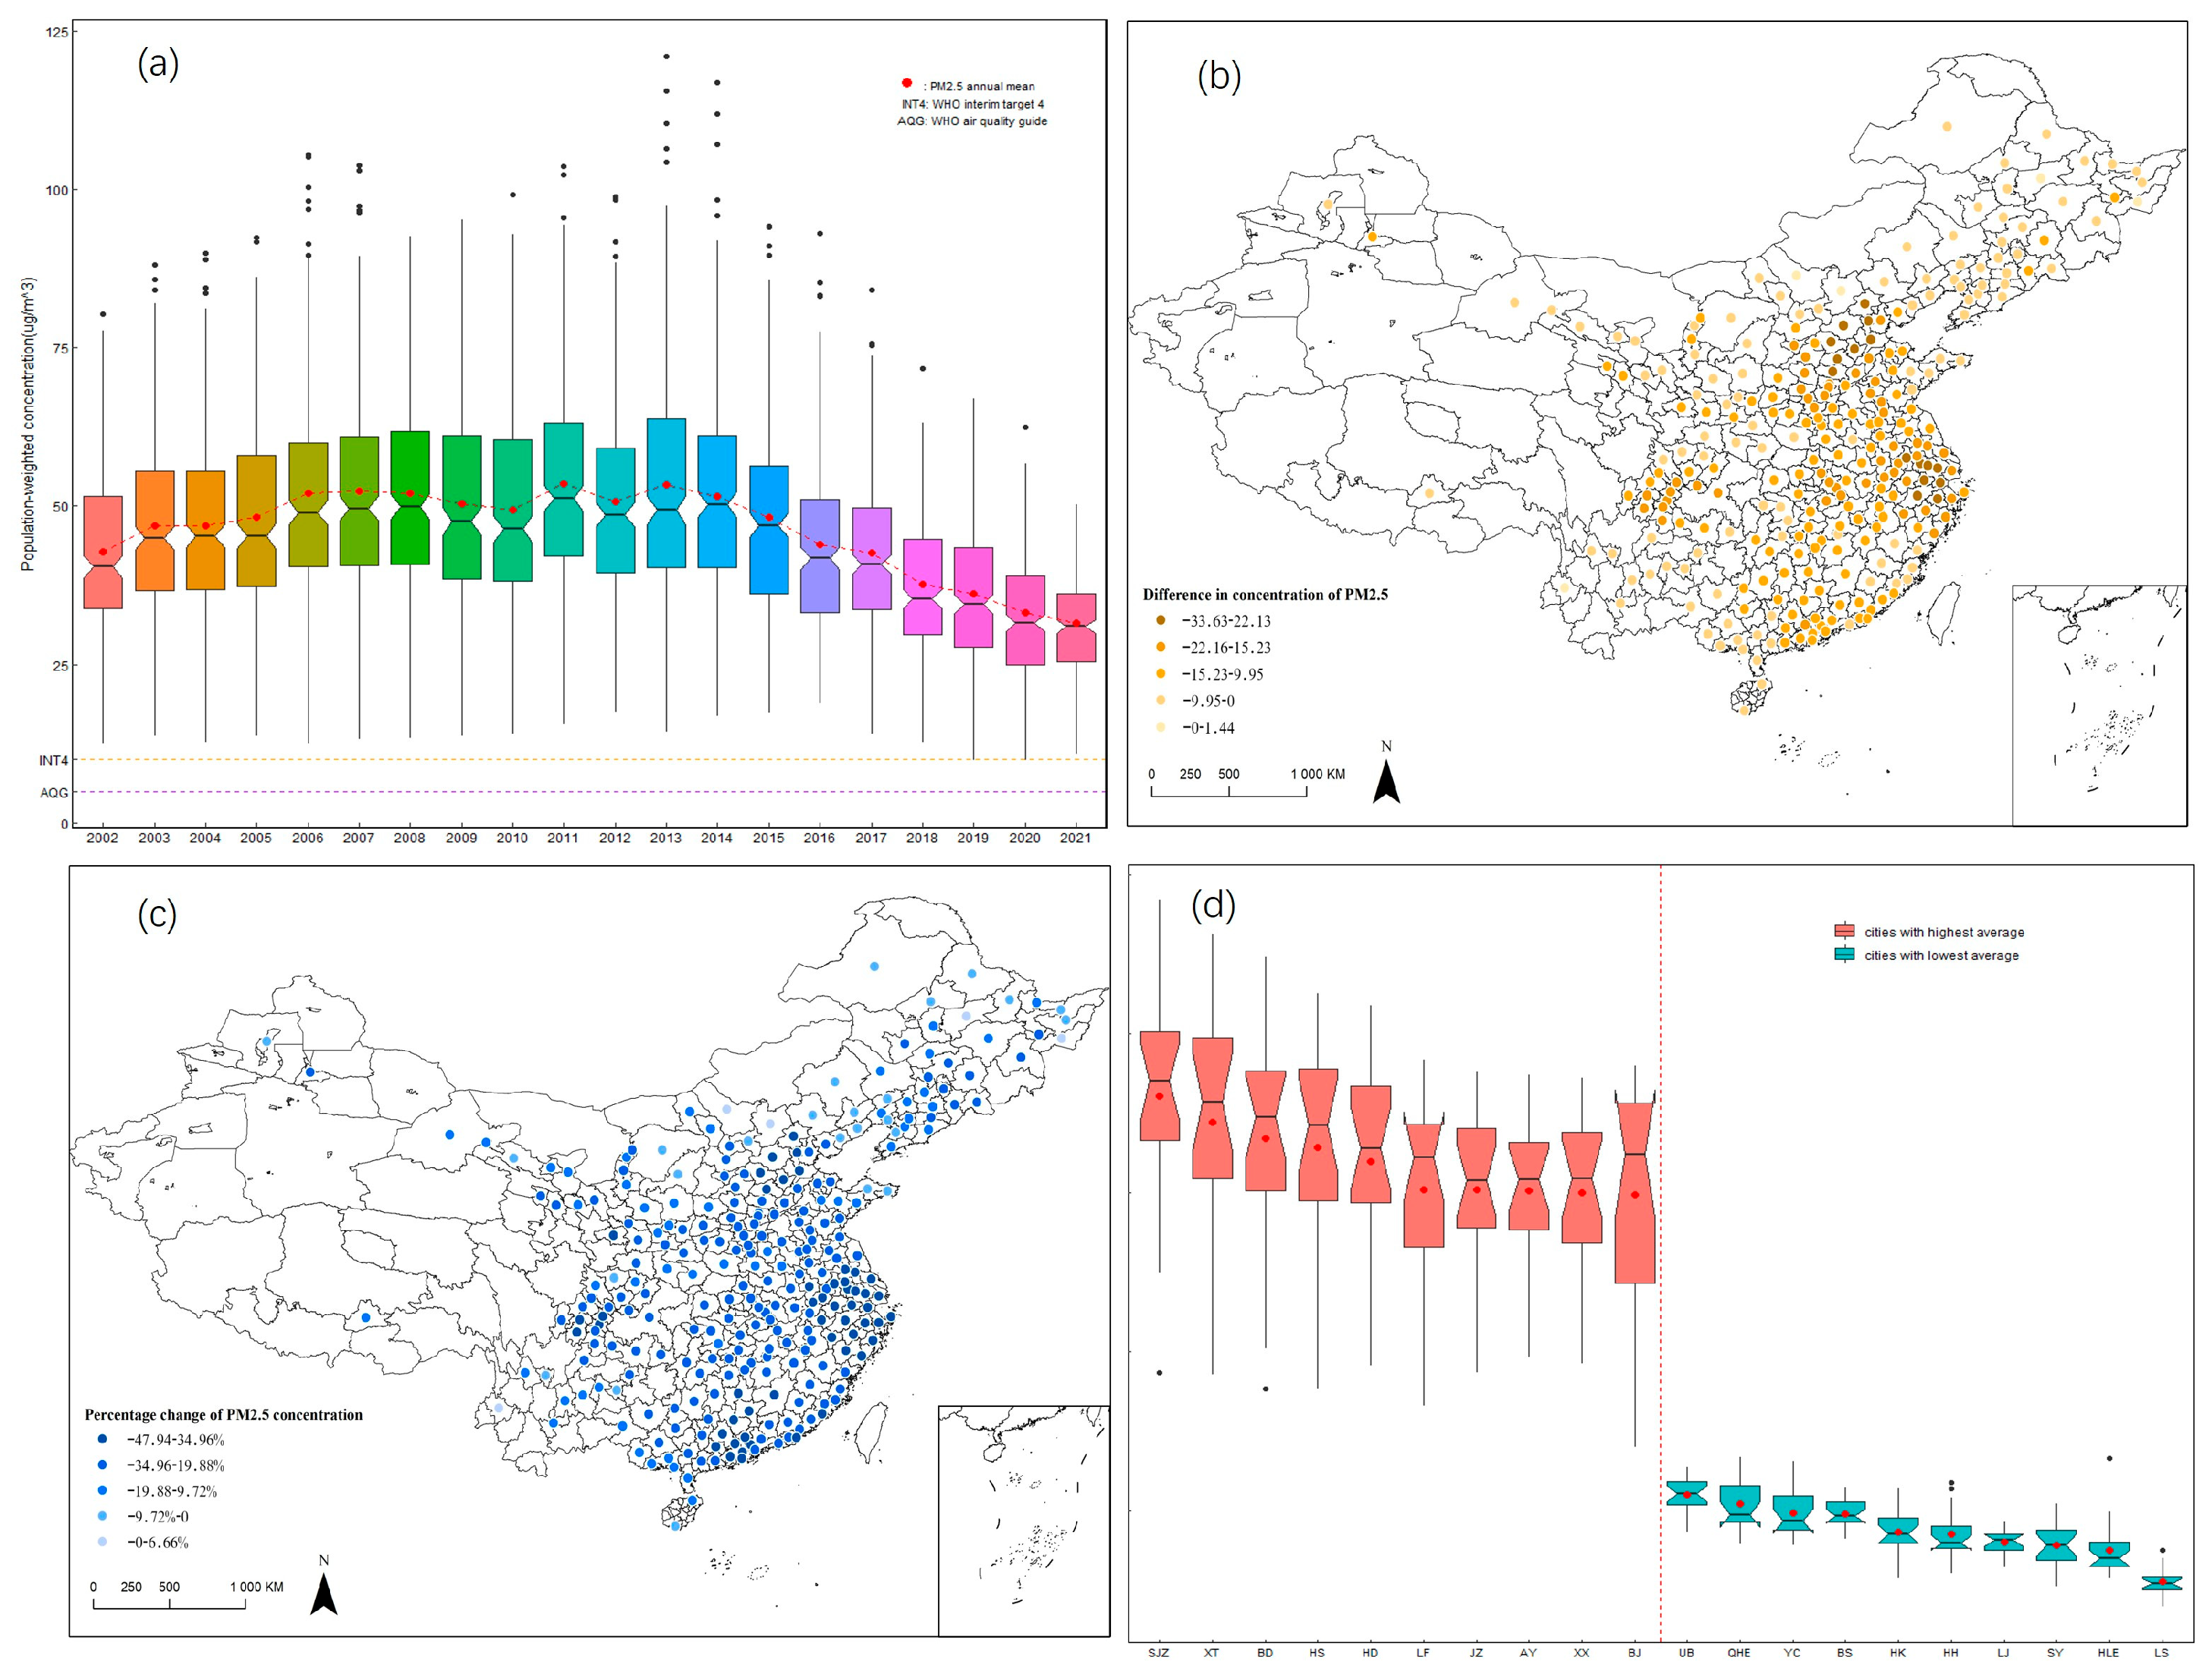
From 2002 to 2021, the annual mean population-weighted PM2.5 concentration was showing a stagewise trend across cities in China (Figure 1a). Given the significant regional differences in natural geography, industrial structure, urban population density, and energy consumption patterns, PM2.5 concentration levels exhibit substantial spatial disparities across cities. Before 2013, the mean concentration exhibited characteristics of fluctuating increase and then decreased gradually henceforth. For year 2021, the mean population-weighted PM2.5 concentration was 31.32 µg/m3 (SD 8.04 µg/m3), which was significantly lower than that for year 2002 (42.32 µg/m3, SD 12.28 µg/m3), let alone the peak level in year 2013 (52.77 µg/m3, SD 18.44 µg/m3). However, the lowest concentration (year 2021) was still over 6 times the WHO recommended annual air quality guideline (AQG) level (5 µg/m3) for PM2.5 and over 3 times the Interim Target 4 (10 µg/m3), indicating serious risks to population health. Other than the temporal changes, PM2.5 concentration also varied widely among cities (Figure 1b,c). Cities in the Beijing–Tianjin–Hebei region and the Yangtze River Delta saw the largest absolute decreases (from −33.63 µg/m3 to −22.13 µg/m3) as well as the largest percentage changes (from −47.94% to −34.96%) in PM2.5 concentration, although intra-regional variation still existed. Large percentage changes were also observed in other regions (e.g., the Pearl River Delta and Sichuan Province), but changes measured in absolute terms were relatively small. Few cities underwent increases in PM2.5 concentrations, proving the effectiveness of air pollution control policies and technological progress. The top 10 cities with the highest average concentrations (from 74.67 µg/m3 to 90.16 µg/m3, SD from 11.87 µg/m3 to 18.81 µg/m3) were all located in North China, most of which were also in the list of cities with largest PM2.5 concentration reduction (Figure 1d). The top 10 cities with the lowest average concentrations (from 13.90 µg/m3 to 27.49 µg/m3, SD from 1.82 µg/m3 to 4.31 µg/m3) were mainly located in border provinces, where population and economic factors were less concentrated than regions mentioned above. It should be noted that none of the 274 cities attained the WHO Interim Target 4, let alone AQG guideline, in year 2021. All inhabitants in these cities were exposed to PM2.5, which could bring adverse health effects.

Figure 1.
PM2.5 concentration levels (a), changes (b,c), and clusters (d). ((d), SJZ: Shijiazhuang, XT: Xingtai, BD: Baoding, HS: Hengshui, HD: Handan, LF: Langfang, JZ: Jiaozuo, AY: Anyang, XX: Xinxiang, BJ: Beijing, UB: Ulanqab, QHE: Qiqihar, YC: Yichun, BS: Baoshan, HK: Haikou, HH: Heihe, LJ: Lijiang, SY: Sanya, HLE: Hulunbeier, LS: Lhasa).
3.2. PM2.5-Attributable Mortality in China
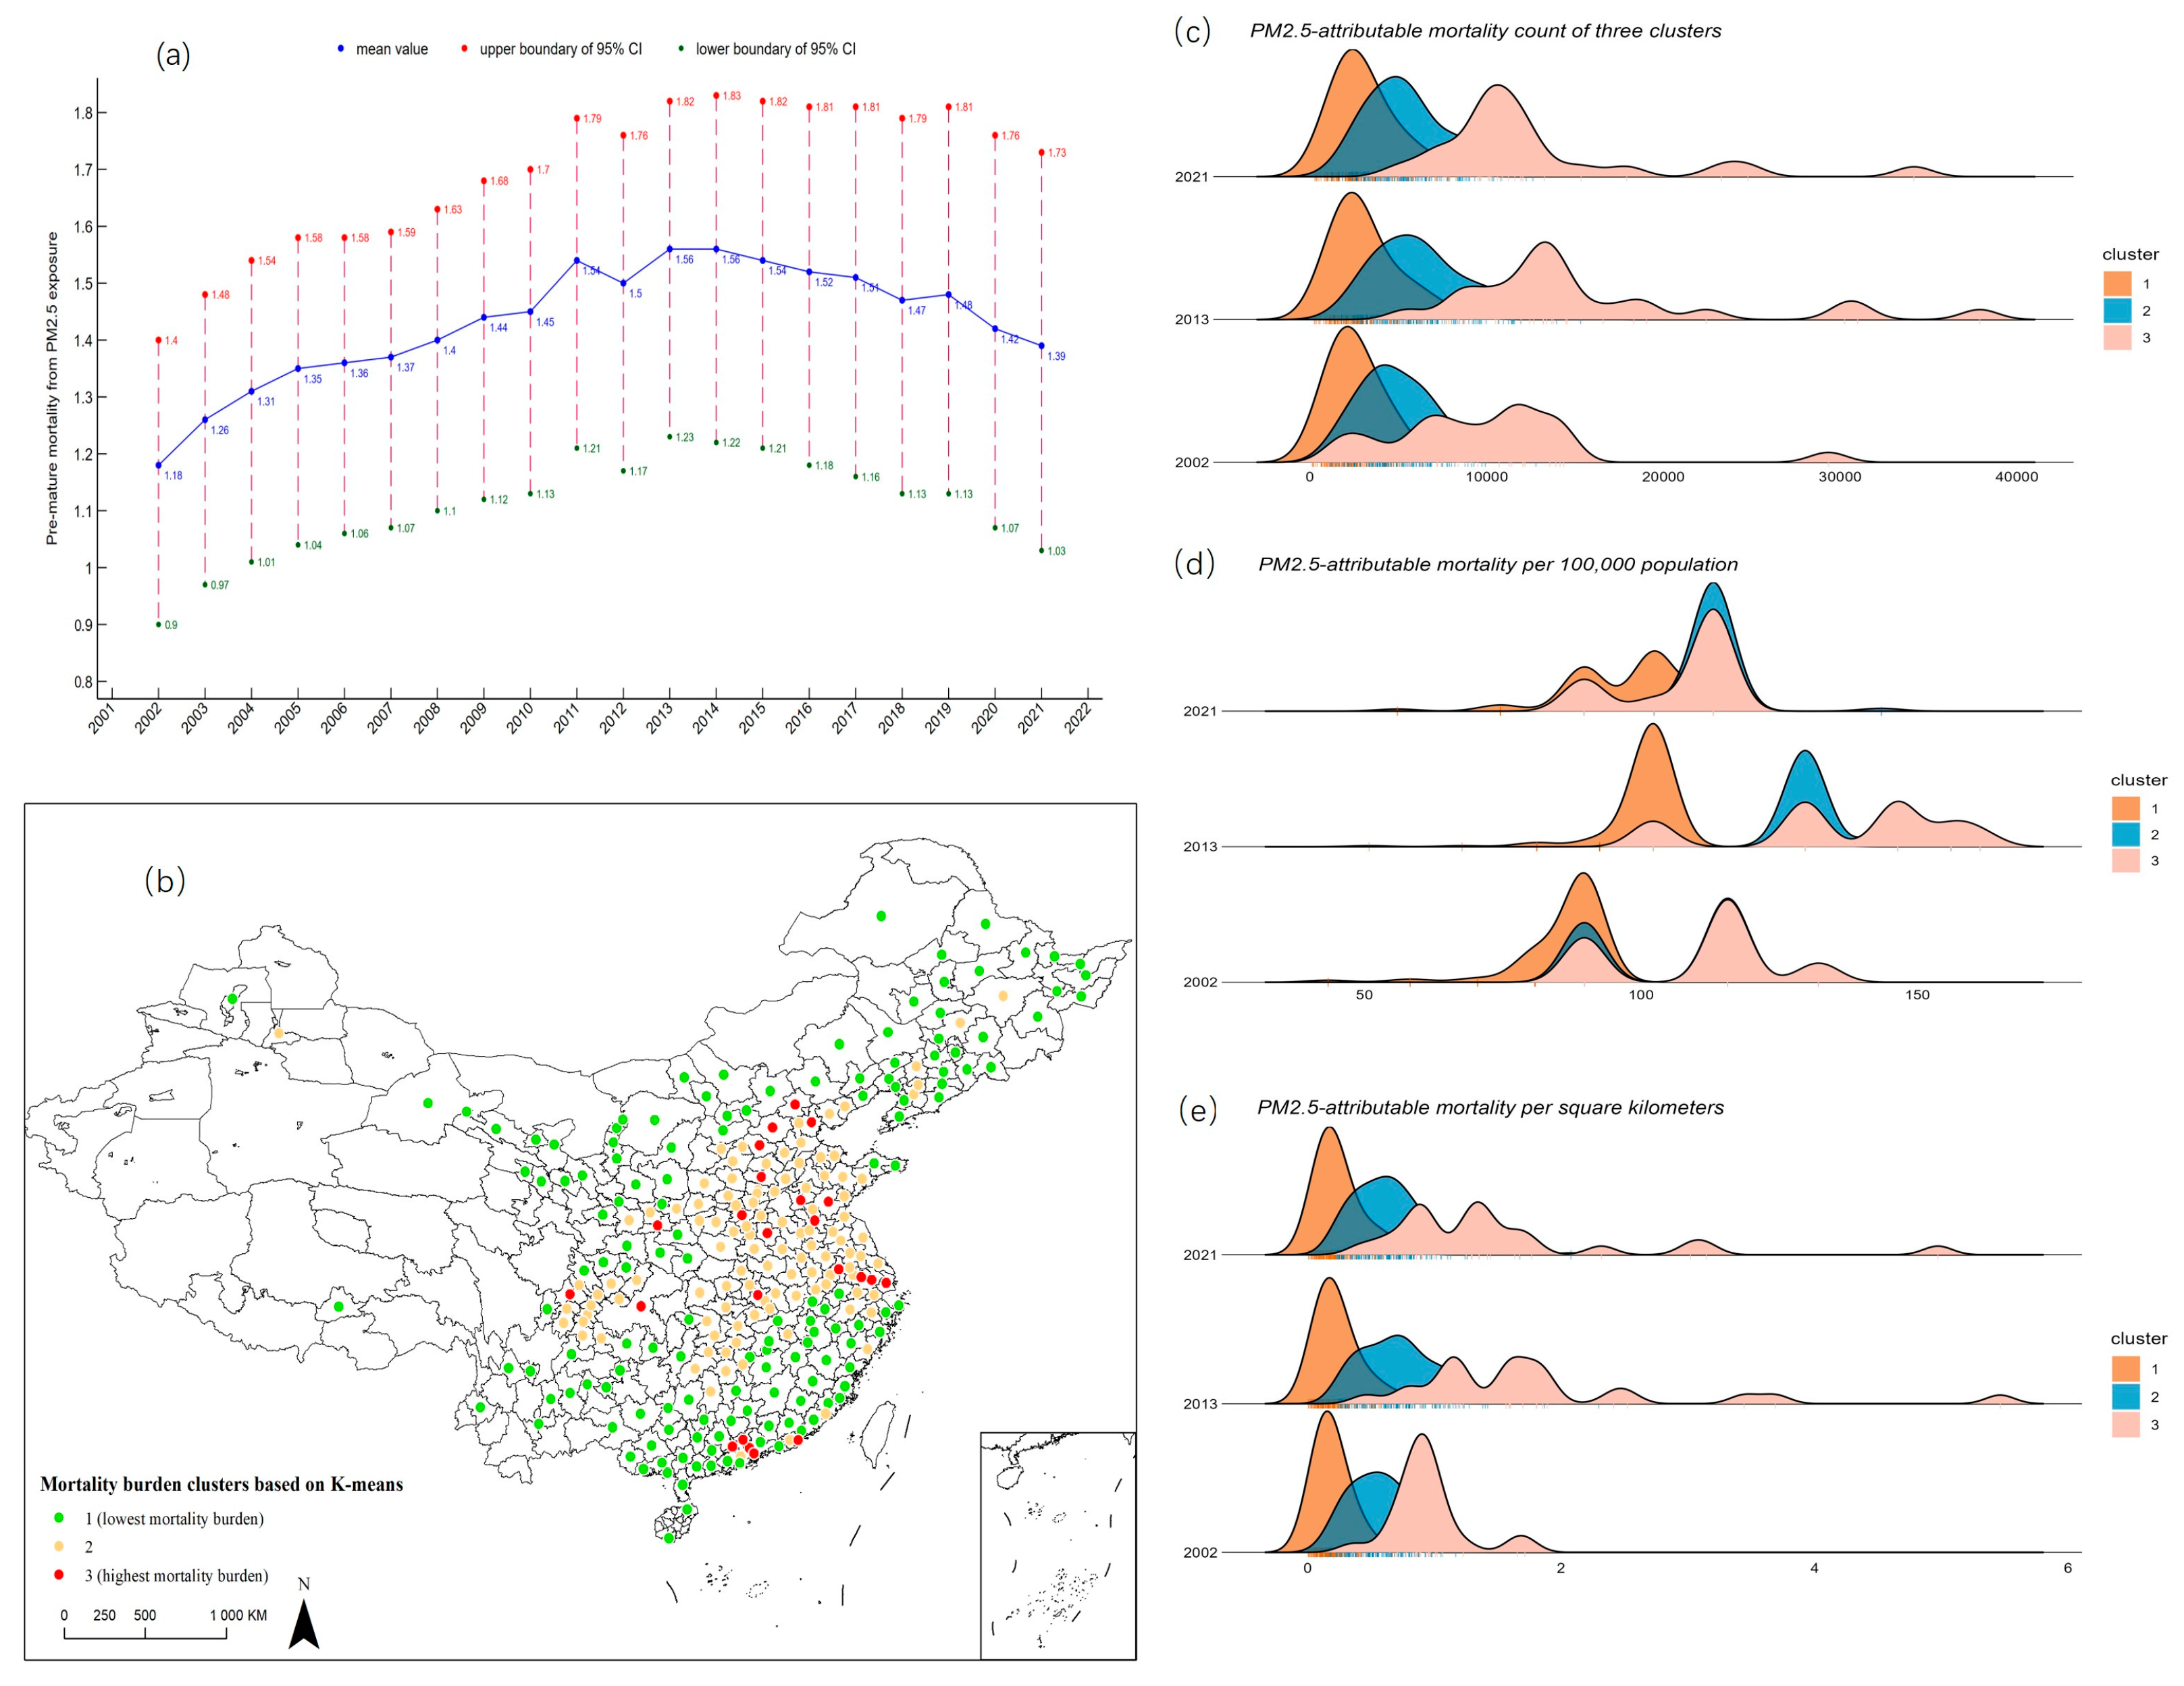
Although poorer air quality is more likely to have a negative impact on population health, air quality is not the only determinant of mortality burden (Southerland et al., 2022). We applied the HIA methodology to estimate PM2.5-attributable mortality across cities in China (Figure 2a). At the national level, there were over 1 million (from 1.18 million to 1.56 million) life losses from PM2.5 exposure every year, with the mortality rate being over 90 deaths (from 98.73 to 123.55) per 100,000 people, which was nearly 50% higher than the global average level in 2019 (61 deaths per 100,000 people, 95% CI 45–77) (Southerland et al., 2022). We also incorporated uncertainty in the estimation to produce 95% confidence intervals (CI) of PM2.5-attributable mortality burden. Although the 95% CIs provided a wide range of values, severe situation still shadowed the population health of China, even only taking the lowest estimate to consideration (0.9 million mortality minimum, year 2002).
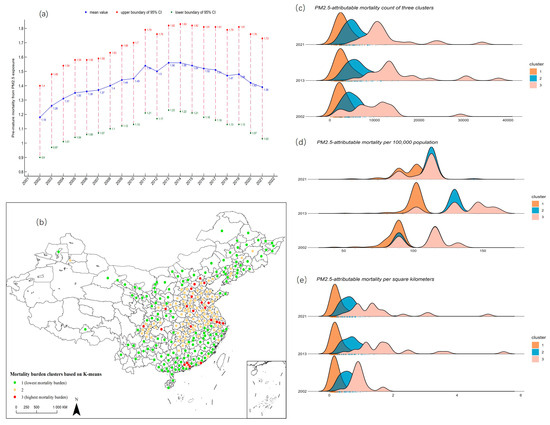
Figure 2.
Mortality counts (a), clusters (b), and indicators calculated (c–e).
We also used another two indicators to quantify the mortality burden from PM2.5 exposure in China, which were mortality per 100,000 people and mortality per square kilometre (km2), and then applied the K-means method to cluster the cities based on the average value over the study period (Figure 2b). A great spatial variability was observed. Cities with the highest mortality burden were mostly clustered in the Beijing–Tianjin–Hebei region, the Yangtze River Delta, and the Pearl River Delta, where the population was highly concentrated. In total, 23 out of the 274 cities were classified in this group, accommodating 20.76% of the total population, each one of which suffered 13,430.92 life losses (SD 6955.39), 123.48 mortality per 100,000 people (SD 19.03), and 1.52 mortality per km2 (SD 0.91), on average. A total of 108 cities, which were mainly located in North and Central China, suffered moderate mortality burden, covering 43.21% of the total population. A city in this group suffered 5888.36 life losses (SD 2549.51), 122.50 mortality per 100,000 people (SD 14.35), and 0.68 mortality per km2 (SD 0.31), on average. Cities with the lowest mortality burden were scattered across other regions in China, accommodating 36.03% of the total population. A city in this group suffered 3000.16 life losses (SD 1756.83), 98.27 mortality per 100,000 people (SD 11.42), and 0.24 mortality per km2 (SD 0.17), on average (Figure 2c–e). Analysis of variance was also conducted to verify the significant differences among the three clusters.
3.3. Econometrics Analysis
3.3.1. Baseline Regression and Endogeneity and Robustness Test
We used the baseline regression mentioned above to test the validity of the nonlinear relationship between PM2.5-attributable mortality burden and economic growth across cities in China (Table 2, Model 1). According to the result, the relationship followed a U-shaped pattern (Figure 3). That is, with the GDP per capita growth, which is used to characterize economic growth, the mortality burden first decreases and then increases. The coefficient for the primary term of economic growth is −1.222, while the quadratic term’s coefficient is 0.053, with both being significant at the 1% level. By incorporating the above regression coefficients into baseline equation, the inflection point, when accounting for control variables, is calculated to be 99,708 yuan (CNY) per person. This can be considered as one threshold. Initially, rising GDP per capita leads to a reduction in mortality burden, reaching its lowest point at 99,708 yuan. However, once GDP per capita surpasses this threshold, the mortality burden begins to reverse, shifting from a downward to an upward trend.
Table 2.
Baseline regression and endogeneity and robustness test.
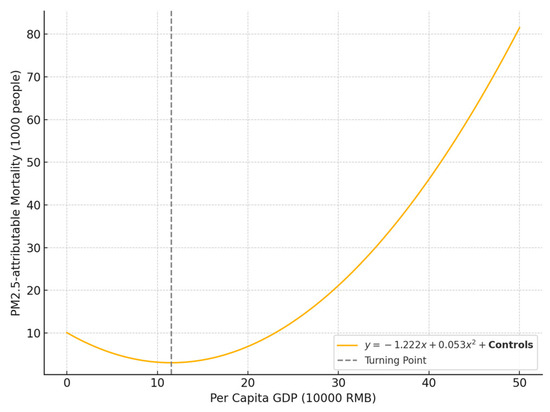
Figure 3.
U-shaped relationship between economic growth and PM2.5-attributable mortality.
We applied two methods to address potential endogeneity (Model 2–4). First, we resorted to the IV estimation of fixed-effect model with possibly endogenous regressors, taking night light intensity as the instrumental variable of GDP per capita. Nighttime light data serve as a valid IV for economic development because they are strongly correlated with local economic activity but do not directly influence health outcomes associated with PM2.5 exposure. Moreover, they offer objective and consistent measurements that help mitigate biases from potentially manipulated or incomplete official statistics. The results of the LM test (1446.649, significant at the 1% level) suggest that the model is not underidentified. Furthermore, the Cragg–Donald Wald F-statistic (1000.130) far exceeds the conventional threshold of 10, indicating that the instruments are strongly correlated with the endogenous regressor. These results collectively support the validity and strength of the chosen instrumental variables (Model 2). Second, we employ the first-order and second-order lags of GDP per capita as instrumental variables, based on their strong correlation with the current value and theoretical exogeneity with respect to the dependent variable. Given the potential endogeneity between economic growth and PM2.5-attributable mortality, lagged terms serve as valid instruments that mitigate simultaneity and reverse causality, thereby improving the robustness of the estimation results (Model 3–4). We also applied two methods to do the robustness test. First, to further validate whether the impact of economic growth on mortality burden operates through the air pollution channel, we conduct a robustness check by using PM2.5 concentration as the dependent variable. A significant result would support the hypothesized pathway from economic activity to pollution and subsequently to health burden. We replaced the explained variable with the logarithm of annual population-weighted PM2.5 concentration, considering its direct correlation with the mortality burden concerned (Model 5). Second, to ensure the robustness of our findings, we adjust the start of the study period to 2013, when China launched the Action Plan for Air Pollution Prevention and Control and began implementing central environmental inspections. This adjustment controls for potential structural breaks caused by major institutional reforms, allowing for a more accurate identification of the impact of economic growth under the new regulatory regime (Model 6). All five models showed that the coefficients of GDP per capita were significantly less than 0, while the coefficients of the quadratic term were significantly greater than 0. Besides, the results of all five models showed little difference from the baseline model in terms of absolute values, and all fall within the sample interval. In conclusion, the U-shaped relationship between PM2.5-attributable mortality burden and economic growth does exist, based on a thorough consideration of control variables. Given the length of the study period and the significant differences in development levels and patterns among various cities in China, the nonlinear relationship was clearly described, and the results exhibited considerable robustness.
Based on the above results, Hypothesis 1 (H1) is supported.
3.3.2. Heterogeneity Analysis
Heterogeneity emerges when multiple close or conceptual replications on the same subject produce results that vary more than expected from the sampling error (Linden & Hönekopp, 2021). Researchers typically tend to estimate the average effect when inspecting the relationship between an exposure and an outcome, where vast differences may occur across different subgroups of individuals. Recommendations based solely on average responses might not be optimal for a given individual and could even be harmful if the individual’s response is opposite to the average (Nilsson et al., 2019). Given China’s vast territory and unbalanced regional development, there may be significant heterogeneity between cities. We conduct the heterogeneity analysis from four perspectives: mortality burden, population size, income level, and coastal or non-coastal regions (Table 3).
Table 3.
Heterogeneity test.
First, to explore whether the relationship between economic growth and PM2.5-attributable mortality burden varies across different mortality burden clusters, we conducted a heterogeneity analysis. This approach allows us to detect potential structural differences and region-specific mechanisms, thereby improving the external validity and policy relevance of our findings. We created dummy variables for all these clusters and took cluster 1, which suffered the least mortality burden, as the baseline group (Model 7). The baseline group exhibited a significant U-shaped relationship between PM2.5-attributable mortality burden and economic growth, with coefficients of the primary term and the quadratic term of GDP per capita being −1.104 and 0.048, respectively. Coefficients of intersection terms, created by multiplying the dummy variable for the cluster suffering moderate mortality burden (cluster2) by GDP per capita and its quadratic term, were −0.072 and 0.000, none of which was significant, indicating that no systematic difference retaining between this cluster and the baseline group. Coefficients of intersection terms for the cluster suffering the most mortality burden (cluster3) were −0.589 and 0.029, both of which were significant at 1% level. Compared to the baseline group, a negative coefficient for the primary term (−0.589) implies that, up to a certain threshold, economic growth had a greater effect on reducing mortality rates. However, beyond that threshold, a positive coefficient for the quadratic term (0.029) indicates that further economic development led to higher mortality rates.
Second, given the substantial differences in pollution exposure, environmental governance capacity, and public health infrastructure across cities of varying population sizes, we further group cities based on their population to examine the heterogeneous effects of economic growth on PM2.5-related health outcomes. In 2014, the Chinese government issued the “Notice on Adjusting the Standards for City Size Classification,” which classifies cities based on the permanent resident population in urban areas. According to this standard, cities are categorized into five types: small, medium-sized, large, very large, and megacities, with population thresholds set at 0.5 million, 1 million, 5 million, and 10 million, respectively. We created dummy variables for these city types and ran a regression to test heterogeneity among them (Model 8). There is an exact U-shaped relationship between mortality burden and economic growth in the baseline group (−1.646 for primary term and 0.077 for quadratic term, both significant at 1% level), which are the ones allocated to small city category. Meanwhile, coefficients of the intersection terms for medium-sized (mediumCity) and megacities (megacity) are not significant, indicating no systematic differences between the two and the baseline group. For the large cities (largeCity), coefficients of intersection terms are 0.501 (significant at 10% level) and −0.029 (significant at 5% level), exhibiting a smoother U-shaped curve relationship within this group. For the very large cities (veryLargeCity), coefficients of intersection terms are 0.683 (significant at 5% level) and −0.037 (significant at 1% level), demonstrating less population health burden incurred by the population size at this level, compared with other city types.
Third, recognizing that cities with varying income levels differ significantly in their pollution control capacity, public health infrastructure, and population vulnerability, we further classify cities by per capita income to examine the heterogeneous effects of economic growth on PM2.5-attributable health burdens. The World Bank classifies the world’s economies into four income groups: high-income, upper-middle-income, lower-middle-income, and low-income. Referring to the classification standards, we categorized cities into the corresponding four groups and took the low-middle-income country group as the baseline to run the regression since no cities fell into the low-income category (Model 9). There’s an exact U-shaped relationship between mortality burden and economic growth in the baseline group (−1.863 for primary term and 0.083 for quadratic term, both significant at 1% level). For the upper-middle-income group (upperMiddleIncome), coefficients of intersection terms are 0.753 (significant at 1% level) and −0.036 (significant at 1% level), exhibiting a smoother U-shaped curve relationship within this group. For the high-income group (highIncome), coefficients of intersection terms are 0.829 (significant at 1% level) and −0.040 (significant at 1% level), demonstrating less population health burden incurred by per capita income at this level, compared with other income types.
Globally, coastal areas are growth poles with the densest population and most concentrated economic factors (Jin et al., 2023). Given the significant differences between coastal and non-coastal cities in terms of economic development, environmental governance capacity, industrial structure, and regulatory intensity, we further divide the sample accordingly to examine the spatial heterogeneity in the relationship between economic growth and PM2.5-attributable health burden. Model 10 was used to probe the differences in the relationship concerned between coastal and non-coastal cities in China. We took the non-coastal cities as the baseline group and found that the U-shaped trend still applied here. The coefficients of the primary term and the quadratic term for the baseline group were −1.274 and 0.054, respectively, which were all significant at the 1% level. For the coastal group (coastalCity), coefficients of intersection terms are −0.309 (significant at 1% level) and 0.013 (significant at 1% level), exhibiting a steeper U-shaped curve relationship within this group.
Based on the above results, Hypothesis 2 (H2) is supported.
4. Discussion
Economic growth and population health are two critical pillars of human societal development. In the context of climate change, severe aging issues, and increasing inequality, leveraging economic growth to improve population health holds significant policy and practical implications. However, there is no unified or universal theoretical framework regarding the relationship between the two complex systems. Different or even contradictory findings often arise from empirical studies in which remarkable heterogeneity in terms of their areas of focus, conceptualizations for health, time dimension, and methodology retain (Vos et al., 2020). In this study, we identified a counterintuitive U-shaped relationship between economic growth and PM2.5-attributable mortality burden in China, with notable discrepancies across cities categorized into different groups. Our result is different from that of some former studies, where the relationship usually takes forms of positive linear, negative linear, or Kuznets-curve style. But this doesn’t mean that the results of both sides are intrinsically opposed. Numerous literature show that the impact of growth varies by health outcomes, considerations of timing, methodology selection, and a country’s developmental progress (Patterson, 2023). Actually, the drivers of PM2.5-attributable mortality burden can be disentangled into contributions of exposure, population size, and baseline incident rates, according to the HIA methodology (Anenberg et al., 2022). Our study focused on a 20-year span of substantial socioeconomic adjustments in China, during which economic growth significantly influenced all the aforementioned drivers, thereby impacting the mortality burden. This explanation corresponds to the mediation effect, which means one or more variables account for any association between economic growth and population health (Patterson, 2023). By considering all three drivers as intrinsic factors in economic growth in our analysis, the U-shaped relationship can be interpreted as the combined outcome of their influences.
There are potential important policy implications here. On the one hand, enthusiasts of liberal economy (laissez-faire economy) advocate that the wealth effect of economic growth (Bologna et al., 2016) can increase the ability to provide public goods, making people more likely benefit from general, physical, and mental health because they are richer (Geloso & Pavlik, 2021). However, according to our research, the economic growth is not a catchall solution to population health problems, that is, population health is not an intrinsic derivative of wealth accumulation, which agrees with viewpoints of many scholars (Barlow, 2018; Gechert & Heimberger, 2022; Hope & Limberg, 2022; Suzuki, 2022). The U-shaped curve implies that there is no inherent synergy between economic growth and population health. Actually, this pattern is commonly observed in countries undergoing rapid industrialization, particularly where environmental considerations are overlooked. In contrast, such trends are rarely seen in economies driven primarily by the service sector, where environmental impacts are minimal. Even when environmental concerns do arise in these contexts, they are typically addressed swiftly, especially in response to societal demands. A development approach primarily focused on economic growth may also negatively impact population health, thereby reducing the overall welfare of the population. The government must use its “visible hand” to curb the reckless pursuit of economic growth at any cost, addressing the dual challenges of economic development and population health improvement. On the other hand, the unequal mortality burden caused by differences in social, economic, and physical geographical conditions between regions deserves greater attention. For example, when income levels pass certain thresholds, large and very large cities tend to suffer less mortality from PM2.5 exposure, compared with other city types, indicating the population health benefits from specific levels of urbanization. China has long been promoting urbanization, but it is still necessary to focus on the reasonable development of city sizes based on market activities, with resource and environmental constraints in mind. Additionally, attention should be given to address the population health issues that have emerged in megacities. China has also seen its growing income inequality in the last decades (Gradín & Wu, 2020), which could reduce or even eliminate the positive influence of economic growth on health (Rajan et al., 2013) by declining bargaining power of workers or eroding universalistic population health regimes (Callais et al., 2024). Hence, more egalitarian polices should be adopted to support some kind of equitable solutions for the use of economic growth, either through the mitigation of income inequities or via government sponsorship of infrastructures that support less developed regions, such as through investment in energy structure adjustment. Moreover, people often adopt an optimistic view of the impact of economic activity on health, believing that, according to the well-known Environmental Kuznets Curve (EKC) theory, economic growth will inevitably lead to improved environmental quality after a certain time point, which is a key condition for better health. However, some recent reviews indicate that environmental pollution may continue to increase monotonically alongside income (Haberl et al., 2020), so there is not enough evidence for the decoupling of income and pollution level. Even if the EKC hypothesis holds true, the health burden may still be exacerbated by the growing population size and the increasing number of elderly people. Some may also consider that the risk of certain diseases is a trade-off for living in a more developed world, where the prospects for a longer life are greater (Omran, 1971). But these issues can likely be addressed by leveraging ever-developing technologies in environmental protection, such as aligning air quality with WHO guidelines.
Our research has several limitations. First, it is restricted to China. Due to unique geographical conditions, population characteristics, industrial structures, and the national governance system, our findings may not be applicable to all other countries or regions. Moreover, the lack of comprehensive data limits our analysis to the past 20 years, preventing us from capturing the long-term relationship between economic growth and the mortality burden. Second, while we conducted various heterogeneity analyses based on socioeconomic indicators, we did not account for differences across gender, age groups, or urban-rural divides. Addressing these gaps would require significant efforts in data collection, mining, and empirical analysis and could potentially reveal deeper inequalities in the mortality burden from PM2.5 exposure. Third, although we established robust correlations between economic growth and mortality burden, our study lacks a clear explanation of why economic growth may positively or negatively impact health at the macro level at certain stages. Future research will need to delve deeper into theoretical analysis and explore the underlying mechanisms behind these relationships. To address these limitations, future studies should (1) extend the analysis to other national contexts for broader applicability, (2) incorporate disaggregated population data to capture distributional effects, and (3) apply causal inference and structural modeling approaches to better uncover the mechanisms at work.
5. Conclusions
Mortality burden from air pollution, particularly that from high levels of PM2.5 concentrations, has long been a cause for concern in China. During our research period, the lowest mean concentration (31.32 µg/m3, SD 8.04 µg/m3, in 2021) was over 6 times the WHO-recommended annual air quality guideline (AQG) level (5 µg/m3) for PM2.5 and over 3 times the Interim Target 4 (10 µg/m3), indicating serious risks to population health. At the national level, there were over 1 million life losses from PM2.5 exposure every year, with the mortality rate being over 90 deaths per 100,000 inhabitants, which was nearly 50% higher than the world average level in year 2019 (61 deaths per 100,000 people, 95% CI 45–77). In this study, we propose two hypotheses concerning the relationship between economic development and PM2.5-attributable mortality and empirically test them using quantitative analysis. Empirical analysis showed that there was a U-shaped relationship between PM2.5-attributable mortality burden and economic growth. The coefficient of the primary term and the quadratic term of GDP per capita were −1.222 and 0.053, respectively, both of which were significant at 1% level. The results withstood different empirical testing. Meanwhile, unequal mortality burden caused by differences in social, economic, and physical geographical conditions between regions deserves greater attention. We classified cities based on mortality burden levels, city size, per capita income, and coastal location and found significant heterogeneity in the relationship in terms of coefficient magnitude and significance. The challenge of balancing economic growth and population health exists not only in underdeveloped regions (e.g., low- to middle-income cities) but also in developed areas (e.g., coastal cities), where economic growth is leading to increasing pressures on population health. Our findings offered valuable insights for further macro-policy considerations. This study investigates the causal relationship between economic development and PM2.5-attributable mortality using long-term panel data from 274 Chinese cities and a systematic regression framework. We identify a nonlinear relationship between the two, thereby addressing gaps in the existing literature. The findings offer valuable policy insights for coordinating economic growth with public health improvements and advancing sustainable development across regions. Although the causal pathway from economic growth to mortality burden remains unclear, our findings suggested that the benefits of economic growth do not “trickle down” to improve population health. Policymakers cannot take economic growth as an intrinsic good that would inevitably lead to better population health. Egalitarian welfare systems, investments in environmental improvements, and other life-supporting priorities could likely mitigate the negative health impacts of economic growth or further foster a virtuous cycle between the economy and population health. While advancing economic growth, China should simultaneously enhance air pollution control measures to mitigate associated health risks and guide urbanization within the constraints of environmental and resource capacities. To promote more equitable and sustainable development, policy efforts should prioritize the reduction of regional income disparities and the expansion of environmental infrastructure investment in less-developed areas, thereby ensuring that the benefits of economic growth are more effectively translated into improvements in public health.
Author Contributions
Conceptualization, C.X. and K.Y.; methodology, C.X.; software, Y.C.; validation, K.Y.; formal analysis, C.X.; investigation, Y.C.; resources, S.X.; data curation, S.X.; writing—original draft preparation, Y.C.; writing—review and editing, C.X.; visualization, C.X.; supervision, K.Y.; project administration, S.X.; funding acquisition, C.X. All authors have read and agreed to the published version of the manuscript.
Funding
This research was funded by Nanji Islands National Marine Nature Reserve Administration grant number 529000-I52202.
Institutional Review Board Statement
Not applicable.
Informed Consent Statement
Not applicable.
Data Availability Statement
No new data were created or analyzed in this study. Data sharing is not applicable to this article.
Conflicts of Interest
The authors declare no conflict of interest.
References
- Air pollution note—Data you need to know. (2021, September 7). Available online: https://www.unep.org/interactives/air-pollution-note (accessed on 2 February 2025).
- Anenberg, S. C., Mohegh, A., Goldberg, D. L., Kerr, G. H., Brauer, M., Burkart, K., Hystad, P., Larkin, A., Wozniak, S., & Lamsal, L. (2022). Long-term trends in urban NO2 concentrations and associated paediatric asthma incidence: Estimates from global datasets. The Lancet Planetary Health, 6(1), e49–e58. [Google Scholar] [CrossRef]
- Apte, J. S., Marshall, J. D., Cohen, A. J., & Brauer, M. (2015). Addressing global mortality from ambient PM2.5. Environmental Science & Technology, 49(13), 8057–8066. [Google Scholar] [CrossRef]
- Barlow, P. (2018). Does trade liberalization reduce child mortality in low-and middle-income countries? A synthetic control analysis of 36 policy experiments, 1963–2005. Social Science & Medicine (1982), 205, 107–115. [Google Scholar] [CrossRef]
- Beckerman, W. (1992). Economic growth and the environment: Whose growth? whose environment? World Development, 20(4), 481–496. [Google Scholar] [CrossRef]
- Bologna, J., Young, A. T., & Lacombe, D. J. (2016). A spatial analysis of incomes and institutional quality: Evidence from US metropolitan areas. Journal of Institutional Economics, 12(1), 191–216. [Google Scholar] [CrossRef]
- Brook, R. D., Rajagopalan, S., Pope, C. A., Brook, J. R., Bhatnagar, A., Diez-Roux, A. V., Holguin, F., Hong, Y., Luepker, R. V., Mittleman, M. A., Peters, A., Siscovick, D., Smith, S. C., Whitsel, L., & Kaufman, J. D. (2010). Particulate matter air pollution and cardiovascular disease. Circulation, 121(21), 2331–2378. [Google Scholar] [CrossRef]
- Burnett, R., Chen, H., Szyszkowicz, M., Fann, N., Hubbell, B., Pope, C. A., Apte, J. S., Brauer, M., Cohen, A., Weichenthal, S., Coggins, J., Di, Q., Brunekreef, B., Frostad, J., Lim, S. S., Kan, H., Walker, K. D., Thurston, G. D., Hayes, R. B., … Spadaro, J. V. (2018). Global estimates of mortality associated with long-term exposure to outdoor fine particulate matter. Proceedings of the National Academy of Sciences USA, 115(38), 9592–9597. [Google Scholar] [CrossRef]
- Callais, J., Hyde, K., Murtazashvili, I., & Zhou, Y. (2024). How does economic freedom influence public health? Evidence from U.S. cities. Southern Economic Journal, 90(3), 656–681. [Google Scholar] [CrossRef]
- Chen, F., & Chen, Z. (2021). Cost of economic growth: Air pollution and health expenditure. Science of The Total Environment, 755, 142543. [Google Scholar] [CrossRef]
- Cohen, A. J., Brauer, M., Burnett, R., Anderson, H. R., Frostad, J., Estep, K., Balakrishnan, K., Brunekreef, B., Dandona, L., Dandona, R., Feigin, V., Freedman, G., Hubbell, B., Jobling, A., Kan, H., Knibbs, L., Liu, Y., Martin, R., Morawska, L., … Forouzanfar, M. H. (2017). Estimates and 25-year trends of the global burden of disease attributable to ambient air pollution: An analysis of data from the Global Burden of Diseases Study 2015. Lancet, 389(10082), 1907–1918. [Google Scholar] [CrossRef] [PubMed]
- Fang, D., Wang, Q., Li, H., Yu, Y., Lu, Y., & Qian, X. (2016). Mortality effects assessment of ambient PM2.5 pollution in the 74 leading cities of China. Science of The Total Environment, 569–570, 1545–1552. [Google Scholar] [CrossRef] [PubMed]
- French, D. (2012). Causation between health and income: A need to panic. Empirical Economics, 42(2), 583–601. [Google Scholar] [CrossRef]
- Gao, G., Pueppke, S. G., Tao, Q., Wei, J., Ou, W., & Tao, Y. (2023). Effect of urban form on PM2.5 concentrations in urban agglomerations of China: Insights from different urbanization levels and seasons. Journal of Environmental Management, 327, 116953. [Google Scholar] [CrossRef]
- Gechert, S., & Heimberger, P. (2022). Do corporate tax cuts boost economic growth? European Economic Review, 147, 104157. [Google Scholar] [CrossRef]
- Geloso, V., & Pavlik, J. B. (2021). Economic freedom and the economic consequences of the 1918 pandemic. Contemporary Economic Policy, 39(2), 255–263. [Google Scholar] [CrossRef]
- Gradín, C., & Wu, B. (2020). Income and consumption inequality in China: A comparative approach with India. China Economic Review, 62, 101463. [Google Scholar] [CrossRef]
- Haberl, H., Wiedenhofer, D., Virág, D., Kalt, G., Plank, B., Brockway, P., Fishman, T., Hausknost, D., Krausmann, F., Leon-Gruchalski, B., Mayer, A., Pichler, M., Schaffartzik, A., Sousa, T., Streeck, J., & Creutzig, F. (2020). A systematic review of the evidence on decoupling of GDP, resource use and GHG emissions, part II: Synthesizing the insights. Environmental Research Letters, 15(6), 065003. [Google Scholar] [CrossRef]
- Han, L., Zhou, W., & Li, W. (2016). Fine particulate (PM2.5) dynamics during rapid urbanization in Beijing, 1973–2013. Scientific Reports, 6(1), 23604. [Google Scholar] [CrossRef]
- Health Effects Institute. (2020). State of global air 2020. Special report. Health Effects Institute. [Google Scholar]
- Hope, D., & Limberg, J. (2022). The economic consequences of major tax cuts for the rich. Socio-Economic Review, 20(2), 539–559. [Google Scholar] [CrossRef]
- Jin, X., Luan, W., Yang, J., Yue, W., Wan, S., Yang, D., Xiao, X., Xue, B., Dou, Y., Lyu, F., & Wang, S. (2023). From the coast to the interior: Global economic evolution patterns and mechanisms. Humanities and Social Sciences Communications, 10(1), 723. [Google Scholar] [CrossRef]
- Kahraman, A. C., & Sivri, N. (2022). Comparison of metropolitan cities for mortality rates attributed to ambient air pollution using the AirQ model. Environmental Science and Pollution Research, 29(28), 43034–43047. [Google Scholar] [CrossRef] [PubMed]
- Khomenko, S., Cirach, M., Pereira-Barboza, E., Mueller, N., Barrera-Gómez, J., Rojas-Rueda, D., De Hoogh, K., Hoek, G., & Nieuwenhuijsen, M. (2021). Premature mortality due to air pollution in European cities: A health impact assessment. The Lancet Planetary Health, 5(3), e121–e134. [Google Scholar] [CrossRef]
- Kibirige, G. W., Yang, M.-C., Liu, C.-L., & Chen, M. C. (2023). Using satellite data on remote transportation of air pollutants for PM2.5 prediction in northern Taiwan. PLoS ONE, 18(3), e0282471. [Google Scholar] [CrossRef]
- Lin, C., Li, Y., Lau, A. K. H., Deng, X., Tse, T. K. T., Fung, J. C. H., Li, C., Li, Z., Lu, X., Zhang, X., & Yu, Q. (2016). Estimation of long-term population exposure to PM2.5 for dense urban areas using 1-km MODIS data. Remote Sensing of Environment, 179, 13–22. [Google Scholar] [CrossRef]
- Lin, C. Q., Liu, G., Lau, A. K. H., Li, Y., Li, C. C., Fung, J. C. H., & Lao, X. Q. (2018). High-resolution satellite remote sensing of provincial PM2.5 trends in China from 2001 to 2015. Atmospheric Environment, 180, 110–116. [Google Scholar] [CrossRef]
- Linden, A. H., & Hönekopp, J. (2021). Heterogeneity of research results: A new perspective from which to assess and promote progress in psychological science. Perspectives on Psychological Science, 16(2), 358–376. [Google Scholar] [CrossRef]
- Liu, C., Chen, R., Sera, F., Vicedo-Cabrera, A. M., Guo, Y., Tong, S., Coelho, M. S. Z. S., Saldiva, P. H. N., Lavigne, E., Matus, P., Ortega, N. V., Garcia, S. O., Pascal, M., Stafoggia, M., Scortichini, M., Hashizume, M., Honda, Y., Hurtado-Díaz, M., Cruz, J., … Kan, H. (2019). Ambient particulate air pollution and daily mortality in 652 cities. The New England Journal of Medicine, 381(8), 705–715. [Google Scholar] [CrossRef]
- Liu, M., Huang, Y., Ma, Z., Jin, Z., Liu, X., Wang, H., Liu, Y., Wang, J., Jantunen, M., Bi, J., & Kinney, P. L. (2017). Spatial and temporal trends in the mortality burden of air pollution in China: 2004–2012. Environment International, 98, 75–81. [Google Scholar] [CrossRef]
- Liu, W., Wu, W., Thakuriah, P., & Wang, J. (2020). The geography of human activity and land use: A big data approach. Cities, 97, 102523. [Google Scholar] [CrossRef]
- Liu, Y., Tong, D., Cheng, J., Davis, S. J., Yu, S., Yarlagadda, B., Clarke, L. E., Brauer, M., Cohen, A. J., Kan, H., Xue, T., & Zhang, Q. (2022). Role of climate goals and clean-air policies on reducing future air pollution deaths in China: A modelling study. The Lancet Planetary Health, 6(2), e92–e99. [Google Scholar] [CrossRef] [PubMed]
- Lu, X., Lin, C., Li, W., Chen, Y., Huang, Y., Fung, J. C. H., & Lau, A. K. H. (2019). Analysis of the adverse health effects of PM2.5 from 2001 to 2017 in China and the role of urbanization in aggravating the health burden. Science of The Total Environment, 652, 683–695. [Google Scholar] [CrossRef] [PubMed]
- Lu, X., Lin, C., Li, Y., Yao, T., Fung, J. C. H., & Lau, A. K. H. (2017). Assessment of health burden caused by particulate matter in southern China using high-resolution satellite observation. Environment International, 98, 160–170. [Google Scholar] [CrossRef] [PubMed]
- Lu, X., Yuan, D., Chen, Y., & Fung, J. C. H. (2021). Impacts of urbanization and long-term meteorological variations on global PM2.5 and its associated health burden. Environmental Pollution, 270, 116003. [Google Scholar] [CrossRef]
- Ma, Z., Dey, S., Christopher, S., Liu, R., Bi, J., Balyan, P., & Liu, Y. (2022). A review of statistical methods used for developing large-scale and long-term PM2.5 models from satellite data. Remote Sensing of Environment, 269, 112827. [Google Scholar] [CrossRef]
- Mathers, C. D., Shibuya, K., Boschi-Pinto, C., Lopez, A. D., & Murray, C. J. (2002). Global and regional estimates of cancer mortality and incidence by site: I. Application of regional cancer survival model to estimate cancer mortality distribution by site. BMC Cancer, 2, 36. [Google Scholar] [CrossRef]
- Mo, H., Jiang, K., Wang, P., Shao, M., & Wang, X. (2022). Co-benefits of energy structure transformation and pollution control for air quality and public health until 2050 in Guangdong, China. International Journal of Environmental Research and Public Health, 19(22), 14965. [Google Scholar] [CrossRef]
- Nagano, H., Puppim de Oliveira, J. A., Barros, A. K., & Costa Junior, A. d. S. (2020). The “heart kuznets curve”? Understanding the relations between economic development and cardiac conditions. World Development, 132, 104953. [Google Scholar] [CrossRef]
- Nair, M., Bherwani, H., Mirza, S., Anjum, S., & Kumar, R. (2021). Valuing burden of premature mortality attributable to air pollution in major million-plus non-attainment cities of India. Scientific Reports, 11(1), 22771. [Google Scholar] [CrossRef]
- Nilsson, A., Bonander, C., Strömberg, U., & Björk, J. (2019). Assessing heterogeneous effects and their determinants via estimation of potential outcomes. European Journal of Epidemiology, 34(9), 823–835. [Google Scholar] [CrossRef]
- Omran, A. R. (1971). The epidemiologic transition: A theory of the epidemiology of population change. Milbank Quarterly, 39(4), 509–538. [Google Scholar] [CrossRef]
- Patterson, A. C. (2023). Is economic growth good for population health? A critical review. Canadian Studies in Population, 50(1), 1. [Google Scholar] [CrossRef]
- Plass, D., Hilderink, H., Lehtomäki, H., Øverland, S., Eikemo, T. A., Lai, T., Gorasso, V., & Devleesschauwer, B. (2022). Estimating risk factor attributable burden—Challenges and potential solutions when using the comparative risk assessment methodology. Archives of Public Health, 80, 148. [Google Scholar] [CrossRef] [PubMed]
- Rajan, K., Kennedy, J., & King, L. (2013). Is wealthier always healthier in poor countries? The health implications of income, inequality, poverty, and literacy in India. Social Science & Medicine, 88(C), 98–107. [Google Scholar]
- Ranis, G., & Stewart, F. (2000). Economic growth and human development. World Development, 28(2), 197–219. [Google Scholar] [CrossRef]
- Rentschler, J., & Leonova, N. (2023). Global air pollution exposure and poverty. Nature Communications, 14, 4432. [Google Scholar] [CrossRef]
- Sacks, D. W., Stevenson, B., & Wolfers, J. (2012). The new stylized facts about income and subjective well-being. Emotion, 12(6), 1181–1187. [Google Scholar] [CrossRef]
- Shen, H., Shen, G., Chen, Y., Russell, A. G., Hu, Y., Duan, X., Meng, W., Xu, Y., Yun, X., Lyu, B., Zhao, S., Hakami, A., Guo, J., Tao, S., & Smith, K. R. (2021). Increased air pollution exposure among the Chinese population during the national quarantine in 2020. Nature Human Behaviour, 5(2), 239–246. [Google Scholar] [CrossRef]
- Shen, H., Tao, S., Chen, Y., Ciais, P., Güneralp, B., Ru, M., Zhong, Q., Yun, X., Zhu, X., Huang, T., Tao, W., Chen, Y., Li, B., Wang, X., Liu, W., Liu, J., & Zhao, S. (2017). Urbanization-induced population migration has reduced ambient PM2.5 concentrations in China. Science Advances, 3(7), e1700300. [Google Scholar] [CrossRef]
- Southerland, V. A., Brauer, M., Mohegh, A., Hammer, M. S., van Donkelaar, A., Martin, R. V., Apte, J. S., & Anenberg, S. C. (2022). Global urban temporal trends in fine particulate matter (PM2.5) and attributable health burdens: Estimates from global datasets. The Lancet Planetary Health, 6(2), e139–e146. [Google Scholar] [CrossRef]
- Suzuki, K. (2022). Corporate tax cuts in a Schumpeterian growth model with an endogenous market structure. Journal of Public Economic Theory, 24(2), 324–347. [Google Scholar] [CrossRef]
- Swift, R. (2011). The relationship between health and GDP in OECD countries in the very long run. Health Economics, 20(3), 306–322. [Google Scholar] [CrossRef] [PubMed]
- van den Brekel, L., Lenters, V., Mackenbach, J. D., Hoek, G., Wagtendonk, A., Lakerveld, J., Grobbee, D. E., & Vaartjes, I. (2024). Ethnic and socioeconomic inequalities in air pollution exposure: A cross-sectional analysis of nationwide individual-level data from The Netherlands. The Lancet Planetary Health, 8(1), e18–e29. [Google Scholar] [CrossRef]
- van Donkelaar, A., Hammer, M. S., Bindle, L., Brauer, M., Brook, J. R., Garay, M. J., Hsu, N. C., Kalashnikova, O. V., Kahn, R. A., Lee, C., Levy, R. C., Lyapustin, A., Sayer, A. M., & Martin, R. V. (2021). Monthly global estimates of fine particulate matter and their uncertainty. Environmental Science & Technology, 55(22), 15287–15300. [Google Scholar] [CrossRef]
- Vos, T., Lim, S. S., Abbafati, C., Abbas, K. M., Abbasi, M., Abbasifard, M., Abbasi-Kangevari, M., Abbastabar, H., Abd-Allah, F., Abdelalim, A., Abdollahi, M., Abdollahpour, I., Abolhassani, H., Aboyans, V., Abrams, E. M., Abreu, L. G., Abrigo, M. R. M., Abu-Raddad, L. J., Abushouk, A. I., … Murray, C. J. L. (2020). Global burden of 369 diseases and injuries in 204 countries and territories, 1990–2019: A systematic analysis for the global burden of disease study 2019. The Lancet, 396(10258), 1204–1222. [Google Scholar] [CrossRef] [PubMed]
- Wang, J., Zhao, B., Wang, S., Yang, F., Xing, J., Morawska, L., Ding, A., Kulmala, M., Kerminen, V.-M., Kujansuu, J., Wang, Z., Ding, D., Zhang, X., Wang, H., Tian, M., Petäjä, T., Jiang, J., & Hao, J. (2017). Particulate matter pollution over China and the effects of control policies. Science of The Total Environment, 584–585, 426–447. [Google Scholar] [CrossRef]
- Wang, Y., Wang, Y., Xu, H., Zhao, Y., & Marshall, J. D. (2022). Ambient air pollution and socioeconomic status in China. Environmental Health Perspectives, 130(6), 067001. [Google Scholar] [CrossRef]
- Wu, Y., Shi, K., Chen, Z., Liu, S., & Chang, Z. (2022). Developing improved time-series DMSP-OLS-Like data (1992–2019) in China by integrating DMSP-OLS and SNPP-VIIRS. IEEE Transactions on Geoscience and Remote Sensing, 60, 4407714. [Google Scholar] [CrossRef]
- Xu, F., Huang, Q., Yue, H., Feng, X., Xu, H., He, C., Yin, P., & Bryan, B. A. (2023). The challenge of population aging for mitigating deaths from PM2.5 air pollution in China. Nature Communications, 14(1), 5222. [Google Scholar] [CrossRef]
- Yan, X., Zang, Z., Luo, N., Jiang, Y., & Li, Z. (2020). New interpretable deep learning model to monitor real-time PM2.5 concentrations from satellite data. Environment International, 144, 106060. [Google Scholar] [CrossRef]
- Zhu, S., Tang, J., Zhou, X., Li, P., Liu, Z., Zhang, C., Zou, Z., Li, T., & Peng, C. (2023). Research progress, challenges, and prospects of PM2.5 concentration estimation using satellite data. Environmental Reviews, 31(4), 605–631. [Google Scholar] [CrossRef]

Disclaimer/Publisher’s Note: The statements, opinions and data contained in all publications are solely those of the individual author(s) and contributor(s) and not of MDPI and/or the editor(s). MDPI and/or the editor(s) disclaim responsibility for any injury to people or property resulting from any ideas, methods, instructions or products referred to in the content. |
© 2025 by the authors. Licensee MDPI, Basel, Switzerland. This article is an open access article distributed under the terms and conditions of the Creative Commons Attribution (CC BY) license (https://creativecommons.org/licenses/by/4.0/).