Article

The Tariff Liberalisation Policy Nexus with Non-Tariff Measures: Panel Model Evidence in the SA–EU Fruit Products Trade

by
Chiedza L. Muchopa
Department of Agricultural Economics, University of Limpopo, Polokwane 0727, South Africa
Economies 2025, 13(1), 1; https://doi.org/10.3390/economies13010001
Submission received: 5 November 2024 / Revised: 12 December 2024 / Accepted: 20 December 2024 / Published: 25 December 2024

Abstract

:
Higher levels of quota granted can induce and increase exports, but the impact is not the same across all tariff lines. Answers are sought to the question of how the level of exports changes as the quota size of tariff rate quotas changes, thus enabling the investigation of whether unilateral quotas granted to South Africa by the European Union have influenced fruit products’ export flows in the presence of non-tariff measures. Drawing on panel data regression techniques, this study observes five fruit products’ tariff rate quotas repeatedly from 2004 to 2021. It also incorporates a variable to capture non-tariff measures based on the data from the WTO I-TIP database. The findings indicate a positive relationship between quota size and exports, further showing that for a given quota size, the increase in exports is small in the presence of non-tariff measures. These findings draw attention to future trade reforms that focus on seeking the expansion of quota size for the most productive tariff lines in terms of export growth while aiming for the simultaneous reduction of non-tariff measures and tariff rates.

1. Introduction

World markets for food are integrated through international trade wherein free trade agreements (FTAs) incorporate provisions to remove certain trade barriers (Ofori-Amoah, 2024). One of many expectations with FTAs is that a variety of consumer foods are availed at lower prices, which in turn can ensure the security of consumption for those foods in the importing country. Fruits are recognised as an important part of healthy diets, and international trade plays a role in promoting access, albeit in the presence of trade barriers, such as tariff rate quotas (TRQs). Agricultural trade provisions in FTAs past and present are also designed and expected to promote the development and expansion of agricultural exports for the country receiving preferences (Gil-Pareja et al., 2019) with the insight that there are gains from trade (Krugman & Obstfeld, 2018). In that regard, preferences such as TRQs, presented as instruments of trade liberalisation under FTAs, are considered one of the ways for developing nations to reach international trade global value chains (GVCs). Trade is facilitated through the reduction of trade barriers that include non-tariff measures (NTMs) and tariffs (Vickers, 2018; Ajewole et al., 2022). Although the goal of TRQs as an instrument of trade policy is to manage trade in a country’s sensitive sectors, TRQs serve both the purpose of increasing supplies of food in importing markets as well as doing so at lowered prices. In the case of exporting nations such as South Africa that have a vibrant fruit export sector, TRQs pave the way to improve access to markets such as the European Union. However, as NTMs are being instituted to respond to the food safety concerns of importing developed nations (Wen et al., 2018), they have contributed to barriers for exporters, mainly from developing countries (Suanin, 2023). NTMs, such as sanitary and phytosanitary (SPS) measures, can have the same effect on domestic consumers in an importing country when acting as a ban, which, as elaborated in Fathelrahman et al. (2024), tends to result in increased domestic prices for consumers thus leading to welfare losses. While NTMs are considered to be a legitimate institutional innovation to ensure food safety, there is a general consensus that such responses are increasingly being used protectively (Kumar & Bharti, 2020), becoming more stringent, limiting imports and indirectly reducing the consumer choice of healthy options such as fruits and vegetables where such barriers are more prevalent. The relationship between exports and NTMs is, however, not absolute, hence the need for this present study to investigate the particular SA–EU case of fruit products and to add to the public debate on the use of trade policy instruments in bilateral trade agreements.
The subject of the utilisation of TRQs continues to dominate agricultural trade liberalisation debates questioning the commercial viability of access to developed nations’ markets by developing nations (Abbot, 2002; Rena, 2008; Revell, 2017; Beckman et al., 2021). Such debates culminating from World Trade Organisation (WTO) member countries showing interest in understanding the factors impacting quota usage have been topical at the WTO Committee meetings on Agriculture (Orden et al., 2019; Jackson et al., 2020; Beckman et al., 2021). The member states of the WTO are interested in improved market access for their own export commodities in order to benefit their economies. The seminal work of Skully (1999b) describes the functioning of TRQs, noting the three components of a TRQ, namely quota size, in-quota tariff, and out-of-quota tariff. The theory of the functioning of TRQs, therefore, forms the basis of the present study. Even though the quota size is expected to positively relate to the growth of exports, the persistent under-fill (Muchopa et al., 2019; Muchopa, 2021) of unilateral quotas has ignited some debates on the suitability of the TRQ instrument as a trade liberalisation tool thus questioning the instrument’s ability to improve export growth and development.
The inability of exporters to fill TRQs worldwide has generated immense debate (Chen et al., 2020; Chow & Sheldon, 2024), and the reasons for under-fill remain ambiguous. As tariff barriers have continually been reduced, NTMs have become more prevalent (Saini, 2011; Kirpichev & Moral-Benito, 2018; Bellmann & Sugathan, 2022). The OECD (2024) explains NTMs as all policy measures (other than tariffs and TRQs) directly impacting trade. The ambiguous impact of NTMs is noted and acknowledged, indicating that sanitary and phytosanitary (SPS)- related NTMs can increase trade costs, though, on the one hand, they can also raise demand in the domestic markets as well as increase exports (OECD, 2019). While trade has been recognised as playing an important part in the achievement of Agenda 2030 and the sustainable development goals (SDGs), in general, the targets to achieve the SDGs are lagging (Sachs et al., 2023) and given the recent experiences in global supply chain disruptions, criticism is abounding on trade policies that hinder the free flow of commodities. SDG 2 is relevant to the present study in as much as global food systems depend on trade, hence, understanding the barriers and distortions can assist with the target to improve food security and nutrition. It is prudent, therefore, to improve the understanding of the nexus of trade policies and particular influential factors.
In-quota tariffs for fruit products exports exported under the trade liberalisation regime implemented between South Africa (SA) and the EU have generally been reduced based on trade preferences granted by the EU. The Trade, Development and Cooperation Agreement (TDCA) came into full effect in May 2004 and was replaced by an Economic Partnership Agreement (EPA) in 2016, the Southern African Development Community—European Union—Economic Partnership Agreement (SADC–EU–EPA) (European Commission, 2018, 2021, 2022a, 2022b). The importance of TRQ preferences offered to South Africa by the EU varies in their contribution to each sub-sector. It is not possible to generalise as to whether TRQs work or do not work as evidence of their impact is case-specific. Therefore, more needs to be understood in the fruit products context. While opportunities exist in the processed fruit trade, this is also a sector that faces restrictions in terms of sensitive product definitions. Joshi (2013) concludes that ‘products that are highly protected do not get high preferential access even at the regional level’. Given that TRQs are considered a blueprint to promote market access in restricted export markets, they remain an important tool in the trade liberalisation debate. Proponents of the TRQ trade liberalisation policy instrument argue that TRQs enhance exports of sensitive agricultural products, yet in other quarters, such a policy is considered a second-best policy given the restrictions that are placed on the trade of sensitive agricultural products. Despite the justification for TRQs, there are reported mismatches between quota size granted and export levels observed, highlighted in studies reporting quota under-fill.

1.1. Research Gap Identified Through Literature

Various studies, including Chen et al. (2020); Beckman et al. (2021); Jafari et al. (2021); Muchopa (2021); and Fry (2023), have been conducted in different contexts and regions to analyse TRQs, but the debate is far from ending. There are growing claims that NTMs are increasingly replacing tariffs as countries pursue full tariff liberalisation policies, possibly explaining the continued low export growth. Studies such as Nilsson (2018) and Grubler and Reiter (2021) continue to note that NTMs have been on the rise, and in the context of fruit products, the NTMs range from pesticide residue limits, geographical indicators, import licensing procedures, and labelling requirements, among others. Recent studies (Orefice, 2017; Ghodsi & Stehrer, 2022; Ghodsi, 2023) further discuss the NTMs–tariff nexus. Muchopa et al. (2019, 2020, 2021) provide evidence that the reduction of NTMs leads to an increase in exports. The reasoning advanced, therefore, in the previous studies is that, for exports to grow, trade barriers must be lowered or removed. However, given that nations are always seeking to protect domestic producers, albeit trade agreements in place, the TRQ instrument has found resonance in situations where a country’s sensitive sectors need to be shielded from competition. There are suggestions, therefore, that the implementation of NTMs further frustrates trade under a given TRQ regime. This question of the relationship between NTMs and the TRQ trade liberalisation instrument has received less attention. Hence, the present study addresses that research gap. Various angles can be taken to understand this question, and in the present paper, this nexus of TRQs and NTMs is investigated by answering specific questions in the South African context concerning the export response of fruit products to unilateral quota preferences of the European Union. The second question investigated relates to whether the presence of NTMs affects the level of exports for the given trade preferences (TRQs for selected fruit products).
Scanty research exists on the impact of TRQ preferences on exports in individual sectors, such as that of fruit products. Studies such as Jordaan and Kanda (2011), conducted on the impact of trade agreements on exports, ignore the circumstances of individual sectors in the way in which the preferences may be utilised. This is confirmed in a previous study by Yuan and Awokuse (2003), noting that the aggregation of trade data in the analyses conducted implies the presence of uniform impacts across commodities, which, however, is not the case. Hence, the authors advocate for the use of commodity-specific trade data. This present paper analyses the impact of the TRQ instrument (decomposed into its three component variables, that is, the quota, the in-quota tariff, and the out-of-quota tariff) on the quantity of exports and further links that with the analysis of the effects of NTMs imposed on trade flows in the period from 2004 to 2021. The mechanisms by which the TRQ policy is applied to the fruit products work are elaborated by Muchopa et al. (2019). Hence, the present study extends the work of Muchopa et al. (2019), which considers a Global Trade Analysis Project (GTAP) Computable General Equilibrium (CGE) scenario to determine the economic welfare impacts of the removal of NTMs for a combined offering of fruit products’ TRQs.
To address the identified research gap in Muchopa et al. (2019) and other studies mentioned earlier, a different and disaggregated data set is employed in a panel model to consider whether there are substantial differences in the responsiveness of export levels to the TRQ level or size across the different fruit products which are being traded in the presence of NTMs. Export flows for the fruit products receiving preferences differ, and the utilisation of preferences also differs across the commodities. Therefore, the assessment of the relationship between the quota preference level and the actual export level is important in terms of the tariff lines receiving preferences in the presence of NTMs. The present study analyses the relationship between the size of the allocated tariff rate quotas and export growth to understand whether quota expansion directly affects export growth. Therefore, an econometric application of fruit products as a case study observed for the years 2004 to 2021 serves to contribute to the literature on TRQ preferences. Causality is tested between the permitted/allocated quota quantities and the actual export flows in the presence of additional identified NTMs to the TRQ itself.
The fixed effects model used in this study answers the relevant questions pertaining to whether differences are observable over time in terms of export level changes in the context of a panel of five different fruit products’ TRQs. To the author’s knowledge, no such study has been carried out utilising fruit products’ TRQ data, and there is no other study that has analysed fruit products’ TRQs as cross-section units for the SA–EU preferential trade under preferences. No published papers have employed the fixed effects model to examine the relationship between TRQs, NTMs, and exports in the context of the SA–EU fruit products trade. By finding out the extent to which NTMs have an impact on exports, this study contributes to the growing literature on NTMs’ impacts on trade, in addition to the literature that examines how trade liberalisation affects exports. Using panel data that tracks the selected TRQs over time, the present study shows that the magnitude of impact on exports is accounted for by the interaction of NTMs and high tariffs, accounting for a 24% decrease in exports. The quota size is significant in influencing exports, wherein a 1% increase in the size of the quota leads to a 2.29% increase in exports.
This paper is organised as follows. After the introduction, in Section 2, a review of the literature is provided, and as part of the literature review, a brief discussion of the institutional arrangements governing the South Africa–EU trade of fruit products is given. Further to it, a description of the applicable framework of analysis is presented. Section 3 lays out the methodology and the data sources used in this paper, including the empirical specification of the fixed effects model. Section 4 presents the results, followed by the conclusion in Section 5.

2. Literature

The brief presentation of the institutional background and policy environment of SA–EU fruit products trade is followed by the theoretical and empirical literature relevant to this study. An outline of the conceptual framework of the study is then presented. Two streams of literature focused upon in this review concern TRQs as trade liberalisation instruments and NTMs as barriers to export growth. The theory of trade liberalisation underlies the present study wherein the Heckscher–Ohlin Trade Theorem, as noted in Acharya (2015), is the theoretical foundation. Recognised procedures in trade policy impact analysis have gradually evolved, and this present study’s findings are placed within the literature on trade liberalisation through free trade agreements (FTAs), which contain TRQ obligations as the trade liberalisation instrument. In addition, reference is made to the NTM literature in the context of NTMs as a determinant of export growth. The literature is scarce on the consequences of export growth in the presence of NTMs for trade that occurs under TRQs.

2.1. Brief Institutional Background and Policy Environment of SA–EU Fruits Products Trade

The EU is featured as a major destination for exported commodities from developing countries under TRQs and/or other trade preferences (Shepherd & Wilson, 2013; Cirera et al., 2016). South Africa is no exception to benefitting from developed nations’ preferences targeted at developing nations (Keck & Lendle, 2012), given the TDCA and the SADC–EU–EPA.
Between the period 2004 and 2016, the trade chapter formed the basis for South African exports of sensitive products on the EU list, and thereafter, the SADC–EU–EPA replaced the trade chapter of the TDCA in 2016. The governance of TRQs in SA–EU trade is well documented in various documents and past studies (TRALAC, 2018; Muchopa et al., 2019; Kaziboni, 2020). It is indicated that registered exporters apply for permits to export under TRQs based on the annual quotas advertised in government gazettes. There are specific conditions that the applicants must meet to be eligible to be allocated a quota permit, and these include export history and tax clearance. The quota permit holders are also expected to comply with EU regulations for exports, including the rules of origin and EU SPS, as well as technical regulations. It is also laid down in Council Regulation (EC) No. 2793/1999 that certain tariff line quotas will suitably be managed through import licenses while others are managed on a first-come, first-served basis. Registered exporters applying for TRQs granted on a first-come, first-served basis do so through the South African Revenue Service (SARS), and allocations are made until the quota is full.
A summary of policy events identified for the period under investigation and relevant to fruit product exports in South Africa is presented in Table 1.
During this period (2004–2021), several policy events occurred in the trade arrangements, which included revisions of the trade agreement after 5-year implementation intervals. In addition, a change from the TDCA trading framework to the SADC–EU–EPA framework occurred in the year 2016 (European Commission, 2022a). As a result, certain changes also occurred in the trade policy governing the fruit products exports from South Africa to the EU, such as the reduction in the size of TRQs, capping of the quantities, combining some TRQs, as well as the introduction of new TRQs.

2.2. Brief Theoretical and Empirical Literature

The institution of TRQs, including governance, is contained in Article XIII of the General Agreement on Tariffs and Trade (GATT), which also provides latitude to the WTO member countries to implement TRQ administration methods of their choice to the extent that in certain circumstances the administration method can controversially become an impediment to market access (Lohmar & Skully, 2003; Delev, 2023). The administration of TRQs, therefore, has the potential to enhance or constrain market access. The literature on the economics and functioning of TRQs is well established and elaborated in the seminal work of Skully (1999a, 1999b, 2000, 2001). For further details on exporter-administered fruit products’ TRQs granted to South Africa by the EU under the TDCA, see Muchopa et al. (2019, 2020, 2021) for a detailed discussion. The situation of unfilled TRQs, such as that for the frozen strawberries analysed in Muchopa et al. (2021), is a situation anticipated in GATT Article XII where, according to Lohmar and Skully (2003), it is established that if the import demand is insufficient, naturally there might be under-fill or no imports with the understanding that the TRQ is not an agreement for minimum purchase. Additionally, the TRQ size might also not be economical for exporters if the preference amount is deemed too small for an exporter to make meaningful trade gains.
Bureau and Tangermann (2000) describe the European Union TRQs and their origin. Skully (2001) describes the different types of TRQ administration systems. Based on the foundations of trade liberalisation, the lowering of tariffs is expected to decrease the costs of imported food (Thow, 2009). Lohmar and Skully (2003) use the example of China’s administration of TRQs for grains and cotton following a year of implementing the TRQ system that had been introduced in 2002 as part and parcel of China’s entry into the WTO in 2001. Evidence is provided that the importer administration of a TRQ by China posed no significant disruption to imports into that country.
Following the pivotal work of Abbot (2002) on the administration of TRQs and under-fill problems, other recent studies (e.g., Chen et al., 2020; Beckman et al., 2021; Jafari et al., 2021; Muchopa, 2021) also provided evidence on the under-fill of TRQs. When the quotas are not filled, that situation culminates in what Woolfrey & Bilal (2017) point out to be the failure of trade agreements such as free trade areas (FTAs) and/or economic partnership agreements (EPAs) to alter market access. To that end, TRQs may be deemed insignificant in their effects on global value chain participation by developing countries that are usually the main targets of export market access policies contained in FTAs. Jafari et al. (2021), in a study of the meat and dairy sectors of the Canada–EU agreement, argue that TRQs often provide barriers to trade given that the instrument itself scarcely gets fully liberalised. Grant et al. (2022) present findings on the firm-level analysis of China’s TRQs for wheat, corn, and rice import intensity linked to the administration of TRQs.
The important relationships suggested in economic theory elaborate that TRQs should promote increased export flows to markets that would be closed without such an instrument in place. Non-tariff measures, which are part of the behind-the-border costs imposed on imports, include sanitary and phytosanitary (SPS) measures, technical barriers to trade (TBT), and quantitative restrictions and safeguards, among others (UNCTAD, 2012; Ghodsi, 2023; OECD, 2024) and it is noted in Grubler and Reiter (2021) that NTMs have continuously been replacing tariffs. Dolabella (2020) focuses on two specific measures of NTMs, namely SPS and TBT, to understand their relationship with trade. The study used a gravity model and averaged effects over a wide range of HS six-digit products to find that TBT measures are more restrictive than SPS measures. Ghodsi (2023) explains that the presence of NTMs, specifically SPS and TBT measures, is motivated by the need to regulate the importing market in response to market failure concerning health security and threats of harmful products. Thus, NTMs are considered as either enhancing trade or as barriers (Kirpichev & Moral-Benito, 2018), depending on the context.
The theoretical literature on the relationship between NTMs and exports in the processed food sector is ambiguous. Shepotylo (2016), in a study focusing on NTMs impacting seafood exports, concludes that SPS and TBT measures have opposite effects on trade volumes and that across HS six-digit products, the response to NTMs is heterogeneous. Fall and Langle (2020), in a study on South African firms, conclude that the firms benefit from trade liberalisation measures in export markets and, specifically, with positive spillover effects due to NTM liberalisation. Jafari and Britz (2018) assert that the impact of FTAs in the modern day largely depends on the change in NTMs that affect trade costs.
The findings of the study by Cipollina and Demaria (2020) confirm the ambiguity of the effects of non-tariff barriers in support of other studies (Shepotylo, 2016; Kirpichev & Moral-Benito, 2018; Zainuddin et al., 2020; Tchakounte & Fiankor, 2021). Non-tariff barriers were found to negatively affect trade in general, but when a distinction between the types of barriers is made, the authors present that the positive impacts of SPS measures on trade overcome the negative impacts presented by TBT measures and other trade barriers. The study used a structural gravity model, and the presence of non-tariff barriers was captured by dummies. In conclusion, the study of Cipollina and Demaria (2020) identifies the need for studies, such as that conducted in the present paper, where a different indicator of non-tariff barriers is used in a panel data setting for specific products. The specific FTA case study is also a focus of the present paper; hence, it is useful to policymakers and trade negotiators in that context.
In addition to the results on NTM impacts being ambiguous, the results also vary in different sectors. NTMs are also prevalent in non-agricultural sectors, such as the textile example of India analysed in Saini (2011). The impact of NTMs is analysed, revealing that the EU and United States impose a high number of NTMs which are restrictive in nature. The study by Saini (2011) also notes the proliferation of NTMs and indicates that many NTMs are targeted at developing countries in areas such as textiles and food products. The present study, therefore, contributes to the literature on studies analysing the NTMs’ impacts that are prevalent in the food products sector imposed by the developed nations on developing countries. In the study by Saini (2011), it is asserted that NTMs are a factor that is important in affecting developing country exports destined to developed countries. Hence, the present study will control for NTMs in the analysis.
The quantitative effects of quota size and NTMs on exports are examined in studies such as Berden et al. (2009); Kirpichev and Moral-Benito (2018); and Fall and Langle (2020). Kirpichev and Moral-Benito (2018) conclude that NTMs reduced export growth between the range of 37–74% at the product destination level. Berden et al.’s (2009) assessment of NTMs presents that 25% of NTMs are considered regulatory and cannot be eliminated. In the context of the present study, it can be expected that while the trade agreement between SA and the EU aims to achieve a reduction in the trade restrictiveness of NTMs, the 25% of those realistic NTMs suggested in Berden et al. will still exist (2009).
The new trade theory, as suggested in Melitz (2003), posits that the increase in costs of exporting will negatively impact both the quantity and variety of exports, hence informing the framework described below (Section 2.3) used to analyse data for the present study. The research question in this paper seeks to provide an understanding of whether exports expand for the source country receiving TRQs while taking into account the presence of NTMs.

2.3. Conceptual Framework

Outlined in Figure 1 is a conceptual framework to capture the pathway of factors considered in the data analysis for the present study. To consider the link between TRQs and NTMs in determining export flow, the framework is presented in four domains. The impact on exports in this nexus is the empirical question that the present paper tackles. Conceptually, within the sector for which market access is opened, there is a shift in the share of the exports among the TRQs, as the incumbent firms are involved in several of the TRQs. The opening up of market access (i.e., use of the TRQ policy instrument) is expected to lead to the expansion of exports (Vickers, 2018; Gil-Pareja et al., 2019; Ajewole et al., 2022) as South Africa receives preferential access to the market for “EU sensitive products”. The TRQ components of the low or zero in-quota tariff and the size of the quota which is offered should reduce constraints, thus enticing South African exporters to export more to the EU, yet the added frictions such as the out-of-quota tariff as well as the number of NTMs can lead to either the expansion or contraction of exports (Kirpichev & Moral-Benito, 2018; Cipollina & Demaria, 2020).
The first column, presented as the trade enabling environment, theorises the identification of the offensive list of products (for the exporter), which informs the basis for the TRQs included in the FTA negotiations for the TRQs. The trade enabling environment comprises and includes the products that are on South Africa’s offensive list in the trade negotiations that can be awarded market access on the EU-sensitive list of fruit products through the TRQ instrument as obligated in the trade agreement. The European Commission (2022b), in explaining the use of TRQs, acknowledges that, considerably for the agricultural sector, the EU agreements purposefully protect sensitive sectors when providing market access. The TRQ obligations and provisions contained in the FTA, therefore, spell out the determinants comprising the components of a TRQ (size and tariffs, as well as how NTMs are perceived). The determinants influence the filling of the availed quota, which ultimately manifests in the changes (expansion, contraction, or zero flow) in exports.
The trade liberalisation context (TDCA, SADC–EU–EPA) for the governance of TRQs, i.e., TRQ administration, the demand and supply context, as well as other underlying factors such as NTMs and tariffs, collectively determine the immediate trade outcomes of quotas being filled or not filled. The market access outcome is determined through and related to the quota size, in-quota tariff, out-of-quota tariff, as well as the NTMs that are prevalent for each TRQ. Given the EU’s need to control market access for sensitive products, it may be that the quota level granted/conceded by the EU in a preferential trade agreement may be lower for products that have higher most favoured nation (MFN) tariffs and higher for products with lower MFN tariffs. This may lead to preferential quotas either being filled or not filled. The impact, therefore, of the TRQ liberalisation instrument can lead to three different outcomes where the exports grow/expand, contract, or where no exports occur at all under the TRQ. This nexus is further elaborated in Section 3.1, detailing variable selection. The direction and magnitude of the outcome or effects of the TRQ can be empirically determined through Equation (4), presented in Section 3.3.

3. Methodology

The study questions that are laid out in this present paper are answered with the assistance of the models elaborated in this section. The present paper’s main objective is to investigate the influence of preferential quotas on exports over time while accounting for the presence of NTMs. The data used and the variables selected are described, followed by an explanation of the estimation methodology. The processes of data collection, the checking of the stationarity properties of the data, as well as model selection, are also elaborated.

3.1. Variables Selection

To determine the effect on exports, the core explanatory variable investigated in this study is the preferential quota level/size (QTL). However, according to the trade theory literature (De Melo & Shepherd, 2018; Kinzius et al., 2019), exports are also affected by tariffs and non-tariff measures. Hence, these two control variables are also selected and added to the model. In the estimation equation presented in Section 3.3, the quantity of TRQ exports is the dependent variable, which is the indicator of the level of market access under the given trade regime. The literature also indicates that the expected change in export quantities of sensitive products depends on the availability of not only the quota availed but also the NTMs imposed. Hence, this specification is included by generating an interaction term between the NTMs and the quota level variable. Two types of tariff components included in the formulation of indicator variables contained in the model are the in-quota tariff (IQT) and the out-of-quota (MFN) tariff.
Drawing motivation for the inclusion of indicator variables from Joshi (2013), two indicator tariff variables, each for the IQT and MFN, are determined based on calculating a cut-off value for the relevant tariff. The NTM effect is expected to vary depending on the tariff level being implemented. Given that the tariff lines comprising a TRQ have different tariff rates, a simple average (following Joshi, 2013) of the ad valorem tariff is calculated. The tariff cut-off point is determined by averaging the tariff rates of all tariff lines combined in a particular TRQ. The calculated average for the MFN tariff is 17.89% and 8.9% for the in-quota tariff, thus presenting the threshold for each of the variable indicators. It might also be that the EU imposes more NTMs on products with lower or zero in-quota tariffs than those with higher tariffs; therefore, the interaction of the two explanatory variables was undertaken. The NTM is the slope variable, and it interacts with the IQT dummy, which is the indicator variable for low (IQTs) and high (IQTh) tariffs. The NTM effect could be different for the high and low tariffs case therefore, IQTs is 1 if the tariff rate is smaller than the average (8.96%) and 0 otherwise. The IQTh is 1 if the tariff rate is higher than the average and 0 otherwise. The MFN indicator also additionally interacted with the quota level (QTL) variable.
The variables and indicators used in the analysis are listed and described in Table 2, including the data sources. The NTM data does not exist per TRQ. The data had to be compiled based on WTO Integrated Trade Intelligence Portal (ITIP) data, which is available at the tariff line level.
A trade policy regime explanatory variable is included in the model, given the change of trade regime from the TDCA to the SADC–EU–EPA. Specifically, with this change in trade regime, the yearly calculation of quota level obligations/preferences differs in the two regimes. Hence, the interaction of the quota level variable with an explanatory policy dummy captures the policy change.

3.2. Description of the Data Used

The research needs for this paper directed the sample of the data selected. To that end, the years 2004, 2012, and 2016 covered in the sample are notable in terms of the trade agreement between SA and EU, as elaborated through policy events presented in Table 1 (Section 1.1). The selected starting date of the sample period in 2004 was the year that the TDCA came into full effect, and that year also coincided with the onset of the negotiation period for the SADC–EU–EPA, which lasted up to 2014 (a total of ten years). The estimation period in the analysis is, therefore, from 2004 to 2021, allowing for the inclusion of 5 years post the inception of the SADC–EU–EPA. The 18 years analysed are long enough, given that in this period, the TDCA became fully implemented in 2012, and the trade component was replaced by the SADC–EU–EPA, signed in 2016, which continued offering the same TRQs and more.
A balanced panel of 90 observations comprising a cross-section of 5 fruit products TRQs observed over 18 years was therefore constructed. Fruit products are among the sensitive products subjected to TRQs in the SA–EU trade. Only the fruit products common to both the TDCA and SADC–EU–EPA trade regimes are described in Table 3, representing the fruit products trade concessions of the European Union to South Africa. The EU disaggregates the TRQs by order number, corresponding to the EU preference offer defining either one or several tariff lines at the HS 6-digit level that comprise the fruit products’ TRQs specified in the data. A citrus jams TRQ not included in the table was subsequently introduced to the SADC–EU–EPA and, hence, was not considered in the present analysis.
The types of NTMs present by TRQs and manifesting through regulations on certification, labelling, and safety standards, among others, include sanitary and phytosanitary (SPS), technical barriers to trade (TBT), and quantitative restrictions (QR), are also shown in Table 3. The TRQs are both firm and sectoral-specific. The nature of the fruit products sector in South Africa is such that there is dominance by a few firms, and, unsurprisingly, the participating firms are those with a competitive advantage.

3.3. Model Specification and Estimation

The process of establishing the relationship between the selected variables starts with investigating the time series properties of the variables and conducting unit root testing (Shrestha & Bhatta, 2018). The data is then pretested for model suitability (Section 3.3.2).

3.3.1. Time Series Properties of the Data

A variety of tests were conducted to investigate the time series properties of the data, and these included the relevant panel unit root tests for stationarity. The methodology for testing the panel unit root, based on the Levin, Lin, and Chu (LLC) test for stationarity elaborated in Levin et al. (2002), was followed. The estimation was performed using EViews 8. The LLC panel unit root test for stationarity was selected as the suitable test given the wide acceptance of this test and, more specifically, in international trade studies. The test enables the testing of stationarity for all series in a panel and not just one series, as the IPS test does. It is conventionally accepted that if all variables are stationary, the analysis of the relationship between variables can be conducted using the traditional OLS method. The LLC results are presented in Table 4.
The LLC test’s p-values with the intercept and trend at 1st differences of the logged variables are less than 5%. Therefore, the null hypothesis that all panels contain a unit root is rejected. The logged variables EXP, QTL, and NTM are stationary in the first difference.

3.3.2. Pre-Testing of Data and Model Suitability

Two tests were conducted to select the most appropriate model to conduct the analysis. The Chow test was conducted to determine the appropriateness between the common effects (CE) and fixed effects (FE) models (Binkley & Young, 2023), for which the fixed effects model was selected based on the results. The Hausman test was used to determine the most appropriate model between the random effects (RE) model and the fixed effects model.
The null hypothesis states that the coefficients estimated by the inefficient RE estimator and by the efficient FE estimator are the same. If the p-value is less than 0.05, the FE model is the suitable model, and if the p-value is greater than 0.05, the RE model is selected. The test for the fixed effects μi, which is the test for redundant fixed effects, is given as
H0: μ1 = ⋯ = μ5 = μ
If the null hypothesis holds, then the model does not have fixed effects.
The Hausman test results confirmed the FE model as the most appropriate model (Table 5), showing that the differences between the fruit products’ TRQs can be “accommodated from different intercepts”. The estimation of the FE model is therefore suitable as it eliminates the source of omitted variable bias that could have arisen due to the unobserved “between TRQ differences” of the “quality or sophistication of the TRQ”. In some cases, the TRQs have many tariff lines, and others have one tariff line. The “quality and sophistication” are time-invariant factors/predictors that differ across TRQs. The fixed effects hold constant the average effects of each TRQ. The present paper, therefore, uses the fixed effects specification to assess the impact of quota preferences and NTMs on exports.
The fixed effects model is generally specified as
yit = α + βxit + μi + vit
where in the present study t = 1 … 18 time periods, and i = 1 … 5 cross-section units (TRQs for 5 different products). μi is the intercept for the unit, and iμi are also the fixed effects and contain the omitted variables that are constant over time for each TRQ unit i. These are the unobserved effects. Hence, μi captures all the variables that do not vary over time and affect exported quantity (yit) cross-sectionally. yit is the outcome variable (exported quantity). xit is the observed heterogeneity (preferential TRQ level and number of NTMs). vit is the error term (unobserved factors that change over time and affect exports).

3.3.3. Specified Empirical Model

The empirical model to investigate the export outcomes based on the preferential quota level and NTMs impacts for fruit products trade from South Africa to the EU is presented and explained below. In the reduced form
EXP = f (QTL, NTM, MFN, EPA, IQT)
where EXP is the exported quantity, QTL is the quota level/size, NTM is the number of NTMs affecting a particular TRQ, MFN is the most favoured nation tariff charged for out-of-quota exports, EPA is a dummy variable that indicates the trade regime, and IQT is the preferential tariff rate for within quota exports.
The estimated log version in a panel framework is as follows:
L O G ( E X P i t ) = α + β 1 L O G ( Q T L i t ) + β 2 L O G ( N T M i t ) + β 3 ( N T M i t Q T L i t ) + β 4 ( M F N s i t Q T L i t ) + β 5 ( M F N h i t Q T L i t ) + β 6 E P A i t + β 7 ( E P A i t Q T L i t ) + β 8 ( N T M i t I Q T s i t ) + β 9 ( N T M i t I Q T h i t ) + μ i + ε i t
The control variables that can be measured are the quota level, tariffs, and NTMs. Given the panel data structure, other factors which are not the main focus of this present study, such as GDP, exchange rate, transport costs, etc., that are likely to influence the quantity exported are controlled with the fixed effects (μi) in the model. Time invariant characteristics, such as geographical distance between SA and the EU, are also controlled for by the fixed effects. The disturbance term εit is the usual error term that includes factors that change over time and affect exports (EXPit). EXPit stands for the export values for each TRQ at time t. Formally, this model presentation differs from past studies (Beckman et al., 2021; Grant et al., 2022) analysing TRQs in that the model detangles MFN and QTL, as well as NTMs and IQT, in a fixed effects framework for agricultural TRQs. Following the reasoning in Joshi (2013) that “preferential tariffs seem to depend on the applied out-of-quota (MFN) tariffs and not the other way round”, there is no endogeneity expected between the MFN and in-quota tariffs. To that end, the fixed effects model can be estimated and will be interpreted in detail, given the inclusion of the interaction terms for which it is hypothesised that the effects of the quota size on exports are conditional on the presence of NTMs, as well as on the trade regime of the TDCA or EPA. Furthermore, it is hypothesised that tariffs’ impact on exports is conditional on whether tariffs are below or above average. Lower tariffs are expected to promote higher exports.

4. Results

This section presents and discusses the summary of the data together with the model-estimated parameters.

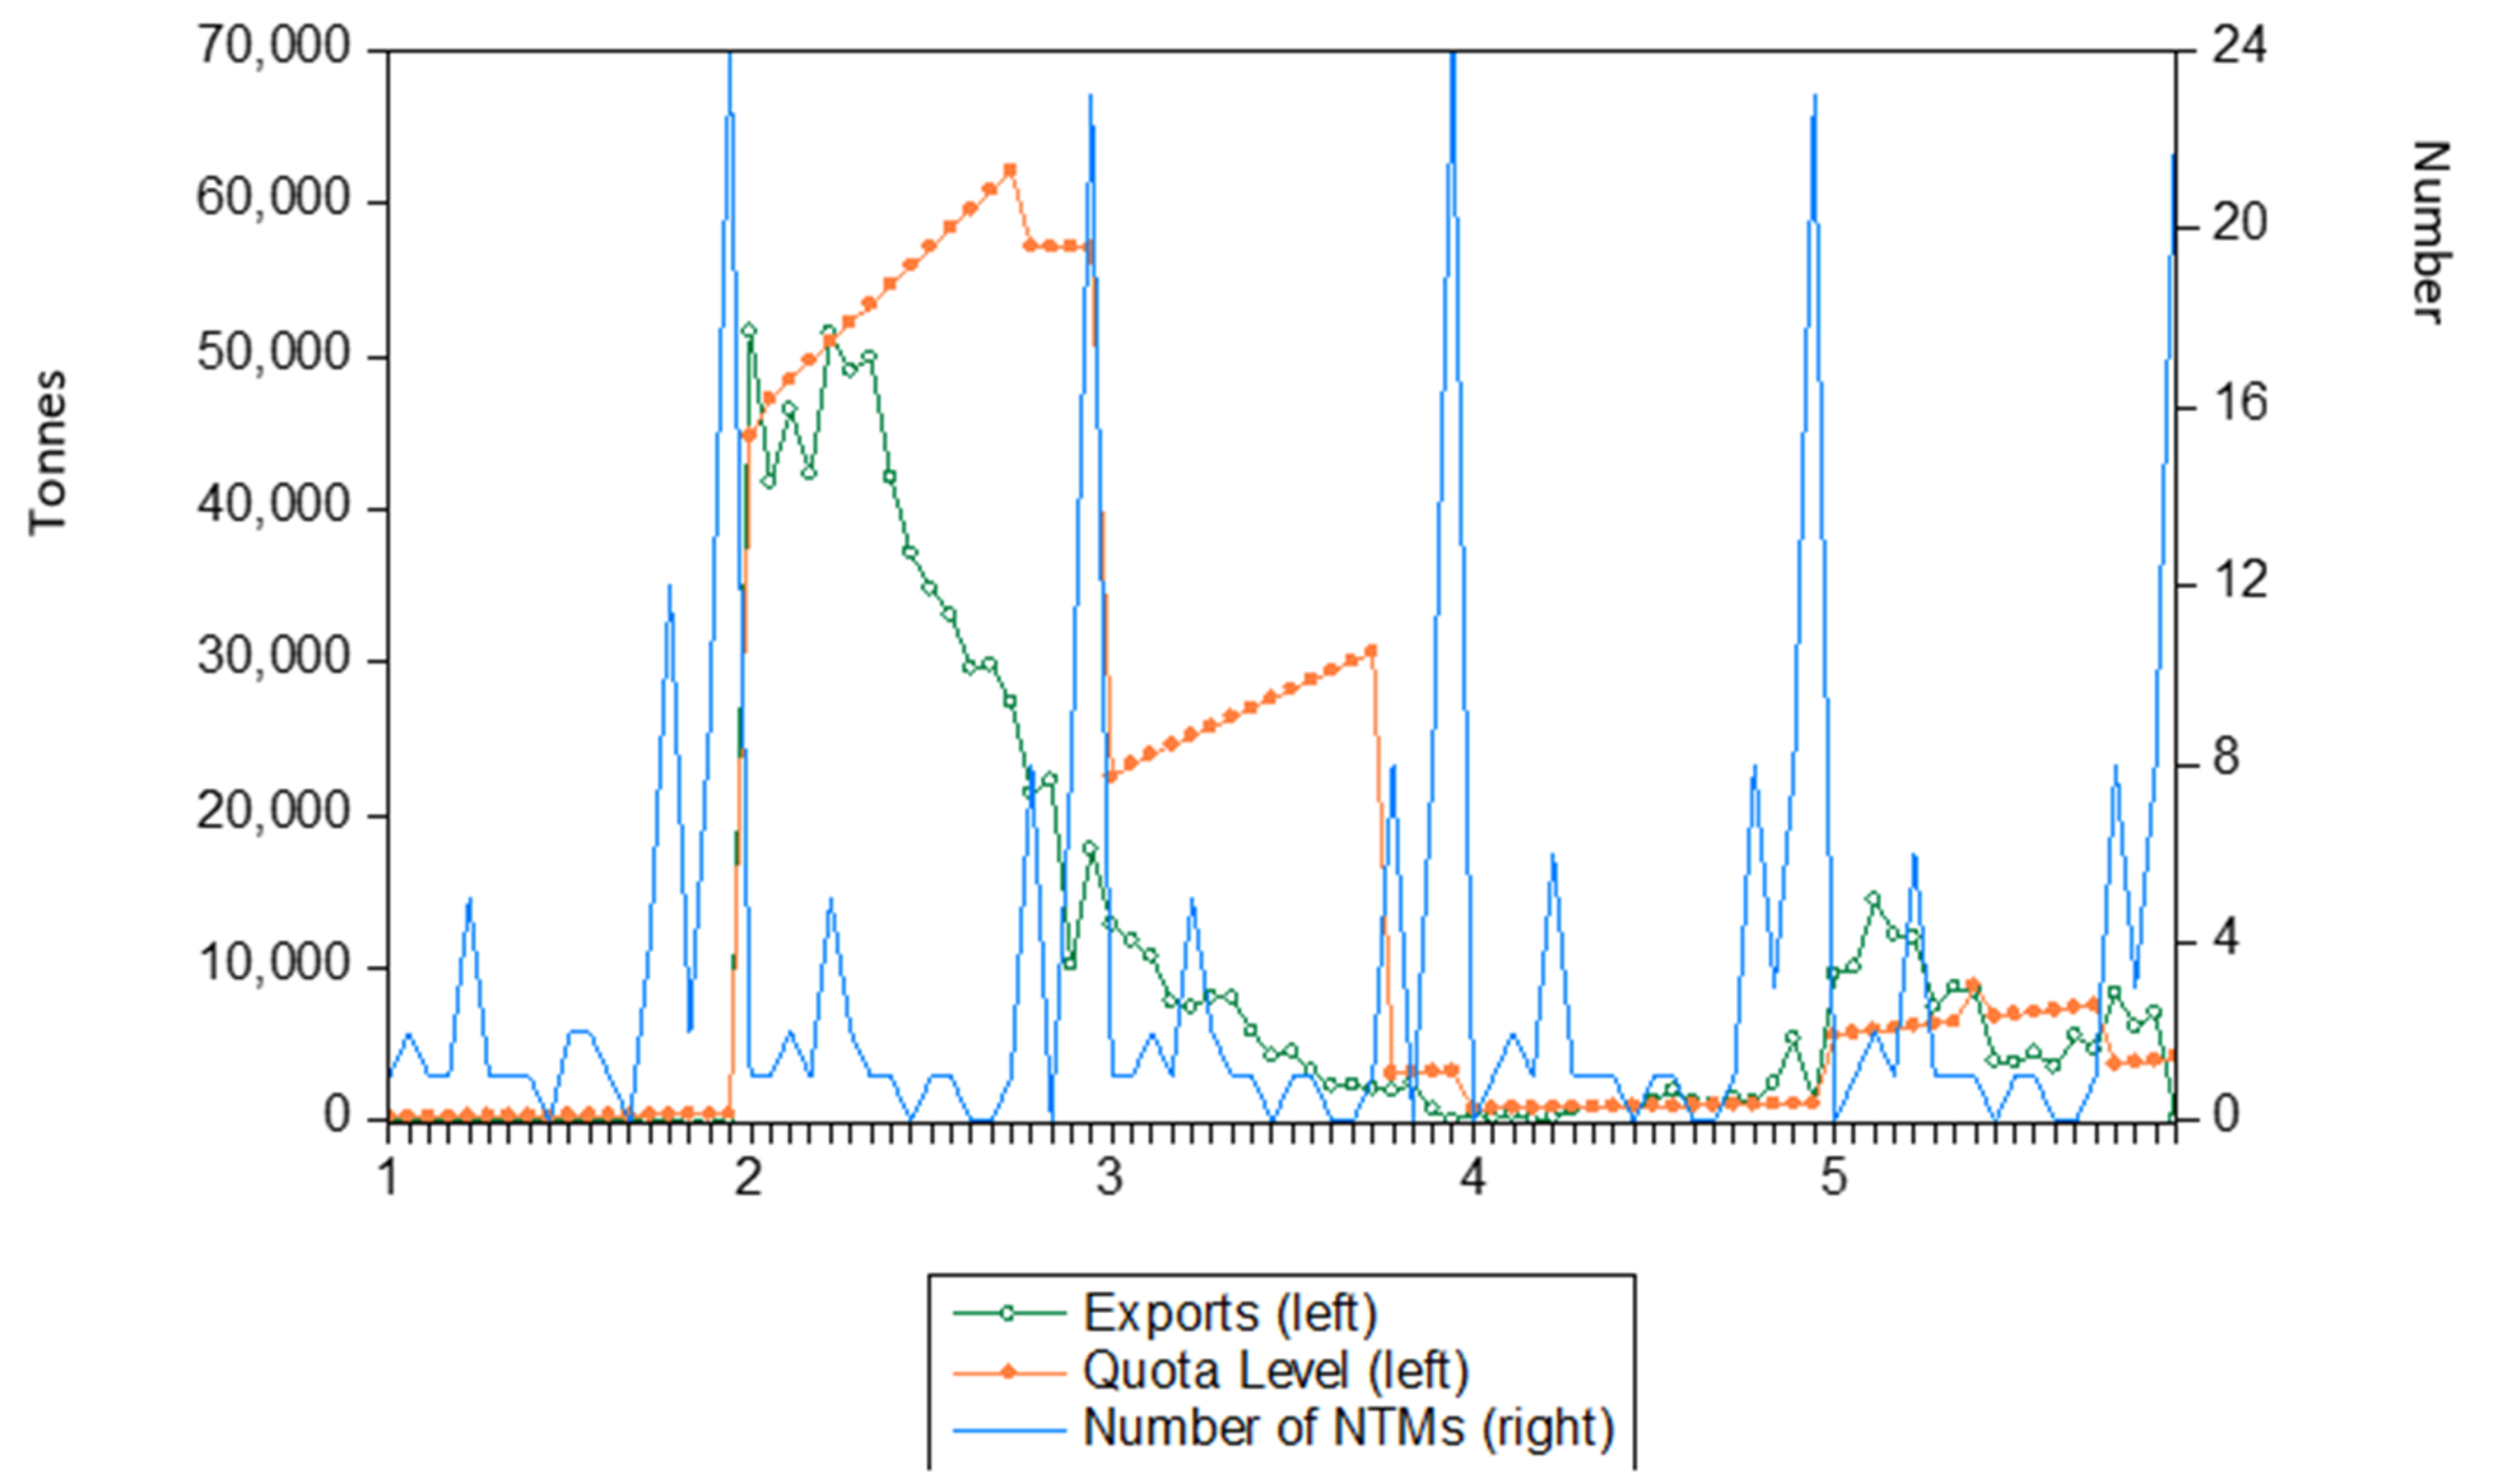
4.1. Descriptive Statistics and Graphical Representation of the Data

The panel data used in the study is described in Table 6, covering a period of 18 years.
Evidently, from the summary statistics, the mean exports are below the mean quota size. This implies that the quotas are not filled, and the exporting country has not taken full advantage of the market access provided. The number of NTMs averaged at 3 in the study period, with the maximum number being 24. While this information is useful, what can only be assumed is that the more measures imposed, the greater the expected difficulties for exporters to comply.
Figure 2 shows the prevalence of NTMs as the years of implementation of the trade agreement proceeded over the years. The number of NTMs applied across the TRQs is the same for all fruit products and has increased in the same pattern over time. In year 5 (2008), the NTMs peaked at around 5 per TRQ, but in the following year, the NTMs were reduced for the years 2009 to 2016 (year 13 in the diagram). The TRQs peaked at a new high in 2018 (year 15 in the data), again reducing to below 5 NTMs per TRQ in 2019. From 2019 onwards, the NTMs have been rapidly rising, peaking at about 25 NTMs per TRQ in 2021 (year 18 in the diagram). An impression is created that the EU has maintained an average of 3 NTMs in and around major policy events (Table 1) during the life of the trade agreement. The NTMs peaked around periods of the review of the trade agreement (scheduled every 5 years). However, a massive jump was experienced when the TDCA was replaced with the SADC–EU–EPA in 2016, and the NTMs continued to rise until the year 2021. The period from 2019 to 2021 was also characterised by the COVID-19 pandemic era.
An estimation of the series plots for the exports, quota level/size, and the number of NTMs (Figure 3) shows a decrease in exports associated with a massive NTMs spike common to every TRQ towards the end of the data analysis time period. This is also the period associated with the change in the trade regime from the TDCA to the EPA. The canned (pears, apricots, and peaches) and the fruit mixtures’ TRQs labelled as (2) and (3), respectively, in Figure 3 show the gap between the quota size and exports widening as NTMs increase over the observed 18-year period. As the quota size availed by the EU continued to increase, the South African exports slowed down further, which is unexpected given the associated reduction in tariffs and that the intention in the trade provisions was to grant and expand further market access for the sensitive products. Evidently, the NTMs play a counterproductive role in the quota preferences, whether that is by intention or not.
Uniquely, the frozen orange juice TRQ labelled (4) is the only TRQ for which the quota was exhausted in all years, regardless of the number of NTMs over the period analysed. The situation for frozen strawberries labelled (1) is clearly an outlier, given that zero exports were recorded. This TRQ also experienced a high total number of NTMs in 2016 in comparison to the other TRQs. The apple and pineapple juice TRQ indicated as (5) also shows an interesting pattern wherein there are periods in which the exported quantities exceed the available guaranteed quota. The implication is that all the exports outside the quota would be charged the higher MFN tariff instead of the in-quota tariff. There is, therefore, room to negotiate for an increased quota for that particular TRQ. Further patterns that can be viewed in the figure pertain to TRQs (3) and (4), which show that the change in regime from the TDCA to the EPA resulted in a reduction in the size of the quota to the year 2004 values, in contrast to the reduction for TRQ (2), which was not drastic. But as the dotted line in the figure shows, that TRQ was capped under the EPA, hence, the line is horizontal and not trending upwards. In terms of the size of the quota, it can be viewed from the diagram that the order from highest to lowest quota size is (2), (3), (5), (4), and (1). The quotas (2), (3), and (5) were reduced from their previous year, as shown by a step down in the dotted line for the period which coincides with the year 2016.

4.2. Panel Model Regression Results

The panel model regression results are presented in Table 7.
Based on the R-squared, it is evident that the predictor variables are strong in explaining the exports of fruit products. The p-value of the F test is less than 0.05, showing that the predictor variables are significant in simultaneously influencing the exports of fruit products. Different sets of model results are presented with the dependent variable as the logarithm of exports. The probabilities for each estimated coefficient are presented in parentheses below the relevant coefficient. Models 1 to 3 are the common, random, and fixed effects, respectively, and two regressors, quota size and the number of NTMs are included in those models. Model 4 is the full FE model, which includes interaction terms as presented in Equation (4). While Model 4 also controls the difference in trade regimes, i.e., the change in policies pertaining to the TRQs, the R2 for Models 3 and 4 remain in the same ballpark, with 86% of the variation in exports being explained by the independent variables.

Discussion of Results Including Policy Implications

The quota size (QTL) coefficients in all models are statistically significant, and the signs remain positive, indicating that an increase in quota level positively impacts export quantities. The quota variable can, therefore, be deemed a noteworthy explanatory variable. Given that the coefficient for quota size (QTL) is positive and significant, the findings suggest that the quota size is effective in influencing exports. The positive effect on exports suggests that the quota size, which, as a component of the TRQ policy, is meant to increase market access for South African exports destined for the EU, is effective. The findings also show that the QTL effect on exports is larger when not interacting with NTMs, as can be noted with the variable NTMQTL in Model 4. Therefore, the findings suggest that the quota size needs to be increased, and NTMs need to be reduced. The magnitude of the impact of the quota size on exports is also larger when all the control variables are included, as can be seen in Model 4.
In Model 3, the results for quota level and the number of NTMs are significant at 1% based on prob. 0.0000 and 0.0005, respectively. The South African exports under each of the five TRQs are directly proportional to the quota level granted by the EU under the bilateral agreement. However, an inverse relationship is observed between exports and the number of NTMs present. A 1% increase in the number of NTMs is associated with a 2.63% decrease in the exports of fruit products from South Africa to the EU. This, however, is lower than the range of 37–74% of the reduction in exports due to NTMs, as concluded in Kirpichev and Moral-Benito (2018). This finding is in line with Rial (2014), who notes that for each additional NTM imposed, agri-food exports could be reduced to between 3 and 5%. In conclusion, the presence of NTMs in the fruit products trade is not export-enhancing, rather, the types of NTMs in place discourage exports. The policy implications needing the attention of trade policy negotiators are that, on the one hand, the quota levels allocated by the EU need to be increased to promote export growth for each TRQ, whilst, at the same time, the prevalence of NTMs must be reduced, given their negative impact on exports. This can be achieved by incorporating more precise provisions in the relevant chapters or annexes of the FTA, and such provisions can be aimed at facilitating trade through the reduction of non-health-related NTMs. Support could also be provided to exporters to reduce the cost burden of compliance.
The average effect on exports of the quota size and of the NTMs impacts are considered separately in Model 3, whereas in Model 4, the quota size variable has both direct and indirect effects. In Model 4, both the quota size variable (QTL) and the interaction variable (QTLNTM) are significant. The quota size has a smaller positive effect on exports when NTMs are present. The negative impact on exports is largely through the interaction of NTMs and high in-quota tariffs, HIGHIQT (−24%). A one-unit increase in the indicator causes exports to decrease by 0.24. Therefore, exports decrease by 24%, illustrating the indirect effects of NTMs on exports. This finding is consistent with Jafari and Britz (2018), who note that the change in NTMs, which affects trade costs, ultimately impacts FTAs.
The coefficient for the quota size, as for the NTMs, grows larger in Model 4. The sign on the coefficients differs for NTMs impact for Models 3 and 4. The sign changes from negative in Model 3 to positive in Model 4, which includes more explanatory variables. In line with the other literature (Shepotylo, 2016; Fall & Langle, 2020), the NTM variable has an expected, ambiguous result, with a negative sign in Models 1–3 and a positive sign in Model 4. However, only in Model 3 is the coefficient significant, with the greater magnitude of a reduction of 2.6% in exports caused by NTMs. The positive, though insignificant, NTMs coefficient in Model 4 suggests that NTMs are in place to enhance exports, and this has a policy implication that the imposition of export-enhancing NTMs can be effective in promoting greater market access, thus closely aligning with the findings in Tchakounte and Fiankor (2021).
The EPA control dummy (result 0.89) included in Model 4 is not significant, but the result has the expected sign for the coefficient, implying that the EPA produces more exports than the previous trade agreement, the TDCA. For the EPAQTL interaction, the results show that the EPA drives the QTL and not vice versa. This reason is straightforward, given that the quota concessions were made based on the trade regime. Considering the NTMQTL interaction term, the coefficient explains the effect and vice-versa. This is to say that the effect of the QTL on exports is conditional on NTMs and vice-versa, showing how the effect of NTMs is conditional on the quota size. The NTMQTL variable is a significant variable. The impact of NTMs on exports is not significant when the QTL is zero. This is expected: no quota, no exports of sensitive products due to the prohibitive MFN tariffs. The impact of the QTL (2.29%) on exports when there are no NTMs is statistically significant and is greater than the impact of the QTLNTM (3.35 × 10⁻⁶) on exports. In the presence of NTMs, the increase in exports is thus much smaller at the given quota size. Significantly, the interaction term gives evidence of the negative impact of the NTMs. This finding is in line with Zainuddin et al.’s (2020) finding that NTMs related to health standards distort trade. Further to these findings, the present study aligns with the suggestion in Zainuddin et al. (2020) that NTM implementation needs policy attention to minimise negative trade impacts possibly arising from compliance costs.
In-quota tariffs and MFN tariffs are not separately included as control variables in the regression, specifically given that the TRQ operates wholly comprising the quota quantity/size and in- and out-of-quota tariffs. The interaction term is, therefore, what is considered important in the determination of the exports. The indicator variables presented in the model have significant coefficients for HIGHIQT and LOWMFN. HIGHIQT, which is the interaction of the NTM with the above mean in-quota tariff, leads to a decrease in exports (−0.24). A unit increase in the indicator leads to a 24% decrease in exports. This result supports Grant et al. (2015) on the restrictiveness of NTMs in agricultural exports. LOWMFN, which is the below mean MFN interaction with quota size, is not highly significant, and the effect is slight (small) on exports. A unit increase in the indicator leads to a 0.01% decrease in exports. Given the existing under-fill of quotas, the expectation is that no exports occur outside of the quota where the MFN tariff would be charged.

4.3. Test of the Validity of the Fixed Effects

The results of the F-test in Table 8 show an estimated F-statistic of 9.75 that has a p-value of 0.0000. The null hypothesis is therefore rejected, showing that the fixed effects are not redundant. The interpreted results of model 4 are, therefore, valid. Additionally, the FE model was also suitable for analysis given that the sample estimated was an ex-ante predetermined selection of fruit products’ TRQs common to both the TDCA and SADC–EU–EPA.
The factors that vary across TRQs but are time-invariant within the TRQs are reported in Table 9. The intercept estimates were used to analyse the extent of the TRQs’ heterogeneity and to establish the TRQs of interest in the fruit products sector.
There are some unobserved effects that enhance the effects of exports in the canned pears, apricots, and peaches TRQ, as well as the apple juice TRQ. Hence, the performance of these TRQs is important to access the EU market. Factors associated with frozen strawberries, canned fruit mixtures, and frozen orange juice inhibit the TRQ export performance. Pertaining, therefore, to the negotiations on TRQs, the focus needs to be on negotiating for the expansion of the most productive TRQs and contracting the least productive concessions.

5. Conclusions and Policy Recommendations

This study relates to the policy area of trade in processed fruit products managed through tariff rate quotas. The point of departure in the present paper is the underutilisation of quota preferences in trade agreements. Despite the support for the use of unilateral TRQs in free trade agreements as a means to enable the trade of agricultural products in restricted processed food sectors, the persistent under-fill of quotas has ignited some debates on the suitability of the instrument as a trade liberalisation tool. Questions, therefore, arise relating to the TRQ tool’s ability to improve export growth. The quota size component of the TRQ is considered export enhancing, but there is a long-standing question about the evidence of that. To gather some evidence, this study analysed the response of the fruit products exported to the European Union by South Africa under trade liberalisation preferences between 2004 and 2021. The considerations in this instance sought to find whether exports increase after controlling for quota size, NTMs, tariffs, and policy change/trade agreement obligations. This paper contributes to the broader literature on TRQs as policy instruments in trade agreements, with the caveat that not all TRQs of the EU–SA trade agreement are analysed—the focus is on fruit products’ TRQs common to the two trade regimes of the TDCA and the SADC–EU–EPA.
By specifying a fixed effects model that included interaction variables based on the three TRQ components of the quota size, in-quota tariffs, and out-of-quota tariffs, the effects of NTMs and the three TRQ components were thus detangled in the analysis. This study’s findings support the observation of the increase in the number of NTMs. The change in the trade regime in the SA–EU trade witnessed an increase in NTMs for all TRQs. The new trading regime is characterised by an expansion in TRQ market access and a further reduction in the tariffs. However, it is evident that NTMs have come into play a greater role as the prevalence of unfilled TRQs has continued. These study findings have, therefore, shown how actual trade policy outcomes compare to the aspirations of what the TRQs should have achieved, and in that regard, the present paper has added to the existing literature on the nexus of TRQs and NTMs. The findings suggest a positive relationship between the quota size and exports. The interaction terms that were found to be significant enabled the capturing of the relationship of the model variables and, moreover, showed that the effect of additional NTMs on exports also depends on the size of the quota. When NTMs are prevalent, the in-quota tariff reductions become inferior relative to improving imports. In the case of the frozen strawberries TRQ that, uniquely, have not been traded under the given quota preference, further studies could investigate whether there could be fixed costs that act as prohibitive trade barriers leading to zero export flows, assuming there is adequate demand in the EU market.
There are two observations to ponder regarding the TRQ policy instrument that have trade policy implications. Firstly, the quota size is an important determinant of the level of exports; hence, access to export markets depends on it. Secondly, trade policymakers face the double challenge of how to ensure trade policy enables tariff reduction while ensuring NTMs are not negatively impacting exports. Given the findings that, at a given quota size, the increase in exports is small due to the presence of NTMs, trade policy negotiations need to keep focussing on negotiating obligations that target NTM reduction.

Funding

This research received no external funding.

Informed Consent Statement

Not applicable.

Data Availability Statement

The data presented in this study is publicly available on the WTO and TARIC databases.

Conflicts of Interest

The author declares no conflicts of interest.

References

  1. Abbot, P. (2002). Tariff-rate quotas: Failed market access instrument. European Review of Agricultural Economics, 9(1), 109–130. [Google Scholar] [CrossRef]
  2. Acharya, S. (2015). Trade liberalization. In Palgrave dictionary of emerging markets and transition economics (pp. 393–412). Palgrave Macmillan. [Google Scholar]
  3. Ajewole, K., Beckman, J., Gerval, A., Johnson, W., Morgan, S., & Sabala, E. (2022). Do Free Trade Agreements Benefit Developing Countries? An Examination of US Agreements (No. 329076). United States Department of Agriculture. [Google Scholar]
  4. Beckman, J., Gale, F., & Lee, T. (2021). Agricultural market access under tariff-rate quotas (No. 1473-2021-046). Economic Research Service. Available online: https://ageconsearch.umn.edu/record/308595/ (accessed on 7 February 2023).
  5. Bellmann, C., & Sugathan, M. (2022). Promoting and Facilitating trade in environmental goods and services: Lessons from regional trade agreements. Forum on Trade, Environment & SDGs (TESS). Available online: https://tessforum.org/media/2022/06/TESS-Technical-Paper-Promoting-and-Facilitating-Environmental-Goods-and-Services-2.pdf (accessed on 3 March 2023).
  6. Berden, K. G., Francois, J., Tamminen, S., Thelle, M., & Wymenga, P. (2009). Non-Tariff Measures in EU-US Trade and Investment—An Economic Analysis. Rotterdam, ECORYS Nederland BV. Available online: http://tracker.borderlex.eu/doc/674/European%20Commission%20Analysis%20on%20Non-Tariff%20Measures%20in%20the%20EU-US%20Economic%20Analysis.pdf (accessed on 8 February 2023).
  7. Binkley, J. K., & Young, J. S. (2023). The chow test with time series-cross section data. Journal of Statistical and Econometric Methods, 12(1), 35–53. [Google Scholar] [CrossRef]
  8. Bureau, J. C., & Tangermann, S. (2000). Tariff rate quotas in the EU. Agricultural and Resource Economics Review, 29(1), 31327. [Google Scholar] [CrossRef]
  9. Chen, B., Villoria, N. B., & Xia, T. (2020). Tariff quota administration in China’s grain markets: An empirical assessment. Agricultural Economics, 51(2), 191–206. [Google Scholar] [CrossRef]
  10. Chow, D. C., & Sheldon, I. (2024). The United States’ challenge(s) to Canada’s dairy import tariff rate quotas: What is all the fuss about? Ohio State Legal Studies Research Paper, No. 819. [Google Scholar] [CrossRef]
  11. Cipollina, M., & Demaria, F. (2020). The trade effect of the EU’s preference margins and non-tariff barriers. Journal of Risk and Financial Management, 13(9), 203. [Google Scholar] [CrossRef]
  12. Cirera, X., Foliano, F., & Gasiorek, M. (2016). The impact of preferences on developing countries’ exports to the European Union: Bilateral gravity modelling at the product level. Empirical economics, 50, 59–102. [Google Scholar] [CrossRef]
  13. Delev, C. (2023). Regulating TRQ schemes under WTO law: Time to throw away old bananas? Journal of World Trade, 57(3), 411–432. [Google Scholar] [CrossRef]
  14. De Melo, J., & Shepherd, B. (2018). The economics of non-tariff measures: A primer. FERDI Working Paper, No. P212. Available online: https://www.econstor.eu/bitstream/10419/269493/1/ferdi-wp212.pdf (accessed on 12 March 2024).
  15. Dolabella, M. (2020). Bilateral effects of non-tariff measures on international trade: Volume-based panel estimates. International Trade series, No. 155 (LC/TS.2020/107), Santiago, Economic Commission for Latin America and the Caribbean (ECLAC). Available online: https://repository.eclac.org/handle/11362/46014 (accessed on 7 February 2023).
  16. European Commission. (2018). Individual Reports and Info Sheets on Implementation of EU Free Trade Agreements. SWD (2018) 454 final. Available online: https://www.eumonitor.nl/9353000/1/j9vvik7m1c3gyxp/vkt385i3c8y2 (accessed on 3 December 2022).
  17. European Commission. (2021). Individual information sheets on implementation of EU Trade Agreements. SWD (2021) 297 final. Available online: https://www.astrid-online.it/static/upload/trad/tradoc_159786.pdf (accessed on 23 June 2023).
  18. European Commission. (2022a). Individual information sheets on implementation of EU Trade agreements. SWD (2022) 730 final. Available online: https://ec.europa.eu/transparency/documents-register/api/files/SWD(2022)730_0/090166e5f258a919?rendition=false (accessed on 23 June 2023).
  19. European Commission. (2022b). FAQ on preference utilisation rates (PUR), duty savings and tariff rate quotas (TRQ). Available online: https://circabc.europa.eu/ui/group/7fc51410-46a1-4871-8979-20cce8df0896/library/7765b74a-b251-4eda-9533-99c046769e63/details (accessed on 20 January 2022).
  20. Fall, F., & Langle, K. (2020). Trade liberalisation and product mix adjustments: Evidence from South African firms. Available online: https://www.oecd-ilibrary.org/economics/trade-liberalisation-and-product-mix-adjustments-evidence-from-south-african-firms_f8499821-en (accessed on 1 February 2023).
  21. Fathelrahman, E., Osman, R., Hoag, D. L. K., Sixt, G. N., & Strzepek, K. (2024). Bilateral trade welfare impacts of India’s export ban of non-basmati rice using the Global Partial Equilibrium Simulation Model (GSIM). Foods, 13(19), 3124. [Google Scholar] [CrossRef] [PubMed]
  22. Fry, N. (2023). Dairy concessions in Canadian trade: A discursive institutionalist account. Canadian Foreign Policy Journal, 29(1), 73–92. [Google Scholar] [CrossRef]
  23. Ghodsi, M. (2023). Exploring the ‘non-tariff measures black box’: Whose regulatory NTMs on which products improve the imported quality? International Economics, 173, 45–67. [Google Scholar] [CrossRef]
  24. Ghodsi, M., & Stehrer, R. (2022). Trade policy and global value chains: Tariffs versus non-tariff measures. Review of World Economics, 158(3), 887–916. [Google Scholar] [CrossRef]
  25. Gil-Pareja, S., Llorca-Vivero, R., & Martínez-Serrano, J. A. (2019). Reciprocal vs nonreciprocal trade agreements: Which have been best to promote exports? PLoS ONE, 14(2), e0210446. [Google Scholar] [CrossRef]
  26. Grant, J. H., Peterson, E., & Ramniceanu, R. (2015). Assessing the impact of SPS regulations on US fresh fruit and vegetable exports. Journal of Agricultural and Resource Economics, 40(1), 144–163. [Google Scholar]
  27. Grant, J., Xie, C., & Boys, K. (2022). Firms, Agricultural Imports, and Tariff-Rate Quotas: An Assessment of China’s Wheat, Corn, and Rice Imports Using Firm-Level Data (No. 938-2022-1211). Available online: https://ageconsearch.umn.edu/record/321889/files/IATRC%20CP28%20-%20GrantXieBoys.pdf (accessed on 7 February 2023).
  28. Grubler, J., & Reiter, O. (2021). Characterising non-tariff trade policy. Economic Analysis and Policy, 71, 138–163. [Google Scholar] [CrossRef]
  29. Jackson, L. A., Maggi, F., Piermartini, R., & Rubínová, S. (2020). The value of the Committee on Agriculture: Mapping Q&AS to trade flows. WTO Staff Working Paper, No. ERSD-2020-15. Available online: https://www.econstor.eu/handle/10419/228654 (accessed on 7 February 2023).
  30. Jafari, Y., & Britz, W. (2018). Modelling heterogeneous firms and non-tariff measures in free trade agreements using Computable General Equilibrium. Economic Modelling, 73, 279–294. [Google Scholar] [CrossRef]
  31. Jafari, Y., Britz, W., Guimbard, H., & Beckman, J. (2021). Properly capturing tariff rate quotas for trade policy analysis in computable general equilibrium models. Economic Modelling, 104, 105620. [Google Scholar] [CrossRef]
  32. Jordaan, A., & Kanda, P. (2011). Analysing the trade effects of the EU-SA & SADC trading agreements: A panel data approach. South African Journal of Economic and Management Sciences, 14(2), 229–244. [Google Scholar]
  33. Joshi, V. (2013). Preferential tariff formation–the case of the United States. Journal of World Trade, 47(4), 835–895. [Google Scholar] [CrossRef]
  34. Kaziboni, L. (2020). The usage of EPA Tariff-Rate Quotas (TRQ) by South Africa and the EU. Report for the EU-SA Partners for Growth Programme. Available online: https://sadc-epa-outreach.com/images/files/TRQ_Value_chain_report_FINAL.pdf (accessed on 23 June 2023).
  35. Keck, A., & Lendle, A. (2012). New evidence on preference utilization. In World Trade Organization Staff Working Paper No. ERSD-2012-12. World Trade Organization (WTO). [Google Scholar] [CrossRef]
  36. Kinzius, L., Sandkamp, A., & Yalcin, E. (2019). Trade protection and the role of non-tariff barriers. Review of World Economics, 155(4), 603–643. [Google Scholar] [CrossRef]
  37. Kirpichev, D., & Moral-Benito, E. (2018). The costs of trade protectionism: Evidence from Spanish firms and non-tariff measures. Documentos de Trabajo del Banco de España, 1848(14), 1–35. [Google Scholar] [CrossRef]
  38. Krugman, P. R., & Obstfeld, M. (2018). International economics: Theory and policy. Pearson Education. [Google Scholar]
  39. Kumar, C., & Bharti, N. (2020). Why NTM is a Challenge in Trade Relations? Evidence from India–Africa Agricultural Trade. Insight on Africa, 12(2), 79–103. [Google Scholar] [CrossRef]
  40. Levin, A., Lin, C. F., & Chu, C. S. J. (2002). Unit root tests in panel data: Asymptotic and finite-sample properties. Journal of econometrics, 108(1), 1–24. [Google Scholar] [CrossRef]
  41. Lohmar, B., & Skully, D. (2003, June 23–26). China’s TRQ administration after one year: Crossing the river by feeling for stones. Contributed paper presented at the international conference agricultural policy reform and the WTO: Where are we heading? Capri, Italy. [Google Scholar]
  42. Melitz, M. J. (2003). The impact of trade on intra-industry reallocations and aggregate industry productivity. Econometrica, 71(6), 1695–1725. [Google Scholar] [CrossRef]
  43. Muchopa, C. L. (2021). Economic impact of tariff rate quotas and underfilling: The case of canned fruit exports from South Africa to the EU. Economies, 9(4), 155. [Google Scholar] [CrossRef]
  44. Muchopa, C. L., Bahta, Y. T., & Ogundeji, A. A. (2019). Tariff rate quota impacts on export market access of South African fruit products into the EU market. Agrekon, 58(4), 426–450. [Google Scholar] [CrossRef]
  45. Muchopa, C. L., Bahta, Y. T., & Ogundeji, A. A. (2020). Trade and welfare impacts of the frozen orange juice tariff rate quota of South Africa. The International Trade Journal, 34(2), 222–246. [Google Scholar] [CrossRef]
  46. Muchopa, C. L., Bahta, Y. T., & Ogundeji, A. A. (2021). Quantifying the missed EU market access opportunity for South African frozen strawberries. African Journal of Business and Economic Research, 16(3), 135. [Google Scholar] [CrossRef]
  47. Nilsson, L. (2018). Reflections on the economic modelling of free trade agreements. Journal of Global Economic Analysis, 3(1), 156–186. [Google Scholar] [CrossRef]
  48. OECD. (2019). Agricultural policy monitoring and evaluation 2019. OECD Publishing. [Google Scholar] [CrossRef]
  49. OECD. (2024). Non-tariff measures. Tariffs are the tip of the iceberg: How behind the border issues impact trade. Available online: https://www.oecd.org/trade/topics/non-tariff-measures/ (accessed on 7 February 2023).
  50. Ofori-Amoah, B. (2024). Regional trade agreements: Theory, aspirations, and realities. In The african continental free trade area: Prospects, problems and challenges (pp. 55–76). Springer International Publishing. [Google Scholar]
  51. Orden, D., Xie, C., Bowen Chen, L. B., & Zulauf, C. (2019). WTO dispute panel report on China’s administration of Tariff Rate Quotas (TRQs) for certain agricultural products. Farmdoc Daily, 9(84). Available online: https://farmdocdaily.illinois.edu/2019/05/wto-dispute-panel-report-on-chinas-administration-of-tariff-rate-quotas-trqs-for-certain-agricultural-products.html (accessed on 7 February 2023).
  52. Orefice, G. (2017). Non-tariff measures, specific trade concerns and tariff reduction. The World Economy, 40(9), 1807–1835. [Google Scholar] [CrossRef]
  53. Rena, R. (2008). WTO and agricultural trade-some issues and perspectives. KASBIT Journal of Business, 1(1), 49–60. [Google Scholar]
  54. Revell, B. J. (2017). Brexit and tariff rate quotas on EU imports: A complex problem. EuroChoices, 16(2), 10–17. [Google Scholar] [CrossRef]
  55. Rial, D. P. (2014, July 16–20). Study of average effects of non-tariff measures on trade imports. Policy issues in international trade and commodities research study Series No. 66. United Nations Conference on Trade and Development (UNCTAD), Geneva, SwitzerlandAvailable online: https://unctad.org/system/files/official-document/itcdtab68_en.pdf (accessed on 23 June 2023).
  56. Sachs, J. D., Lafortune, G., Fuller, G., & Drumm, E. (2023). Implementing the SDG stimulus. In Sustainable development report 2023. SDSN; Dublin University Press. [Google Scholar]
  57. Saini, G. K. (2011). Implications of non-tariff measures on international business operations: A case of India’s textiles and clothing firms. Journal of Asia Business Studies, 5(2), 211–231. [Google Scholar] [CrossRef]
  58. Shepherd, B., & Wilson, N. L. (2013). Product standards and developing country agricultural exports: The case of the European Union. Food Policy, 42, 1–10. [Google Scholar] [CrossRef]
  59. Shepotylo, O. (2016). Effect of non-tariff measures on extensive and intensive margins of exports in seafood trade. Marine Policy, 68, 47–54. [Google Scholar] [CrossRef]
  60. Shrestha, M. B., & Bhatta, G. R. (2018). Selecting appropriate methodological framework for time series data analysis. The Journal of Finance and Data Science, 4(2), 71–89. [Google Scholar] [CrossRef]
  61. Skully, D. (1999a). US Tariff-Rate Quotas for Peanuts. ERS/USDA. Available online: https://corpora.tika.apache.org/base/docs/govdocs1/704/704873.pdf (accessed on 6 February 2023).
  62. Skully, D. (2000). US TRQs for peanuts, sugar, and tobacco: Historical allocation and nondiscrimination. Agricultural and Resource Economics Review, 29(1), 81–90. [Google Scholar] [CrossRef]
  63. Skully, D. W. (1999b). The economics of TRQ administration (No. 943-2016-74604). Available online: https://ageconsearch.umn.edu/record/14584/files/wp9906.pdf (accessed on 6 February 2023).
  64. Skully, D. W. (2001). Liberalizing tariff-rate quotas. Agricultural Policy Reform in the WTO—The Road Ahead. Market and Trade (pp. 59–67). Economic Research Service, U.S. Department of Agriculture. Available online: https://www.ers.usda.gov/webdocs/publications/41330/31770_aer802g_002.pdf?v=0 (accessed on 6 February 2023).
  65. Suanin, W. (2023). Processed food exports from developing countries: The effect of food safety compliance. European Review of Agricultural Economics, 50(2), 743–770. [Google Scholar] [CrossRef]
  66. Tchakounte, A. D., & Fiankor, D. D. D. (2021). Trade costs and demand-enhancing effects of agrifood standards: Consequences for Sub-Saharan Africa. Journal of African Trade, 8(1), 51–64. [Google Scholar] [CrossRef]
  67. Thow, A. M. (2009). Trade liberalisation and the nutrition transition: Mapping the pathways for public health nutritionists. Public Health Nutrition, 12(11), 2150–2158. [Google Scholar] [CrossRef]
  68. TRALAC. (2018). Economic partnership agreement between the European and Southern African development community group. Available online: https://www.tralac.org/documents/newsletters/2049-sadc-eu-epa-faqs-july-2018.html (accessed on 23 June 2023).
  69. UNCTAD. (2012). Volume 1: A Practical Guide to Trade Policy Analysis—UNCTAD. Available online: https://unctad.org/system/files/official-document/gds2012d2_en.pdf (accessed on 13 January 2023).
  70. Vickers, B. (2018). Global Britain, Trade and Development: Issues and Priorities Post-Brexit. Navigating Uncertainty: Towards a Post-Brexit Trade and Development Agenda, 97, 5. [Google Scholar]
  71. Wen, X., Yang, Z., Dong, H., Fan, X., & Wang, Y. (2018). Barriers to sustainable food trade: China’s exports food rejected by the US Food and Drug Administration 2011–2017. Sustainability, 10(6), 1712. [Google Scholar] [CrossRef]
  72. Woolfrey, S., & Bilal, S. (2017). The impact of economic partnership agreements on the development of African value chains. ECDPM. Discussion Paper, 213. Available online: https://www.academia.edu/download/78247591/DP213-Impact-EPAs-African-Value-Chains.pdf (accessed on 23 June 2023).
  73. Yuan, Y., & Awokuse, T. O. (2003, July 27–30). Exchange rate volatility and US poultry exports: Evidence from panel data. 2003 Annual meeting (No. 22083). American Agricultural Economics Association (New Name 2008: Agricultural and Applied Economics Association), Montreal, Canada. [Google Scholar]
  74. Zainuddin, M. R. K., Sarmidi, T., & Khalid, N. (2020). Sustainable production, non-tariff measures, and trade performance in RCEP countries. Sustainability, 12(23), 9969. [Google Scholar] [CrossRef]
Figure 1. Conceptual Framework—components of TRQs as determinants of export flows. Source: Author elaboration.
Economies 13 00001 g001
Figure 2. Number of NTMs by TRQ (2004–2021). Source: Author’s elaboration using WTO I-ITIP data.
Economies 13 00001 g002
Figure 3. Series plot of exports, quota levels, and number of NTMs by TRQ (2004–2021). Source: Author’s elaboration using WTO I-ITIP data.
Economies 13 00001 g003
Table 1. Policy events relevant to fruit product exports from South Africa to the EU (2004–2021).
Time PeriodPolicy Event
2004TDCA came into full effect *
2004Review of the TDCA occurred and appropriate amendments made
2007Start of the process to work towards EPA involving EU, South Africa, and SADC **
2008Exporter administered permits became subject to the Agricultural Black Economic Empowerment (AgriBEE) sector charter in South Africa ***
2012Full implementation of the TDCA—final phase of tariff preferences
2013Accession of Croatia to the EU
2014EPA negotiations concluded
2016SADC–EU–EPA signature and implementation (EPA replaced the trade Chapter of the TDCA). SADC–EU–EPA capped some TRQs and further tariff liberalisation occurred for some tariff lines.
2020Launch of major review of EU trade policy
2021Start of SADC–EPA review after 5 years of implementation
* Note: The TDCA came into effect in 1999. Between 2000 and 2004, the agreement was provisionally implemented after it was signed in 1999, with an end date in 2016. ** Trade-related aspects of the agreement were delinked from the TDCA for succeeding TDCA reviews. *** Compliance with the Broad-Based Black Economic Empowerment Act of 2003 required for TRQ allocation and implementation. Source: Author elaboration based on various sources.
Table 2. Variables description and source.
VariableDescriptionData Source
Export Quantity (EXP)Level of exports (in tonnes) from South Africa to the EUTARIC database of the EU
Quota Level (QTL)The available predetermined quantity (in tonnes) of product at which the EU applies a preferential tariff for imports from South Africa.South African Annual Government Gazette (Various issues).
NTMs (NTM)Total count of the number of NTMs affecting a particular TRQ.Author compilation based on WTO Integrated Trade Intelligence Portal (ITIP)
MFN tariff (MFN)
MFNsit
MFNit
Most Favoured Nation Tariff (% ad valorem) charged for out-of-quota export quantities.
Indicator equal to 1 if the MFN tariff charged is lower than the cut-off level of 17.89%; otherwise, the indicator is equal to zero.
Indicator equal to 1 if the MFN tariff charged is higher than the cut-off level of 17.89%.
WTO Tariff Analysis Online (TAO)
Author calculation
Author calculation
In-quota tariff (IQT)Preferential tariff rate (% ad valorem) charged for within quota export quantities.WTO Tariff Analysis Online (TAO)
IQTsitIndicator equal to 1 if the in-quota tariff charged is lower than the cut-off level of 8.96%; otherwise, the indicator is equal to zero.Author calculation
IQTitIndicator equal to 1 if the in-quota tariff charged is higher than the cut-off level of 8.96%; otherwise, the indicator is equal to zero.Author calculation
Economic Partnership Agreement (EPA)Dummy variable equal to 1 if trade was occurring under the SADC–EU–EPA; otherwise, the dummy is equal to zero.Author calculation
Table 3. TRQs description.
TRQ DescriptionHS 6-Digit Codes of
Tariff Lines Included
Quota in 2004
(t)
Quota in 2021
(t)
Types of Measures
(NTMs) Present
Strawberries081110280415SPS, TBT
Canned mixed fruit *200840/50/7044,80057,156SPS, TBT, QR
Tropical canned fruit200892/9722403260SPS, TBT, QR
Frozen orange juice2009117841141SPS, TBT, QR
Apple/Pineapple juice **200941/71/7956004063SPS, TBT, QR
Source: The author’s collation from various sources, including DAFF and the WTO I-TIP. * Combined and capped post-SADC–EU–EPA coming into effect in 2016. ** TRQ reduced to cover only apple juice post-SADC–EU–EPA coming into effect in 2016.
Table 4. LLC panel unit root test results.
VariableLevel (0)
1st Difference (1)
InterceptIntercept and Trend
t-Statp-ValueConclusiont-Statp-ValueConclusion
EXP0−107.9400.0000Stationary−152.4690.0000Stationary
1−110.0520.0000Stationary−85.85800.0000Stationary
LogEXP03.273030.9995Non-stationary1.294250.9022Non-stationary
1−1.085340.1389Non-stationary−6.310670.0000Stationary
QTL00.352560.6378Non-stationary−0.398530.3451Non-stationary
1−6.491770.0000Stationary−7.329460.0000Stationary
LogQTL0−1.880830.0300Stationary−0.276340.3911Non-stationary
1−7.110320.0000Stationary−7.205890.0000Stationary
NTM019.15051.0000Non-stationary17.41461.0000Non-stationary
11.523550.9362Non-stationary−1.992900.0231Stationary
LogNTM01.278370.8994Non-stationary−1.003410.1578Non-stationary
1−11.10100.0000Stationary−11.56740.0000Stationary
Table 5. Hausman test results.
Correlated Random Effects—Hausman Test
Test Cross-Section Random Effects
Test SummaryChi-Sq. StatisticChi-Sq. d.f.Prob.
Cross-section random32.37880340.0000
Table 6. The summary statistics, using the observations 1:01–5:18.
VariableMeanMedianMinimumMaximumStd. Dev.C.V.SkewnessEx. kurtosisMissing obs.
Exports98613680051,60914,4151.46171.71991.73950
Quota16,711567528062,10321,1761.26721.0292−0.52810
NTMs310245.55801.67862.70936.89820
Table 7. Regression results—panel data estimation.
Variable
Dep. Variable—Export Quantity
Model 1: Common EffectsModel 2: Random EffectsModel 3: Model 4: Fixed Effects
Coefficient (Prob.)t-StatisticCoefficient (Prob.)t-StatisticCoefficient (Prob.)t-StatisticCoefficient (Prob.)t-Statistic
Constant−0.176266
(0.7518)
−0.317875−0.656740
(0.0000)
−0.7883881.825550
(0.0290)
2.263611−8.680788
(0.1330)
−1.53056
Quota Level (QTL)0.976633
(0.0000)
16.260971.015345
(0.0000)
11.345990.936339
(0.0000)
14.540792.294642
(0.0042)
3.019369
Number of NTMs
(NTM)
−0.032811
(0.8242)
−0.223154−0.122755
(0.4658)
−0.734382−2.636021
(0.0005)
−3.8124620.135514
(0.6708)
0.427883
[Number of NTMs] × [Above mean in-quota tariff]
(HIGHIQT)
------−0.243652
(0.0011)
−3.48854
[Number of NTMs] × [Below mean in-quota tariff]
(LOWIQT)
------−0.017846
(0.7944)
−0.26219
Economic Partnership Agreement Dummy
(EPA)
------0.888201
(0.7549)
0.314194
[Economic Partnership Agreement Dummy] × [ Quota Level]
(EPAQTL)
------−0.000187
(0.6850)
−0.40828
[Above mean out-of-quota tariff] × [ Quota Level]
(HIGHMFN)
------−0.000584
(0.1134)
−1.61531
[Below mean out- of-quota tariff] × [ Quota Level]
(LOWMFN)
------−0.000132
(0.0387)
−2.13078
[Number of NTMs] × [ Quota
Level] (NTMQTL)
------3.35 × 10⁻⁶ (0.0189)2.436716
R-squared
Prob(F-statistic)
0.828002
0.000000
0.669019
0.000000
0.867703
0.000000
0.856927
0.000000
Durbin–Watson Stat0.8485200.8812910.9587741.479978
Table 8. Cross-section fixed effects test.
Redundant Fixed Effects Tests Test Cross-Section Fixed Effects
Effects TestStatisticd.f.Prob.
Cross-section F9.754498(4,44)0.0000
Cross-section Chi-square36.82232640.0000
Table 9. Cross-section (TRQ) fixed effects.
TRQ IDEffect
Frozen Strawberries−1.750448
Canned Pears, Apricots, and Peaches1.346671
Fruit Mixtures−2.537186
Frozen Orange Juice−0.358754
Apple Juice1.743138
Disclaimer/Publisher’s Note: The statements, opinions and data contained in all publications are solely those of the individual author(s) and contributor(s) and not of MDPI and/or the editor(s). MDPI and/or the editor(s) disclaim responsibility for any injury to people or property resulting from any ideas, methods, instructions or products referred to in the content.

