Article

Analysis of the Impact of State-Owned Banks on the Sustainability of Public Finances

1
Department of Public Finance, State Tax University, 08205 Irpin, Ukraine
2
Department of Finance, National University of Food Technologies, 03041 Kyiv, Ukraine
3
Department of Innovation, Research and Development, Institute of Social and Economic Initiatives, 36014 Poltava, Ukraine
4
Faculty of Economics and Business, Kyiv National University of Technology and Design, 01011 Kyiv, Ukraine
5
Department of Economic Cybernetics, National University of Life and Environmental Sciences of Ukraine, 03041 Kyiv, Ukraine
*
Author to whom correspondence should be addressed.
Economies 2023, 11(9), 229; https://doi.org/10.3390/economies11090229
Submission received: 5 July 2023 / Revised: 29 August 2023 / Accepted: 31 August 2023 / Published: 6 September 2023
(This article belongs to the Section Macroeconomics, Monetary Economics, and Financial Markets)

Abstract

:
This paper aims to provide a retrospective assessment of Ukraine’s state policy concerning state-owned banks and evaluate their impact on the sustainability of Ukraine’s public finances. The research methodology employs an empirical study of the cash flow of public funds to state-owned banks and the reverse cash flow to determine the impact of the activity and stability of public finances. The cash flow to state-owned banks includes the expenditure of public funds for the creation of authorised capital during the establishment of state-owned banks, the acquisition of shares in operating commercial banks, additional capitalisation of state-owned banks, etc. The reverse cash flow comprises dividends paid based on the performance of state-owned banks, as well as revenue generated for public funds through the sale of shares (privatisation) of state-owned banks. This study highlights the costs associated with recapitalising state-owned banks. These costs disrupt the stability of public finances, create additional debt dependency for Ukraine, impose an additional burden on public finances, and lead to structural changes that reduce funding for social spending. As a result, Ukrainian taxpayers are financing the inefficient activities of state-owned banks while experiencing reduced investments in education, healthcare, social protection, environmental protection, and other essential areas.

1. Introduction

At the beginning of 2023, the Ukrainian banking system consisted of 67 commercial banks (The National Bank of Ukraine 2023), which differ significantly in various respects but operate within a single legal framework and competitive environment. These commercial banks include state-owned banks. These are banks in which the state owns 100% of the authorised capital and banks with state participation in the capital (banks in which the state directly or indirectly owns more than 75% of the bank’s authorised capital). The use of public funds in the banking sector requires increased attention from researchers, as it simultaneously raises the following controversial issues.
(1)
The first issue is the diversion of part of the state budget funds to the formation of the authorised capital of banks, purchase of shares, and additional capitalisation. Alternatively, the funds spent on the creation of official capital, acquisition of shares, or capitalisation of banks could have been used to finance other needs relating to the social and economic development of the state.
(2)
The second issue is that the inefficient use of public funds in the banking sector poses a potential threat to macrofinancial stability.
(3)
The third issue is the disruption of competition in the banking services market by creating special banking conditions for state-owned banks. In Ukraine, such conditions have been created by requiring educational, health, research, and cultural institutions to open current and deposit accounts exclusively with state-owned banks. Local budget funds from the development budget and the own revenues of local government budgetary institutions are placed in deposit accounts exclusively in state-owned banks.
In June 2023, the Government of Ukraine considered the expediency of state participation in one more bank (Sense Bank). Therefore, the study of the evolution of the expediency and effectiveness of banks with state participation is relevant. When Ukraine is at war and hostilities are taking place, the priority of public financing may be different: to support inefficient banks or to protect the independence of the state.
Therefore, it is important to assess the impact of state-owned banks on macroeconomic and financial stability under the current conditions of a high share of state-owned banks in the assets, liabilities, and capital of the Ukrainian banking system.
This paper aims to retrospectively assess Ukraine’s state policy towards state-owned banks and assess their impact on the sustainability of Ukraine’s public finances. The following hypothesis was formulated to conduct the study.
Hypothesis H1. 
State-owned banks hurt the sustainability of Ukraine’s public finances.
Additional goals of this research are the development of the authors’ methodology for estimating cash flows between state-owned banks and public funds, empirical calculations of cash flows between state-owned banks and public funds, and the comparison of expenses for state-owned banks with other public expenditures.
Following the introduction, Section 2 reviews the related literature and develops the study hypotheses. Section 3 details the data and methodology employed in this paper. The study results are presented in Section 4. The discussion is presented in Section 5. Section 6 concludes the paper.

2. Literature Review

There are several aspects to studying state-owned banks. The banking aspect involves studying the role and place of state-owned banks in the banking system. The public aspect involves the study of the impact of the results of the activities of state-owned banks on the state of public finances. The political aspect is due to the political pressure exerted by certain political figures on the activities of state-owned banks. The social aspect involves studying the role and place of state-owned banks in meeting the social needs of the population and providing access to banking services. The financial aspect involves studying the efficiency of state-owned banks compared with commercial banks. The environmental aspect involves studying the impact of public finances on the environmental situation and the activity of financing environmental projects (green projects), and the macroeconomic aspect involves studying the impact on the country’s economic growth.
The banking aspect of state-owned banks relates to increasing the bank’s competitiveness and market value (Ohorodnyk and Kozmuk 2018). A study conducted in 2016 examined the behaviour of government-controlled banks within the framework of neoliberalism. Neoliberalism characterises state-owned banks as detrimental to development, disregarding any influence of historical events, specific conditions, or the desires of the general public (Marois 2016).
The public aspect can also be called quasi-fiscal from the concept of “quasi-fiscal operations”. In the Budgetary Code of Ukraine, quasi-fiscal operations are defined as operations of state authorities and local self-government bodies, the National Bank of Ukraine, obligatory state social and pension insurance funds, and state and municipal economic entities that are not reflected in budget indicators, but which tend to reduce budget revenues and/or require additional budget expenditures in the future (Verkhovna Rada of Ukraine 2010).
The political aspect of state-owned banks has the largest number of scientific studies and the most active academic debate. Controversial aspects of the activities of state-owned banks are the decision making on banking activities and banking operations under political pressure or in the interests of individual politicians (La Porta et al. 2002; Yeyati et al. 2007; Aysan and Ceyhan 2010; Iannotta et al. 2013; Ashraf et al. 2018; Smovzhenko et al. 2019; Sus and Onychuk 2019; Akimova 2020; Lee et al. 2022), lending to political parties during elections under political pressure (Dinç 2005; Ashraf et al. 2018; Svistun 2020), lending at low interest rates for political reasons (AlAli and Saeed 2020), lending to companies related to political leaders by ownership (Ohorodnyk 2018a, 2018c), inefficient use of budget funds, and the development of corruption (La Porta et al. 2002; Kostohryz and Khutorna 2018; Kasych et al. 2020). In his study of state-owned banks, Marois points to the possibility of politicisation of state-owned banks, i.e., dependence on the political will of individual politicians and democratised state-owned banks. Democratised state banks offer the most viable alternative (Marois 2016). Caprio et al. (2004) conclude that state-owned financial institutions are likely to remain in many countries for political rather than economic reasons.
The social aspect of the activities of state-owned banks relates to improving the financial literacy of the population, increasing confidence in the banking system, increasing housing affordability through the development of mortgage lending, increasing employment and combating poverty through the development of SME lending programmes, helping reduce social tensions in society, solving many social problems (Ohorodnyk and Kozmuk 2018), providing a 100% guarantee of the return of individual deposits (Ohorodnyk 2018a), and improving social standards of access to banking services (Kasych et al. 2020). Such a list of social effects should be considered normative for the Ukrainian banking system, since affordable housing lending programmes (the state programme Eoselia) and SME lending programmes (the state programme Affordable Loans 5–7–9%) are implemented by state-owned and commercial banks on the same terms and conditions without prioritising state-owned banks. Other lending programmes for individuals are implemented by state-owned banks on a general market basis, and the real lending rate for consumer loans to state-owned banks was 37% in 2023 (Privatbank 2023). This indicates the absence of a social aspect in the activities of state-owned banks in Ukraine. The social aspect of state-owned banks is manifested in the provision of banking services across all income levels and geographical regions (Yeyati et al. 2007; Sus and Onychuk 2019).
The financial aspect of state-owned banks has been studied mainly in terms of efficiency indicators compared with private banks, with different results and conclusions depending on the time of the study and the country.
The higher efficiency of state-owned banks is evidenced by the results of studies in Ethiopia during 2005–2010 (Yaregal 2011), in Ethiopia during 2005–2014 (Dinberu and Wang 2017), in Ethiopia during 2011–2017 (Tekatel and Nurebo 2019), and in China during 2010–2018 (Antunes et al. 2022).
The lower efficiency of state-owned banks is evidenced by research in developing countries (Yeyati et al. 2004; Zarutska 2015; Velykoivanenko and Korchynskyi 2022), in developing countries during 1995–2002 (Micco et al. 2007), in 16 Far East countries (Bangladesh, China, Hong Kong, India, Indonesia, Macau, Malaysia, Nepal, Pakistan, the Philippines, Singapore, South Korea, Sri Lanka, Taiwan, Thailand, and Vietnam) during 1989–2001 (Cornett et al. 2010), Argentina in the 1990s (Berger et al. 2005), Bangladesh in 2004–2011 (Kamarudin et al. 2016) and 2015–2019 (Ullah and Rahman 2022), China in 1994–2003 (Berger et al. 2009), 1997–2004 (García-Herrero et al. 2009), and 2004–2011 (Zhang and Wang 2014), in Egypt during 1996–1999 (Omran 2007), in Ethiopia during 2011–2017 (Tekatel and Nurebo 2019), in India during 2010–2012 (Aswini et al. 2013), 1998–2002 (Sathye 2005), 2010–2012 (Sukhdev et al. 2016), and 2009–2014 (Gupta and Sundram 2015), in Iran during 2006–2010 (Nia et al. 2012), in Kenya during 2000–2004 (Barako and Tower 2007), in Malaysia during 1994–1996 (Karim 2003) and 2000–2011 (Rahman and Rejab 2015), in Pakistan during 2011–2014 (Waleed et al. 2015), in Turkey during 1989–1999 (Mercan et al. 2003), and in Ukraine during 2014–2019 (Rodionova and Piatkov 2020; Kaminskyi and Versa 2018), 2009–2011 (Boiko and Diachuk 2020), 2014–2017 (Boiko and Diachuk 2020), and 2020–2021 (Drobiazko et al. 2022).
The absence of a significant difference between the performance of public and private banks in Pakistan between 2005 and 2010 has been demonstrated by Pakistani researchers (Haider et al. 2013). A similar conclusion was reached based on the results of an analysis of the banking system in Ethiopia in the period 2000–2009 (Rao and Lakew 2012). State-owned banks in Turkey were as efficient as private banks and, in some aspects, even more efficient over the period 1997–2006 (Unal et al. 2007).
Some financial aspects of state-owned banks have been studied by other researchers. Prawira and Wiryono studied nonperforming loans in state-owned banks in Indonesia (Prawira and Wiryono 2020).
The environmental aspect of state-owned banks includes improving national and regional environmental performance, contributing to solving environmental problems, implementing the concept of environmentally safe enterprises, and adhering to environmental corporate responsibility principles (Guryanova et al. 2020; Ohorodnyk and Kozmuk 2018). Private banks are not interested in financing renewable energy and other environmental projects, while state-owned banks provide financing for public needs (Hathaway 2012).
The macroeconomic aspect of state-owned banks relates to restraining the financial and economic development of the economy (La Porta et al. 2002; Abuselidze 2021; Zomchak and Lapinkova 2022), slower financial development, less efficient financial systems, less private sector credit, and slower GDP growth (Caprio et al. 2004). Ukrainian researchers have a different view, pointing to the positive impact of state-owned banks through additional opportunities to support the economy, as state-owned banks have greater access to refinancing (Ohorodnyk 2018b) and additional state financial support (Ohorodnyk 2018b; Bortnikov 2019). The advantage of state-owned banks is the availability of loans to key sectors of the economy that private banks may consider unprofitable or unattractive for investment (Skrypnyk and Nehrey 2015; Ohorodnyk 2018c). State-owned banks agree to lend for the development of important economic sectors or regions (Kasych et al. 2020).
Lapavitsas proposed a comprehensive analysis of state-owned banks in the context of the cyclical regulation of the economy and the need for an active role of the state in times of financial crisis. The importance of state banks in counter-cyclical regulation has also been the subject of research (Kasych et al. 2020). Using the example of the global financial crisis of 2007–2009, Lapavitsas (2010) recommended the conversion of failed private banks into public ones. Public banks could more easily deal with liquidity and solvency problems; they could also play a long-term role by providing stable credit flows to households and small- and medium-sized enterprises.

3. Methodology

We propose to determine the cash flow of public funds to state-owned banks and the reverse cash flow to determine the impact of the activity and stability of public finances. The cash flow to state-owned banks includes the expenditure of public funds for the creation of authorised capital during the establishment of state-owned banks, the acquisition of shares in operating commercial banks, additional capitalisation (increase in authorised capital, additional equity) of state-owned banks, etc.
The reverse cash flow (cash flow from state banks to public funds) includes the payment of dividends based on the results of state banks’ operations, as well as revenues to public funds in case of the sale of shares (privatisation) of state banks. We consider this to be a simplified approach and the first one used in our study. The cash flow is defined as the difference between the cash inflow and the cash outflow of public funds:
CF = (D + S) − (SC + OE)
D—dividends of state-owned banks; S—proceeds from the sale of shares (privatisation) of state-owned banks; SC—public expenditure on share capital; OE—public expenditure on other equity instruments.
The second approach should be considered as an alternative and extended one since it takes into account more types of cash flows between public finances and state-owned banks, as well as a larger number of participants in financial relations.
CF = (D + S + T) − (SC + OE + I)
D—dividends of state-owned banks; S—proceeds from the sale of shares (privatisation) of state-owned banks; T—taxes paid by state-owned banks to the budgets; SC—public expenditure on share capital; OE—public expenditure on other equity instruments; I—interest payments and commission payments on government bonds issued to create and fund the authorised capital of state-owned banks.
The scheme of cash flows between Ukraine’s state-owned banks and public funds is shown in Figure 1.
The second approach is adapted to the peculiarities of the use of public funds to create and replenish the authorised capital of state-owned banks in Ukraine and is national, which is due to the following features:
(1)
The use of government bonds to create and replenish the authorised capital of state-owned banks, the expenditure of public funds on which is supplemented by the payment of interest and other commissions. The issuer of the bonds is the Government of Ukraine (the Cabinet of Ministers of Ukraine) with the technical and organisational support of the Ministry of Finance. The amount of interest and commission payments on government bonds issued to create and replenish the authorised capital of state-owned banks is not disclosed separately from total government debt. This makes it impossible to make relevant calculations.
(2)
The taxation of state-owned banks on a general basis, which includes the payment of income tax, other taxes, and mandatory payments to public funds (state and local budgets). The forms of financial statements of state-owned banks (balance sheet, income statement, cash flow statement) do not provide information on the total amount of taxes paid for which state-owned banks are taxpayers or tax agents. Therefore, it is only possible to calculate cash flows concerning income taxes paid in the profit and loss account.
We calculated the cash flow based on available public information only, given the limited information on the activities of state-owned banks in Ukraine and the limited information on cash flows within public finances.
CF = (D + S + CIT) − (SC + OE)
CIT—corporate income tax paid by state-owned banks.
This study used the methods of correlation and regression analysis between public finance indicators and the performance of state-owned banks, the ROA/ROE of the banking system, and the ROA/ROE of state-owned banks.
ROA = Net Income/Total Assets
ROE = Net Income/Equity

4. Results

To test the hypothesis that state-owned banks affect fiscal stability, it is advisable to start with the presence, place, and role of state-owned banks in the Ukrainian banking system.

4.1. State-Owned Banks in the Ukrainian Banking System

The Ukrainian banking system is very dynamic in terms of the number of banks, their composition and structure, and their capitalisation, according to the National Bank of Ukraine (Table 1).
The number of commercial banks in Ukraine is sensitive to the state of Ukrainian and foreign financial markets, as well as the social and political situation in the country. A significant reduction in the number of banks occurred in 2009–2010 when insolvent banks were removed from the banking market and liquidated, which should be considered as a result of the global financial crisis of 2009–2010. The global financial crisis did not affect the number of state-owned banks in Ukraine and their position in the banking system, but state-owned banks in developed economies increased from 6.7 per cent before 2008 to 8 per cent overall (World Bank 2012).
In 2014, the banking system entered a phase of reducing the number of banks with a simultaneous decrease in the value of assets. This followed the Revolution of Dignity, the annexation of part of Ukraine’s territory, and growing social and political instability in society. In 2014 alone, the banking system shrank by 17 commercial banks, including a 13.4% decrease in the value of assets. During 2015, the negative trend of the banking market exit accelerated, with the liquidation of 46 commercial banks. In the following years, the intensity of commercial banks’ exit from the Ukrainian banking market decreased: in 2016, 21 banks exited, while in 2017, 14 banks exited. In 2018, the number decreased further to 5 banks, and from 2019 to 2021, only 2 banks exited each year. Finally, in 2022, the exit rate remained relatively low, with only 4 banks exiting.
The presence of state-owned banks in the banking system is a characteristic feature of the Ukrainian banking system, with dynamics in terms of the number of banks (the first criterion), capitalisation (the second criterion), and share in the banking system’s capital (the third criterion). At the beginning of the period, there were six state-owned banks: Oschadbank, Ukreximbank, Kyiv Bank, Ukrgasbank, Rodovid Bank, and the Ukrainian Bank for Reconstruction and Development. The share of state-owned banks in the banking system’s capital was about 17–18%, provided that state-owned banks did not violate banking competition and did not restrict individuals and enterprises in choosing banks to receive banking services. In 2013, two state-owned banks were registered (State Land Bank and Settlement Centre), which were subsequently liquidated due to the lack of a developed and implemented business model. In 2014, Kyiv Bank was liquidated by transferring its assets and liabilities to Ukrgasbank. This process can be attributed to the takeover of one state-owned bank by another state-owned bank and the consolidation of state-owned banks’ capital. This is the only example of a takeover of a state-owned bank by another state-owned bank. In 2015, Rodovid Bank, which was previously nationalised as a “bad bank”, “bank of rehabilitation loans”, or “bank of bad loans”, was liquidated. Rodovid Bank did not attract funds from individuals and legal entities, provided a limited number of banking services, and failed to fulfil the main task set by the Government of Ukraine to effectively manage nonperforming loans and rehabilitation loans, and was therefore liquidated.
Structural changes in the banking system of Ukraine occurred in 2016–2017, which led to an increase in the capitalisation of state-owned banks. In December 2016, the Cabinet of Ministers and the National Security and Defence Council of Ukraine nationalised PrivatBank, which significantly changed the banking system of Ukraine. Over 50% of the capital of the banking system was held by four state-owned banks, accompanied by the activities of large banks such as Oschadbank, Ukreximbank, Ukrgasbank, and Privatbank. The nationalisation of Privatbank gave the state a monopoly on the number of bank branches, ATMs, self-service terminals, and electronic plastic cards. Such an advantage for state-owned banks should be seen as a manifestation of the violation of banking competition. Ukrainian scholars call this situation a violation of the requirements of free competition and a market economy (Bazilyuk et al. 2020).
In 2018, the Ukrainian banking system overcame the banking crisis (Drobiazko and Lyubich 2019): the capitalisation of the banking system and state-owned banks increased, financial stability and liquidity improved, and the share of nonperforming loans decreased.
The empirical analysis of the activities of state-owned banks is based on the most commonly used indicators in scientific research:
The total net financial result of Ukraine’s state-owned banks shows an overall loss in 2009–2011 due to the inefficient operation of Rodovid Bank and Ukrgasbank. The financial consequences of the global financial crisis in 2008–2009 were overcome by ensuring the profit of state banks in the amount of USD 227 million and by ensuring the profitability of state banks, except Rodovid Bank. The banking crisis caused by the Revolution of Dignity resulted in cumulative losses until 2017. The years 2014–2015 should be considered critical for the banking system as a whole and for state-owned banks. Oschadbank was unprofitable at 7–8 per cent of assets or 41–73 per cent of equity; Ukreximbank was unprofitable at 8–10 per cent of assets or 87–284 per cent of equity; and Ukrgasbank was unprofitable at 12.5 per cent of assets or 71 per cent of equity in 2014. In the following years, the state-owned banks maintained minimal performance. In 2022, the war hurt the banking system, including the activities of state-owned and commercial banks. The net profit of state-owned banks decreased by 60.14%, two state-owned banks became unprofitable (Ukreximbank and Ukrgasbank), and Oschadbank provided an ROA of 0.26% and ROE of 3%.
It is recommended to use the benchmarking technique and compare it with the profitability of the banking system (ROAbs, ROEbs) and the profitability of the Ukrainian commercial banks (ROAcb, ROEcb) when studying the ROA of state-owned banks (ROAsb) and ROE of state-owned banks (ROEsb). According to the National Bank of Ukraine, the ROAbs of Ukraine were (−4.38)% in 2009, (−1.45)% in 2010, (−0.76)% in 2011, 0.45% in 2012, 0.12% in 2013, (−4.07)% in 2014, (−5.46)% in 2015, (−12.60)% in 2016, (−1.93)% in 2017, 1.69% in 2018, 4.26% in 2019, 2.44% in 2020, 4.09% in 2021, and 1.08% in 2022. Thus, after the global financial crisis of 2008, state-owned banks operated with ROAsb lower than ROAcb, indicating that the management of state-owned banks was not efficient enough to overcome the consequences of the crisis, mainly in Ukrgasbank and Rodovid Bank. The insufficient efficiency of state-owned banks’ asset management was also repeated in the postcrisis period, in 2014, 2015, 2016, and 2017 (Figure 2).
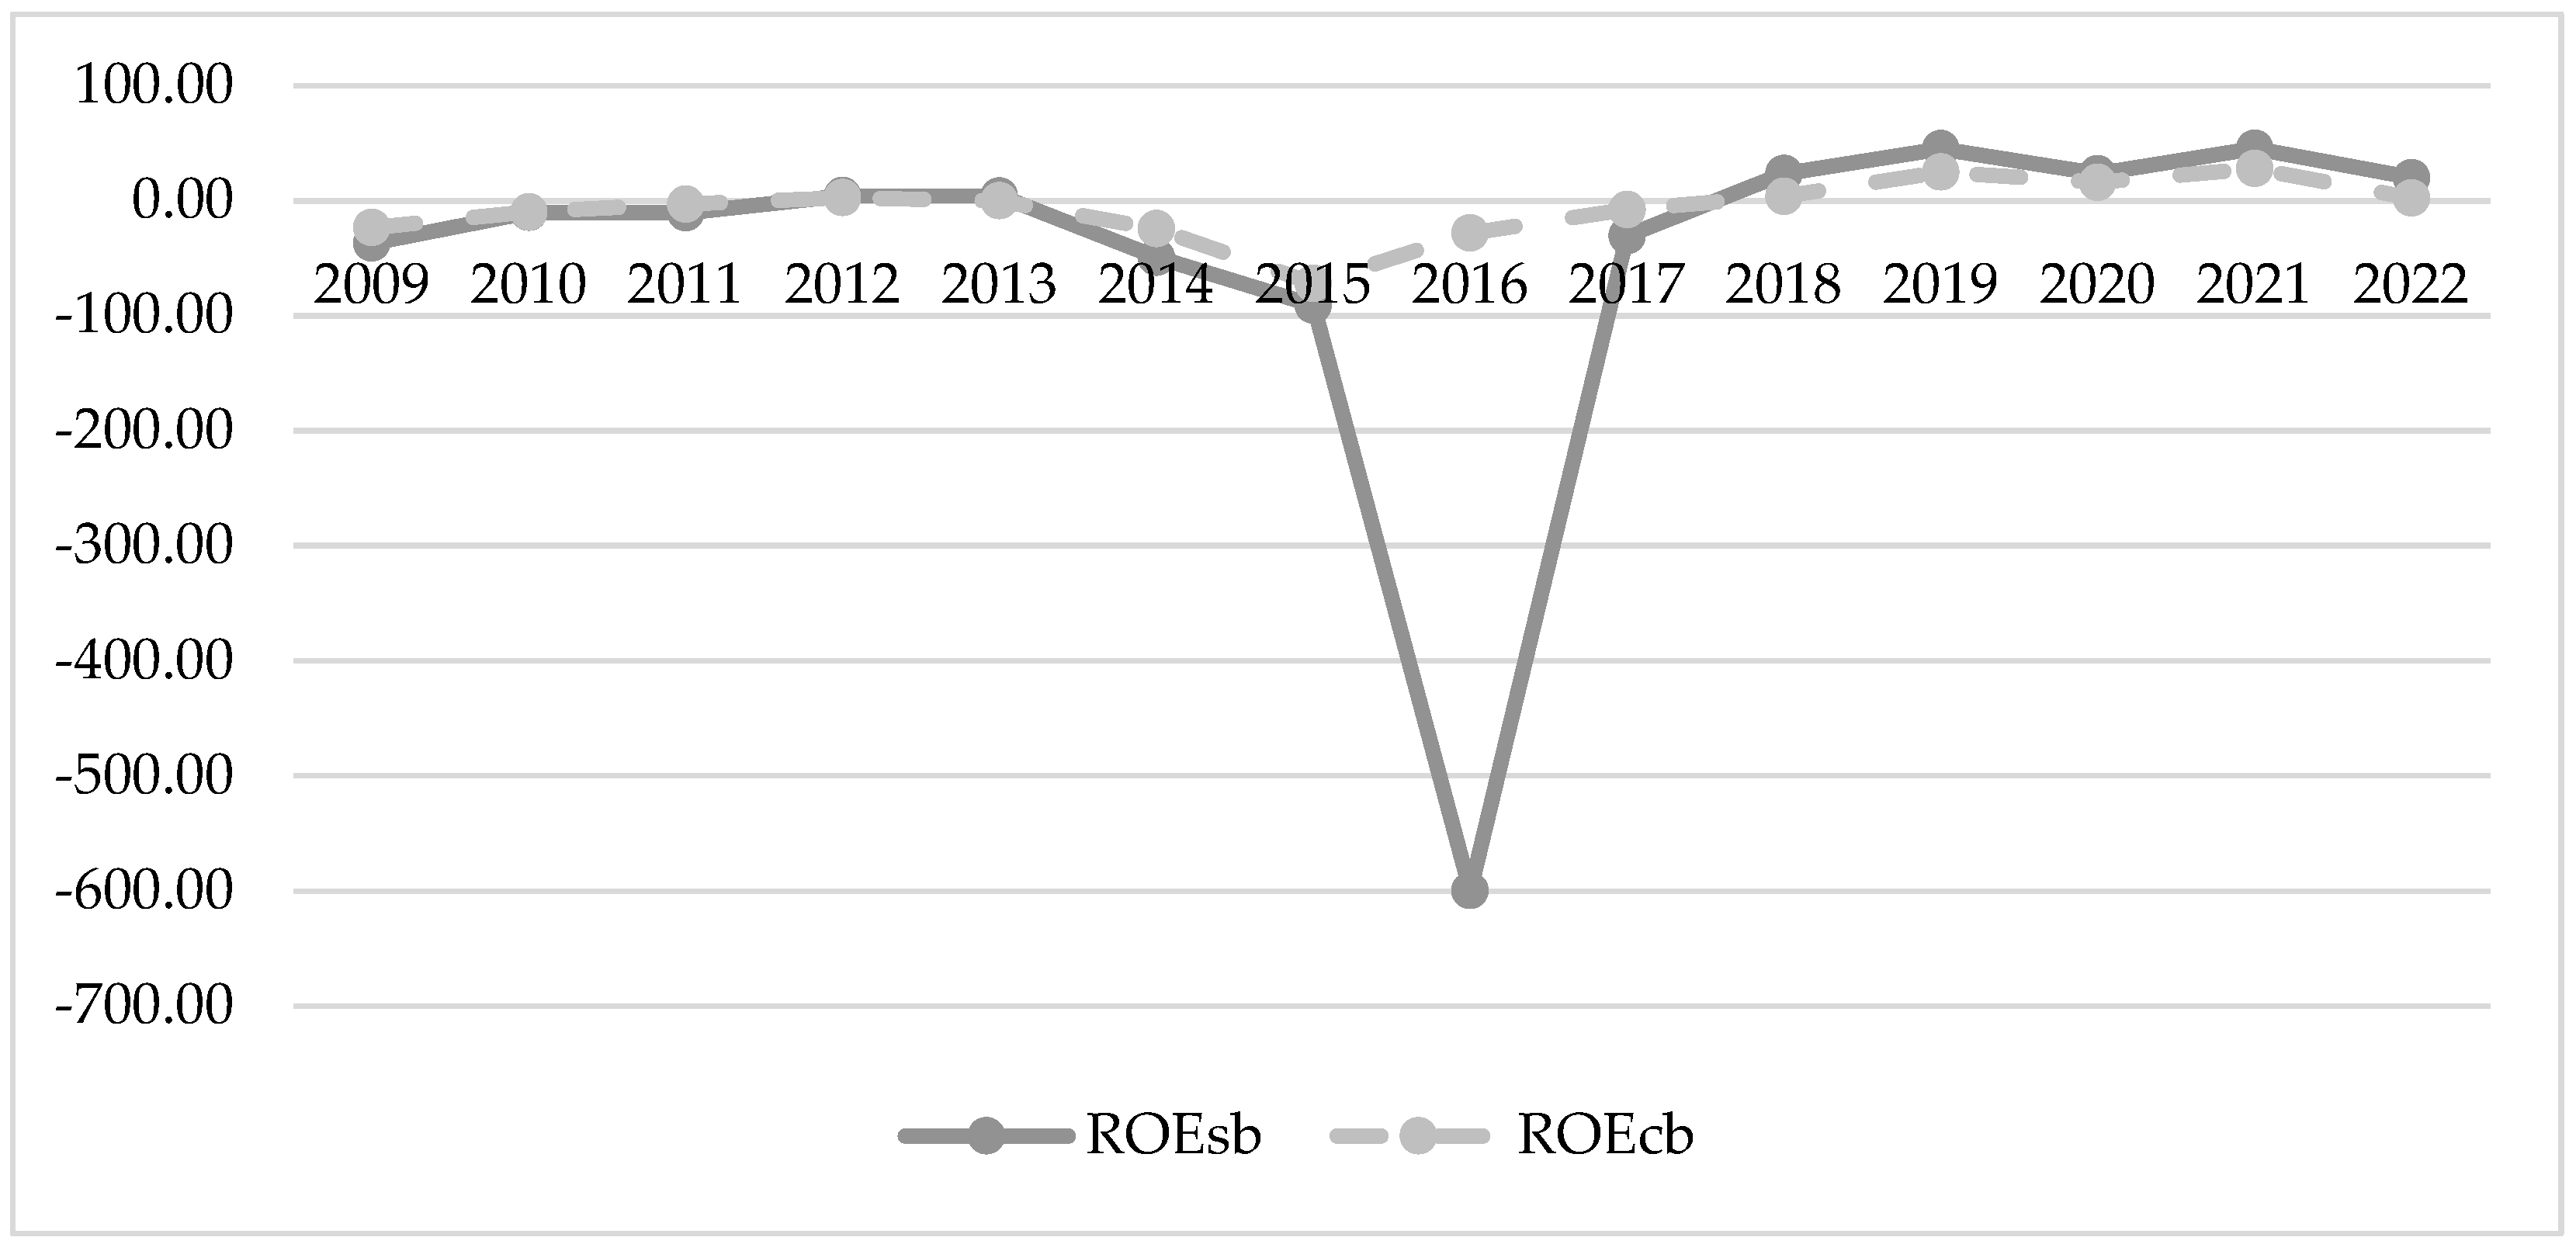
According to the National Bank of Ukraine, the ROEbs of Ukraine were (−32.52)% in 2009, (−10.19)% in 2010, (−5.27)% in 2011, 3.03% in 2012, 0.81% in 2013, (−30.46)% in 2014, (−51.91)% in 2015, (−116.74)% in 2016, (−15.84)% in 2017, 14.67% in 2018, 33.45% in 2019, 19.22% in 2020, 35.08% in 2021, and 10.06% in 2022. Thus, in the first year after the global financial crisis, the state-owned banks operated with an unprofitability (ROEsb) that was higher than the ROEcb; in 2009–2011, the lack of efficiency in the management of the state-owned banks prevailed. The lack of efficiency in the asset management of state-owned banks was also repeated in 2014, 2015, 2016, and 2017 in the postcrisis period, which completely repeats the dynamics of ROAsb (Figure 3).
The activities of state-owned banks are coordinated and regulated by the Cabinet of Ministers of Ukraine, the Ministry of Finance of Ukraine, and the National Bank of Ukraine. State-owned banks are financed by the Cabinet of Ministers of Ukraine from public financial resources (the state budget and state loans). The financial performance of state-owned banks is not closely related to the financial performance of the Ukrainian banking system. We have observed insufficient ROEsb and ROAsb in crisis and postcrisis periods, while in periods of economic growth and macroeconomic stability state-owned banks show high ROEsb and ROAsb.

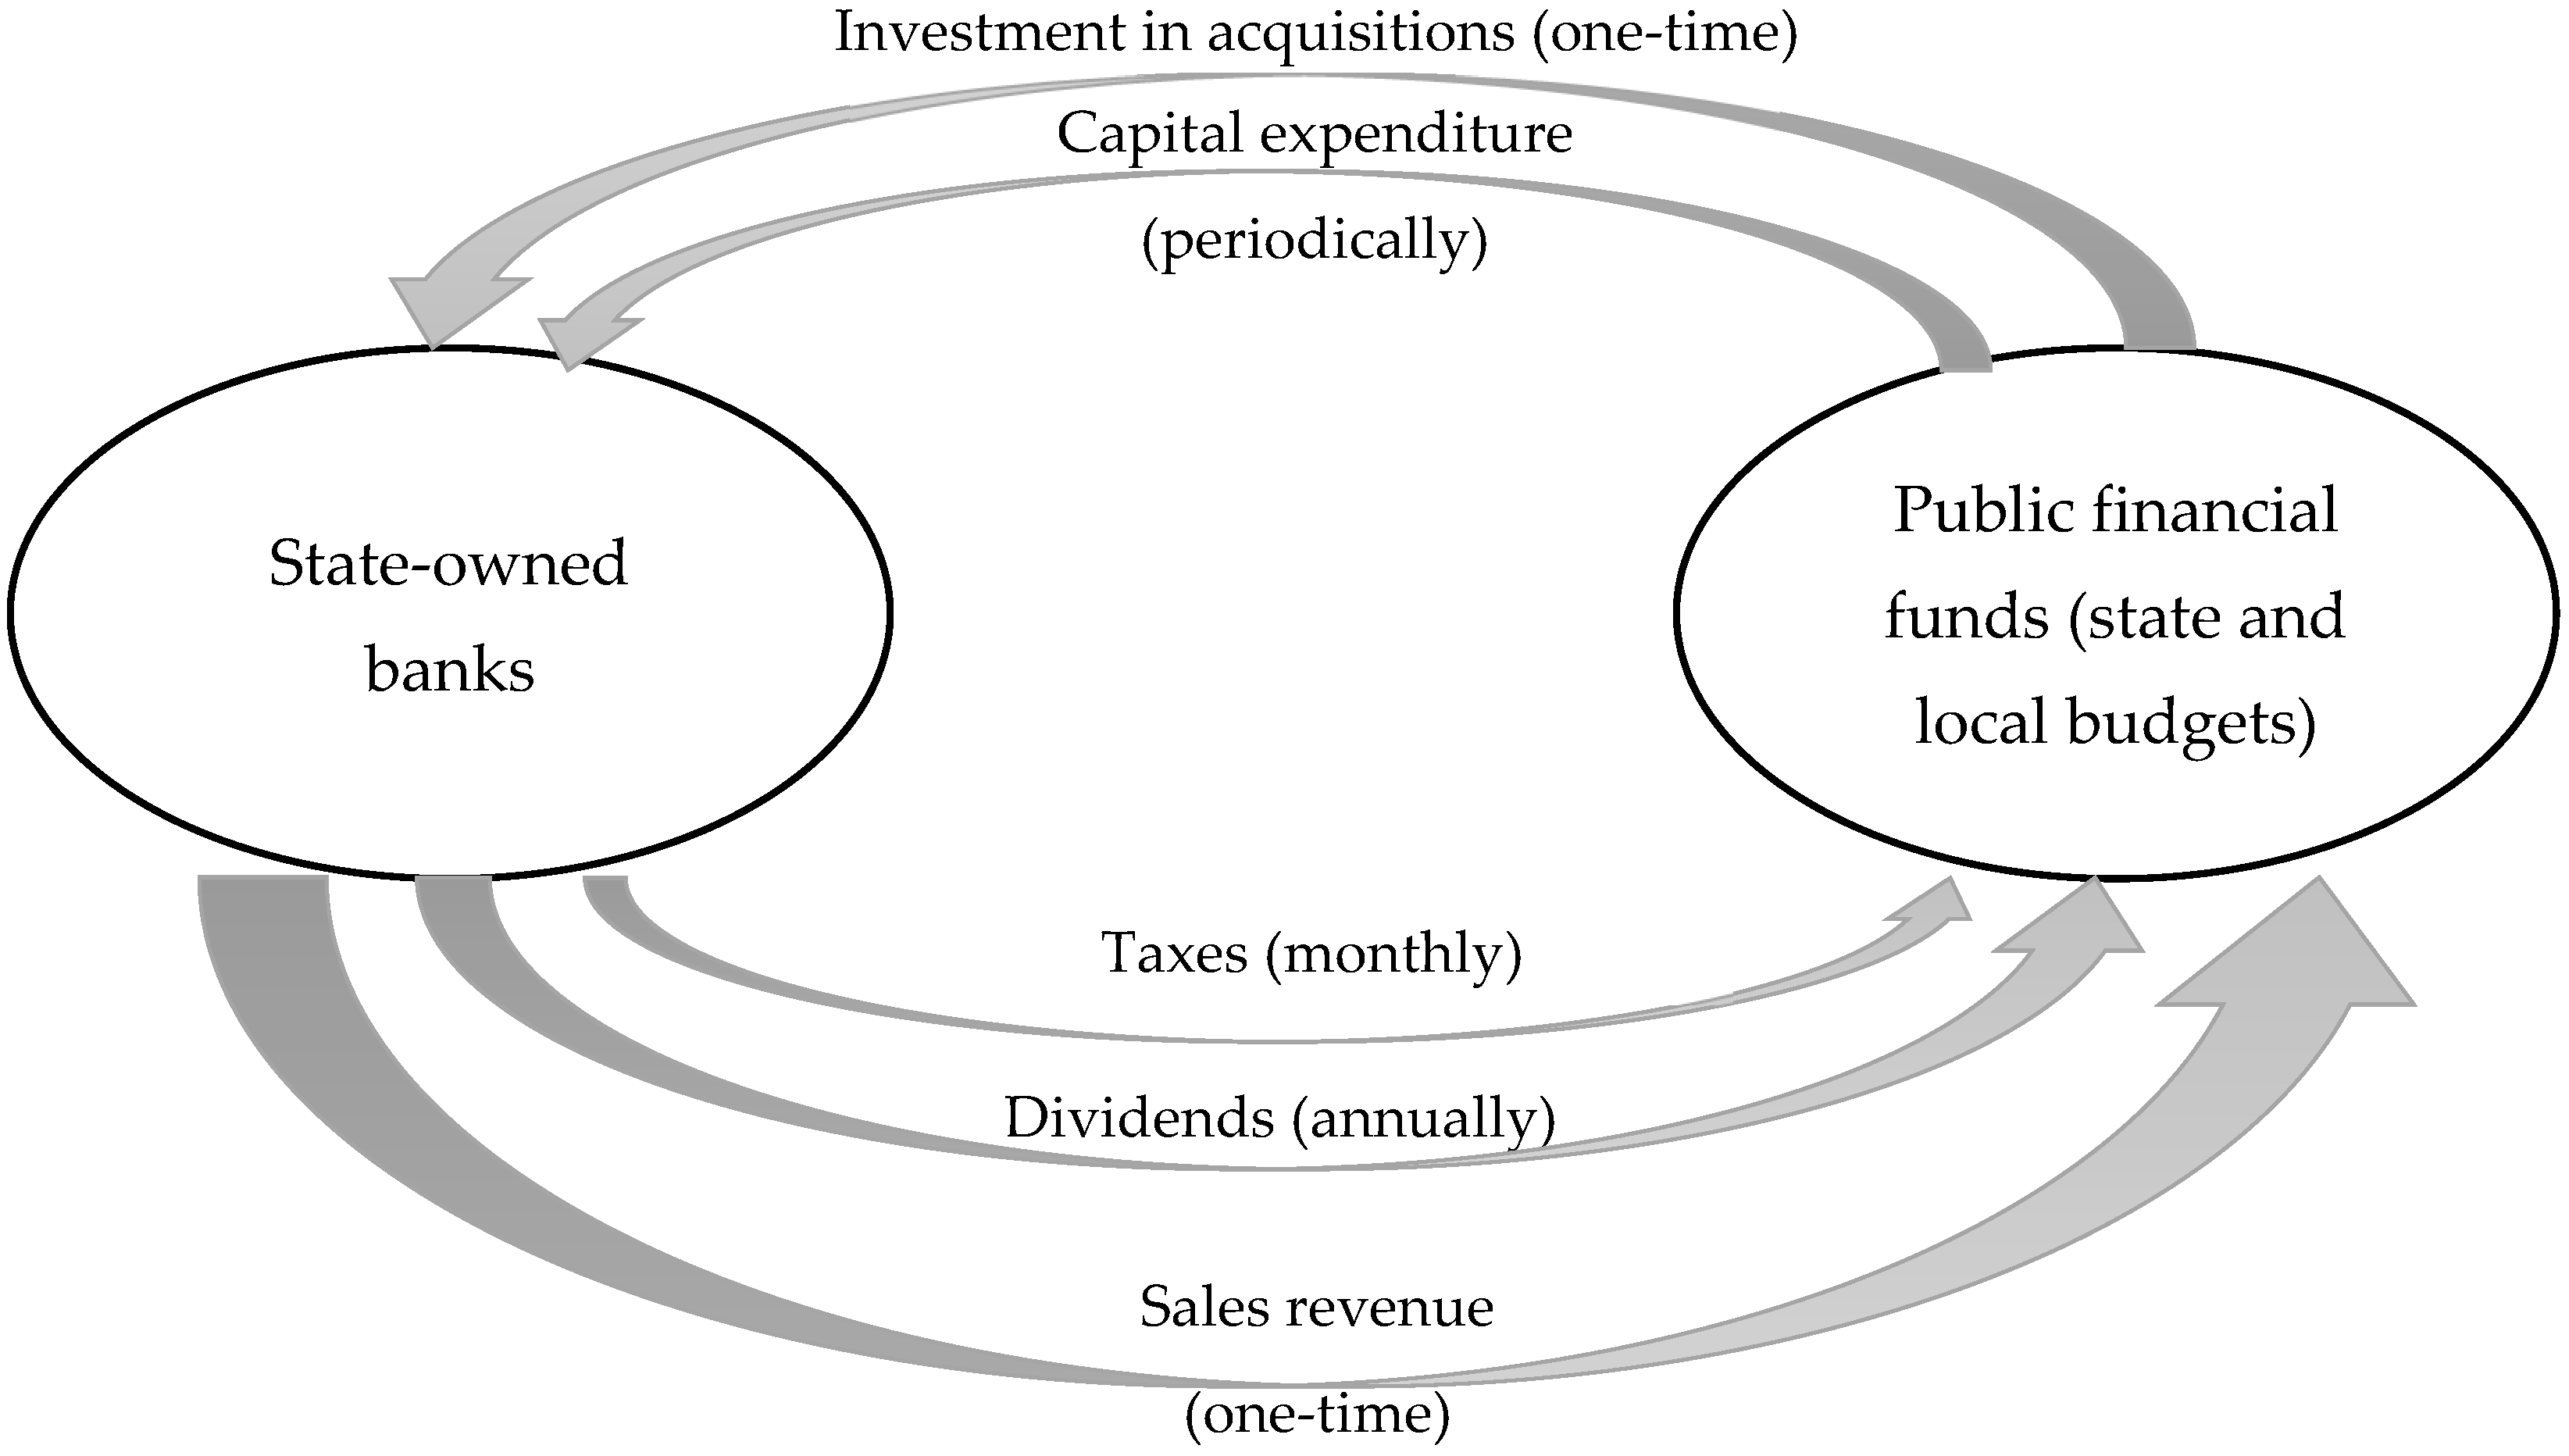
4.2. Cash Flows between State-Owned Banks and Public Funds: Analytical Aspect

We have defined the following indicators: expenditure of public funds on share capital, expenditure of public funds on other equity instruments, dividends of state-owned banks paid to the state budget, income from the sale of state-owned banks, and corporate income tax.
State budget expenditures on the capitalisation of state-owned banks are one of the items of state budget expenditures that should be classified as recurrent expenditures. Table 5 shows that the largest amount of money was spent in 2009 to deal with the consequences of the 2008 global financial crisis and to maintain the stability of the banking system by preventing the failure of large banks, including state-owned banks. In 2009, the authorised capital of Ukreximbank, Kyiv Bank, Ukrgasbank, and Rodovid Bank was increased to prevent bankruptcy, but Kyiv Bank and Rodovid Bank were liquidated in 2014–2015, so the cost of their capitalisation should be considered an example of inefficient use of public funds. In 2011, the troubled Rodovid Bank was recapitalised for the second time, and the total capitalisation costs of these banks amounted to USD 2004 million, which had a negative impact on public finances due to the possibility of financing other expenditures that could have been social or infrastructure-related.
In the years after 2009, the capitalisation expenditures of state-owned banks were determined not by the dynamics of macroeconomic indicators and the banking system, but by the financial needs of individual state-owned banks, mainly to ensure liquidity and financial stability due to inefficient active operations of state-owned banks.
Oschadbank: The total cost of capitalisation of Oschadbank was USD 2318 million, part of which was achieved without cash flows (through capitalisation of retained net profit and an increase in the nominal value of shares). The remaining part of the capitalisation was financed by government bonds, domestic government loan bonds (“DGLBs”): 2013—UAH 1400 million with an interest rate of 9.50%; 2014—UAH 11,598 million with an interest rate of 7.05%; 2016—UAH 4956 million with an interest rate of 6%; 2017—UAH 8867 million with an interest rate of 6%. The majority of DGLBs are issued with a tenor of 10 years, so Oschadbank’s target return on equity should be at least 6%.
Comparing the return on DGLBs with ROE shows that the two rates diverge. Due to raising Oschadbank’s equity at 9.5% in 2013, the bank had an ROE of no more than 3.6% in the long term. In 2014–2015, Oschadbank’s equity was raised at 7.05%, with a loss-making rate. In 2019 and 2021–2022, the ROE level did not provide sufficient profitability to cover the interest payments on the DGLB. This is the first sign of an inefficient and risky use of public funds.
Ukreximbank: The total capitalisation costs for Ukreximbank amounted to USD 3047 million. In 2009, the Ministry of Finance of Ukraine issued a UAH 1 million DGLB with a maturity of nine years and a yield of 9.5% p.a., initiated by the Ministry of Housing and Communal Services to finance electric vehicle leasing programmes and energy saving and modernisation projects in the municipal heating sector. In this case, public funds were used to invest in a state-owned bank, but the ROE after the capital increase did not exceed one per cent until 2011, did not exceed two per cent in 2012–2013, and was negative in 2015–2016. In 2010, the share capital was increased to guarantee the fulfilment of foreign economic contracts by Ukrainian defence companies through the issue of DGLBs. In 2014, the bank capitalised by issuing UAH 5000 million of DGLBs with a 10-year maturity and an interest rate of 9.5%. In 2016, the bank’s share capital was increased by an additional UAH 9319 million through the issue of DGLBs with a maturity of 10 years and an interest rate of 6%, provided that ROEs in the previous years and the year of the loan were (−86.51)%, (−285.90)%, and (−29.36)%. In 2016–2017, the share capital was replenished at the expense of DGLBs at an interest rate of 6.00–6.86%. In 2020, equity capital was raised through the issue of UAH 6800 million of DGLBs with a maturity of 15 years and an interest rate of 9.3%.
Accordingly, due to the loss-making years 2014, 2015, 2016, 2020, and 2022, there are no financial grounds and prospects for repayment of the DGLB or payment of interest on the use of borrowed funds based on the results of Ukreximbank’s operations. The repayment of the DGLB and the interest payments is an additional burden on the state budget and public finances.
Kyiv Bank was recapitalised in 2009 with UAH 3565 million of DGLBs at an interest rate of 9.5%. This interest rate was not achieved in the form of ROE in any year before the bank’s liquidation.
Ukrgasbank: Ukrgasbank’s equity was increased by UAH 3204 million and UAH 633 million through the issuance of domestic government bonds and an interest rate of 9.5% in 2015. In 2015–2019, retained earnings as part of the bank’s net profit were a stable source of equity growth, which is unique to Ukrgasbank and demonstrates its ability to ensure efficient use of invested state capital in the face of uncertainty and financial and economic instability.
Rodovid Bank and the Ukrainian Bank for Reconstruction and Development had a slight increase in share capital at the expense of public funds. In 2016, the Ukrainian Bank for Reconstruction and Development sold the state’s share of its capital for UAH 82.2 million, which did not cover the bank’s capital requirements in 2010 and 2012. This was the second sign of inefficient and risky use of public funds, namely the discrepancy between the market value of the state bank’s stake and previous expenditures.
Privatbank: Privatbank was capitalised following Resolution of the Cabinet of Ministers of Ukraine No. 961 of 18 December 2016, and the Deposit Guarantee Fund was capitalised by Resolution of the Cabinet of Ministers of Ukraine No. 1003 of 28 December 2016. In December 2016, the Cabinet of Ministers of Ukraine decided to issue additional shares of the bank in the total amount of UAH 116,800 million, financed by domestic government bonds at an interest rate of 6.86% per annum. In June 2017, the bank again issued additional shares in the total amount of UAH 38,565 million, financed by Ukrainian government bonds at an interest rate of 9.70% per annum.
The experience of financing the capitalisation needs of state-owned banks is widespread in other countries. In Turkey, the issuance of government bonds and other reforms (reduction in the number of bank branches, labour, and operating costs) led to the profitability of state-owned banks (Aysan and Ceyhan 2010). In Ukraine, it is not possible to determine the profitability of state-owned banks based on the results of capitalisation using the DGLB.
Dividends and taxes paid go to the state budget and are compensating cash flows that can finance the repayment and funding of the DGLB. The regulatory approach to the capitalisation of state-owned banks should be to ensure that they are self-financing and profitable, unless the state-owned bank performs social and other public functions. The dividend policy of Ukrainian state-owned banks is determined by the Cabinet of Ministers of Ukraine through the legislative definition of the dividend payment rate and is adjusted by the net financial result based on the results of their activities. The Cabinet of Ministers of Ukraine approves the net profit distribution rate on an annual basis. For instance:
  • 2017: Oschadbank—30%, Ukrgasbank, Ukreximbank, Privatbank—75% (basic rate for state-owned companies);
  • 2018: Oschadbank—30%, Ukrgasbank, Ukreximbank, Privatbank—90% (basic rate for state-owned companies);
  • 2019: Oschadbank, Ukreximbank—30%, Ukrgasbank—50% (basic rate for state-owned companies), Privatbank—75%;
  • 2020–2021: Oschadbank—30%, Ukreximbank, Ukrgasbank—50% (basic rate for state-owned companies), Privatbank—80%.
Based on the results of the regulatory requirements for profit and loss set by the Cabinet of Ministers of Ukraine, state-owned banks transferred USD 3218 million to the state budget in 2009–2022 (Table 6), with the predominance of dividend payments in 2019–2022 (95%) and the predominance of dividend payments from Privatbank (92%).
Corporate income tax paid by state-owned banks is generally accrued and paid at a rate of 18% of pretax financial income. For 2009–2022, USD 898 million was transferred to the state budget (Table 6), with the predominance of tax payments in 2019–2022 (73%) and the predominance of tax payments from Privatbank (59%).
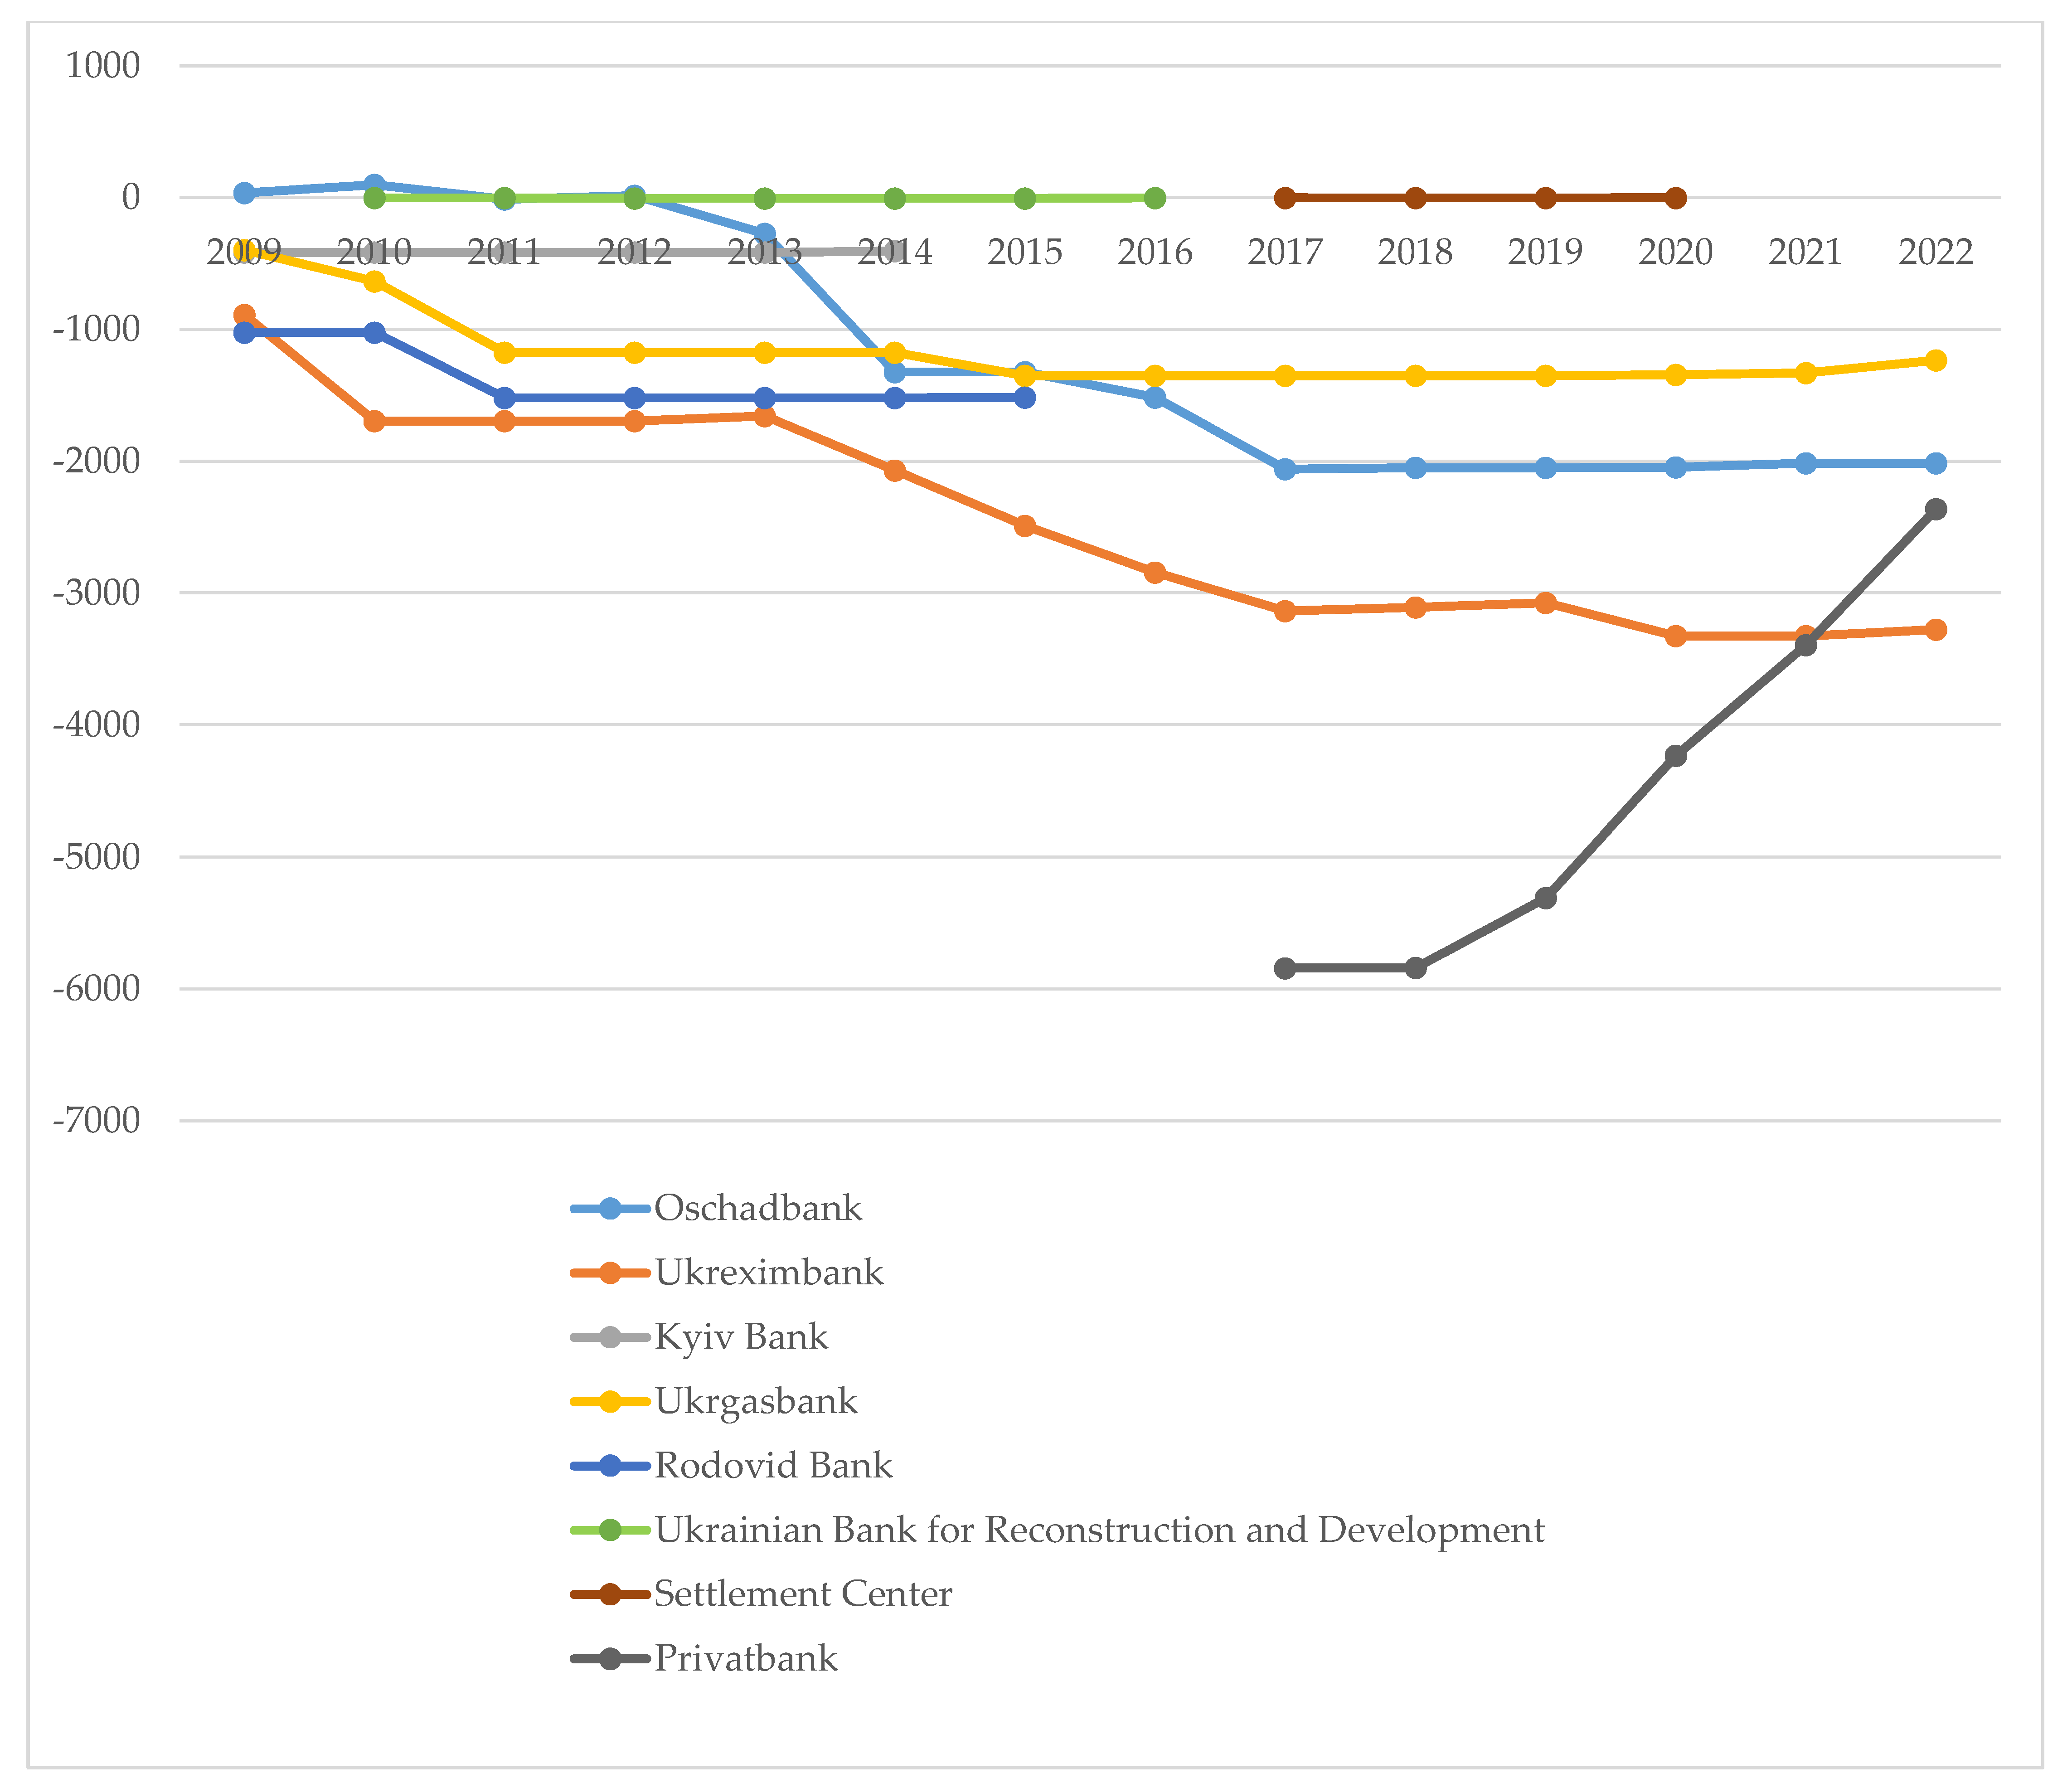
Due to the limited information available on the activities of state-owned banks in Ukraine and the limited information available on the cash flows within the public finances, we used Formula (3). We determined the cumulative cash flows for each state-owned bank as of the beginning of 2023. Oschadbank’s cumulative deficit was USD 2015 million, Ukreximbank’s cumulative deficit was USD 3277 million, Ukrgasbank’s cumulative deficit was USD 1233 million, and Privatbank’s cumulative deficit was USD 2364 million (Figure 4). The lack of management of state-owned banks was reflected in the cumulative deficits of state-owned banks that were liquidated or privatised in 2014–2017 and have no prospects of repayment in the coming periods. The dynamics of the cumulative deficit can be used to determine the waviness of the cumulative deficit. The historical maximum of the cumulative deficit was reached in 2017, due to the issuance of DGLBs for the nationalisation of Privatbank. In 2018, the fiscal cost compensation stages of USD 38 million, USD 567 million, USD 835 million, USD 877 million, and USD 1176 million started.
Therefore, we calculated the cumulative cash flow deficit of Ukraine’s state-owned banks and public funds based on the excess of the fiscal cost of increasing the share capital of state-owned banks over dividends paid and corporate income tax paid.

4.3. Influence of State-Owned Banks on Public Finance Sustainability

The impact of state-owned banks on the sustainability of public finances is determined by the direction of alternative financing and debt financing of the capital increase of state-owned banks by the DGLB.
Expenditure on the capitalisation of state-owned banks totals USD 13,482 million over the period 2009–2022, which is ten times higher than expenditures on civil defence, military education, communications, telecommunications and information technology, and social protection of the unemployed, and several times higher than expenditures on fire and rescue, justice, national defence, agriculture, construction, environmental protection, and social protection of war and labour veterans. Expenditure on the capitalisation of state-owned banks thus exceeded other public expenditures in nominal terms, leading to structural changes in budget expenditure (Appendix A).
In 2009–2022, DGLBs were issued for USD 13,868 million (Figure 5), accounting for 71% of all DGLBs issued in 2009, 21% in 2010, 27% in 2011, 2% in 2013, 8% in 2014, 6% in 2015, 73% in 2016, 68% in 2017, and 3% in 2020. The accumulated public debt from DGLBs is a burden on the consolidated budget of Ukraine due to the additional debt burden, which should be considered high for the budget.
We prove the existence of a very strong inverse relationship between the amount of public debt and structural changes on the expenditure side of the budget based on an empirical analysis of the total amount of public debt, the state budget of Ukraine’s expenditures on public debt service, and the structure and structural changes on the expenditure side in the long term, using the methods of economic and statistical analysis. Thus, each additional UAH 1 billion borrowed resulted in structural changes on the expenditure side of the state budget of 0.01% in the direction of reducing expenditures on economic activity, education, healthcare, and mental and physical development (Boiko et al. 2020).

5. Discussion

The academic and practical discussion of the impact of state-owned banks on fiscal sustainability focuses on (1) the appropriateness of state-owned banks and their impact on fiscal sustainability in Ukraine, and (2) the prospects for optimising the number of state-owned banks.
The expediency of the functioning of state-owned banks is controversial, as the management of state-owned banks needs to be improved (Kostohryz and Khutorna 2018; Drobiazko et al. 2019). State-owned banks cannot provide sufficient ROA/ROE because they are limited in their management decisions and forced to implement political decisions on lending to state-owned enterprises or enterprises of political entities. A prerequisite for the continued operation of state-owned banks is to ensure transparency and publicity of their activities and impartiality of management decisions on active and passive operations. For state-owned banks, the creation and active work of independent supervisory boards that can withstand the current challenges of the changing political and economic situation in Ukraine are being discussed (Ohorodnyk 2018b).
Regarding the impact of the state’s presence in the Ukrainian banking market on debt policy, Londar concludes: “Financial support to state-owned enterprises and banks through government bonds should be considered as a significant debt-forming factor in Ukraine, exacerbating debt risks such as budgetary and refinancing risks” (Londar 2017). Akimova (2020) criticises the capitalisation of state-owned banks through the issuance of domestic government bonds.
The ineffective policy of state-owned banks and the inability of state-owned bank managers to ensure the functioning of state-owned banks have caused taxpayers to compensate for the accumulated losses using debt financing. The main consequences of the inefficient management of state-owned banks for taxpayers have been a reduction in social spending and less support for the private sector from the budget.
A disadvantage of state-owned banks is the diversion of funds from the banking system to finance public needs, including under political pressure (Yashchuk and Kuznetsova 2018). Ukraine’s state-owned banks are the main domestic creditors of the state. In the macroeconomic context, the redirection of financial flows to government lending means that government loans replace bank loans to enterprises and crowd out domestic investment (Drobiazko and Bespalyi 2018). The attraction of government loans from domestic sources in the amount of 1 per cent of GDP, due to the crowding-out effect, leads to a 0.9 per cent reduction in the growth rate of the banks’ loan portfolio (Drobiazko and Bespalyi 2018).
State-owned banks in Ukraine are inefficient in performing important public tasks (Trygub 2015). Trygub points to the lack of priority in financing public needs, infrastructure projects, etc.
The Ministry of Finance of Ukraine, in agreement with international financial organisations, has developed the Principles of Strategic Reform of the State Banking Sector (Ministry of Finance of Ukraine 2020), which are based on optimising the share of state capital in the banking system. Following the example of some European countries (the UK, France, Spain, Italy, Portugal), the target share of state capital is set at less than 30% (Ministry of Finance of Ukraine 2020). According to the Principles of Strategic Reform of the State-Owned Banking Sector, “the state’s goal is to reduce the market share of state-owned banks to 25% by 2025 by selling majority stakes to foreign and local strategic investors, international financial institutions, and through initial public offering” (Ministry of Finance of Ukraine 2020). The prospect of optimising the share of state-owned banks in the Ukrainian banking system has been welcomed by Hladkykh 2015; Kostohryz and Khutorna 2018; Yashchuk and Kuznetsova 2018; and Bazilyuk et al. 2020.
Despite the approval of the Principles for the Strategic Reform of the State-Owned Banking Sector in 2020, the actual share of state capital is between 47% and 55%. The main conditions for optimising the share of state capital in the banking sector are sale at fair market value, and sale in accordance with international best practices, at a favourable time and with the involvement of professional external expertise. The areas of optimisation of state-owned banks approved by the Ministry of Finance of Ukraine in agreement with international financial organisations were sale of part of Oschadbank’s shares to international financial organisations by 2020 (not implemented), privatisation of Ukreximbank by 2023 (not implemented), receipt of a loan from the International Finance Corporation for Ukrgasbank to be converted into additional capital of the bank (not implemented by 2023), and withdrawal of the state from the capital of Privatbank (not implemented by 2023). Thus, the intention to optimise the share of state capital in the Ukrainian banking system has not been implemented within the set timeframe.
Marois believes that privatisation is being sold as the only real improvement (Marois 2016). The position (Karim 2003; Caprio et al. 2004; Sathye 2005; Boubakri et al. 2008; Otchere 2005; Marois 2016) is that privatisation of state-owned banks is necessary and appropriate to achieve sustainable development of banking systems.
Different strategies have been used around the world to privatise banks. These include sale to a strategic investor, initial public offerings (IPOs), voucher schemes, and sale to employees (Sathye 2005). Ohorodnyk offers recommendations for reducing the share of state-owned banks in Ukraine, but only through a strategic foreign investor (Ohorodnyk 2018b).
The authors recognise the conditions for optimising state-owned banks through sale at fair market value as favourable for the development of the banking system from the point of view of ensuring competition in the banking system and for the development of public finances from the point of view of reducing debt pressure.
In our view, the number of state-owned banks should be optimised and banks that operate inefficiently and are an additional burden on public finances should be privatised. Ukraine is at war with the Russian Federation and needs to review the use of public funds. Taxpayers’ money should be used to rebuild war-damaged housing and social and transport infrastructure rather than to ensure the inefficient operation of state-owned banks. Privatbank is highly efficient in its use of taxpayers’ money and a large regional network, so it should remain in state ownership. Oschadbank, Ukreximbank, and Ukrgasbank have low-efficiency indicators, and the question of whether to keep them in state ownership should be decided based on a dialogue between the Ukrainian government and international experts, with the possibility of further public privatisation.

6. Conclusions

This study was conducted to test the hypothesis that state-owned banks have an impact on the stability of public finances in Ukraine in terms of cash flows between state-owned banks and public funds. The study was conducted using data from state-owned banks (Oschadbank, Ukreximbank, Kyiv Bank, Ukrgasbank, Rodovid Bank, Ukrainian Bank for Reconstruction and Development, State Land Bank, Settlement Centre, and Privatbank) for 2009–2022, according to limited public financial information. The peculiarities of the state policy towards state-owned banks were a selective approach to bank nationalisation in the post-2008 crisis period, the establishment of state-owned banks without a clear business model, the lack of proper control over the activities of state-owned banks, etc.
The results of this empirical study show that state-owned banks have increased their authorised capital at the expense of funds received from the Ukrainian government through the placement of domestic government bonds. The main reasons for the increase in the authorised capital of state-owned banks were losses from inefficient lending operations with state-owned enterprises, lending operations with enterprises of political entities, and lending operations with risky (insolvent) borrowers. The increase in Ukraine’s public debt due to the inefficient operation of state-owned banks and the growth of the short- and long-term debt burden is the first sign of the impact of state-owned banks on public finances.
The funds raised from the placement of domestic government bonds for the capitalisation of state-owned banks were raised at market rates on the Ukrainian financial market, which significantly exceeded the level of return on equity. Thus, the Ukrainian government deliberately shifted part of the interest payments from state-owned banks to taxpayers. The second sign of the influence of state-owned banks on public finances is the compensation of interest on domestic government bonds from public funds, as state-owned banks did not have a sufficient level of profitability.
It is proven that in 2009–2022 the expenses for capitalisation of state-owned banks in Ukraine nominally exceeded other public expenses (civil defence, military education, communication, telecommunication and informatics, and social protection of the unemployed; several times higher than expenses for fire protection and rescue, judiciary, state defence activity, agriculture, construction, environmental protection, and social protection of war and labour veterans) and caused structural changes in budget expenses.

Author Contributions

Conceptualisation, N.D., S.B., O.C. and M.N.; methodology, N.D. and S.B.; writing—review and editing, N.D., S.B., O.C. and M.N.; visualisation, M.N.; supervision, N.D.; project administration, N.D. and M.N. All authors have read and agreed to the published version of the manuscript.

Funding

This research received no external funding.

Informed Consent Statement

Not applicable.

Data Availability Statement

Not applicable.

Acknowledgments

The author is thankful for the reviewers’ comments and valuable suggestions for the improvement of this paper.

Conflicts of Interest

The authors declare no conflict of interest.

Appendix A

Consolidated budget expenditure of Ukraine, USD million.
2009201020112012201320142015201620172018201920202021
General public services4261565662606831772064655385525462527042785975989263
Superior government bodies, local government bodies and authorities, and financial and external activity2402272725592601271017041074119017202412259826142996
Other public services257288313350370208168182223164240177200
Conducting elections and referendums0032325720119568881689915
Debt servicing and government derivative payments1256206630063152415041593945376141584268464744975777
Defence1240143016621813185723022381232327963567412644654674
Military defencel/il/i12761451148420512170209025233218395342704450
Civil defence009877653737244958566269
Military education0010010711677667890108000
Public order, security, and judiciary31,248363240964590493037742516282033274339556059176456
Providing public order, counteracting criminality, and state border protection1450168718322005204118581302153715401973260228262922
Fire protection and rescue451505517511551380226251350436600727671
Judiciary319377419538597420232278363555716692747
Criminal–executive system and penitentiary measures263317350361375244140142174243281287316
State defence activity00440490531360264300380460615701927
Supervision over adherence to laws and representing functions in court126156289363445236137122213264285274389
Economic affairs54,4275678773778066350367125752591386851755967975310,761
Agriculture, forestry and hunting, and fishing8059021128937964494278226487519557550616
Fuel and energy complex154615061435218419297868788106129165222221
Other industry and construction122921561566329202170553690959947
Transport1948212026352090223915801424114518572584299953147182
Communication, telecommunication, and informatics25222325231612153647545084
Environmental protection327362488663700293253245276303377336389
Housing and utilities96669011042510964149871968710221116133411952087
Health4693563961457315770348083250295538504259496765217481
Cultural and physical development1069145213501707170911667436619151066122111761589
Education857010,06010,82612,70913,204842252285066668977229238935911,468
Social protection and social security10,12313,18413,24815,68118,14911,610807210,11010,74411,37312,45012,86213,463
Social protection in case of disability416554649827961670398403482592724150270
Social protection for retirees64808464773885451091867144559577752725807739978767768
Social protection for war and labour veterans5155695866606113952462732553763828385
Social protection for families, children, and youth1924258231203739446830621670159316591540170681106
Social protection for the unemployed113503253446725069
Housing assistance176285364451335219710162925842545162114621883
Social protection for other categories of population52760213248129271846939432635634039427263000
Total expenditure39,81747,78352,91661,62663,28644,00931,12332,71239,74145,96253,09859,18267,630
Net lending4782815164948367418140728070184213175
l/i—lack of information. Source: Authors’ own elaborations from the panel data set of Ministry of Finance of Ukraine 2022 (Ministry of Finance of Ukraine 2022).

References

  1. Abuselidze, George. 2021. The Impact of Banking Competition on Economic Growth and Financial Stability: An Empirical Investigation. European Journal of Sustainable Development 10: 203–20. [Google Scholar] [CrossRef]
  2. Akimova, Liudmyla. 2020. State-Owned Banks: Risk Assessment of the High Share of Their Capital in the Banking Sector and the Ways of Minimizing Them. Bulletin of the National University of Water Management and Nature Management 1: 3–13. [Google Scholar] [CrossRef]
  3. AlAli, Musaed S., and Tariq Saeed. 2020. Government Ownership Effect on Staffing Level and Financial Performance: A Case Study on Kuwaiti Banks. International Journal of Finance & Banking Studies (2147–4486) 9: 99–104. [Google Scholar] [CrossRef]
  4. Alam, Md Shabbir, Mustafa Raza Rabbani, Mohammad Rumzi Tausif, and Joji Abey. 2021. Banks’ Performance and Economic Growth in India: A Panel Cointegration Analysis. Economies 9: 38. [Google Scholar] [CrossRef]
  5. Albertazzi, Ugo, Alessandro Notarpietro, and Stefano Siviero. 2016. An Inquiry into the Determinants of the Profitability of Italian Banks. Bank of Italy Occasional Paper 364: 1–41. [Google Scholar] [CrossRef]
  6. Altahtamouni, Farouq, Ahoud Alfayhani, Amna Qazaq, Arwa Alkhalifah, Hajar Masfer, Ryoof Almutawa, and Shikhah Alyousef. 2022. Sustainable Growth Rate and ROE Analysis: An Applied Study on Saudi Banks Using the PRAT Model. Economies 10: 70. [Google Scholar] [CrossRef]
  7. Anik, Tanvir Hasan, Nandan Kumer Das, and Md Jahangir Alam. 2019. Non-Performing Loans and Its Impact on Profitability: An Empirical Study on State Owned Commercial Banks in Bangladesh. Journal of Advances in Economics and Finance 4: 123–36. [Google Scholar] [CrossRef]
  8. Antunes, Jorge, Abdollah Hadi-Vencheh, Ali Jamshidi, Yong Tan, and Peter Wankeet. 2022. Bank efficiency estimation in China: DEA-RENNA approach. Annals of Operations Research 315: 1373–98. [Google Scholar] [CrossRef]
  9. Ashraf, Badar Nadeem, Sidra Arshad, and Liang Yan. 2018. Do Better Political Institutions Help in Reducing Political Pressure on State-Owned Banks? Evidence from Developing Countries. Journal of Risk and Financial Management 11: 43. [Google Scholar] [CrossRef]
  10. Aswini, Kumar Mishra, N. Gadhia Jigar, Prasad Kar Bibhu, Patra Biswabas, and Anand Shivi. 2013. Are Private Sector Banks More Sound and Efficient than Public Sector Banks? Assessments Based on Camel and Data Envelopment Analysis Approaches. Research Journal of Recent Sciences 2: 28–35. [Google Scholar]
  11. Aysan, Ahmet Faruk, and Sanli Pinar Ceyhan. 2010. Efficiency of banking in Turkey before and after the crises. Banks and Bank Systems 5: 179–98. [Google Scholar]
  12. Banna, Hasanul, Syed Karim Bux Shah, Abu Hanifa Md Noman, Rubi Ahmad, and Muhammad Mehedi Masud. 2019. Determinants of Sino-ASEAN Banking Efficiency: How Do Countries Differ? Economies 7: 13. [Google Scholar] [CrossRef]
  13. Barako, Dulacha G., and Gregory Tower. 2007. Corporate governance and bank performance: Does ownership matter? Evidence from the Kenyan banking sector. Corporate Ownership & Control 4: 133–44. [Google Scholar] [CrossRef]
  14. Bazilyuk, Antonina, Nataliya Boiko, Iryna Karlova, and Nataliya Tesliuk. 2020. The presence of the state in the banking market of Ukraine. Ekonomika ta Derzhava 9: 12–16. [Google Scholar] [CrossRef]
  15. Berger, Allen N., George R. G. Clarke, Robert Cull, Leora Klapper, and Gregory F. Udell. 2005. Corporate governance and bank performance: A joint analysis of the static, selection, and dynamic effects of domestic, foreign, and state-ownership, World Bank, Working Paper. Journal of Banking & Finance 29: 2179–2221. [Google Scholar] [CrossRef]
  16. Berger, Allen N., Iftekhar Hasan, and Mingming Zhou. 2009. Bank ownership and efficiency in China: What will happen in the world’s largest nation? Journal of Banking & Finance 33: 113–30. [Google Scholar] [CrossRef]
  17. Boiko, Svitlana V., Valentyna V. Hoshovska, and Viktoriia V. Masalitina. 2020. Debt Burden on the State Budget: Long-Term Trends and Expenditure Structure Asymmetries. The Problems of Economy 1: 241–9. [Google Scholar] [CrossRef]
  18. Boiko, Svitlana, and Yaroslava Diachuk. 2020. The Position of State-owned Banks in the Banking System of Ukraine: The Aspect of the Rate of Return. Scientific Works of NUFT 26: 93–101. [Google Scholar] [CrossRef]
  19. Bortnikov, Gennady. 2019. Comparative Analysis of Business Models of Public Banks in Ukraine. Finances of Ukraine 1: 80–101. [Google Scholar] [CrossRef]
  20. Boubakri, Narjess, Jean-Claude Cosset, and Omrane Guedhami. 2008. Privatisation in developing countries: Performance and Ownership Effects. Development Policy Review 26: 275–308. [Google Scholar] [CrossRef]
  21. Caprio, Gerard, Jonathan L. Fiechter, Robert E. Litan, and Michael Pomerleano. 2004. The Future of State-Owned Financial Institutions. Edited by Fiechter Caprio and Pomerleano Litan. Washington, DC: Brookings Institution Press. [Google Scholar]
  22. Cornett, Marcia Millon, Lin Guo, Shahriar Khasjsari, and Hassan Tehranian. 2010. The Impact of State Ownership on Performances differences in privately-owned versus state-owned banks: An international comparison. Journal of Financial Intermediation 19: 74–94. [Google Scholar] [CrossRef]
  23. Davydenko, Nadiia, Yuliya Lutsyk, Alina Buriak, and Liudmyla Vovk. 2023. Informational and Analytical Systems for Forecasting the Indicators of Financial Security of the Banking System of Ukraine. Journal of Information Technology Management 15: 1–13. [Google Scholar] [CrossRef]
  24. Dinberu, Yidersal Dagnaw, and Man Wang. 2017. Ownership and Profitability: Evidence from Ethiopian Banking Sector. International Journal of Scientific and Research Publications 7: 271–7. [Google Scholar]
  25. Dinç, I. Serdar. 2005. Politicians and banks: Political influences on government-owned banks in emerging markets. Journal of Financial Economics 77: 453–79. [Google Scholar] [CrossRef]
  26. Drobiazko, Anatolii, and Oleksandr Lyubich. 2019. Strengthening the Role of Banks with State Participation in Capital in the Development of Ukraine’s Real Economy Sector. Finances of Ukraine 2: 43–57. [Google Scholar] [CrossRef]
  27. Drobiazko, Anatolii, and Serhii Bespalyi. 2018. The Role of Banks with State Capital in the Development of the Real Sector of Economy of Ukraine. Finances of Ukraine 11: 76–105. [Google Scholar]
  28. Drobiazko, Anatolii, Oleksandr Lyubich, and Andriy Svistun. 2019. Analysis of the Effectiveness of Investments in Banks with State Participation in Capital in 2018. Finances of Ukraine 4: 32–51. [Google Scholar] [CrossRef]
  29. Drobiazko, Anatolii, Oleksandr Lyubich, and Dmytro Oliinyk. 2022. Optimization of Business Models of State Banks in the Conditions of Strengthening Requirements for Financial Security in 2022. Finances of Ukraine 1: 74–89. [Google Scholar] [CrossRef]
  30. García-Herrero, Alicia, Sergio Gavilá, and Daniel Santabárbara. 2009. What Explains the Low Profitability of Chinese Banks. Journal of Banking & Finance 33: 2080–92. [Google Scholar] [CrossRef]
  31. Gupta, Ashish, and Suja Sundram. 2015. Comparative Study of Public and Private Sector Banks in India: An Empirical Analysis. International Journal of Applied Research 1: 895–901. [Google Scholar]
  32. Guryanova, Lidiya, Sergienko Olena, Vitalii Gvozdytskyi, and Olena Bolotova. 2020. Long-term financial sustainability: An evaluation methodology with threats consideration. Rivista di Studi sulla Sostenibilita 1: 47–69. [Google Scholar] [CrossRef]
  33. Haider, Junaid, Muhammad Yasir, Suhaib Aamir, Faisal Shahzad, and Muhammad Javed. 2013. Ownership & Performance: An Analysis of Pakistani Banking Sector. Interdisciplinary Journal of Contemporary Research in Business 5: 301–18. [Google Scholar]
  34. Haris, Muhammad, HongXing Yao, Gulzara Tariq, Ali Malik, and Hafiz Mustansar Javaid. 2019. Intellectual Capital Performance and Profitability of Banks: Evidence from Pakistan. Journal of Risk and Financial Management 12: 56. [Google Scholar] [CrossRef]
  35. Hathaway, Terri. 2012. Electrifying Africa: Turning a continental challenge into a people’s opportunity. In Alternatives to Privatization: Public Options for Essential Services in the Global South. Edited by David A. McDonald and Greg Ruiters. London: Routledge, pp. 353–87. [Google Scholar]
  36. Hladkykh, Dmytro. 2015. Strategic targets of reformation of the policy of state-owned banks management. Bulletin of the National Bank of Ukraine 5: 12–17. [Google Scholar]
  37. Iannotta, Giuliano, Giacomo Nocera, and Andrea Sironi. 2013. The impact of government ownership on bank risk. Journal of Financial Intermediation 22: 152–78. [Google Scholar] [CrossRef]
  38. Kamarudin, Fakarudin, Fadzlan Sufian, and Nassir Md Annuar. 2016. Global financial crisis, ownership and bank profit efficiency in the Bangladesh’s state owned and private commercial banks. Contaduría y Administración, Accounting and Management 61: 705–45. [Google Scholar] [CrossRef]
  39. Kaminskyi, Andrii, and Nataliia Versa. 2018. Risk management of dollarization in banking: Case of post-soviet countries. Montenegrin Journal of Economics 14: 21–40. [Google Scholar] [CrossRef]
  40. Karim, Mohd Zaini Abd. 2003. Ownership and Efficiency in Malaysian Banking. The Philippine. Review of Economics 40: 91–101. [Google Scholar]
  41. Kasych, Alla, Oleksandr Pidkuiko, and Iryna Korotenkova. 2020. The Role of State Banks in Development National Economy. Investments: Practice and Experience 4: 35–40. [Google Scholar] [CrossRef]
  42. Khatib, Saleh F. A., Ernie Hendrawaty, Ayman Hassan Bazhair, Ibraheem A. Abu Rahma, and Hamzeh Al Amosh. 2022. Financial Inclusion and the Performance of Banking Sector inPalestine. Economies 10: 247. [Google Scholar] [CrossRef]
  43. Kostohryz, Viktoriia H., and Myroslava E. Khutorna. 2018. State banks in the system of ensuring financial stability of the banking sector of Ukraine. Scientific Bulletin of Uzhhorod University 1: 335–41. [Google Scholar] [CrossRef]
  44. La Porta, Rafael, Florencio Lopez-de-Silanes, and Andrei Shleifer. 2002. Government Ownership of Banks. Journal of Finance 57: 265–301. [Google Scholar] [CrossRef]
  45. Lapavitsas, Costas. 2010. Systemic Failure of Private Banking: A Case for Public Banks, 21st Century Keynesian Economics. Edited by Philip Arestis and Malcolm Sawyer. Basingstoke: Palgrave Macmillan. [Google Scholar]
  46. Lee, Chee Loong, Riayati Ahmad, Wing Shing Lee, Norlin Khalid, and Zulkefly Abdul Karim. 2022. The Financial Sustainability of State-Owned Enterprises in an Emerging Economy. Economies 10: 233. [Google Scholar] [CrossRef]
  47. Londar, Lidia. 2017. Bank Accounting in the Conditions of the Development of the State Debt of Ukraine. Strategic Priorities 4: 74–81. [Google Scholar]
  48. Marois, Thomas. 2016. State-Owned Banks and Development: Dispelling Mainstream Myths. In Handbook of Research on Comparative Economic Development Perspectives on Europe and the MENA Region. Edited by M. Mustafa Erdoğdu and Bryan Christiansen. Hershey: IGI Global, chr. 4. [Google Scholar] [CrossRef]
  49. Mercan, Muhammet, Arnold Reisman, Reha Yolalan, and Ahmet Burak Emel. 2003. The effect of scale and mode of ownership on the financial performance of the Turkish banking sector: Results of a DEA-based analysis. Socio-Economic Planning Sciences 37: 185–202. [Google Scholar] [CrossRef]
  50. Micco, Alejandro, Ugo Panizza, and Monica Yanez. 2007. Bank ownership and performance. Does politics matter? Journal of Banking & Finance 31: 219–241. [Google Scholar] [CrossRef]
  51. Ministry of Finance of Ukraine. 2020. Principles of Strategic Reform of the State Banking Sector (Strategic Principles). Available online: https://www.mof.gov.ua/storage/files/20200814%20SOB%20Strategy.pdf (accessed on 20 May 2023).
  52. Ministry of Finance of Ukraine. 2022. Statistical Yearbook “Budget of Ukraine”. Available online: https://www.mof.gov.ua/uk/statistichnij-zbirnik (accessed on 20 September 2022).
  53. Nia, Nahid Maleki, Hosein Asgari Alouj, Ayyoub Sarafraz Pireivatlou, and Azam Ghezelbash. 2012. A Comparative Profitability Efficiency Study of Private and Government Banking System in Iran Applying Data Envelopment Analysis (DEA). Journal of Basic and Applied Scientific Research 2: 11603–14. [Google Scholar]
  54. Ohorodnyk, Vira. 2018a. Assessment of the State-Owned Banks Socio-Economic Efficiency under the Condition of Internal Transformations. Scientific Bulletin of the Uzhhorod National University 22: 18–22. [Google Scholar]
  55. Ohorodnyk, Vira. 2018b. The State-Owned Banks Specific Features in Ukraine. State and Regions Series: Economy and Entrepreneurship 6: 91–97. [Google Scholar]
  56. Ohorodnyk, Vira. 2018c. Ukrainian State-Owned Banks Strategies Transformation. Economic Bulletin of the Zaporizhzhya State Engineering Academy 5: 192–6. [Google Scholar]
  57. Ohorodnyk, Vira, and Nataliia Kozmuk. 2018. Theoretical approaches to defining the notion of the state-owned bank socio-economic efficiency. The Black Sea Economic Studies 34: 158–62. [Google Scholar]
  58. Omran, Mohammed. 2007. Privatization, State Ownership and Bank Performance in Egypt. World Development 35: 714–33. [Google Scholar] [CrossRef]
  59. Otchere, Isaac. 2005. Do privatized banks in middle- and low-income countries perform better than rival banks? An intra-industry analysis of bank privatization. The Journal of Banking and Finance 29: 2067–93. [Google Scholar] [CrossRef]
  60. Ozili, Peterson Kitakogelu, and Olayinka Uadiale. 2017. Ownership Concentration and Bank Profitability. Future Business Journal 3: 159–71. [Google Scholar] [CrossRef]
  61. Prawira, Renno, and Sudarso Kaderi Wiryono. 2020. Determinants of non-performing loans in state-owned banks. Jurnal Akuntansi dan Auditing Indonesia 24: 159–166. [Google Scholar] [CrossRef]
  62. Privatbank. 2023. Cash-Loan. Available online: https://privatbank.ua/kredity/cash-loan (accessed on 18 May 2023).
  63. Rahman, Nora Azureen Abdul, and Anis Farida Md Rejab. 2015. Ownership Structure and Bank Performance. Journal of Economics, Business and Management 3: 483–88. [Google Scholar] [CrossRef]
  64. Rao, K. Rama Mohana, and Tekeste Berhanu Lakew. 2012. Cost Efficiency and Ownership Structure of Commercial Banks in Ethiopia: An Application of Nonparametric Approach. European Journal of Business and Management 4: 36–47. [Google Scholar]
  65. Rodionova, Tatyana, and Artem Piatkov. 2020. Analysis of the Efficiency of State, Private and Foreign Banks of Ukraine. International Relations. Economics. Country Studies. Tourism 12: 171–82. [Google Scholar]
  66. Sathye, Milind. 2005. Privatization, Performance, and Efficiency: A Study of Indian Banks. Vikalpa 30: 7–16. [Google Scholar] [CrossRef]
  67. Skrypnyk, Andriy, and Maryna Nehrey. 2015. The formation of the deposit portfolio in macroeconomic instability. Paper presented at ICTERI 2015: 11th International Conference on ICT in Education, Research, and Industrial Applications, Lviv, Ukraine, May 14–16; Available online: http://ceur-ws.org/Vol-1356/paper_103.pdf (accessed on 5 June 2023).
  68. Smovzhenko, Tamara S., Ihor O. Lyutyy, and Oksana B. Denys. 2019. Corporate governance in the state-owned banks. Financial and Credit Activity Problems of Theory and Practice 2: 73–79. [Google Scholar] [CrossRef]
  69. Sukhdev, Singh, Sidhu Jasvinder, Joshi Mahesh, and Monika Kansal. 2016. Measuring intellectual capital performance of Indian banks. Managerial Finance 42: 635–55. [Google Scholar] [CrossRef]
  70. Sus, Lecia V., and Maryna Onychuk. 2019. Functioning of State Participating Banks at the Market of Bank Services of Ukraine. Scientific Horizons 4: 67–76. [Google Scholar] [CrossRef]
  71. Svistun, Andriy. 2020. Methodological Approach to Evaluation of Efficiency of State Development Banks. Taurida Scientific Bulletin. Series: Economy 3: 130–46. [Google Scholar] [CrossRef]
  72. Tekatel, Wesen Legessa, and Beyene Yosef Nurebo. 2019. Comparing Financial Performance of State Owned Commercial Bank with Privately Owned Commercial Banks in Ethiopia. European Journal of Business Science and Technology 5: 200–17. [Google Scholar] [CrossRef]
  73. The National Bank of Ukraine. 2023. Key Performance Indicators of the Ukrainian Banks. Available online: https://bank.gov.ua/en/statistic/supervision-statist (accessed on 18 May 2023).
  74. Trygub, Olha. 2015. Evolution of State-Owned Banks’ System in Ukraine. Theoretical and Applied Issues of Economics 1: 404–15. [Google Scholar]
  75. Ullah, Mohammad Hedayet, and Masudur Rahman. 2022. Financial Performance Comparison between State-Owned Commercial Banks and Islamic Banks in Bangladesh. Journal of International Business and Management 5: 1–14. [Google Scholar] [CrossRef]
  76. Unal, Seyfettin, Rafet Aktaş, and Sezgin Acikalin. 2007. A Comparative Profitability and Operating Efficiency Analysis of State and Private Banks in Turkey. Banks and Bank Systems 2: 135–41. [Google Scholar]
  77. Velykoivanenko, Halyna, and Vladyslav Korchynskyi. 2022. Application of Clustering in the Dimensionality Reduction Algorithms for Separation of Financial Status of Commercial Banks in Ukraine. Universal Journal of Accounting and Finance 10: 148–60. [Google Scholar] [CrossRef]
  78. Verkhovna Rada of Ukraine. 2010. Budget Code of Ukraine on 8 July 2010. No. 2456-VI. Available online: https://zakon.rada.gov.ua/laws/show/2456-17?lang=en#Text (accessed on 1 July 2023).
  79. Waleed, Ahmad, Muhammad Bilal Shah, and Muhammad Kashif Mughal. 2015. Comparison of Private and Public Banks Performance. IOSR Journal of Business and Management 17: 32–38. [Google Scholar] [CrossRef]
  80. World Bank. 2012. Global Financial Development Report 2013: Rethinking the Role of State in Finance. Washington, DC: World Bank Role of State in Finance. Washington, DC: World Bank. [Google Scholar]
  81. Yaregal, Bewketu. 2011. Ownership and Organizational Performance: A Comparative Analysis of Private and State Owned Banks. Master’s thesis, Addis Ababa University, Addis Ababa, Serbia. [Google Scholar]
  82. Yashchuk, Khrystyna, and Liudmyla Kuznetsova. 2018. Influence of State Banks on the Economy of Ukraine. Scientific Bulletin of Kherson State University 30: 117–20. [Google Scholar]
  83. Yeyati, Levy Eduardo, Alejandro Micco, and Ugo Panizza. 2004. Should the Government Be in the Banking Business? The Role of State-Owned and Development Banks. Working Paper, No. 517. Washington, DC: Inter-American Development Bank, Research Department. [Google Scholar]
  84. Yeyati, Levy Eduardo, Alejandro Micco, and Ugo Panizza. 2007. A reappraisal of state-owned banks. Economia 7: 209–47. [Google Scholar] [CrossRef]
  85. Yüksel, Serhat, Shahriyar Mukhtarov, Elvin Mammadov, and Mustafa Özsarı. 2018. Determinants of Profitability in the Banking Sector: An Analysis of Post-Soviet Countries. Economies 6: 41. [Google Scholar] [CrossRef]
  86. Zarutska, Olena. 2015. Method of structural and functional analysis of the banking system in conditions of market reduction. Neuro-Fuzzy Modeling Techniques in Economics 4: 18–43. [Google Scholar] [CrossRef]
  87. Zhang, Xiaotian Tina, and Yong Wang. 2014. Production efficiency of Chinese banks: A revisit. Managerial Finance 10: 969–86. [Google Scholar] [CrossRef]
  88. Zomchak, Larysa, and Anastasia Lapinkova. 2022. Key Interest Rate as a Central Banks Tool of the Monetary Policy Influence on Inflation: The Case of Ukraine. In Lecture Notes on Data Engineering and Communications Technologies. Cham: Springer, vol. 158, pp. 369–79. [Google Scholar] [CrossRef]
Figure 1. Scheme of cash flows between Ukrainian state-owned banks and public funds. Source: Based on the authors’ research.
Economies 11 00229 g001
Figure 2. ROAsb and ROAcb. Source: Authors’ own calculations based on the panel data set of the National Bank of Ukraine, state-owned banks.
Economies 11 00229 g002
Figure 3. ROEsb and ROEcb. Source: Authors’ own calculations based on the panel data set of the National Bank of Ukraine, state-owned banks.
Economies 11 00229 g003
Figure 4. Cumulative cash flows of state-owned banks and public funds, USD million. Source: Authors’ own elaborations from the panel data set of National Bank of Ukraine, state-owned banks.
Economies 11 00229 g004
Figure 5. Issue of domestic government bonds to increase the formation of banks’ authorised capital. Source: Authors’ own elaborations from the panel data set of Ministry of Finance of Ukraine.
Economies 11 00229 g005
Table 1. Key indicators of the banking system of Ukraine.
Number of Commercial BanksNumber of State-Owned Commercial BanksTotal Assets of Commercial Banks, USD MillionTotal Assets of Commercial Banks without State-Owned Commercial Banks, USD MillionTotal Assets of State-Owned Commercial Banks, USD MillionPercentage of State-Owned Commercial Banks in Assets, %
20091826110,24491,49318,75217.01
20101766118,32798,28220,04616.94
20111766131,953109,53722,41616.99
20121766141,022115,14725,87518.35
20131808159,902130,70429,19818.26
2014163883,51165,34718,16421.75
2015117752,26637,98414,28227.33
201696646,20322,50223,70151.30
201782648,11321,99126,12254.29
201877549,10822,20826,89954.78
201975563,04528,21334,83255.25
202073564,46930,56433,90552.59
202171575,27040,09535,17546.73
202267472,78235,99036,79250.55
Source: National Bank of Ukraine (The National Bank of Ukraine 2023).
Table 2. Net profit of Ukrainian state-owned banks, USD millions.
20092010201120122013201420152016201720182019202020212022
Oschadbank88.958.066.670.884.9−720.5−561.818.221.06.010.7103.038.719.8
Ukreximbank2.76.511.120.024.8−824.9−646.9−37.429.531.338.8−207.9100.0−211.8
Kyiv Bank−229.2−27.82.10.60.5−62.9
Ukrgasbank−556.91.3−453.6137.7125.4−235.711.911.323.628.350.315.2138.2−119.4
Rodovid Bank−347.2−537.3−175.6−1.3−8.8−22.43.6
Ukrainian Bank for Reconstruction and Development−3.80.20.0−0.80.0−0.90.0−0.1−0.3
State Land Bank −0.40.20.40.1
Settlement Centre 0.10.4−1.30.10.21.30.60.1
Privatbank −899.1470.51261.7901.51284.5933.7
Total−1045.5−499.2−549.4226.9226.6−1866.7−1194.2−8.0−825.1537.41362.0811.91561.4622.3
Source: Authors’ own elaborations from the panel data set of National Bank of Ukraine, state-owned banks.
Table 3. Return on assets (ROA) of state-owned banks in Ukraine, %.
20092010201120122013201420152016201720182019202020212022
Oschadbank1.210.780.730.670.72−7.37−8.010.240.250.080.131.200.430.26
Ukreximbank0.040.080.120.200.22−8.20−9.76−0.620.470.530.67−3.321.37−3.25
Kyiv Bank−40.70−7.860.570.170.19−37.28
Ukrgasbank−34.670.07−22.145.414.52−12.500.850.540.930.951.330.283.10−2.91
Rodovid Bank−20.77−38.34−14.77−0.12−0.79−3.090.93
Ukrainian Bank for Reconstruction and Development−24.961.360.08−4.520.08−9.840.47−2.62−4.55
State Land Bank −1.981.666.781.03
Settlement Centre 0.300.53−7.070.911.647.854.310.590.00
Privatbank −9.764.7511.297.039.246.28
Total−5.71−2.56−2.460.930.82−8.22−7.72−0.05−3.112.014.662.454.521.89
Source: Authors’ own elaborations from the panel data set of National Bank of Ukraine, state-owned banks.
Table 4. Return on equity (ROE) of state-owned banks in Ukraine, %.
20092010201120122013201420152016201720182019202020212022
Oschadbank4.202.783.053.163.64−41.37−72.593.152.080.931.4912.094.873.02
Ukreximbank0.360.440.751.351.66−86.51−283.90−29.368.3415.0117.31−117.1936.46−111.84
Kyiv Bank−95.34−31.672.220.560.54−109.23
Ukrgasbank−302.650.53−153.2635.4722.78−70.726.936.2512.0113.8319.954.5939.15−48.57
Rodovid Bank−91.28−286.74−40.37−0.29−1.92−7.922.43
Ukrainian Bank for Reconstruction and Development−46.642.590.14−7.840.12−14.440.91−5.08−11.59
State Land Bank −2.491.817.381.12
Settlement Centre 0.562.76−14.371.373.0515.265.720.78
Privatbank −103.1346.1774.2348.7566.7848.55
Total−25.62−10.40−10.504.193.95−49.22−82.99−0.82−31.3824.6244.8823.9744.7120.44
Source: Authors’ own elaborations from the panel data set of National Bank of Ukraine, state-owned banks.
Table 5. Fiscal costs for the capitalisation of state-owned banks in Ukraine, USD million.
20092010201120122013201420152016201720182019202020212022
Contributions to the share capital
Oschadbank 166 167208 194550
Ukreximbank89180534 15421365290 254
Kyiv Bank429
Ukrgasbank398239540 176
Rodovid Bank1023 496
Ukrainian Bank for Reconstruction and Development 3 3
State Land Bank
Settlement Centre 2
Privatbank 5842
Total274110481204716722359755966830025400
Other contributions to equity (additional equity capital)
Oschadbank 175858
Ukreximbank 421
Total0000175127900000000
Source: Authors’ own elaborations from the panel data set of National Bank of Ukraine, state-owned banks.
Table 6. Dividends and taxes paid by state-owned banks of Ukraine, USD million.
20092010201120122013201420152016201720182019202020212022
Dividends of state-owned banks
Oschadbank 2617192518 562331
Ukreximbank 12368 22301 42
Kyiv Bank
Ukrgasbank
Rodovid Bank
Ukrainian Bank for Reconstruction and Development
State Land Bank
Settlement Centre
Privatbank 1449912717873
Total0271922312600529480915748916
Corporate income tax paid by state-owned banks
Oschadbank353540927 5
Ukreximbank 1331428145 8
Kyiv Bank12 11
Ukrgasbank 1 61597
Rodovid Bank 1 1
Ukrainian Bank for Reconstruction and Development
State Land Bank
Settlement Centre
Privatbank 182164123156
Total4735401160254811087171139261
Source: Authors’ own elaborations from the panel data set of National Bank of Ukraine, state-owned banks.
Disclaimer/Publisher’s Note: The statements, opinions and data contained in all publications are solely those of the individual author(s) and contributor(s) and not of MDPI and/or the editor(s). MDPI and/or the editor(s) disclaim responsibility for any injury to people or property resulting from any ideas, methods, instructions or products referred to in the content.

