Methodological Approach to Assessment Socio-Economic Development of the Chuvash Republic (Subject of the Russian Federation)
Abstract
1. Introduction
- -
- Prioritization—allows the region to efficiently allocate resources;
- -
- planning and strategy development—helps the region develop comprehensive plans and strategies to achieve socio-economic development;
- -
- monitoring and evaluation—allows the region to track progress in achieving development goals, identify areas of success and failure, and adjust its policies and programs accordingly;
- -
- resource mobilization—helps the region mobilize resources, both domestic and international, for its development projects;
- -
- decision-making—provides decision makers with factual data and analysis to make informed decisions.
2. Materials and Methods
- The level of employment
- Unemployment rate
- Composition of the employed population by level of education
- The ratio of the labor force to the average annual number of employees
- The ratio of the need for workers declared by employers to state employment service institutions to the number of unemployed
- Arrears on wages as a percentage of the monthly wage fund of organizations with arrears
- Arrears of wages per one employee to whom there is an arrears.
- -
- positive impact indicators totaled (100.0% − 95.7%) + (100.0% − 84.9%) = 4.3 p.p. + 15.1 p.p. = 19.4 p.p.;
- -
- negative (100.0% − 99.2%) + (100.0% − 98.8%) = 0.8 p.p. + 1.2 p.p. = 2.0 p.p.
- The number of small enterprises per 10,000 people of the population.
- Turnover of small enterprises per 10,000 people.
- The share of the average number of employees of small enterprises in the total number
- Employed people
- Balanced financial result (profit minus loss) of organizations’ activities per 10,000 people of the employed population.
- Profitability of sold goods, products (works, services) of organizations, expressed as a percentage, for those engaged in crop production.
- Percentage of people engaged in livestock activities.
- The number of enterprises and organizations per 10,000 people.
| Indicator | Year | Average Rate | Final Impact, p.p. * | |||||||||
|---|---|---|---|---|---|---|---|---|---|---|---|---|
| 2011 | 2012 | 2013 | 2014 | 2015 | 2016 | 2017 | 2018 | 2019 | 2020 | |||
| 107.7 | 101.7 | 101 | 100.7 | 100.5 | 104.9 | 98.8 | 101.4 | 101.6 | 99.9 | 101.8 | +11.6 | |
| 89.9 | 73.4 | 56.5 | 163.7 | 99.6 | 130 | 65.4 | 90.3 | 131.7 | 91.8 | 94.4 | +17.4 | |
| 114.7 | 108.6 | 74.6 | 106.2 | 80.2 | 98.5 | 93.7 | 113.7 | 95.4 | 99.2 | 97.6 | +14.2 | |
| 67.8 | 106.1 | 91.5 | 110.1 | 123.2 | 91.5 | 109.2 | 112.9 | 93.9 | 87.8 | 98.2 | +1.6 | |
| 107.8 | 98.6 | 99.6 | 96 | 98.4 | 94.3 | 101.3 | 93.3 | 93 | 110 | 99.1 | −4.4 | |
| 108.1 | 104.6 | 99.3 | 96.7 | 100.8 | 101 | 101.3 | 103 | 115 | 92.2 | 102.0 | +8.5 | |
| 105.1 | 111.2 | 102.3 | 103.2 | 99.3 | 104.7 | 105.9 | 108.3 | 104.2 | 115.5 | 105.9 | +0.4 | |
| 100.2 | 100.6 | 89.3 | 110.9 | 100.3 | 103.6 | 96.5 | 103.3 | 105.0 | 99.5 | 100.8 | +49.3 | |
| Option Forecast | The Equation | Year | 2024 by 2020 | ||||
|---|---|---|---|---|---|---|---|
| 2020 | 2021 | 2022 | 2023 | 2024 | |||
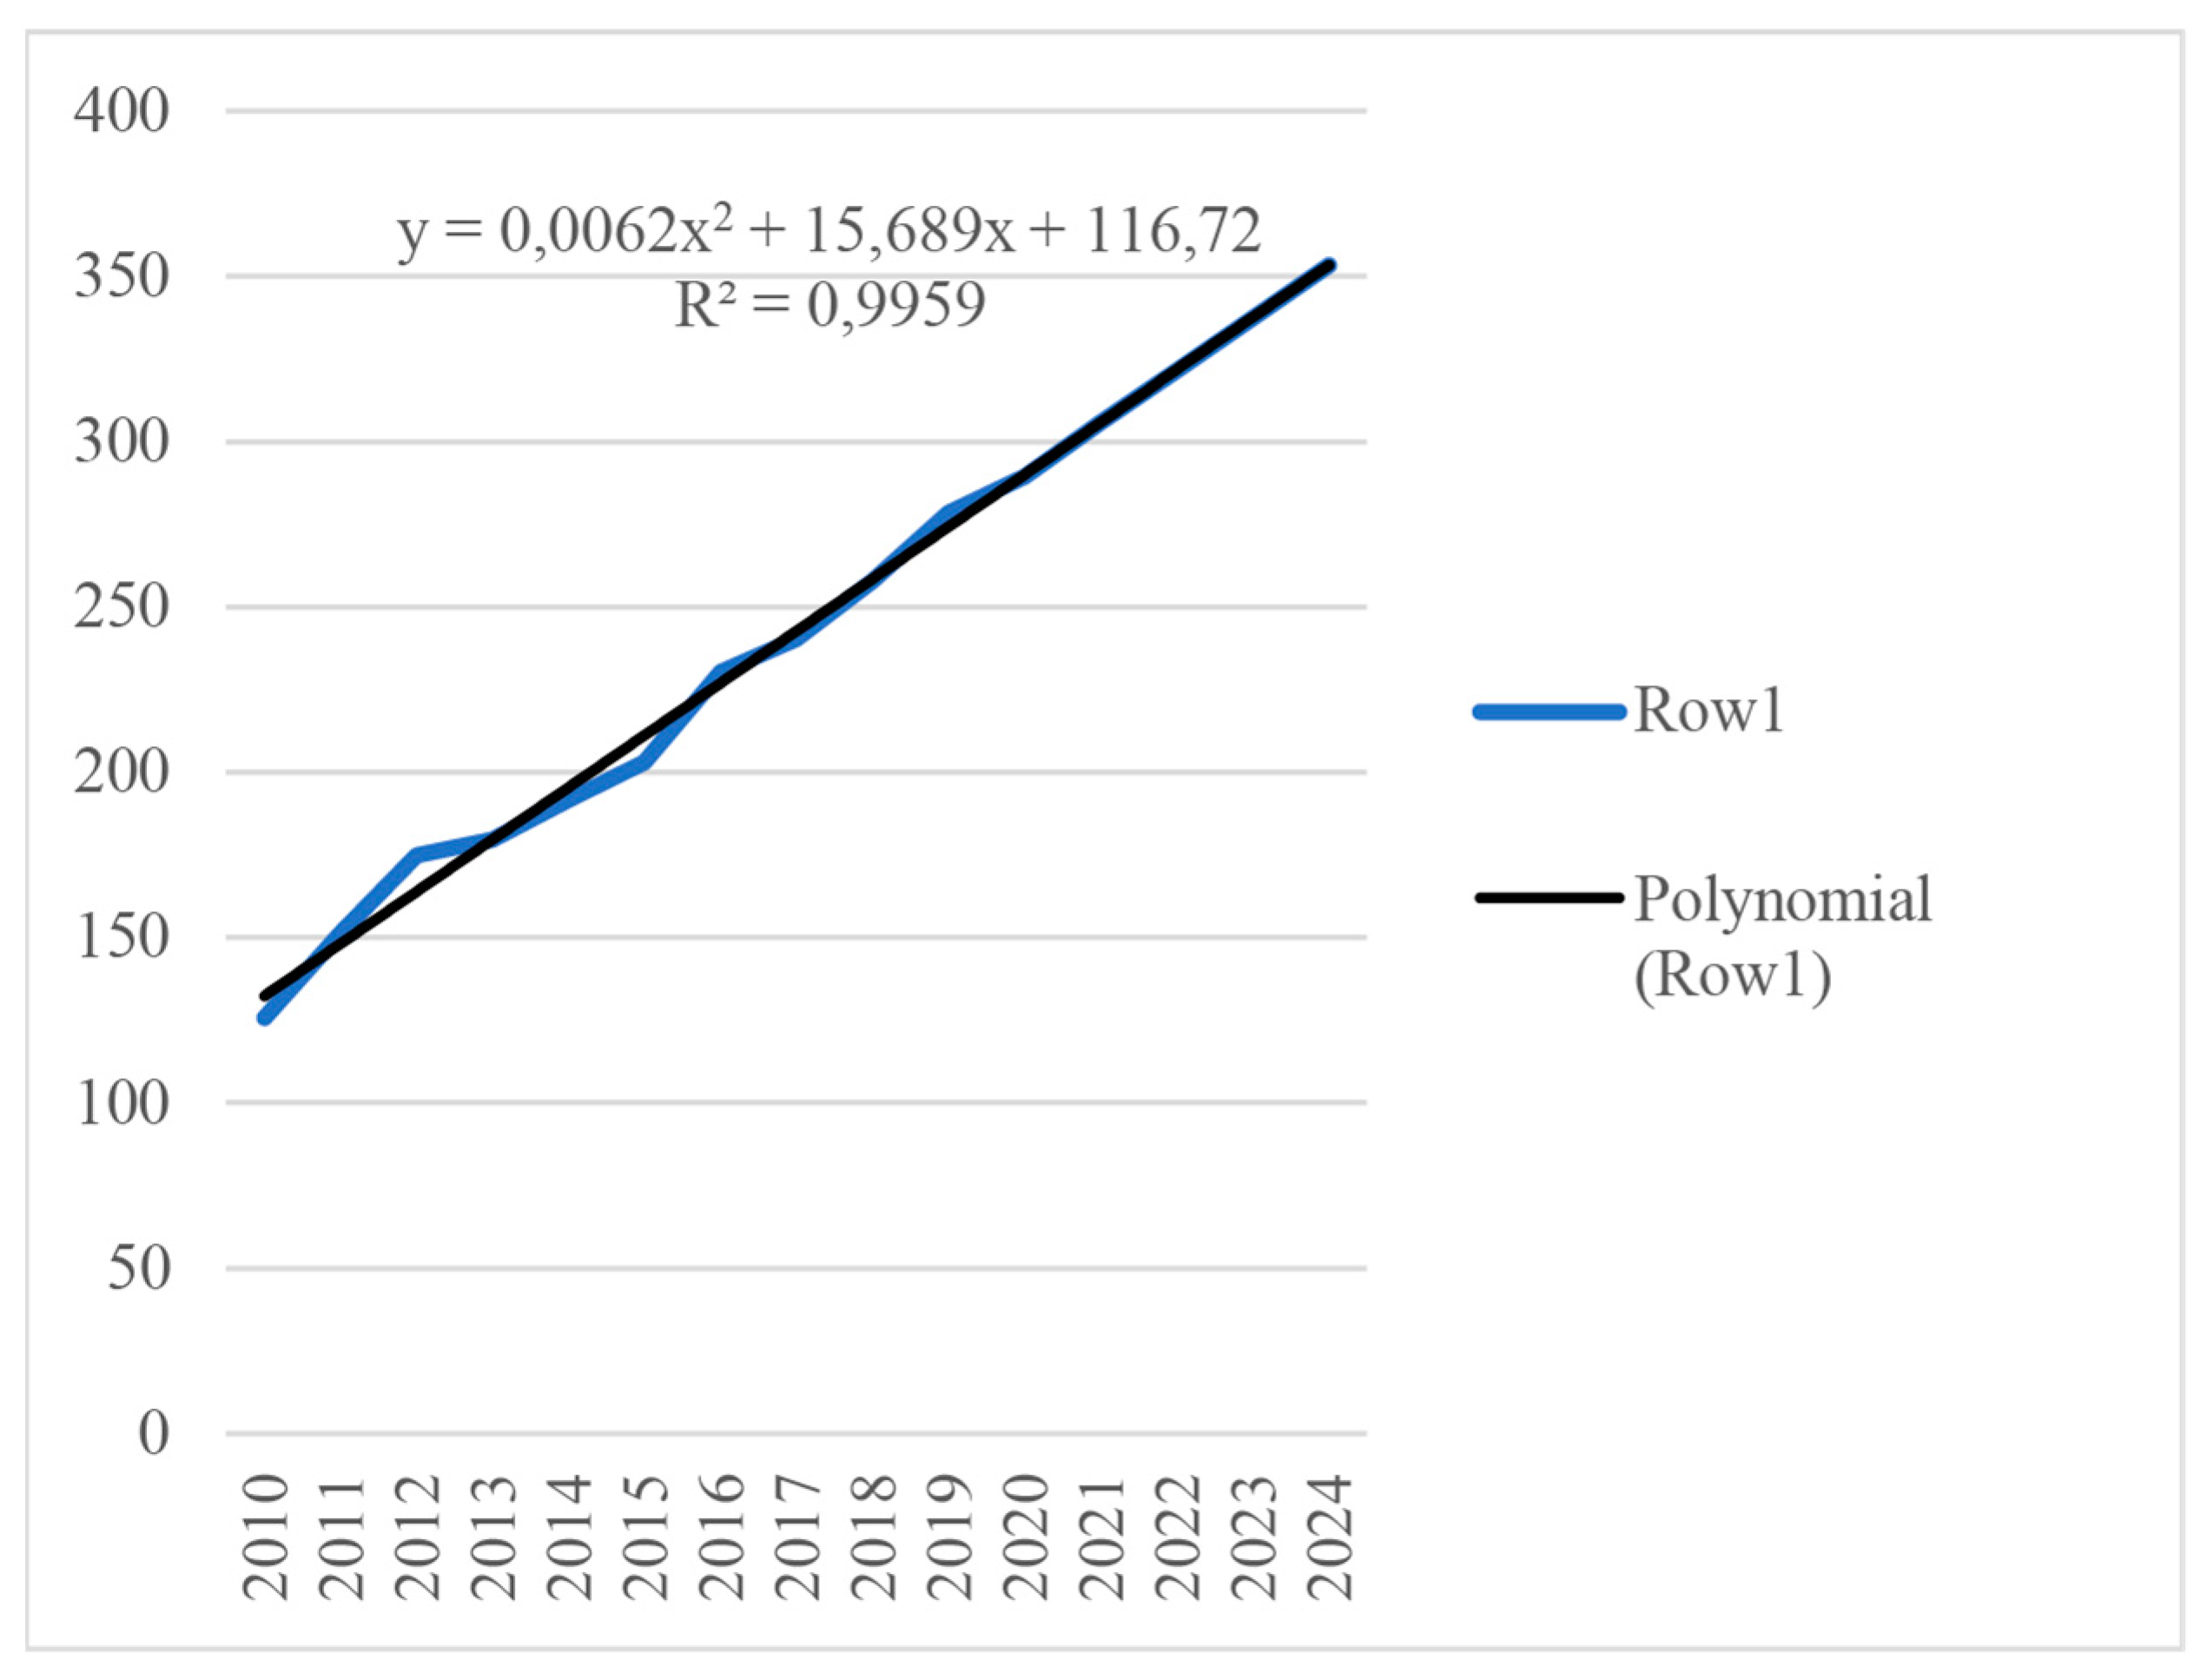
| GRP per capita, thousand rubles—macroeconomic block “Income” | |||||||
| Optimistic | y = 0.2122x2 + 13.693x + 120.08 | 289.5 | 322.3 | 338.4 | 354.0 | 369.8 | 127.7% |
| Probabilistic | y = 0.0062x2 + 15.689x + 116.72 | 305.9 | 321.7 | 337.5 | 353.3 | 122.0% | |
| Pessimistic | y = −0.1941x2 + 17.713x + 113.17 | 294.1 | 307.5 | 319.9 | 338.0 | 116.8% | |
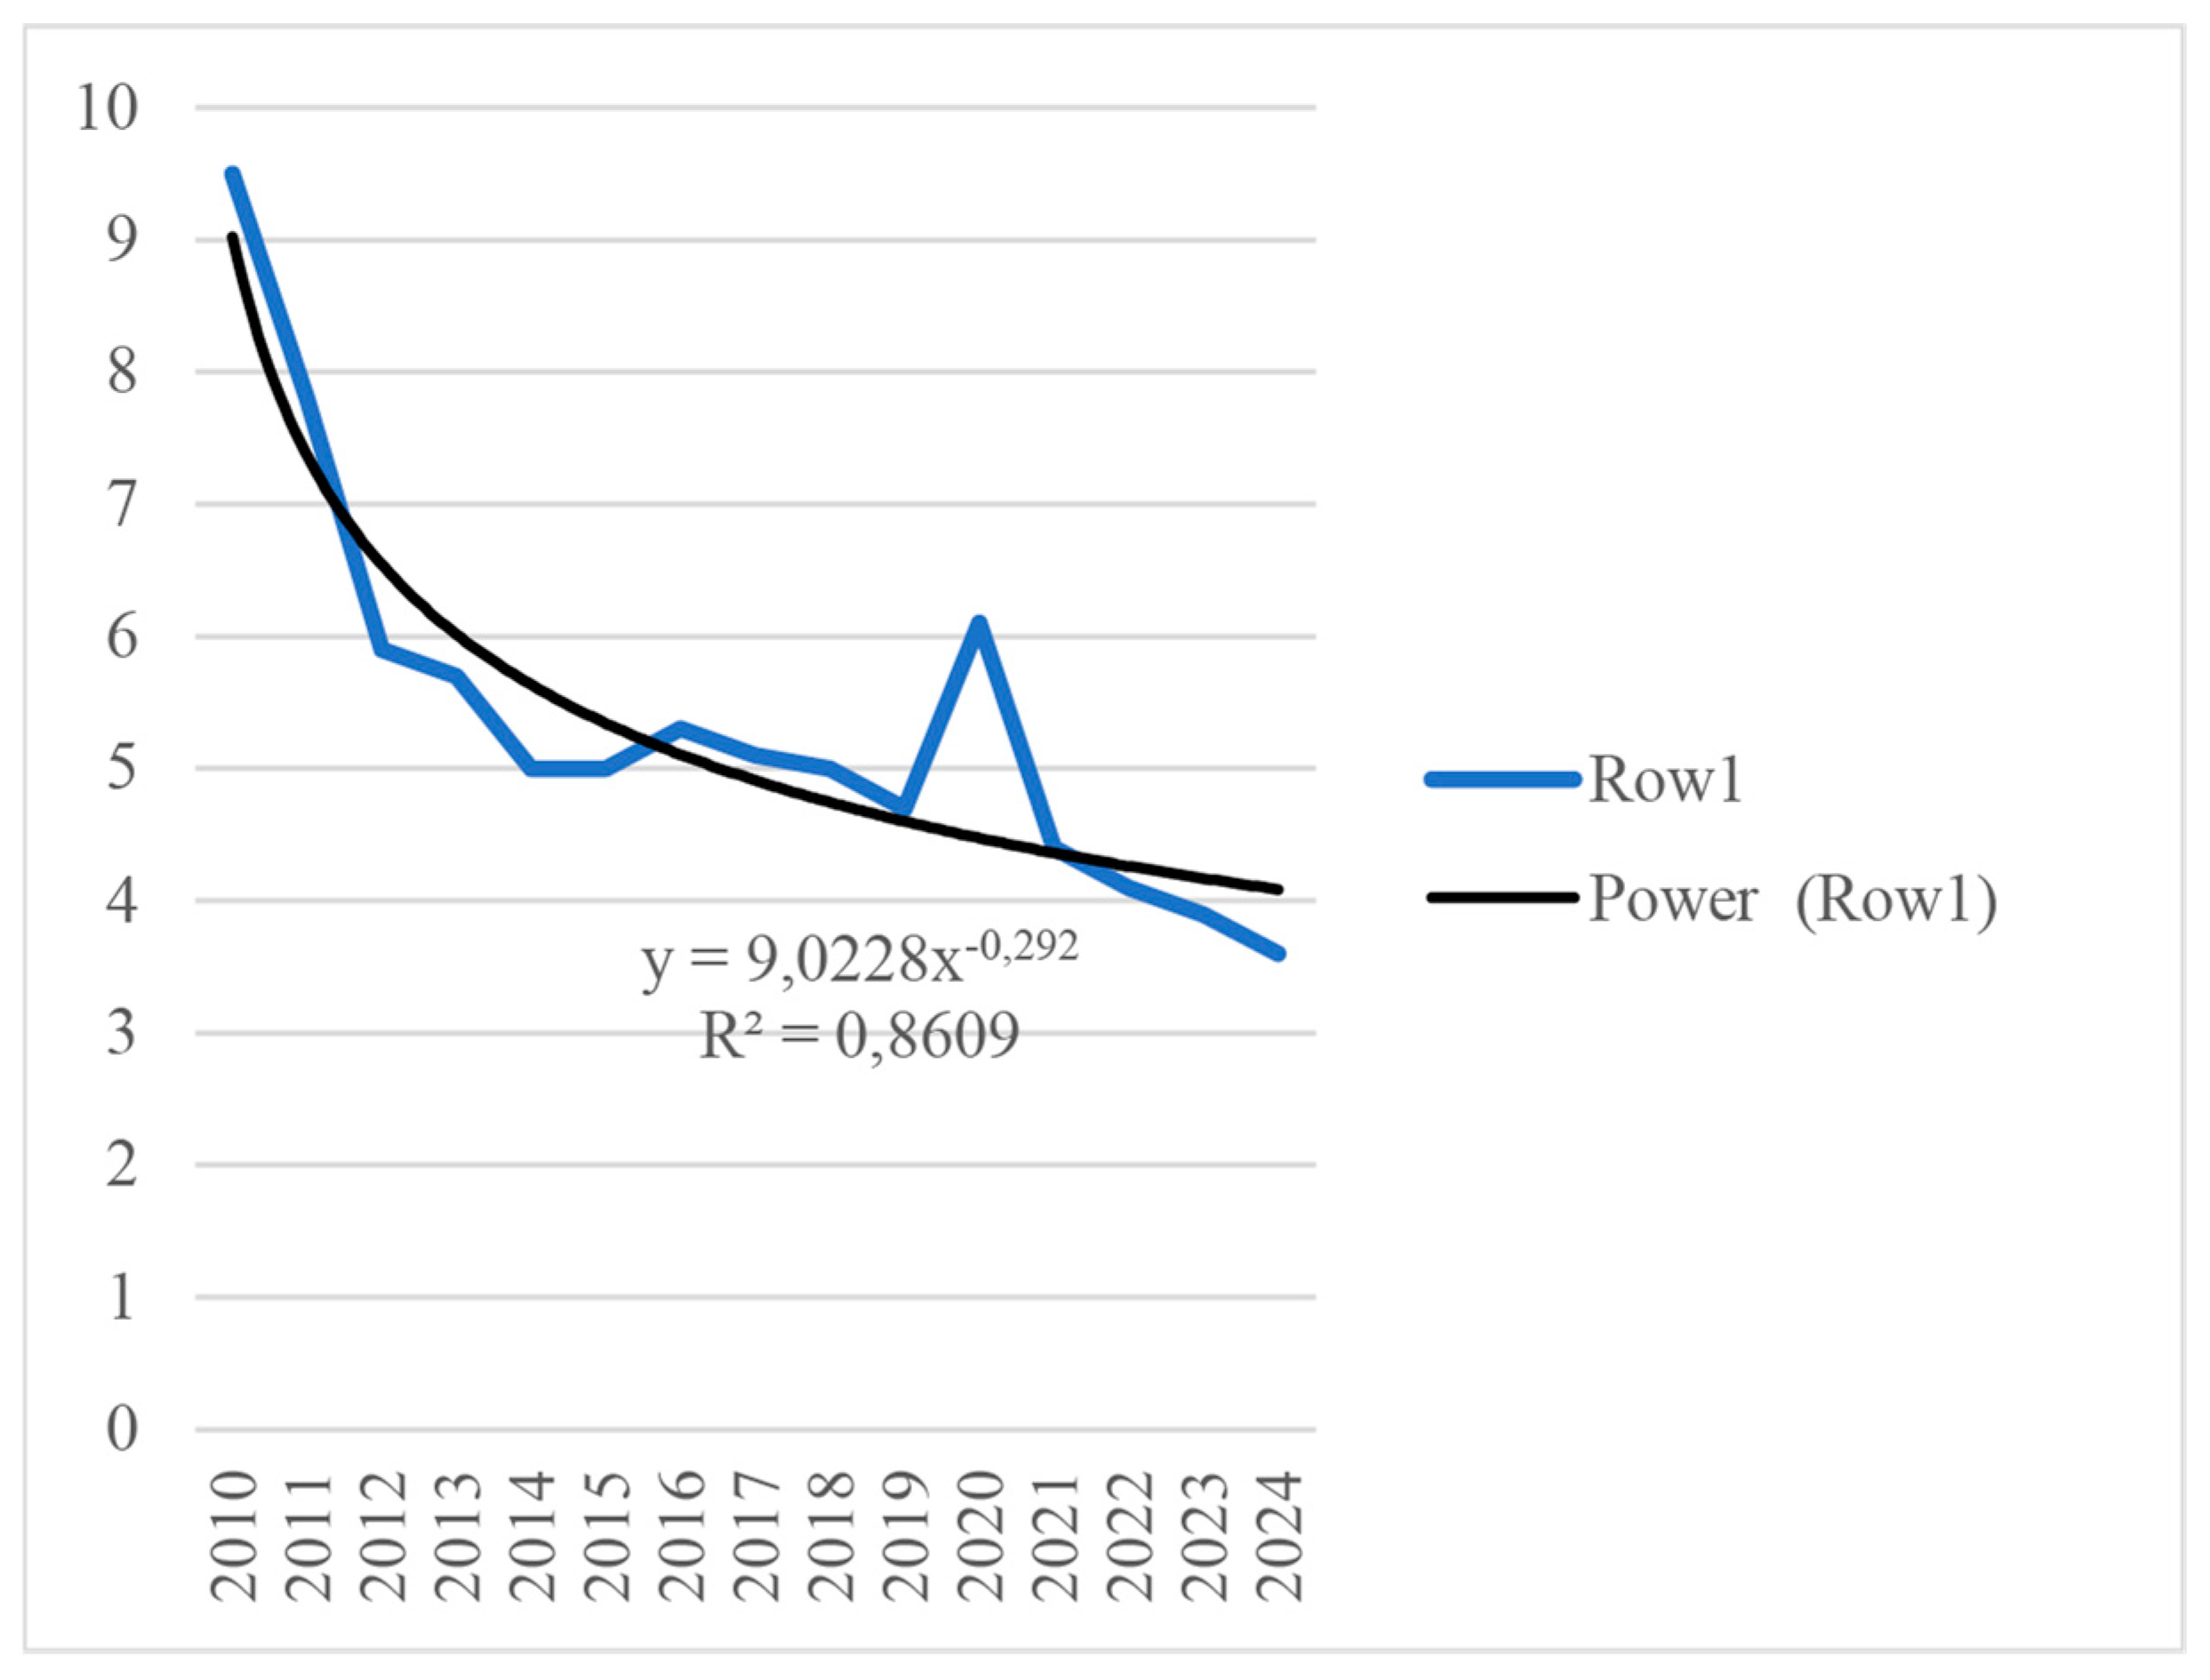
| Unemployment rate, %—macroeconomic block “Labor” | |||||||
| Optimistic | y = 9.0228x−0.292 | 6.1 | 4.4 | 4.1 | 3.9 | 3.6 | −2.5 p.p. |
| Probabilistic | y = 9.3394x−0.324 | 4.1 | 3.8 | 3.5 | 3.2 | −2.9 p.p. | |
| Pessimistic | y = 9.5804x−0.347 | 3.8 | 3.6 | 3.3 | 3.0 | −3.1 p.p. | |
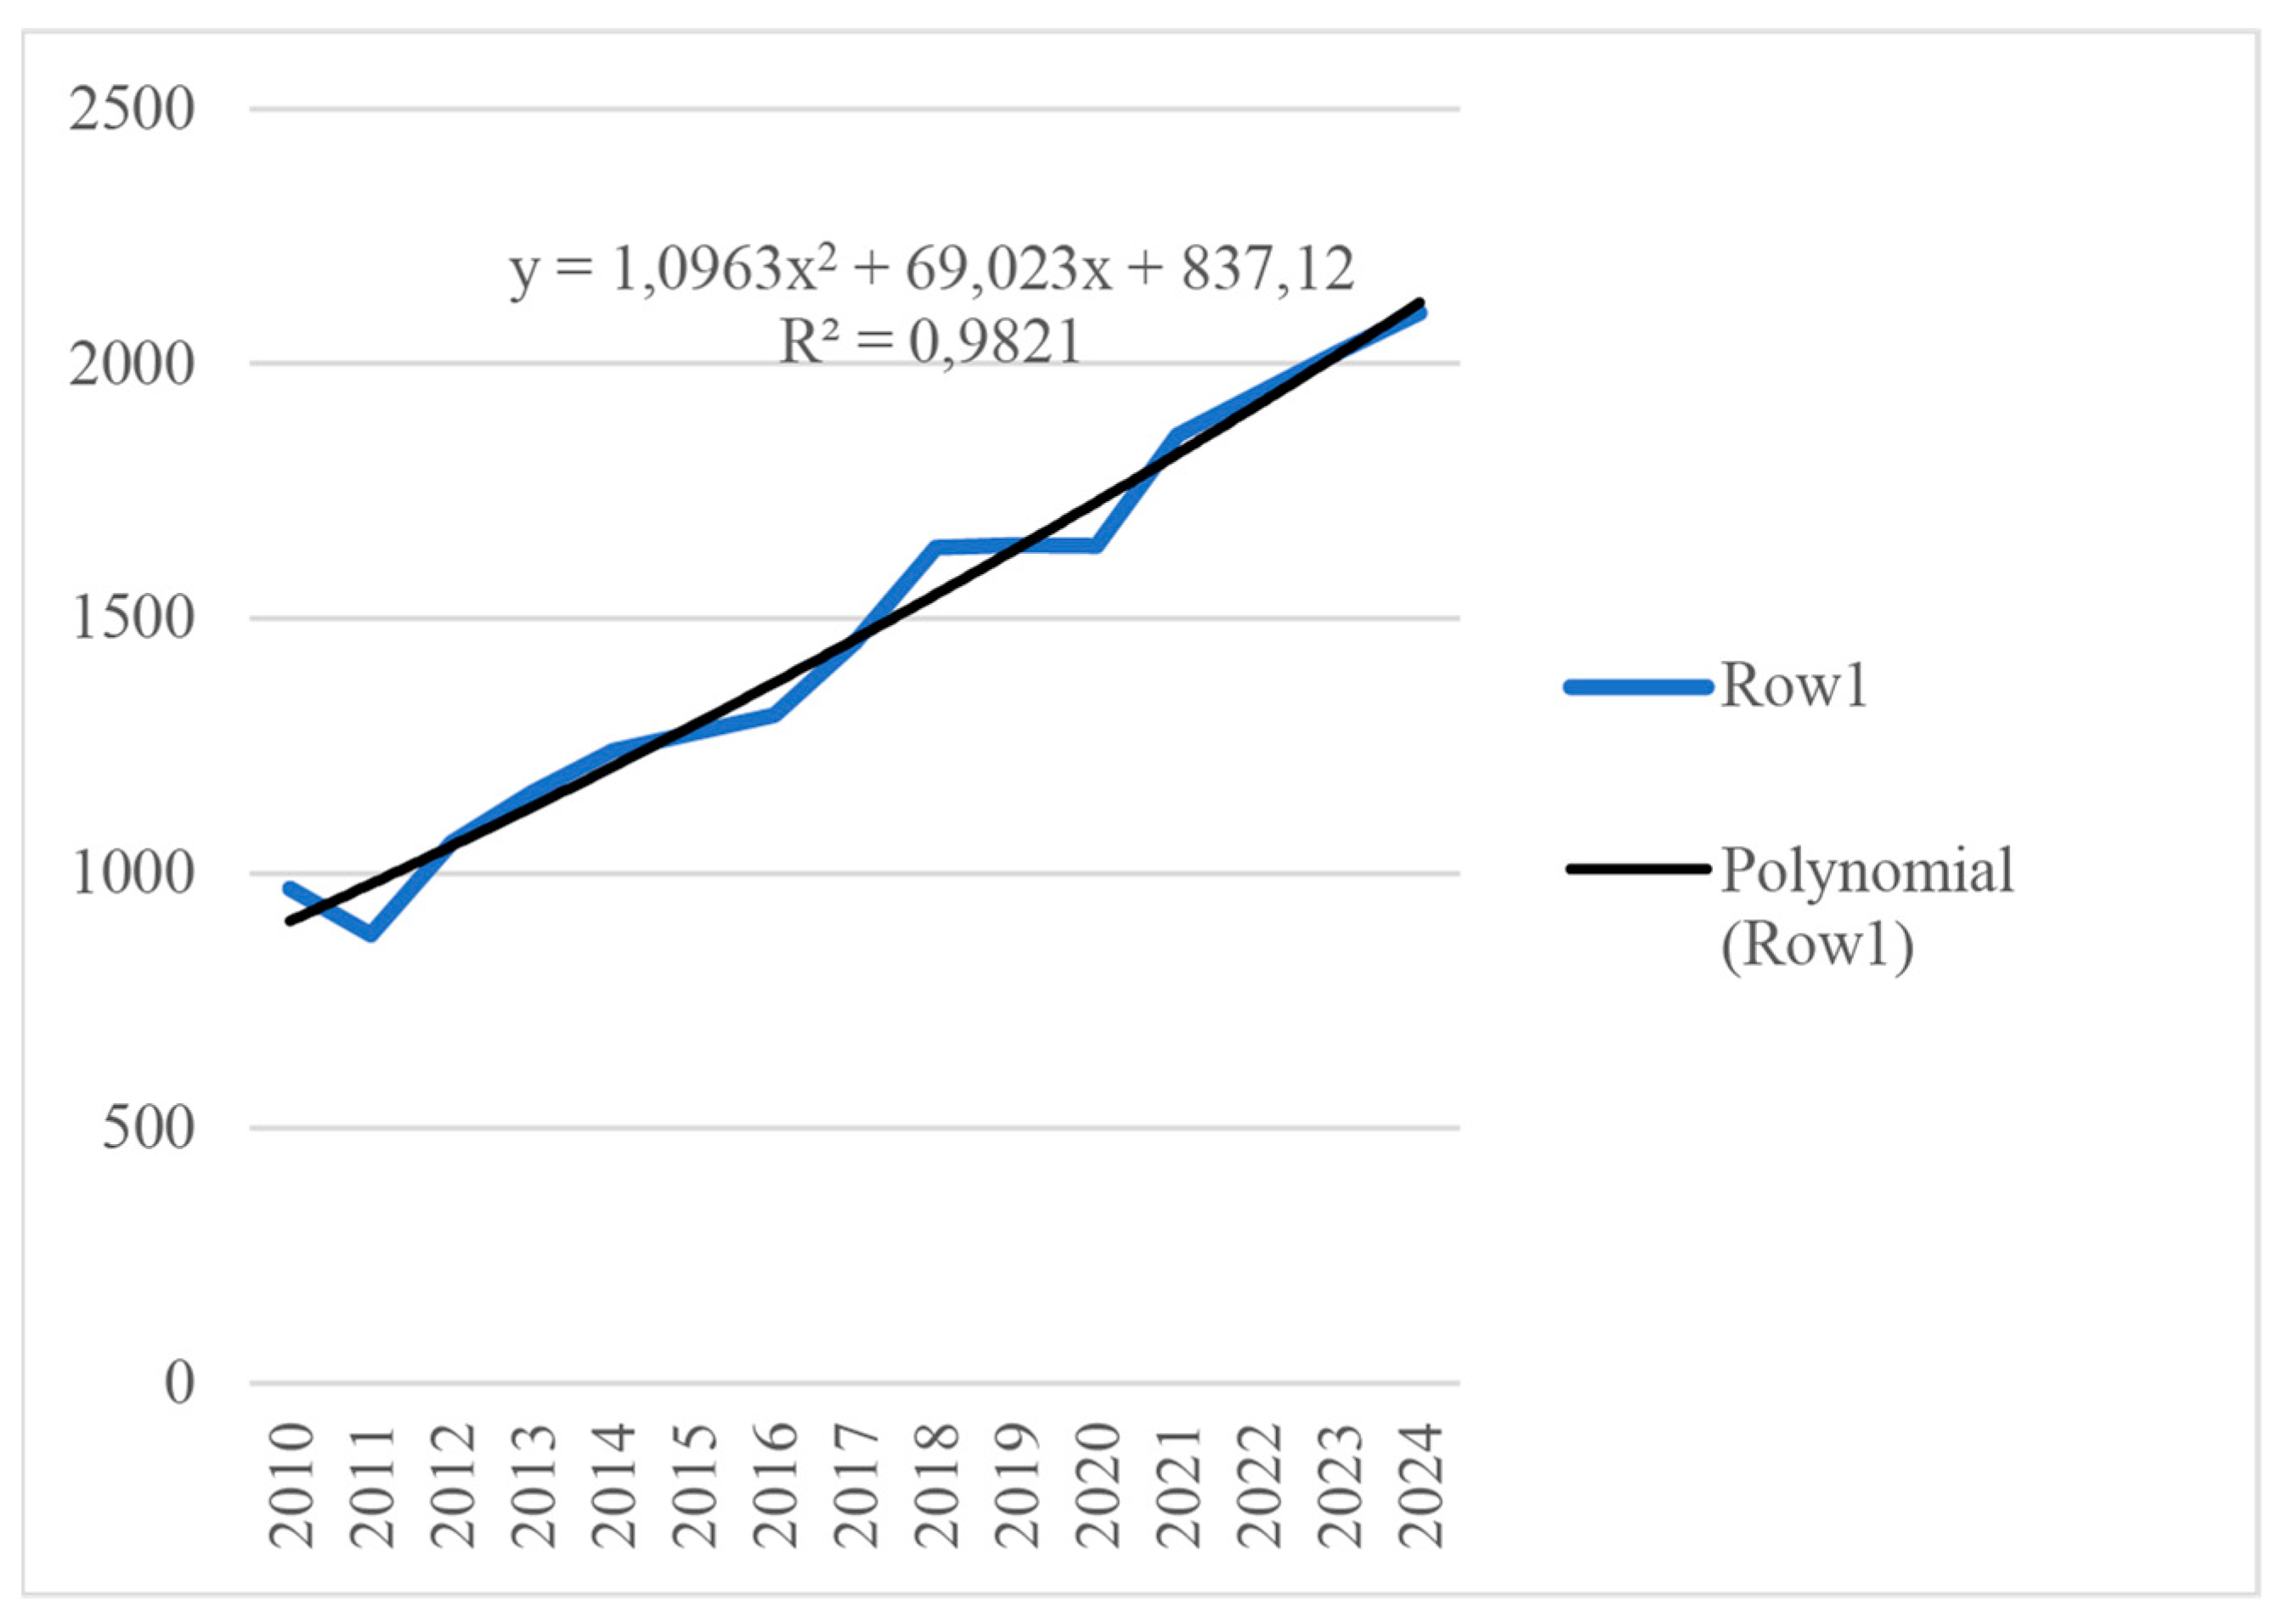
| Turnover of small businesses per 10,000 people population, million rubles— macroeconomic block “Business” | |||||||
| Optimistic | y = 1.0963x2 + 69.023x + 837.12 | 1642 | 1860 | 1941 | 2023 | 2100 | 127.9% |
| Probabilistic | y = 0.0633x2 + 79.033x + 820.32 | 1778 | 1858 | 1938 | 2018 | 122.9% | |
| Pessimistic | y = −0.9758x2 + 89.124x + 803.34 | 1696 | 1775 | 1854 | 1935 | 117.8% | |
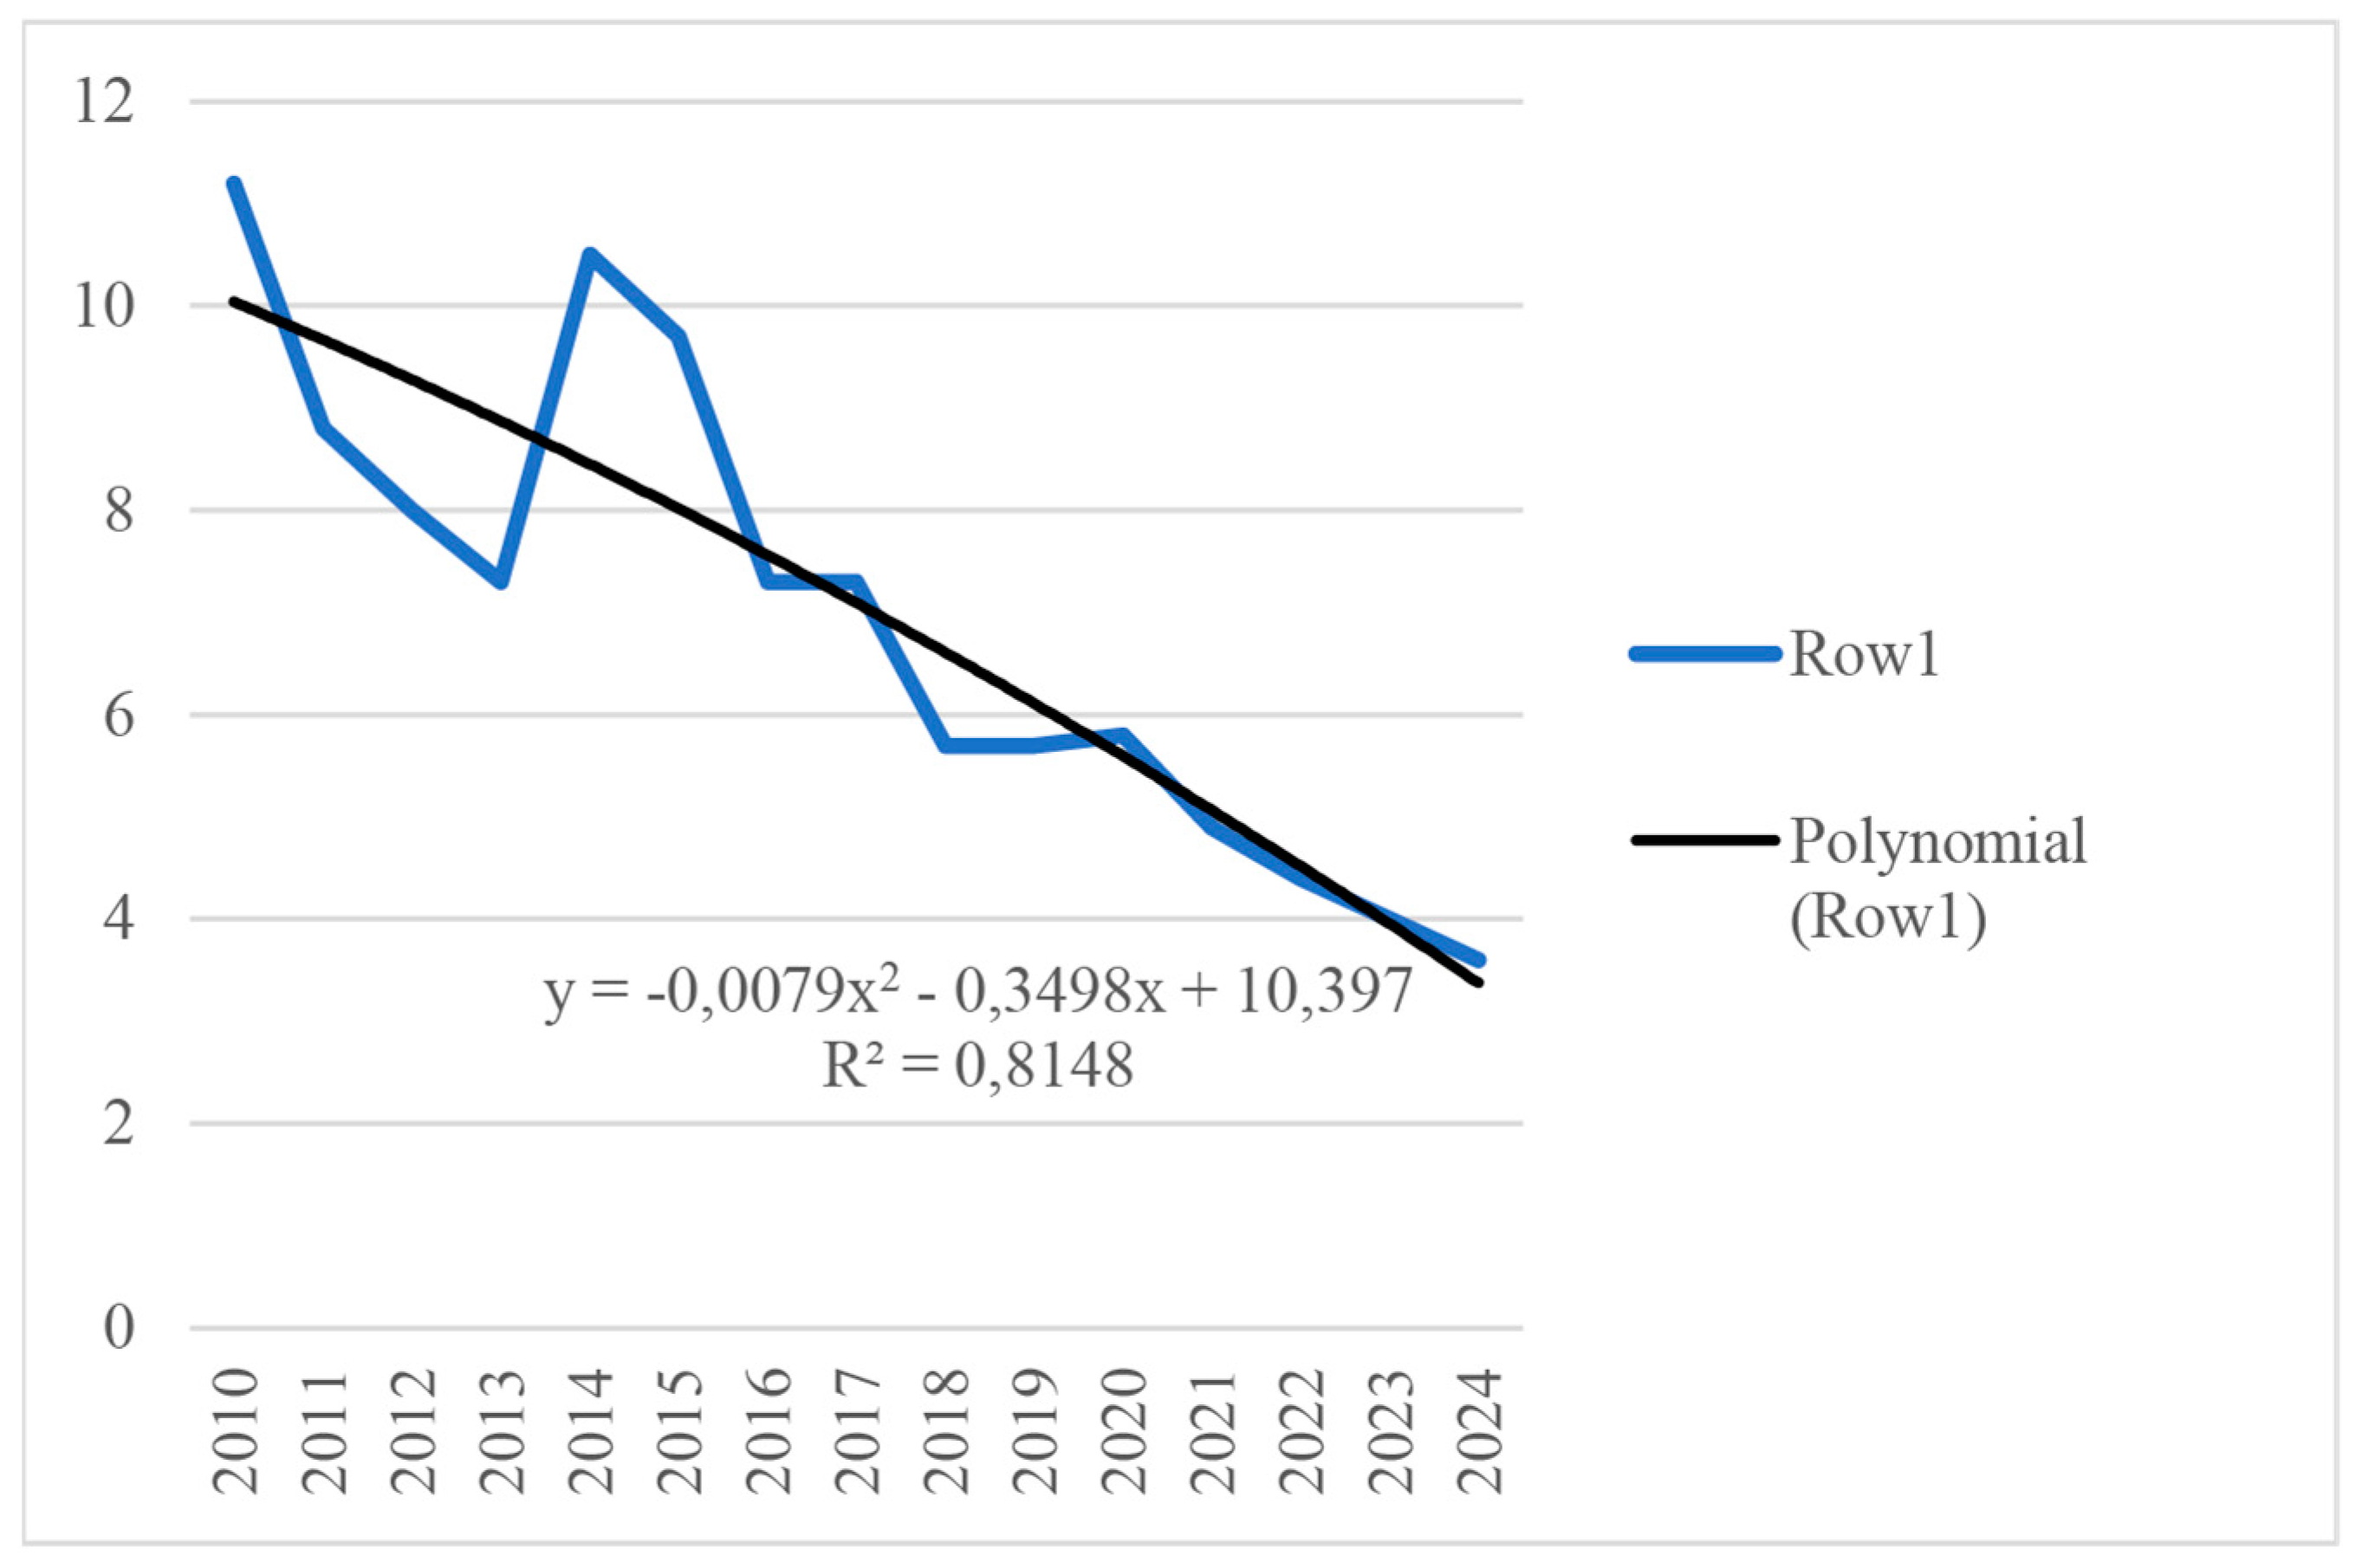
| Capturing atmospheric pollutants from stationary sources per capita, kg—macroeconomic block “Ecology” | |||||||
| Optimistic | y = 0.0016x2 − 0.4459x + 10.567 | 5.8 | 5.5 | 5.1 | 4.7 | 4.4 | 75.9% |
| Probabilistic | y = −0.004x2 − 0.386x + 10.455 | 5.2 | 4.8 | 4.3 | 3.9 | 67.0% | |
| Pessimistic | y = −0.0079x2 − 0.3498x + 10.397 | 4.9 | 4.4 | 4.0 | 3.6 | 62.1% | |
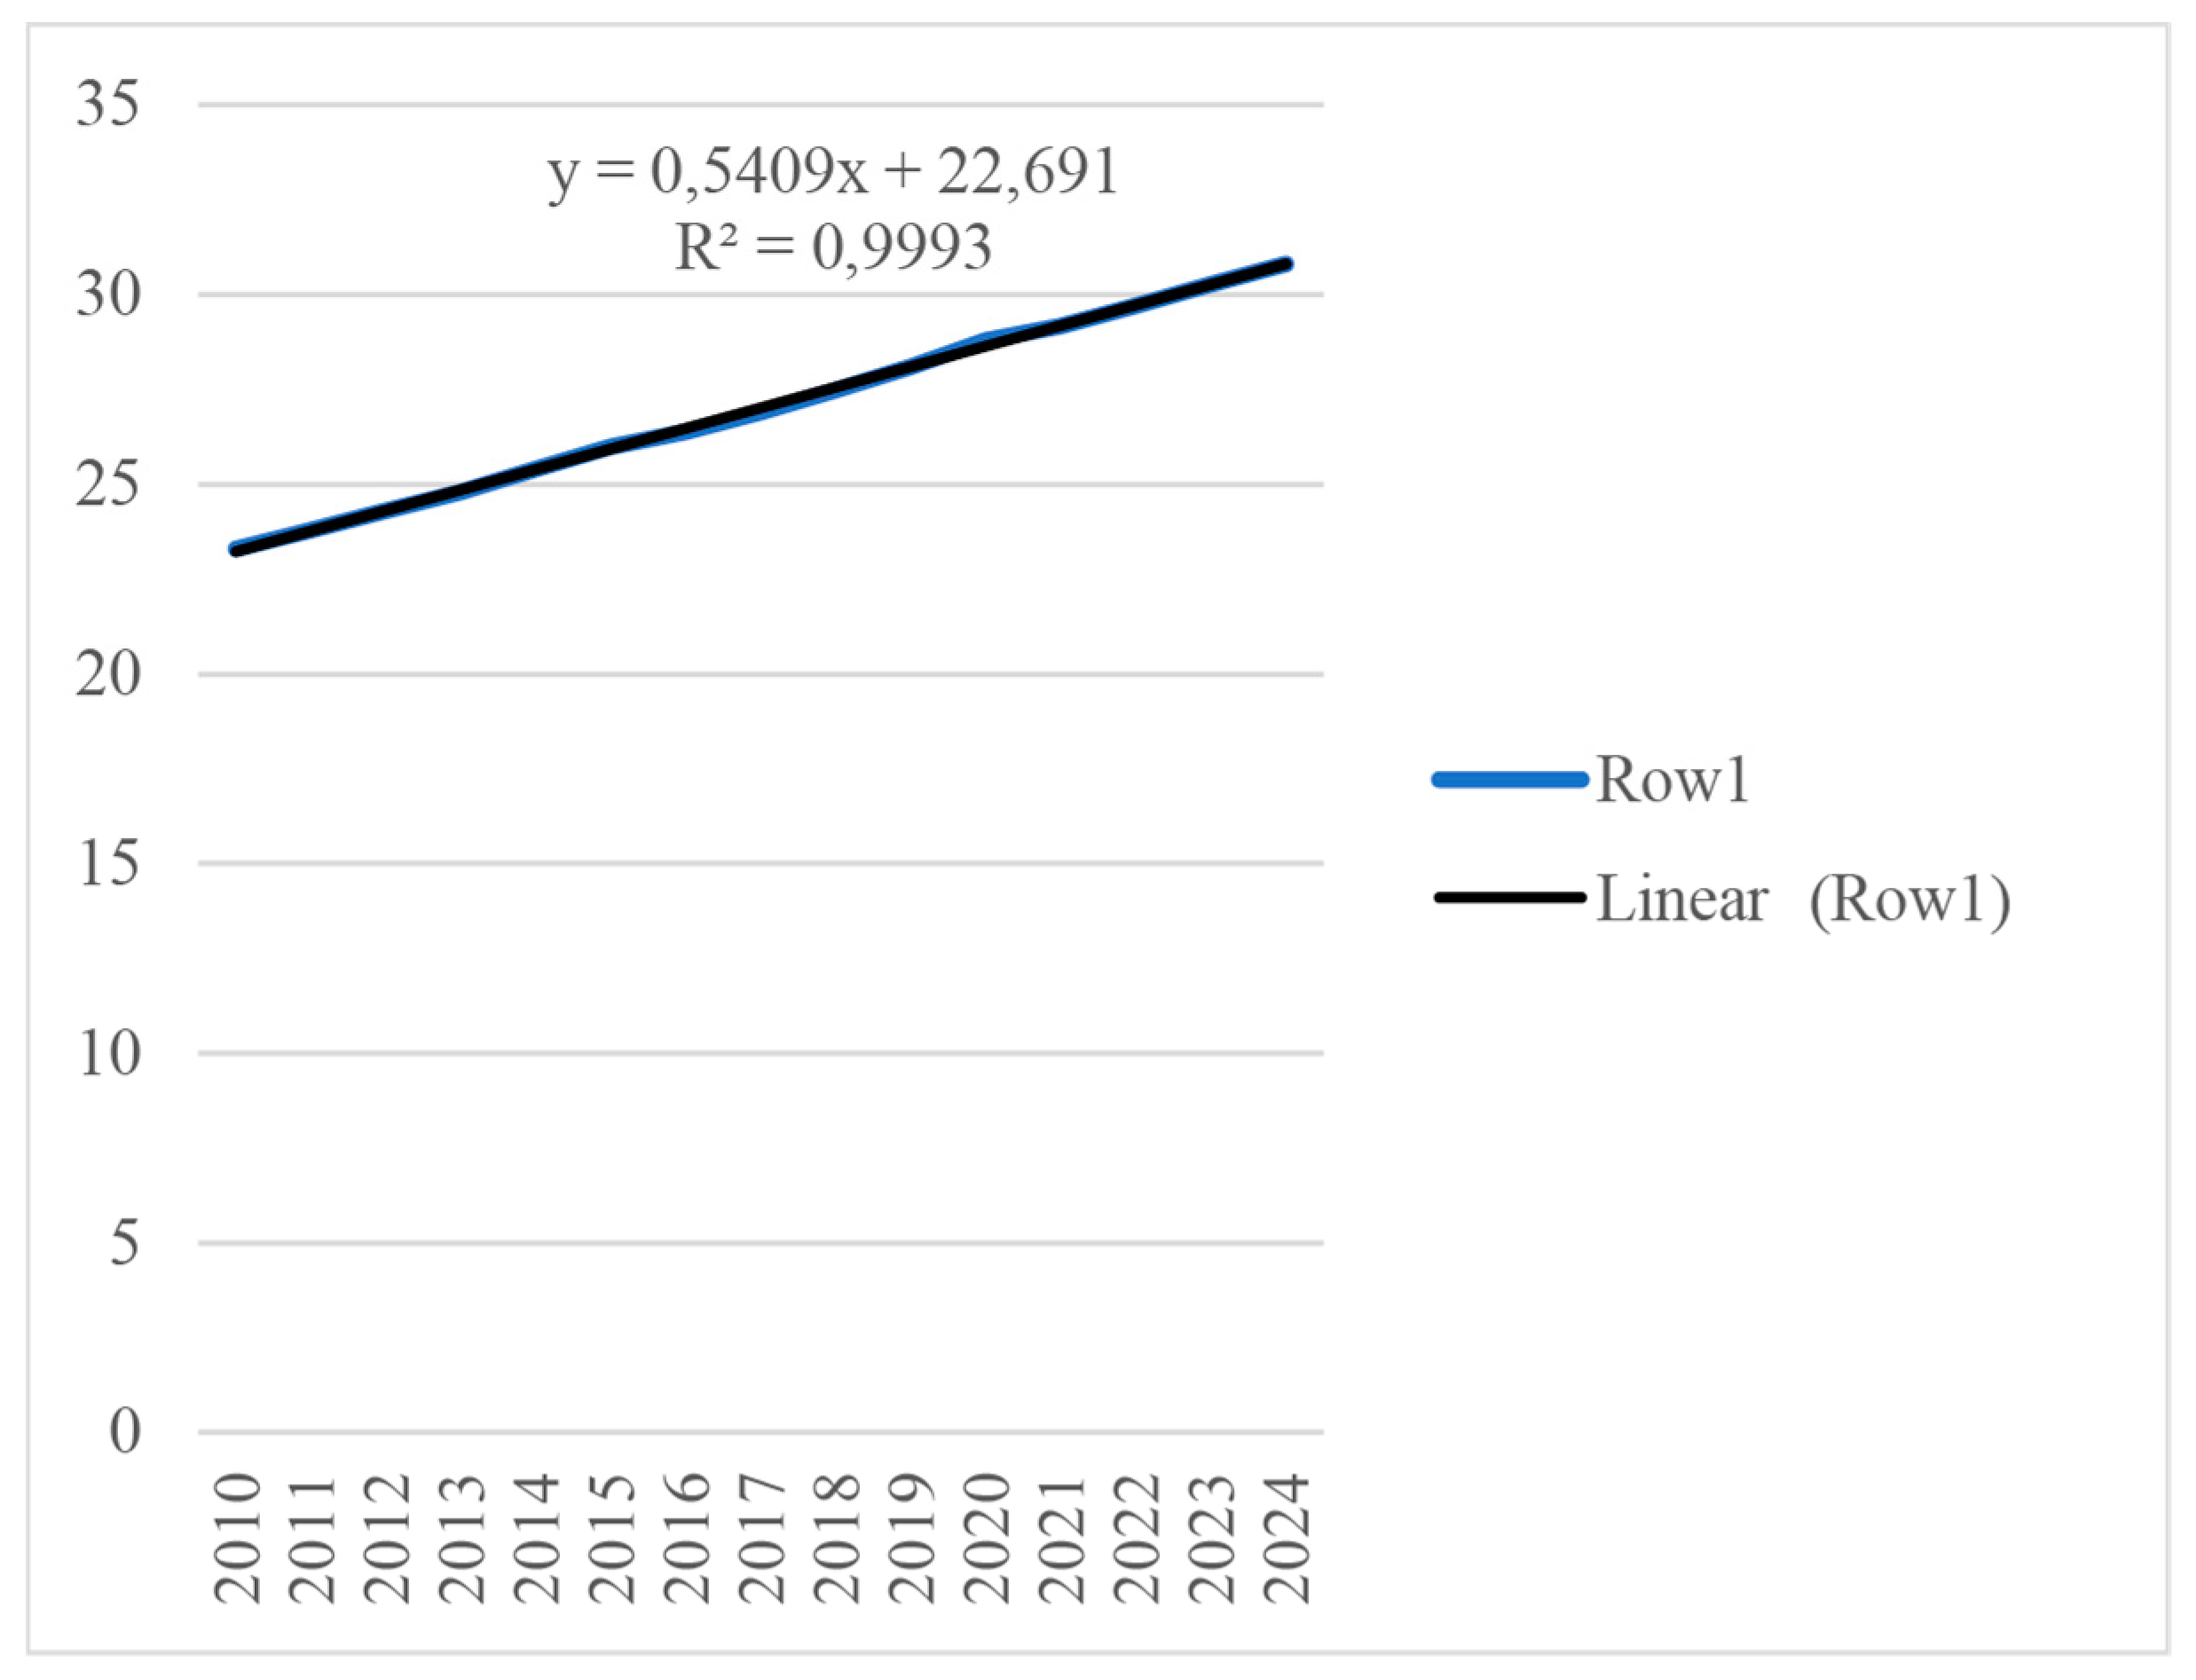
| The total area of residential premises per inhabitant (at the end of the year, sq. m.)—macroeconomic block “Socium” | |||||||
| Optimistic | y = 0.0088x2 + 0.4491x + 22.864 | 28.8 | 29.8 | 30.4 | 30.9 | 31.4 | 109% |
| Probabilistic | y = 0.5409x + 22.691 | 29.2 | 29.7 | 30.3 | 30.8 | 107% | |
| Pessimistic | y = −0.0064x2 + 0.5933x + 22.628 | 28.4 | 29.2 | 29.6 | 30.2 | 105% | |
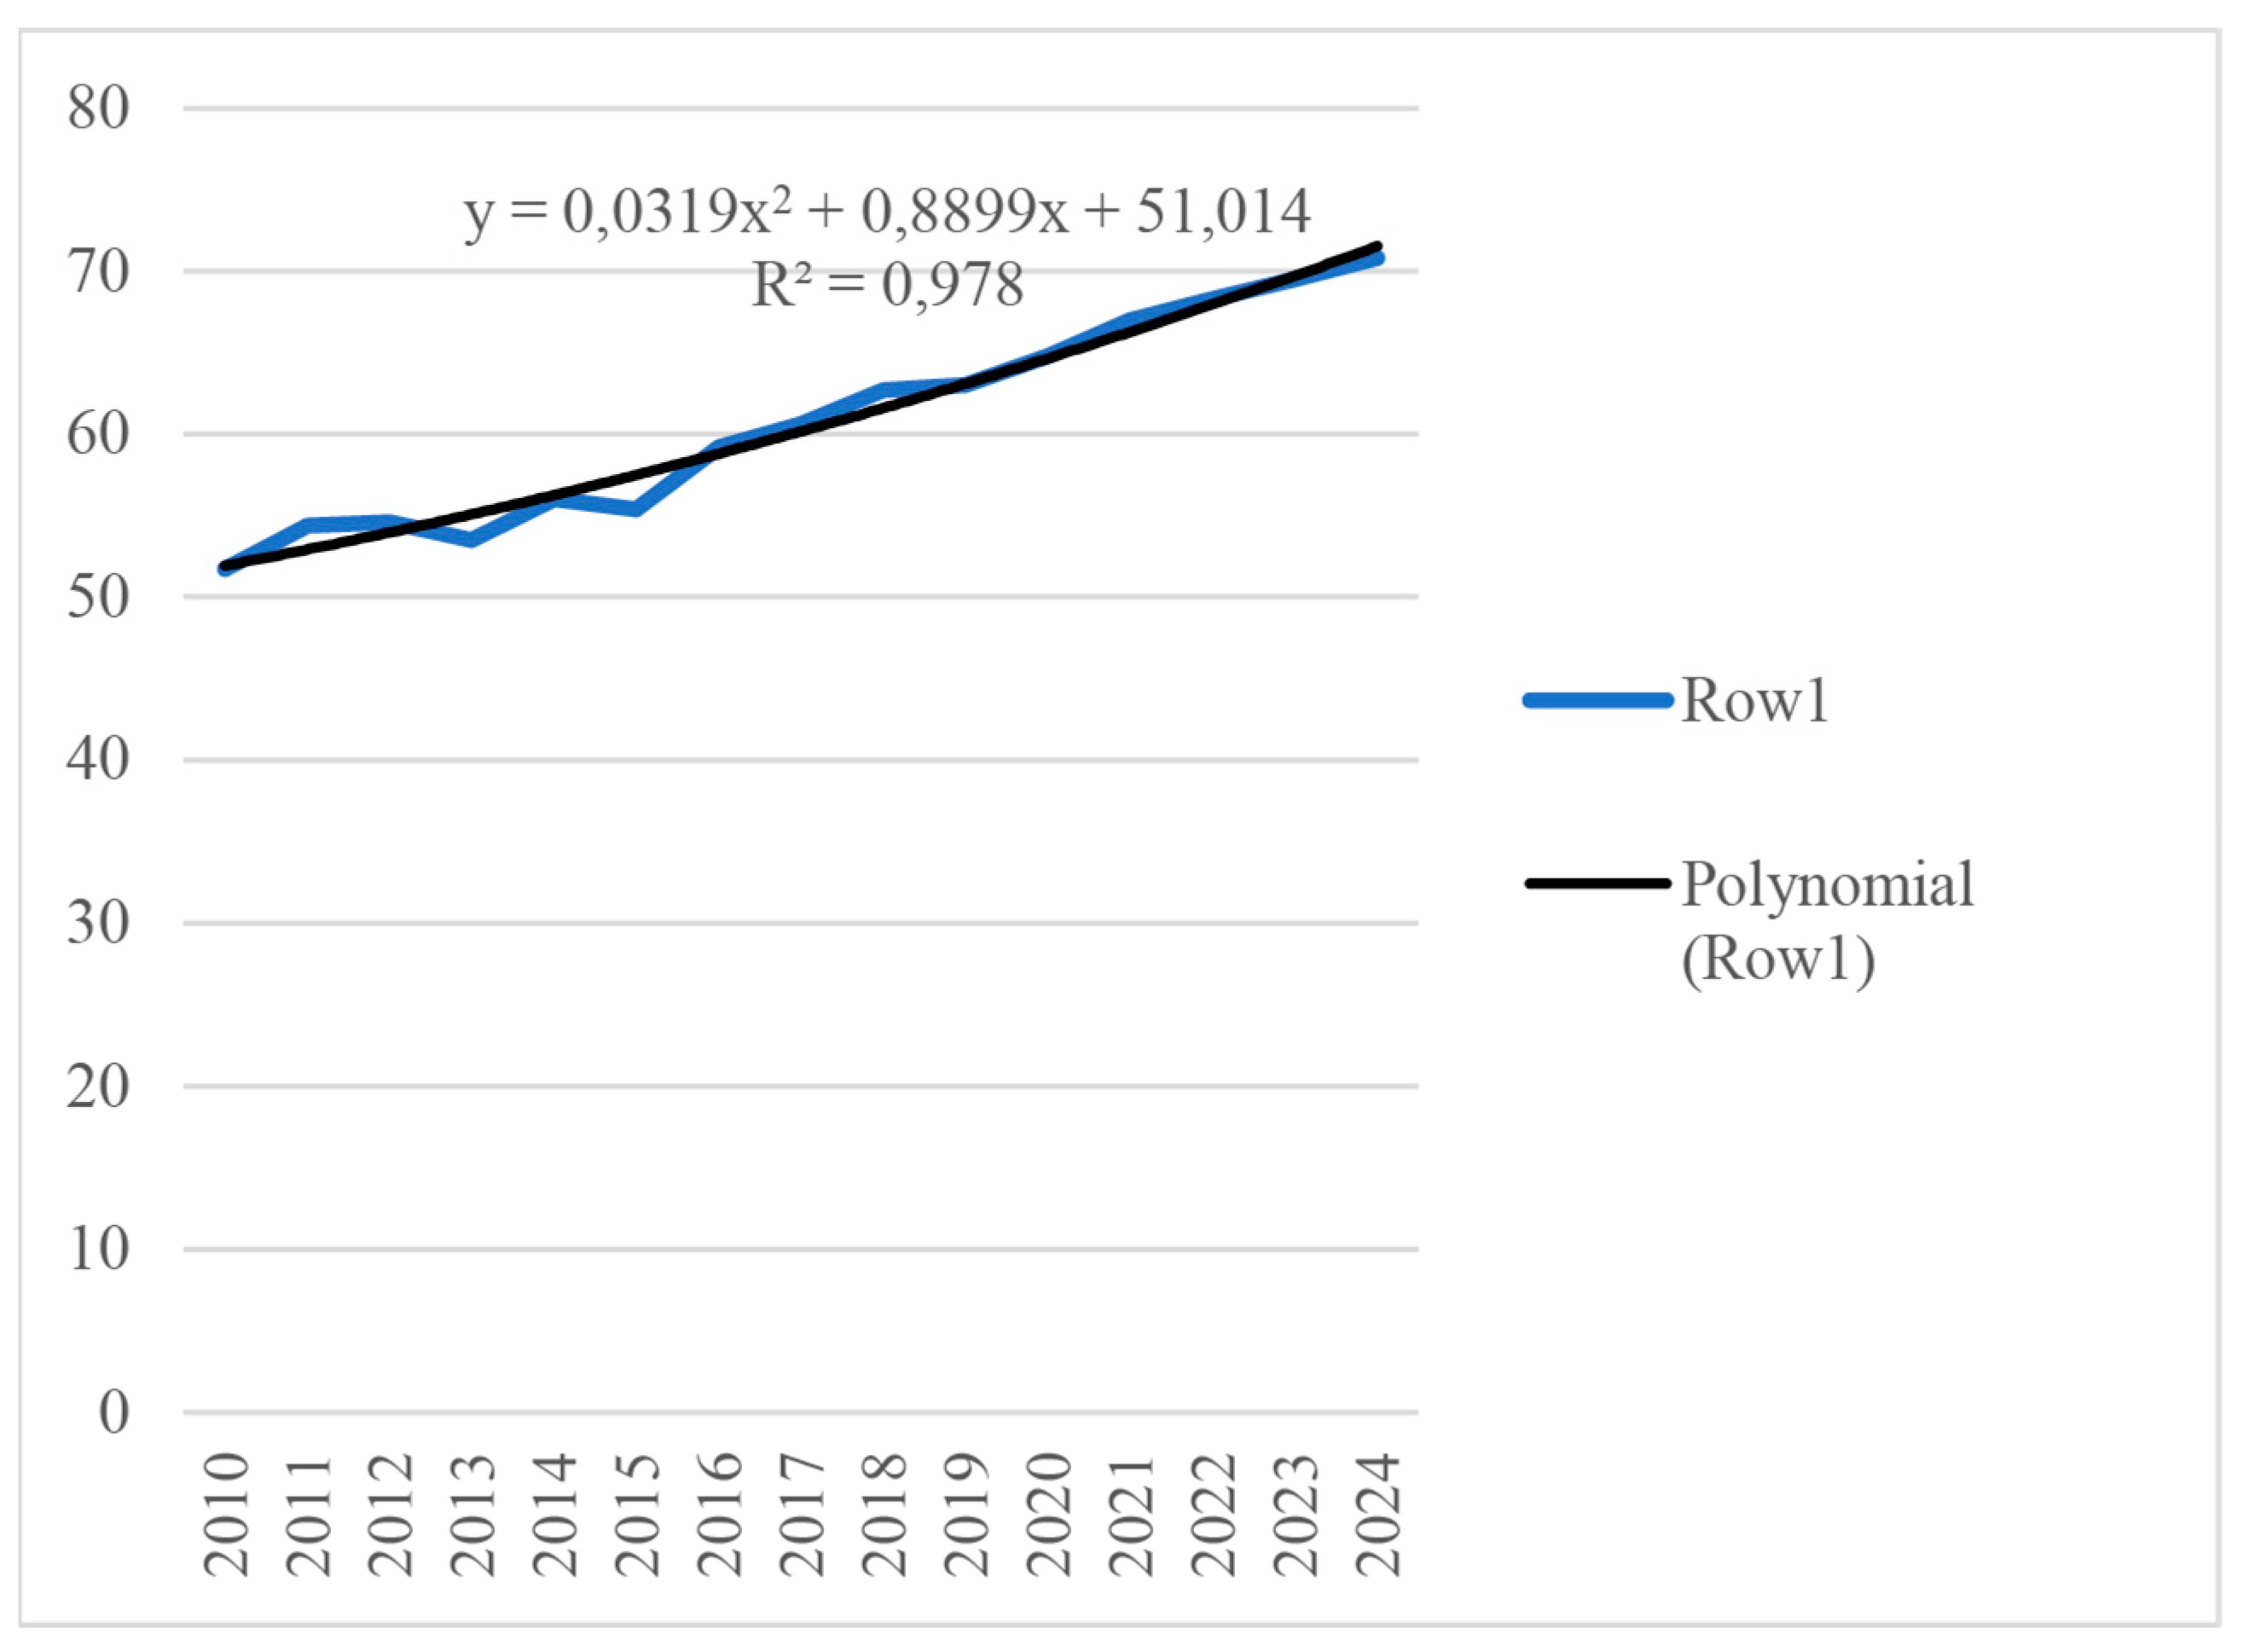
| The degree of depreciation of fixed assets, %—macroeconomic block “Prospects” | |||||||
| Optimistic | y = 0.0319x2 + 0.8899x + 51.014 | 64.8 | 67.0 | 68.3 | 69.5 | 70.8 | +6.0 p.p. |
| Probabilistic | y = 50.673e0.0214x | 65.5 | 66.8 | 68.1 | 69.4 | +4.6 p.p. | |
| Pessimistic | y = −0.0054x2 + 1.2616x + 50.37 | 64.6 | 65.3 | 66.6 | 67.8 | +3.0 p.p. | |
| Income of the consolidated budgets of the constituent entities of the Russian Federation (Chuvash Republic), thousand rubles per capita—macroeconomic block “Finance” | |||||||
| Optimistic | y = 0.0901x2 + 1.8949x + 24.526 | 63.4 | 62.1 | 65.3 | 68.4 | 69.4 | 109.5% |
| Probabilistic | y = 0.0682x2 + 2.06x + 24.346 | 59.1 | 62.2 | 65.4 | 68.5 | 108.1% | |
| Pessimistic | y = 0.0315x2 + 2.4192x + 23.738 | 56.3 | 59.3 | 62.4 | 65.6 | 103.5% | |
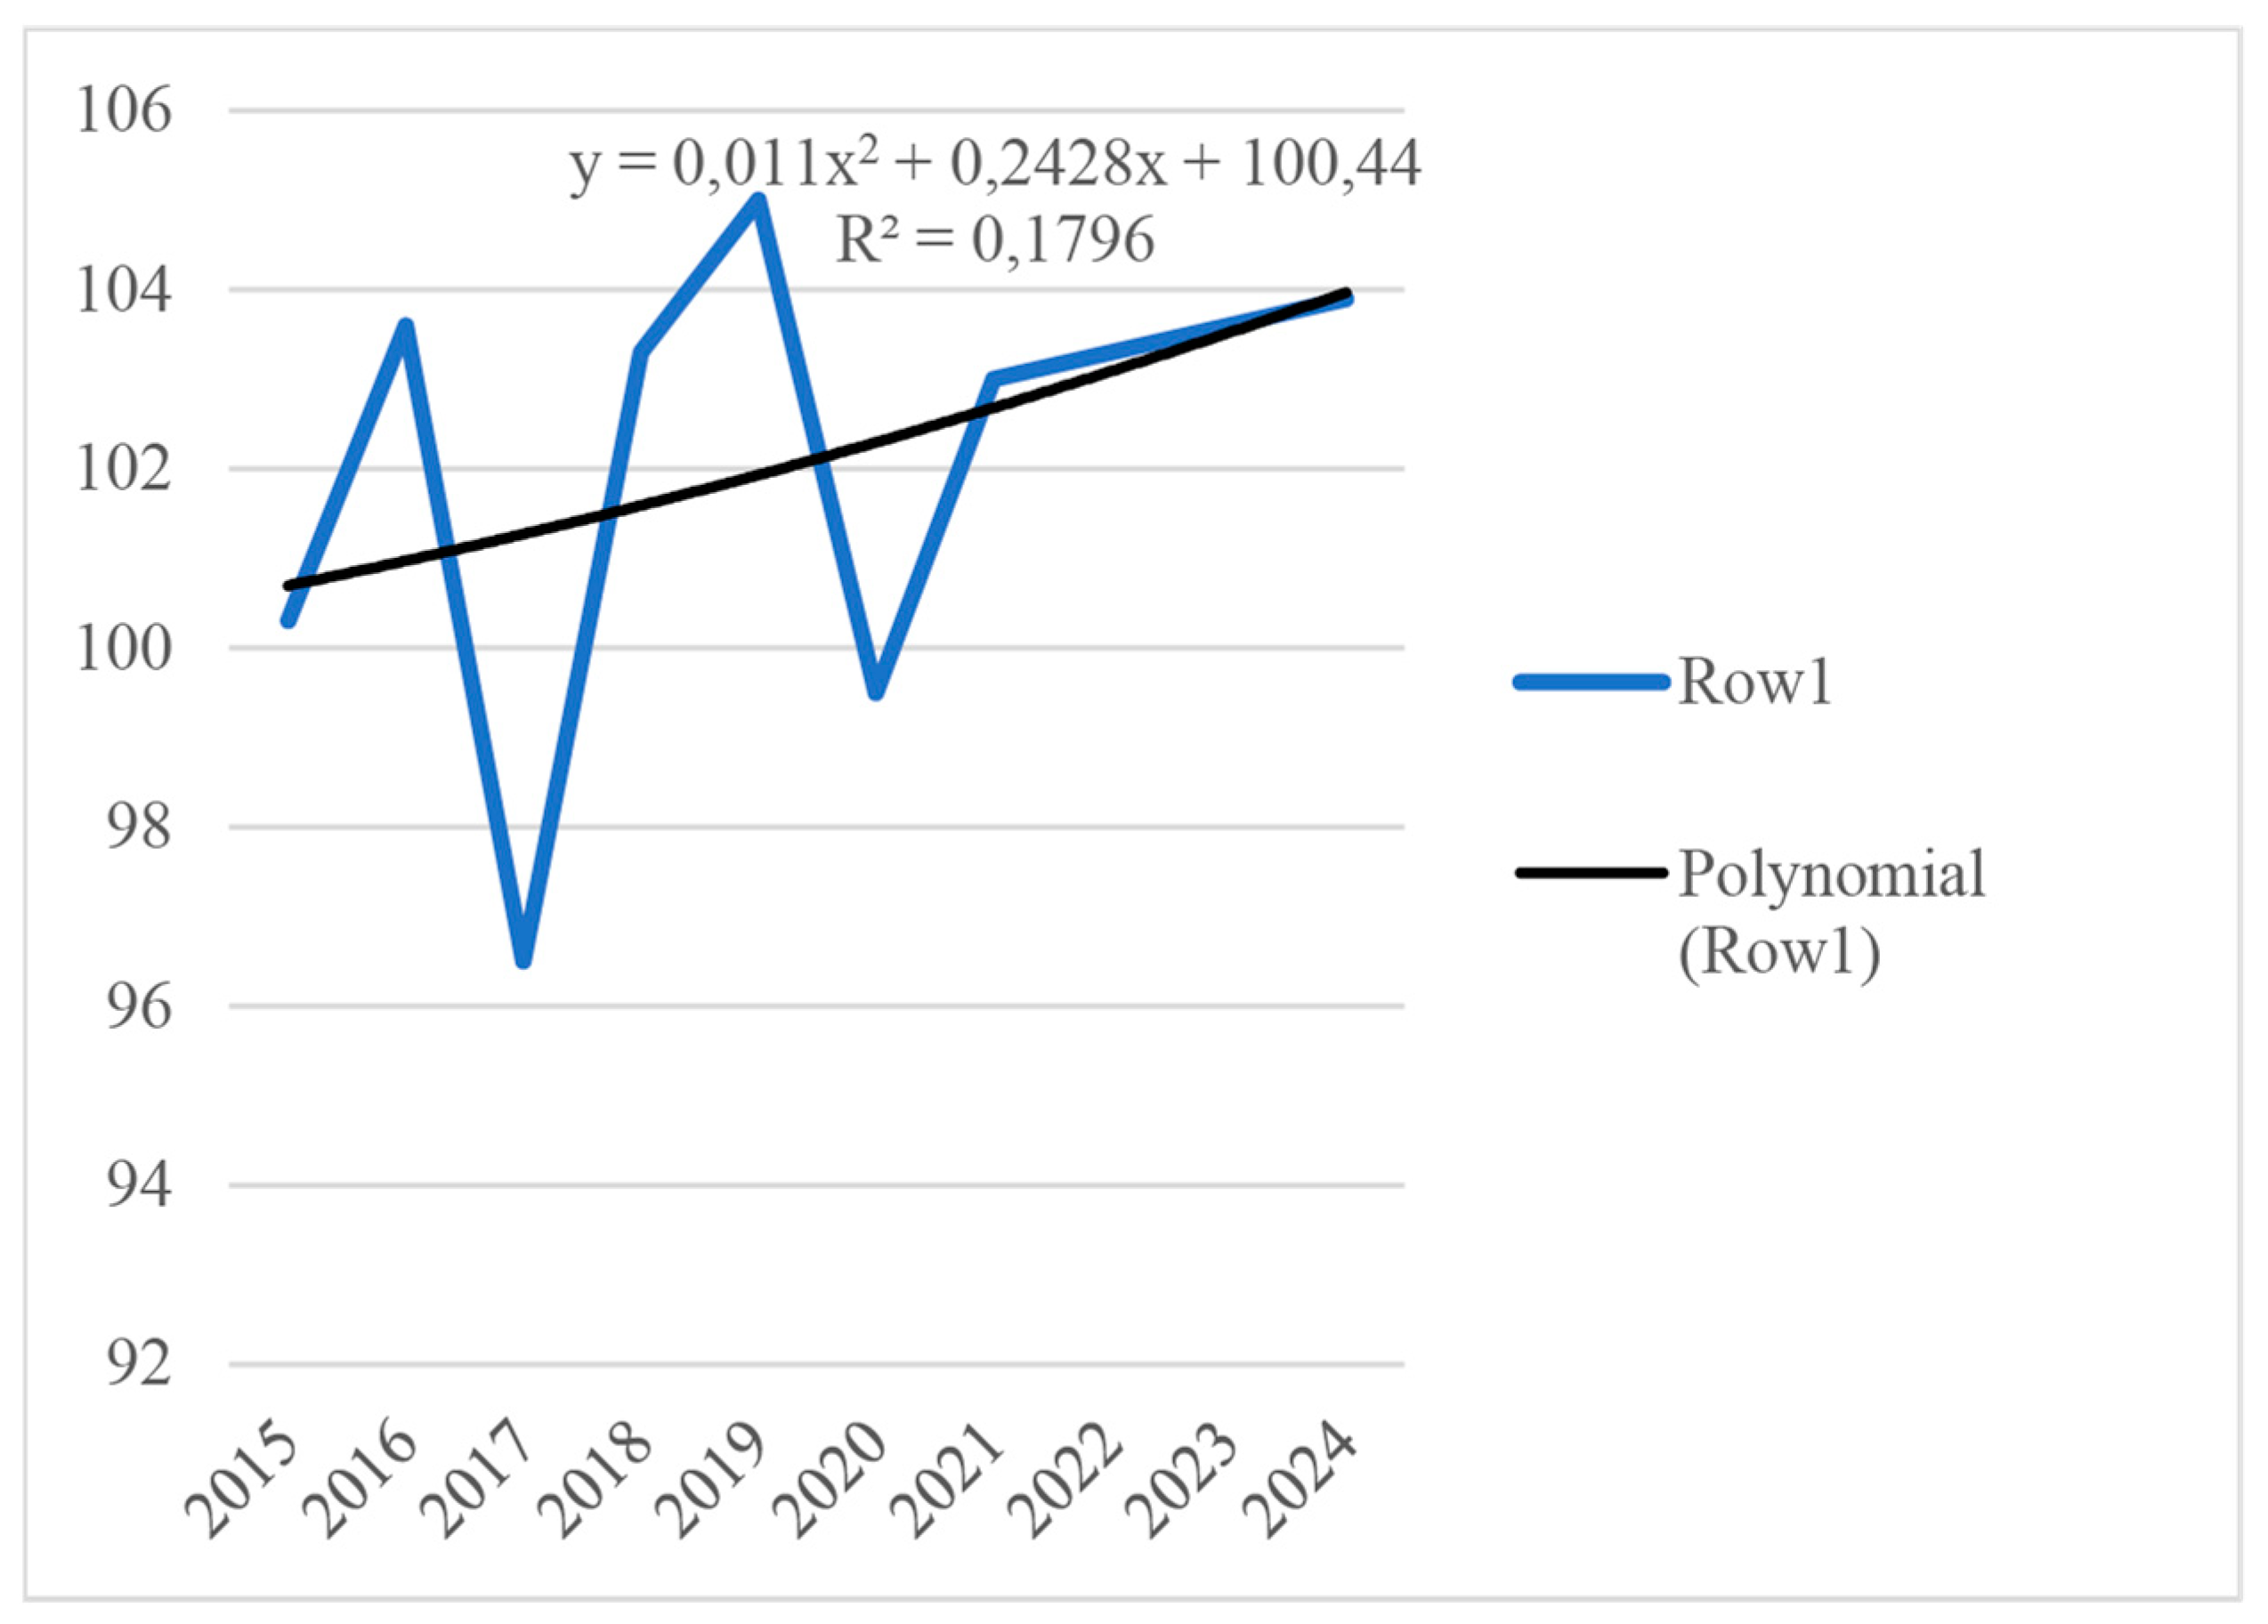
| The rate of socio-economic development (actual), % | |||||||
| Optimistic | y = 0.011x2 + 0.2428x + 100.44 | 99.5 | 103.0 | 103.3 | 103.6 | 103.9 | +4.4 p.p. |
| Probabilistic | y = 0.0095x2 + 0.2299x + 100.48 | 102.7 | 103.1 | 103.4 | 103.7 | +4.2 p.p. | |
| Pessimistic | y = 0.0087x2 + 0.2011x + 100.56 | 102.3 | 102.8 | 103.2 | 103.5 | +4.0 p.p. | |
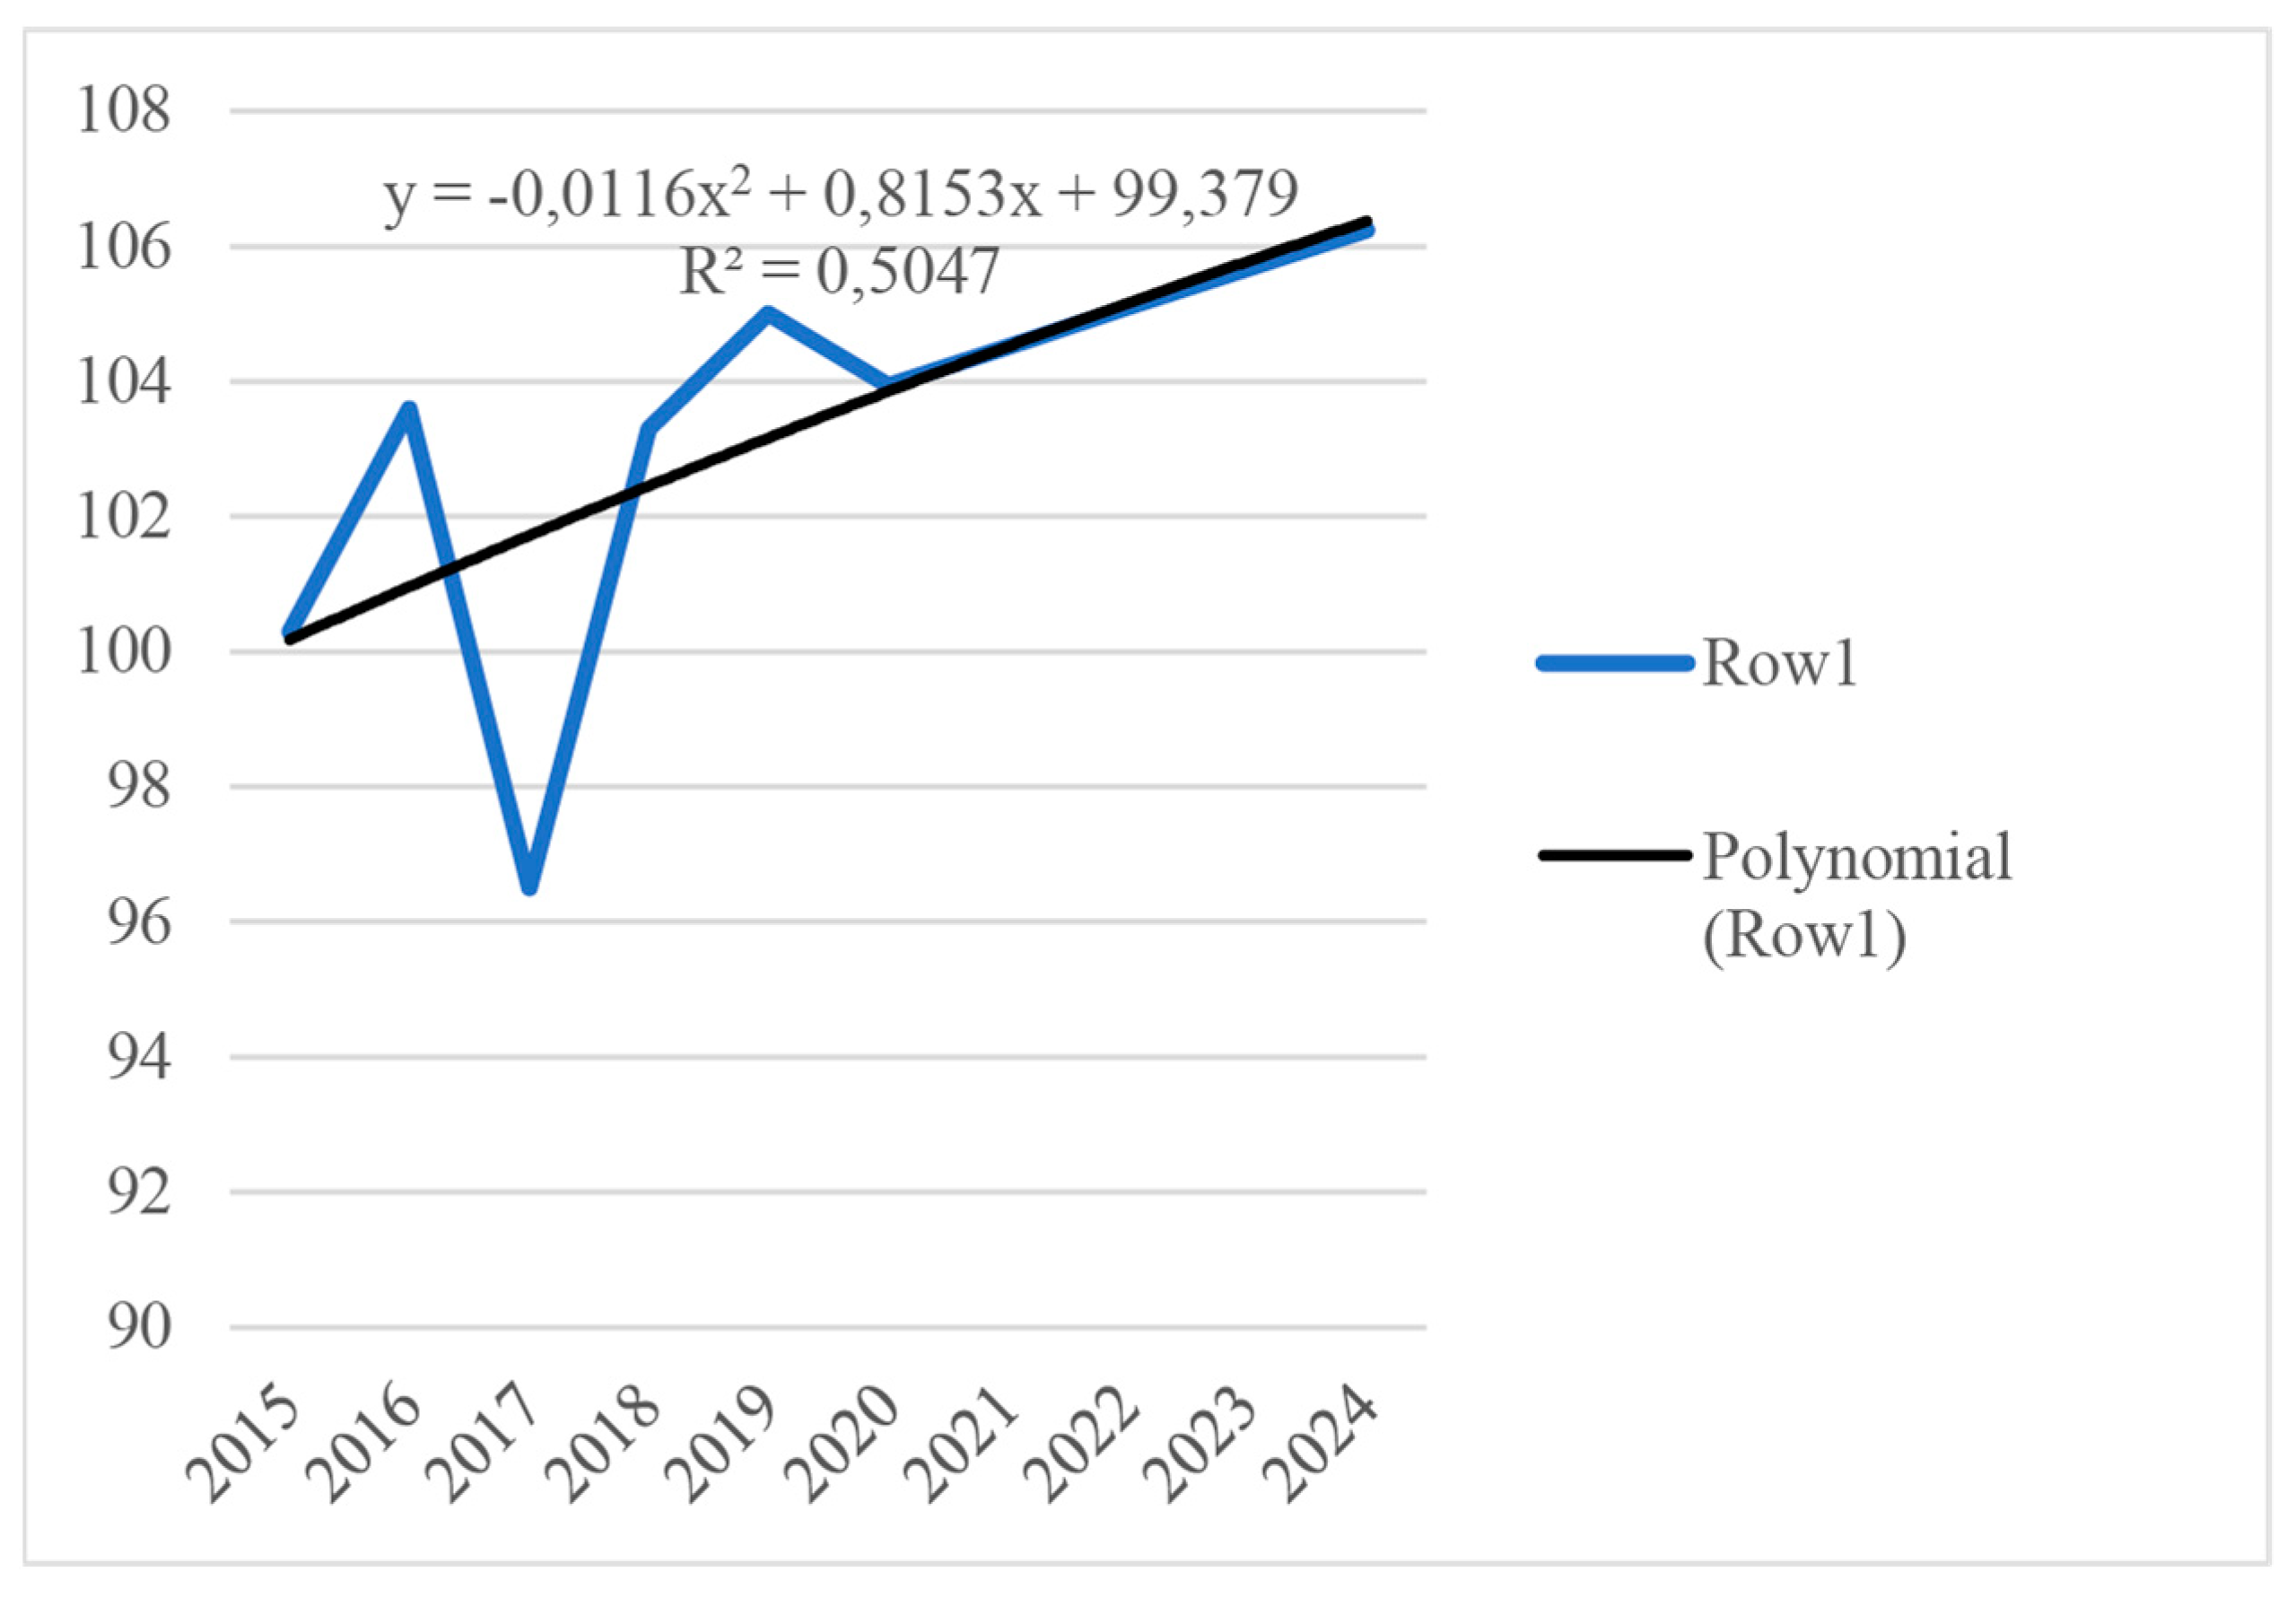
| The rate of socio-economic development (in case of absence of a COVID-19 pandemic), % | |||||||
| Hypothetical | y = −0.0116x2 + 0.8153x + 99.379 | 103.9 | 104.5 | 105.1 | 105.7 | 106.2 | +2.3 p.p. |
| Indicator | Year | |||||||||
|---|---|---|---|---|---|---|---|---|---|---|
| 2011 | 2012 | 2013 | 2014 | 2015 | 2016 | 2017 | 2018 | 2019 | 2020 | |
| Number of completed actions | ||||||||||
| Federal target programs | 3 | |||||||||
| Number of adopted normative legal acts | ||||||||||
| Decrees of the President | 2 | 2 | ||||||||
| Government Decrees | 5 | 5 | 3 | |||||||
| Government orders approved | 1 | 2 | ||||||||
| Implementation of National projects | 3 | 4 | ||||||||
| Total | 7 | 8 | 3 | 9 | ||||||
| , % | 100.2 | 100.6 | 89.3 | 110.9 | 100.3 | 103.6 | 96.5 | 103.3 | 105.0 | 99.5 |
| Range of the Rate | Characteristic |
|---|---|
| 110–120 | High level of sustainable socio-economic development of the region |
| 100–110 | Sustainable socio-economic development of the region |
| 90–100 | Socio-economic development of the region is close to sustainable |
| 80–90 | Socio-economic development of the region with some signs of instability |
| 70–80 | Unstable, pre-crisis socio-economic state of the region |
| 60–70 | Socio-economic crisis |
- -
- positive impact (105.4% − 100.0%) + (101.7% − 100.0%) + (108.5% − 100.0%) = 5.4 p.p. +1.7 p.p. + 8.5 p.p. = 15.6 p.p.;
- -
- negative (100.0% − 99.8%) + (100.0% − 98.8%) = 0.2 p.p. + 1.2 p.p. = 1.4 p.p.
- Emissions of pollutants into the atmospheric air from stationary sources per capita
- Capturing air pollutants from stationary sources per capita
- Fresh water usage per capita
- Discharge of polluted wastewater into surface water bodies per capita
- Volume of recycled and consistently used water per capita
- Ratio of GDP (GRP) to total land area
- Ratio of agricultural output to total land area.
- -
- positive (100.0% − 98.2%) + (100.0% − 100.0%) + (100.0% − 96.5%) + (102.7% − 100.0%) = 1.8 p.p. + 0 p.p. + 3.5 p.p. + 2.7 p.p. = 8.0 p.p.
- -
- negative (100.0% − 93.6%) = 6.4 p.p.
- Total fertility rate (number of births per 1000 population)
- General mortality rate (number of deaths per 1000 population)
- Infant mortality rate (number of children who died before the age of 1 year per 1000 live births)
- Coefficient of natural population growth (per 1000 people)
- Total area of residential premises per inhabitant on average (at the end of the year, in square meters)
- Commissioning of residential buildings per 1000 people (in square meters of total area)
- Incidence rate per 1000 people.
- -
- indicators of a positive impact on the average rate amounted to (102.1% − 100.0%) + (100.0% − 98.8%) = 2.1 p.p. + 1.2 p.p. = 3.3 p.p.;
- -
- negative (100.0% − 96.8%) + (100.7% − 100.0%) + (100.0% − 96.2%) = 3.2 p.p. + 0.7 p.p. + 3.8 p.p. = 7.7 p.p.;
- The cost of fixed assets per capita
- The degree of depreciation of fixed assets
- Investment in fixed assets per capita (in actual prices, rubles)
- The share of organizations that carried out technological, organizational, and marketing innovations in the total number of surveyed organizations (%)
- Use of global information networks (as a percentage of the total number of surveyed organizations of the corresponding subject of the Russian Federation)
- Organizations that had a website (as a percentage of the total number of surveyed organizations of the corresponding subject of the Russian Federation)
- The number of students enrolled in bachelor’s, specialist’s, and master’s programs per 10,000 population.
- -
- indicators of a positive impact on the average rate amounted to (112.5% − 100.0%) + (102.4% − 100.0%) + (100.7% − 100.0%) + (101.3 % − 100.0%) = 12.5 p.p. + 2.4 p.p. + 0.7 p.p. + 1.3 p.p. = 16.9 p.p.;
- -
- negative (102.3% − 100.0%) + (100.0% − 93.9%) = 2.3 p.p. + 6.1 p.p. = 8.4 p.p.
- Revenues of the consolidated budgets of the constituent entities of the Russian Federation (Chuvash Republic) per capita
- Expenses of the consolidated budgets of the subjects of the Russian Federation (Chuvash Republic) per capita
- The ratio of revenues to expenditures of the consolidated budgets of the constituent entities of the Russian Federation (Chuvash Republic) per capita
- The share of gratuitous receipts in the structure of incomes of the consolidated budgets of the constituent entities of the Russian Federation (Chuvash Republic)
- The ratio of GDP (GRP) to the income of the consolidated budgets of the constituent entities of the Russian Federation (Chuvash Republic) per capita
- The ratio of GDP (GRP) to the expenditures of the consolidated budgets of the constituent entities of the Russian Federation (Chuvash Republic) per capita
- Share of unprofitable organizations.
3. Results
4. Discussion
5. Conclusions
Author Contributions
Funding
Institutional Review Board Statement
Informed Consent Statement
Data Availability Statement
Conflicts of Interest
Appendix A
| Index of Change in | Year | Average Rate | |||||||||
|---|---|---|---|---|---|---|---|---|---|---|---|
| 2011 | 2012 | 2013 | 2014 | 2015 | 2016 | 2017 | 2018 | 2019 | 2020 | ||
| Population with incomes below the subsistence level | 105.8 | 82.6 | 102.9 | 99.2 | 109.1 | 104.9 | 97.5 | 96.2 | 97.3 | 95.8 | ↑98.9 |
| Income differentiation coefficient | 98.2 | 110.0 | 97.5 | 96.6 | 87.7 | 97.0 | 94.8 | 101.1 | 100.0 | 100.0 | ↑98.2 |
| GRP per capita | 120.2 | 115.7 | 102.7 | 106.6 | 106.0 | 113.4 | 104.4 | 107.3 | 107.9 | 104.0 | ↑108.7 |
| 107.7 | 101.7 | 101 | 100.7 | 100.5 | 104.9 | 98.8 | 101.4 | 101.6 | 99.9 | 101.8 | |
| Index of Change in | Year | Average Rate | |||||||||
|---|---|---|---|---|---|---|---|---|---|---|---|
| 2011 | 2012 | 2013 | 2014 | 2015 | 2016 | 2017 | 2018 | 2019 | 2020 | ||
| Employment rate | 102.9 | 101.7 | 102.6 | 103.8 | 99.1 | 96.8 | 88.5 | 99.3 | 99.1 | 98.6 | ↓99.2 |
| Unemployment rate | 82.1 | 75.6 | 96.6 | 87.7 | 100.0 | 106.0 | 96.2 | 98.0 | 94.0 | 129.8 | ↑95.7 |
| Labor force participation rate | 100.9 | 99.6 | 102.5 | 103.0 | 99.2 | 96.9 | 88.4 | 99.4 | 98.7 | 100.0 | ↓98.8 |
| Labor force participation rate | 76.7 | 38.0 | 10.0 | 766.7 | 100.0 | 287.0 | 24.2 | 68.8 | 327.3 | 55.6 | ↑84.9 |
| 89.9 | 73.4 | 56.5 | 163.7 | 99.6 | 130 | 65.4 | 90.3 | 131.7 | 91.8 | 94.4 | |
| Index of Change in | Year | Average Rate | |||||||||
|---|---|---|---|---|---|---|---|---|---|---|---|
| 2011 | 2012 | 2013 | 2014 | 2015 | 2016 | 2017 | 2018 | 2019 | 2020 | ||
| Turnover of small businesses per 10,000 people population | 90.6 | 120.6 | 109.2 | 107.0 | 102.8 | 102.7 | 111.0 | 112.7 | 100.3 | 99.9 | ↑105.4 |
| The share of the average number of employees of small enterprises in the total number of employed population | 117.9 | 99.4 | 103.7 | 98.8 | 86.9 | 101.4 | 102.7 | 94.7 | 132.6 | 86.4 | ↑101.7 |
| Balanced financial result (profit minus loss) of the activities of organizations per 10,000 people employed population | 199.7 | 138.2 | 23.6 | 119.4 | 32.9 | 1237.1 | 75.4 | 114.6 | 62.7 | 132.0 | ↑108.5 |
| Profitability of sold goods, products (works, services) of organizations | 95.9 | 88.3 | 83.1 | 102.9 | 111.3 | 94.9 | 88.0 | 159.1 | 101.9 | 89.7 | ↓99.8 |
| The number of enterprises and organizations per 10,000 people population | 96.9 | 103.2 | 104.2 | 104.0 | 101.4 | 99.5 | 95.7 | 97.5 | 92.8 | 93.9 | ↓98.8 |
| 114.7 | 108.6 | 74.6 | 106.2 | 80.2 | 98.5 | 93.7 | 113.7 | 95.4 | 99.2 | 97.6 | |
| Index of Change in | Year | Average Rate | |||||||||
|---|---|---|---|---|---|---|---|---|---|---|---|
| 2011 | 2012 | 2013 | 2014 | 2015 | 2016 | 2017 | 2018 | 2019 | 2020 | ||
| Emissions of pollutants into the atmospheric air from stationary sources | 90.7 | 117.8 | 88.3 | 124.4 | 74.9 | 92.7 | 172.8 | 98.3 | 88.6 | 68.1 | ↑98.2 |
| Capturing atmospheric pollutants from stationary sources | 78.6 | 90.9 | 91.3 | 143.8 | 92.4 | 75.3 | 100.0 | 78.1 | 100.0 | 101.8 | ↓93.6 |
| Use of fresh water | 100.0 | 100.0 | 100.0 | 100.0 | 100.0 | 100.0 | 100.0 | 100.0 | 100.0 | 100.0 | 100 |
| Discharge of polluted wastewater into surface water bodies | 11.6 | 110.0 | 92.0 | 90.1 | 409.6 | 100.0 | 89.6 | 256.3 | 86.9 | 80.4 | ↑96.5 |
| Volumes of recycled and sequentially used water | 172.7 | 114.0 | 86.6 | 100.4 | 100.1 | 92.1 | 100.2 | 93.2 | 94.6 | 93.6 | ↑102.7 |
| 67.8 | 106.1 | 91.5 | 110.1 | 123.2 | 91.5 | 109.2 | 112.9 | 93.9 | 87.8 | ||
| Index of Change in | Year | Average Rate | |||||||||
|---|---|---|---|---|---|---|---|---|---|---|---|
| 2011 | 2012 | 2013 | 2014 | 2015 | 2016 | 2017 | 2018 | 2019 | 2020 | ||
| Total fertility rate | 100.0 | 108.5 | 100.0 | 99.3 | 99.3 | 95.7 | 85.6 | 93.8 | 89.6 | 97.9 | ↓96.8 |
| Crude death rate | 93.8 | 97.8 | 98.5 | 101.5 | 98.5 | 100.8 | 95.5 | 100.0 | 98.4 | 125.0 | ↓100.7 |
| Infant mortality rate | 151.4 | 90.6 | 91.7 | 75.0 | 97.0 | 100.0 | 137.5 | 68.2 | 70.0 | 166.7 | 100 |
| The total area of residential premises per inhabitant | 102.1 | 102.1 | 102.1 | 102.4 | 102.4 | 101.5 | 101.9 | 102.2 | 102.2 | 102.5 | ↑102.1 |
| Commissioning of residential buildings for 1000 people population | 101.7 | 92.5 | 102.6 | 103.3 | 96.7 | 75.6 | 96.3 | 99.4 | 110.5 | 88.5 | ↓96.2 |
| Morbidity per 1000 people population | 106.4 | 101.0 | 103.3 | 98.1 | 96.5 | 95.0 | 98.2 | 101.3 | 93.0 | 95.8 | ↑98.8 |
| 107.8 | 98.6 | 99.6 | 96 | 98.4 | 94.3 | 101.3 | 93.3 | 93 | 110 | 99.1 | |
| Index of Change in | Year | Average Rate | |||||||||
|---|---|---|---|---|---|---|---|---|---|---|---|
| 2011 | 2012 | 2013 | 2014 | 2015 | 2016 | 2017 | 2018 | 2019 | 2020 | ||
| Fixed assets at full book value per capita | 114.1 | 105.3 | 111.3 | 101.8 | 107.8 | 106.3 | 104.3 | 102.8 | 186.7 | 103.7 | ↑112.5 |
| Depreciation rates of fixed assets | 105.2 | 100.4 | 98.0 | 104.7 | 98.9 | 106.9 | 102.4 | 103.5 | 100.5 | 102.9 | ↓102.3 |
| Investment in fixed assets per capita | 130.6 | 118.0 | 92.4 | 89.0 | 104.4 | 90.2 | 104.4 | 108.5 | 116.5 | 80.6 | ↑102.4 |
| Use of global information networks | 102.6 | 101.4 | 102.0 | 99.1 | 96.0 | 104.4 | 98.5 | 102.3 | 101.8 | 99.2 | ↑100.7 |
| Organizations with a website | 111.1 | 112.4 | 105.9 | 97.6 | 108.9 | 104.8 | 100.3 | 103.9 | 103.2 | 71.8 | ↑101.3 |
| The number of students enrolled in bachelor’s, specialist’s, master’s programs per 1000 people population | 89.3 | 92.2 | 88.0 | 88.9 | 90.1 | 94.8 | 98.0 | 97.6 | 100.7 | 100.7 | ↓93.9 |
| 108.1 | 104.6 | 99.3 | 96.7 | 100.8 | 101 | 101.3 | 103 | 115 | 92.2 | 102 | |
| Index of Change In | Year | Average Rate | |||||||||
|---|---|---|---|---|---|---|---|---|---|---|---|
| 2011 | 2012 | 2013 | 2014 | 2015 | 2016 | 2017 | 2018 | 2019 | 2020 | ||
| Income of the consolidated budgets of the constituent entities of the Russian Federation (Chuvash Republic) per capita | 112.8 | 108.0 | 107.4 | 103.2 | 100.3 | 110.0 | 105.8 | 112.9 | 116.1 | 115.7 | ↑109.1 |
| Expenditures of the consolidated budgets of the constituent entities of the Russian Federation (Chuvash Republic) per capita | 105.7 | 114.5 | 105.6 | 107.5 | 99.0 | 99.7 | 110.8 | 108.1 | 111.4 | 124.0 | ↑108.4 |
| The share of unprofitable organizations | 97.3 | 111.2 | 94.3 | 99.0 | 98.6 | 104.5 | 101.3 | 104.2 | 87.6 | 107.4 | ↓100.3 |
| 105.1 | 111.2 | 102.3 | 103.2 | 99.3 | 104.7 | 105.9 | 108.3 | 104.2 | 115.5 | 105.9 | |
| 1 | Self-organized criticality is a property of dynamic systems to stabilize the development of a process in the presence of bifurcation points. Behavior in the vicinity of the point is characterized by the fact that, with a small perturbation, the system can pass the bifurcation point, completely changing its behavior model. |
References
- Attachment No 1 to the Summary Report on the Results of the Implementation of the RCP in 2013. n.d. Available online: https://minec.cap.ru/action/activity/soc-econom-razvitie/regionaljnie-programmi/gosudarstvennie-programmi-chuvashskoj-respubliki/realizaciya-gosudarstvennih-programm (accessed on 3 February 2022).
- Attachment No 1 to the Summary Report on the Results of the Implementation of the RCP in 2017. n.d. Available online: https://minec.cap.ru/action/activity/soc-econom-razvitie/regionaljnie-programmi/gosudarstvennie-programmi-chuvashskoj-respubliki/realizaciya-gosudarstvennih-programm (accessed on 16 July 2022).
- Beckert, Jens. 2013. Imagined futures: Fictional expectations in the economy. Theory and Society 42: 219–40. [Google Scholar] [CrossRef]
- Boyadjiev, Christo. 2019. Industrial processes stability modeling. Mathematical Modeling 3: 40–45. Available online: https://stumejournals.com/journals/mm/2019/2/40 (accessed on 13 May 2022).
- Center for Global Development. 2020. The Commitment to Development Index. Available online: https://www.cgdev.org/cdi#/ (accessed on 25 May 2022).
- Chen, Siyu, Fuquan Huang, and Wenjie Zeng. 2018. Comments on systematic methodologies of action research in the new millennium: A review of publications 2000–2014. Action Research 16: 341–60. [Google Scholar] [CrossRef]
- Decree of the Government of the Russian Federation of 11 October 2001 “On the Federal Target Program “Reducing Differences in the Socio-Economic Development of the Regions of the Russian Federation (2002–2010 and up to 2015)” (as Amended on October 20, 2006). n.d. Available online: http://government.ru/docs/all/40151/ (accessed on 14 March 2023).
- Decree of the Government of the Russian Federation of 25.09.2017 N 2039-r “On Approval of the “Strategy for Improving Financial Literacy in the Russian Federation for 2017–2023”. n.d. Available online: https://sudact.ru/law/rasporiazhenie-pravitelstva-rf-ot-25092017-n-2039-r/ (accessed on 27 May 2022).
- Decree of the Government of the Russian Federation of 29.03.2019 No. 377 (ed. from 31.03.2020) “On Approval of the State Program of the Russian Federation “Scientific and Technological Development of the Russian Federation”. n.d. Available online: https://base.garant.ru/72216664/ (accessed on 28 May 2022).
- Decree of the President of the Russian Federation No. 208 Dated 13.05.2017 “On the Strategy of Economic Security of the Russian Federation for the Period Up to 2030”. n.d. Available online: https://www.garant.ru/products/ipo/prime/doc/71572608/ (accessed on 15 May 2022).
- Decree of the President of the Russian Federation No. 259 of 20.04.2014 “On Approval of the Concept of the State Policy of the Russian Federation in the Field of International Development Assistance”. n.d. Available online: https://base.garant.ru/70640588/ (accessed on 14 August 2022).
- Decree of the President of the Russian Federation No. 640 Dated 30.11.2016 “On Approval of the Concept of Foreign Policy of the Russian Federation”. n.d. Available online: https://base.garant.ru/71552062/ (accessed on 19 June 2022).
- Feraru, G. S., and A. V. Orlova. 2014. Methodology for assessing the level of sustainable socio-economic development of regions. Modern Problems of Science and Education 1. Available online: https://science-education.ru/ru/article/view?id=12151 (accessed on 13 March 2023).
- FTP “Development of Measures to Support Producers and Processors of Agricultural Products in the Chuvash Republic on the Basis of Domestic Food Aid Mechanisms for 2013–2017”—Resolution of the Cabinet of Ministers of the Chuvash Republic Dated 30.05.2013 No 198. n.d. Available online: https://gov.cap.ru/laws.aspx?id=151664&gov_id=49&page=84&size=70 (accessed on 21 April 2022).
- FTP “Improving the Efficiency of Use and Development of the Resource Potential of the Fisheries Complex in 2009–2013”, Approved by the Decree of the Government of the Russian Federation Dated 07.05.2008 no. 681-R. n.d. Available online: https://docs.cntd.ru/document/902100693 (accessed on 26 July 2022).
- Girina, A. N. 2013. Methodology for assessing the socio-economic development of the region. Vestnik OGU 8: 82–87. [Google Scholar]
- Gungor, Afsin, Ali Özhan Akyüz, Ceylin Sirin, Azim Doğuş Tuncer, M. Zaman, and Canan Gungor. 2019. Importance of mathematical modeling in innovation. Mathematical Modeling 3: 32–34. Available online: https://stumejournals.com/journals/mm/2019/1/32 (accessed on 12 May 2022).
- Hilty, Lorenz M., and Bernard Aebischer. 2015. ICT Innovations for Sustainability. Berlin/Heidelberg, New York, Dordrecht and London: Springer. 470p. [Google Scholar]
- Ivanova, Tatiana, Anatoly Saiganov, Oleg Sorokin, Elvira Kuznetsova, and Svetlana Petrova. 2021. Methodology for assessing the rates of reproduction social infrastructure of agriculture. Paper presented at E3S Web of Conferences, Padang, Indonesia, September 30–October 1, vol. 291, p. 05035. [Google Scholar] [CrossRef]
- Ivanova, Tatiana, Evgeniy Kadyshev, Tatyana Ladykova, Svetlana Brenchagova, Viacheslav Nemtsev, and Anna Ivanova. 2022. Forecasting agricultural production as a tool for effective industry management (on the example of the Chuvash Republic). Smart Innovation, Systems and Technologies 247: 393–402. [Google Scholar] [CrossRef]
- Ladykova, T. I., and V. L. Bersenyov. 2018. Typology of macroeconomic parameters of population incomes. Economics of the Region 14: 380–94. [Google Scholar] [CrossRef]
- Lee, Seo-Jeong, Eung-Hyun Lee, and Deog-Seong Oh. 2017. Establishing the innovation platform for the sustainable regional development: Tech-valley project in sejong city, Korea. World Technopolis Review 6: 75–86. [Google Scholar]
- Lennert, J. 2018. Complex spatial modelling possibilities of the socio-economic changes of Hungary—Potential approaches and methods. Mathematical Modeling 2: 160–62. Available online: https://stumejournals.com/journals/mm/2018/4/160 (accessed on 10 May 2022).
- Liu, W., P. Ah-Kine, F. Bretz, and A. J. Hayter. 2013. Exact simultaneous confidence intervals for a finite set of contrasts of three, four or five generally correlated normal means. Computational Statistics & Data Analysis 57: 141–48. [Google Scholar] [CrossRef]
- Materials of the Central Statistics Office. 2021. National Accounts Statistics: Gross Domestic Product (GDP). Available online: https://www.drishtiias.com/daily-updates/daily-news-analysis/restructuring-of-indian-statistical-system (accessed on 13 March 2023).
- Materials of the Economic Policy Institute. 2020. The State of Working America. Available online: https://www.epi.org/data/ (accessed on 13 March 2023).
- Materials of the Federal Ministry for Economic Affairs and Energy. 2020. The German Economy—Spring 2020. Available online: https://www.bmwk.de/Navigation/EN/Home/home.html (accessed on 13 March 2023).
- Materials of the Federal State Statistics Service. 2020. Social and Economic Situation in Russia: Statistical Yearbook. Available online: https://eng.rosstat.gov.ru/Publications (accessed on 13 March 2023).
- Materials of the Federal State Statistics Service. n.d. Available online: https://rosstat.gov.ru/ (accessed on 15 May 2022).
- Materials of the French National Observatory on Poverty and Social Exclusion. 2020. The 2020 Annual Report. Available online: https://www.eapn.eu/wp-content/uploads/2020/10/EAPN-EAPN-France-Poverty-Watch-2020_EN_final-4706.pdf (accessed on 13 March 2023).
- Materials of the National Bureau of Statistics. 2021. China Statistical Yearbook. Available online: http://www.stats.gov.cn/tjsj/ndsj/2021/indexeh.htm (accessed on 13 March 2023).
- Materials of the Social Metrics Commission. 2020. The 2020 Report. Available online: https://socialmetricscommission.org.uk/social-metrics-commission-2020-report/ (accessed on 13 March 2023).
- Materials of the Statistics Bureau of Japan. 2021. Japan Statistical Yearbook. Available online: https://www.stat.go.jp/english/data/nenkan/index.html (accessed on 13 March 2023).
- Methods of Analysis and Forecasting of Socio-Economic Development of Regions Center for Social and Economic Problems of Federalism of the Institute of Economics of the Russian Academy of Sciences. n.d. Available online: https://inecon.org/institut/struktura-instituta/czentr-federativnyx-otnoshenij-i-regionalnogo-razvitiya.html#1 (accessed on 20 February 2023).
- Ministry of Agriculture of Russia. 2006. FTP “Preservation and Restoration of Soil Fertility of Agricultural Lands and Agricultural Landscapes as the National Heritage of Russia for 2006–2010 and for the Period Up to 2013”, Approved by Decree of the Government of the Russian Federation No. 99 dated 02/20/2006 (with Amendments and Additions). Available online: https://base.garant.ru/2160945 (accessed on 7 June 2022).
- Ministry of Agriculture of Russia. 2013. FTP “Social Development of the Village until 2013”, Approved by the Decree of the Government of the Russian Federation Dated 03.12.2002 No. 858 (as amended on 15.07.2013). Available online: https://docs.cntd.ru/document/901834635 (accessed on 19 July 2022).
- National Project “Digital Economy of Russia” The Government of the Russian Federation Has Formed the National Program “Digital Economy of the Russian Federation”, Approved by the Minutes of the Meeting of the Presidium of the Council under the President of the Russian Federation on Strategic Development and National Projects Dated 04.06.2019 No. 7. n.d. Available online: https://strategy24.ru/rf/management/projects/natsional-nyy-proyekt-tsifrova-ekonomika (accessed on 15 September 2022).
- National Project “Ecology”. 2018. Available online: https://www.mnr.gov.ru/activity/directions/natsionalnyy_proekt_ekologiya/ (accessed on 11 June 2022).
- Njøs, Rune, and Stig-Erik Jakobsen. 2016. Cluster policy and regional development: Scale, scope and renewal. Regional Studies, Regional Science 3: 146–69. [Google Scholar] [CrossRef]
- Official Internet Portal of Legal Information. 2013. Decree of the Government of the Russian Federation of 21.05.2013 No. 426 (ed. of 01.12.2020) “On the Federal Target Program “Research and Development in Priority Areas of Development of the Scientific and Technological Complex of Russia for 2014–2021”. Available online: http://www.pravo.gov.ru (accessed on 5 June 2022).
- Orlov, Victor, Tatiana Ivanova, Evgeniy Kadyshev, Tatyana Chernyshova, Aleksandr Prokopiev, and Anna Ivanova. 2022a. Mathematical modeling in fore-casting reproduction processes in agriculture. In Lecture Notes in Networks and Systems, XIV International Scientific Conference “INTERAGROMASH 2021”. Cham: Springer, vol. 246, pp. 330–38. [Google Scholar] [CrossRef]
- Orlov, Victor, Tatiana Ivanova, Galina Sokolova, Valentina Arkhipova, and Anna Ivanova. 2021. Assessment of innovative development of the Russian economy and mathematical modelling. Paper presented at VIII International Scientific and Practical Conference «Current Problems of Social and Labor Relations (ISPC-CPSLR 2020): Advances in Social Science, Education and Humanities Research, Makhachkala, Russia, December 17–18; Amsterdam: Atlantis Press, vol. 527, pp. 501–7. [Google Scholar] [CrossRef]
- Orlov, Victor, Tatyana Ivanova, Tatyana Ladykova, and Galina Sokolova. 2022b. Mathematical modeling and methodology for assessing the pace of socio-economic development of the Russian Federation. Mathematics 10: 1869. [Google Scholar] [CrossRef]
- Passport of the Federal Project “Clean Water” (Appendix to the Minutes of the Meeting of the Project Committee on the National Project “Ecology” dated 21.12.2018 No. 3). n.d. Available online: https://base.garant.ru/72727218/ (accessed on 19 August 2022).
- Passport of the Federal Project “Digital Public Administration” (Approved by the Presidium of the Government Commission on Digital Development, the Use of Information Technologies to Improve the Quality of Life and Business Conditions). n.d. Available online: https://base.garant.ru/72302270/ (accessed on 17 August 2022).
- Passport of the National Project “Demography” (Approved by the Presidium of the Council under the President of the Russian Federation for Strategic Development and National Projects, Protocol No. 16 dated 12/24/2018) (Implementation Dates 01.01.2019–12/31/2024). n.d. Available online: https://mintrud.gov.ru/uploads/editor/f4/a3/HП_Дeмогpaφия.pdf (accessed on 12 March 2022).
- Passport of the National Project “Healthcare” (Approved by the Presidium of the Council under the President of the Russian Federation for Strategic Development and National Projects, Protocol No. 16 dated 12/24/2018). n.d. Available online: http://government.ru/rugovclassifier/831/events/ (accessed on 23 May 2022).
- Passport of the National Project “Small and Medium-Sized Entrepreneurship and Support for Individual Entrepreneurial Initiative”, Approved by the Presidium of the Council under the President of the Russian Federation for Strategic Development and National Projects dated 12/24/2018, Protocol No. 16. n.d. Available online: http://government.ru/info/35563/ (accessed on 6 March 2022).
- Pedanov, B. B. 2004. System of criteria for assessing the socio-economic development of municipalities. In Economics and Management in Modern Conditions. Materials of the All-Russian Scientific-Practical Conference. Krasnoyarsk: SIBUP. 265p. [Google Scholar]
- Poly, M., D. Ellenberger, and E. Brunner. 2015. Analysis of multidimensional structures with repeated measurements of one group. Statistics 49: 1243–61. [Google Scholar] [CrossRef]
- Portal of the Authorities of the Chuvash Republic—On the Implementation of National Projects in the Chuvash Republic. n.d. Available online: https://np.cap.ru/ (accessed on 12 September 2022.).
- Register of Strategic Planning Documents. n.d. Available online: http://gasu.gov.ru/stratplanning (accessed on 17 February 2021).
- Reichardt, Charles S. 2022. The counterfactual definition of a program effect. American Journal of Evaluation 43: 158–74. [Google Scholar] [CrossRef]
- Resolution of the Cabinet of Ministers of the Chuvash Republic Dated 10.05.2012 N 180 “On Approval of the Methodology for Evaluating the Effectiveness of State Programs of the Chuvash Republic”. n.d. Available online: https://minec.cap.ru/action/activity/soc-econom-razvitie/regionaljnie-programmi/normativnaya-pravovaya-baza/postanovlenie-kabineta-ministrov-chuvashskoj-respu-1 (accessed on 23 July 2022).
- Resolution of the Government of the Russian Federation of 15.04.2014. N 296 “On Approval of the State Program of the Russian Federation “Social Support of Citizens” (as amended on 27.01.2022). n.d. Available online: https://docs.cntd.ru/document/499091783 (accessed on 6 August 2022).
- Resolution of the Government of the Russian Federation of 15.04.2014 N 313 (ed. of 16.12.2020) “On Approval of the State Program of the Russian Federation “Information Society” (with Amendments and Additions, Entered into Force on 26.12.2020). n.d.Collection of Legislation of the Russian Federation”, 05.05.2014, no. 18 (Part II), Article 2159 Available online: https://base.garant.ru/70644220/ (accessed on 13 September 2022).
- Resolution of the Government of the Russian Federation of 15.04.2014 N 320 (ed. of 30.12.2020) “On Approval of the State Program of the Russian Federation “Public Finance Management and Regulation of Financial Markets”. n.d.Collection of Legislation of the Russian Federation”, 05.05.2014, no. 18 (Part III), Article 2166 Available online: https://base.garant.ru/70644234/ (accessed on 29 May 2022).
- Resolution of the Government of the Russian Federation of 15.04.2014. N 326 (ed. of 12.11.2020) “On Approval of the State Program of the Russian Federation “Environmental Protection”. n.d. Collection of Legislation of the Russian Federation”, 05.05.2014, N 18 (part III), Article 2171. Available online: https://www.mnr.gov.ru/upload/iblock/3ac/Gosprogramma_OOS.pdf (accessed on 12 June 2022).
- Resolution of the Government of the Russian Federation of 25.08.2017 N 996 (ed. of 28.05.2020) “On Approval of the Federal Scientific and Technical Program for the Development of agriculture for 2017–2025”. n.d.Collection of Legislation of the Russian Federation”, 04.09.2017, N 36, Article 5421 Available online: https://base.garant.ru/71755402/ (accessed on 9 August 2022).
- Resolution of the Government of the Russian Federation of 20.12.2017 N 1596 (ed. of 28.09.2020) “On Approval of the State Program of the Russian Federation “Development of the Transport System”. n.d.Collection of Legislation of the Russian Federation”, 01.01.2018, N 1 (Part II), Article 340 Available online: https://base.garant.ru/71843998/ (accessed on 7 September 2022).
- Resolution of the Government of the Russian Federation of 26.12.2017 N 1642 (ed. of 11.06.2019) “On Approval of the State Program of the Russian Federation “Development of Education”. n.d.Collection of Legislation of the Russian Federation”, 01.01.2018, N 1 (Part II), Article 375 Available online: https://base.garant.ru/71848426/ (accessed on 18 August 2022).
- Resolution of the Government of the Russian Federation of 05/31/2019 No. 696 (ed. of 12/30/2020) “On Approval of the State Program of the Russian Federation “Integrated Development of Rural Areas” and on Amendments to Certain Acts of the Government of the Russian Federation”. n.d.Collection of Legislation of the Russian Federation”, 06/10/2019, No. 23, art. 2953 Available online: https://base.garant.ru/72260516/ (accessed on 2 September 2022).
- Resolution of the Government of the Russian Federation of December 30, 2017 N 1710 “On Approval of the State Program of the Russian Federation “Provision of Affordable and Comfortable Housing and Communal Services to Citizens of the Russian Federation” (with Amendments and Additions, Intro. Effective from 01.01.2018). n.d. Available online: https://base.garant.ru/71849506/ (accessed on 28 April 2022).
- Samarina, V. P. 2008. Features of assessing the uneven socio-economic development of regions. Problems of Modern Economics 1: 300–4. [Google Scholar]
- Shall we Accelerate the Economy? Tasks of the Government of the Russian Federation for 2020: Broadcast by REGNUM News Agency on 25 December 2019. n.d. Available online: https://regnum.ru/news/polit/2817425.html (accessed on 3 March 2023).
- Shani, Abraham B., and David Coghlan. 2019. Action research in business and management: A reflective review. Action Research 19: 518–41. [Google Scholar] [CrossRef]
- Skuf’Ina, T., and S. Baranov. 2005. Socio-economic forecasting: Problems of science and teaching. Questions of Economics 3: 41–48. [Google Scholar]
- The Action Plan “Transformation of the Business Climate” Approved by the Decree of the Government of the Russian Federation No. 20-r dated 17.01.2019. n.d. Available online: https://www.garant.ru/products/ipo/prime/doc/72051084/ (accessed on 22 February 2022).
- The Concept of Increasing the Efficiency of Budget Expenditures in 2019–2024, Approved by the Decree of the Government of the Russian Federation of 31.01.2019 No. 117-r. n.d. Available online: https://www.garant.ru/products/ipo/prime/doc/72064730/ (accessed on 21 June 2022).
- The Passport of the National Project “Housing and Urban Environment” Was Developed by the Ministry of Construction of the Russian Federation Pursuant to the Decree of the President of the Russian Federation Dated 7 May 2018 No. 204 “On National Goals and Strategic Objectives of the Development of the Russian Federation for the Period Up to 2024” (Implementation period: October 2018–2024 Inclusive). n.d. Available online: https://www.minstroyrf.gov.ru/trades/natsionalnye-proekty/natsionalnyy-proekt-zhilye-i-gorodskaya-sreda/ (accessed on 6 July 2022).
- Yoon, Donghun. 2017. The regional-innovation cluster policy for R&D efficiency and the creative economy: With focus on daedeok innopolis. Journal of Science and Technology Policy Management 8: 206–26. [Google Scholar]

| Indicator | Country | Total | |||||||
|---|---|---|---|---|---|---|---|---|---|
| USA | Great Britain | France | Germany | Russia | China | Japan | India | ||
| GDP per capita | + | + | + | + | 4 | ||||
| Poverty rate | + | + | + | + | + | + | + | + | 8 |
| Unemployment rate | + | + | + | + | + | + | + | + | 8 |
| Income inequality | + | + | + | + | + | + | + | + | 8 |
| The level of education | + | + | + | + | + | + | + | + | 8 |
| Access to health care and its outcomes | + | + | + | + | + | + | + | + | 8 |
| Housing affordability | + | + | + | 3 | |||||
| Racial and ethnic inequality | + | 1 | |||||||
| Regional inequality | + | + | + | + | + | + | + | 7 | |
| Environmental quality | + | + | + | + | + | 5 | |||
| GDP growth | + | + | + | + | 4 | ||||
| Total | 8 | 8 | 8 | 8 | 8 | 8 | 8 | 8 | 64 |
| The Purpose of the Development and Application of the Methodology | The Content of the Methodology | Author of the Methodology |
|---|---|---|
| Determining the degree of need for regions in additional funding | The assessment methodology includes thirteen basic indicators characterizing the production, investment and budgetary potential of the region | (Decree of the Government of the Russian Federation of 11 October 2001 “On the Federal Target Program “Reducing Differences in the Socio-Economic Development of the Regions of the Russian Federation (2002–2010 and up to 2015)” (as Amended on October 20, 2006) n.d.) |
| Assessment of the degree of interregional differentiation of regions | Developed on the basis of a methodology approved by the Decree of the Government of the Russian Federation, but contains nine indicators, one of which has been replaced | (Skuf’Ina and Baranov 2005) |
| Elimination of unevenness in the levels of socio-economic development of regions | The methodology uses only five of the nine main indicators used by Baranov S.V. and Skufina T.P. | (Samarina 2008) |
| Evaluation of the effectiveness of managing the socio-economic development of the region | The author uses indicators characterizing the economic, financial and social sphere of the region | (Pedanov 2004) |
| Analysis and forecasting of socio-economic development of regions | The methodology consists of a wide range of indicators characterizing the standard of living of the population | (Methods of Analysis and Forecasting of Socio-Economic Development of Regions Center for Social and Economic Problems of Federalism of the Institute of Economics of the Russian Academy of Sciences n.d.) |
Disclaimer/Publisher’s Note: The statements, opinions and data contained in all publications are solely those of the individual author(s) and contributor(s) and not of MDPI and/or the editor(s). MDPI and/or the editor(s) disclaim responsibility for any injury to people or property resulting from any ideas, methods, instructions or products referred to in the content. |
© 2023 by the authors. Licensee MDPI, Basel, Switzerland. This article is an open access article distributed under the terms and conditions of the Creative Commons Attribution (CC BY) license (https://creativecommons.org/licenses/by/4.0/).
Share and Cite
Ladykova, T.; Ivanova, T.; Streltsov, V.; Sayganov, A.; Ladykova, E. Methodological Approach to Assessment Socio-Economic Development of the Chuvash Republic (Subject of the Russian Federation). Economies 2023, 11, 176. https://doi.org/10.3390/economies11070176
Ladykova T, Ivanova T, Streltsov V, Sayganov A, Ladykova E. Methodological Approach to Assessment Socio-Economic Development of the Chuvash Republic (Subject of the Russian Federation). Economies. 2023; 11(7):176. https://doi.org/10.3390/economies11070176
Chicago/Turabian StyleLadykova, Tatyana, Tatyana Ivanova, Viktor Streltsov, Anatoly Sayganov, and Ekaterina Ladykova. 2023. "Methodological Approach to Assessment Socio-Economic Development of the Chuvash Republic (Subject of the Russian Federation)" Economies 11, no. 7: 176. https://doi.org/10.3390/economies11070176
APA StyleLadykova, T., Ivanova, T., Streltsov, V., Sayganov, A., & Ladykova, E. (2023). Methodological Approach to Assessment Socio-Economic Development of the Chuvash Republic (Subject of the Russian Federation). Economies, 11(7), 176. https://doi.org/10.3390/economies11070176


