Article

Inflation Spillovers among Advanced and Emerging Economies: Evidence from the G20 Group

by
Nassar S. Al-Nassar
* and
Abdulrahman A. Albahouth
Department of Economics and Finance, College of Business and Economics, Qassim University, Buraydah 52571, Saudi Arabia
*
Author to whom correspondence should be addressed.
Economies 2023, 11(4), 126; https://doi.org/10.3390/economies11040126
Submission received: 7 March 2023 / Revised: 8 April 2023 / Accepted: 15 April 2023 / Published: 20 April 2023
(This article belongs to the Special Issue International Financial Markets and Monetary Policy 2.0)

Abstract

:
The influence of recent global shocks such as the COVID-19 pandemic and the Russian–Ukrainian war on the variability of major macroeconomic trends not only shows synchronized behavior across economies but also induces similar policy responses to counter these shocks. The purpose of this article is to explore the transmission of inflation among the G20 economies and evaluate its contribution to domestic inflation. To this end, we use the Diebold and Yilmaz spillover approach. The results that emerge from unconditional analysis reveal stark dissimilarities in inflation spillover patterns between advanced and emerging economies. Advanced economies are subject to higher spillover rates and thereby more exposed to global shocks compared to their emerging counterparts. Inflation in emerging countries is mainly derived from idiosyncratic shocks, while global shocks have only a modest influence on domestic inflation. In addition, bilateral spillovers among the G20 members show that the average pairwise directional spillovers between emerging economies are lower compared to advanced economies. The results pertaining to the spillover dynamics, on the other hand, show that total inflation spillover has a clear upward trend, indicating that the overall interconnectedness between G20 countries is increasing over time. Moreover, the estimates of spillover dynamics show a growing influence of received inflation spillovers from external shocks in both advanced and emerging economies. Policymakers in advanced economies are expected to respond to global shocks to mitigate the influence of spillovers, which is essential for economies that display high spillovers and turn out to be net receivers of shocks. However, public agencies in emerging economies should concentrate more on internal shocks to control inflation while not ignoring global shocks.

1. Introduction

The recent coronavirus pandemic (COVID-19) and the ongoing Russian–Ukrainian war have spurred an unprecedented inflationary wave across the globe. Indeed, inflation rates reached two-digit territory in advanced economies, while nearly three-digit inflation was recorded in some emerging economies. These staggering inflation figures are due to multiple factors. Among these factors are the stimulus packages enacted by governments to mitigate the negative social and economic consequences of the pandemic. While these stimulus packages were successful in alleviating economic struggles and the slowdown in economic growth (Gourinchas et al. 2021; Jackson et al. 2020; Romer 2021; Walmsley et al. 2023), these packages were, in part, responsible for the post-pandemic inflation in the US (Agarwal and Kimball 2022; Jordà et al. 2022; Summers 2021).
The government-imposed lockdowns and precautionary measures aimed at halting the spread of the virus have also caused disruptions to both the demand and supply sides, creating significant demand–supply imbalances (di Giovanni et al. 2022; Shapiro 2022). The shock in aggregate demand was primarily due to the shift in consumption from services to goods, which inflated prices in the goods sector (Baqaee and Farhi 2022; di Giovanni et al. 2022; NU CEPAL 2022). Moreover, di Giovanni et al. (2022) showed that almost two-thirds of the US post pandemic and half of the observed inflation in the Euro area were derived from demand-side shocks. Supply-side shocks, on the other hand, play a major role in current inflation. The so-called “supply chain bottlenecks”, due to shortages in one or more factors of production, have led to a decline in production levels, which in turn inflated the prices in the goods sector (di Giovanni et al. 2022; LaBelle and Santacreu 2022). Most notable shortages are experienced in semi-conductors (Leibovici and Dunn 2021) and the drop in the growth rate of hours worked (Baqaee and Farhi 2022; Domash and Summers 2022). Domash and Summers (2022) and Shapiro (2022) argued that labor market tightness is a major contributor to the inflationary pressures in the US and will continue to be in the foreseeable future.
The Russian–Ukrainian war has also put further pressure on inflation and inflation expectations (Azad et al. 2021; Dräger et al. 2022; Ropele and Tagliabracci 2022). The sanctions imposed on the Russian economy forbade Europe from the cheapest available source of consumed energy, leading to substantial inflation increases in the Euro area. Furthermore, the oil supply shock coincided with the continued decline in production of major shale oil fields in the US. The US Energy Information Administration (EIA) reported a decline in energy production in major regions compared to the production levels prior to the pandemic.1 Moreover, the fluctuation of oil prices and both oil price uncertainty and economic policy uncertainty undermine the investment of oil firms (Ilyas et al. 2021), leading to a reduction in energy supplies. The resultant shortages in energy supplies, ultimately, exacerbated pressure on oil prices when demand rebounded after the pandemic.
What aggravates the problem is that the ability of central banks to efficiently and independently control for high post-COVID-19 inflation remains uncertain.2 The factors mentioned earlier, including supply chain disruptions and oil supply shock leave national economies exposed to external global factors. Suffice to say, these factors have a direct impact on domestic inflation. Concern appears when policymakers overestimate the effectiveness of the national policy tools without paying enough attention to the external factors (Ciccarelli and Mojon 2010). In such cases, fluctuations in macroeconomic variables triggered by external shocks exacerbate domestic variability. If the business cycles synchronize with the world’s common factors, then macroeconomic policies formulated to stabilize sudden shocks from external factors might be ineffective (Kose et al. 2003).
Indeed, business cycle synchronization, coupled with the limits of national monetary policies, intensifies the need for a detailed analysis of the transmission mechanism of inflation across different countries. Several studies have investigated the common shocks and their associated cyclical co-movements in inflation among other macroeconomic variables across different countries using various modeling techniques, including Neely and Rapach (2011) and Aastveit et al. (2016), among others.3 Tiwari et al. (2015) focussed on the synchronization of inflation rates. Using wavelet coherency and the Diebold and Yilmaz (2012) (DY) spillover measurement approach, they showed that inflation co-movements are multi-scale in nature and vary across frequencies (short-term, medium-term, and long-term). The short-term scale represents deflation that originates from common shocks, while the synchronized policy responses from the G7 group to such shocks were responsible for inducing long term co-movements. Hałka and Szafranek (2016) also used the DY model to assess the spillovers between large and small economies in Europe and observed that large economies transmit deflationary pressures to smaller economies stemming from nonenergy industrial goods and services. Istiak et al. (2021) used the frequency domain analysis proposed by Baruník and Křehlík (2018) to estimate inflation rate spillovers in the short, medium, and long term and found that the inflation spillover index of the G7 countries varies across different terms. Furthermore, they found that both the United States and Japan were the sources and main transmitters of inflation. Their findings show that Japan turned out to be net transmitter in the medium-run, and both Japan and the US were the sources and the main transmitters of inflation in the long run. Istiak et al. (2021) posited that macroeconomic policies to fight inflation have limited influence in the short and medium run, and the focus of policy makers should be to mitigate the influence of inflation spillovers in the long run.
Pham and Sala (2022) also employed the DY spillover approach to examine the cross-country connectedness using the inflation rate and unemployment of the G7 plus Spain and showed that prices across these countries are more connected than unemployment, and the co-movement of these macroeconomic variables is magnified during turmoil. They also identified asymmetries per country that result in higher short-run inflation-unemployment trade-offs (Phillips curve) in recessions and lower trade-offs in expansions. Aharon and Qadan (2022) evaluated inflation spillovers across the G7 group using the time-varying parameter vector autoregressive model (TVP-VAR). They showed that the US is the main contributor, while Italy has the highest absorption rate of inflation spillovers. Their analysis showed that the influence of spillovers is magnified during market crises such as the GFC in 2008 and the European debt crisis in 2011. Interestingly, the inflation rate of Japan and Germany majorly stemmed from idiosyncratic shocks. Hall et al. (2023) investigated the drivers and inflation spillover effect between the US, the Euro area, and England using the VAR model to calculate shocks and spatial modeling to estimate spillovers. Their findings showed that the inflationary shocks in the US are transmitted to the other regions in a powerful and consistent manner, the Euro area has a lesser effect and an inconsistent influence, while England has the lowest transmission rate over the sample. Thus, prior work, using different modeling techniques, showed the growing influence of inflation spillover on domestic inflation. These studies also emphasize the role of global economic events in magnifying spillovers across economies.
Based on the studies cited above, it is clear that emphasis was placed on inflation spillovers across major countries (namely, the G7 countries); however, the presence and the extent of such co-movements among emerging economies remain largely untapped. While inflation rates in advanced countries show high connectedness and synchronized co-movements, this conclusion may not be generalized to less advanced economies due to the nature of emerging economies. The features that set emerging economies apart from their advanced counterparts include the relatively lower degree of international trade openness (Jafari Samimi et al. 2012; Kwark and Lim 2020; Watson 2016); the adopted exchange rate regime (for example, fixed peg arrangements) that impede the effectiveness of monetary policy (Bhatti and Al-Nassar 2021; Calvo and Mishkin 2003; Ebeke and Fouejieu 2018; Su et al. 2019; Yamada 2013); the relatively lower level of financial market liberalization (Alotaibi and Mishra 2017; Gelos and Sahay 2001; Kim and Rogers 1995); the seriousness of efforts to reduce subsidies and dismantle price control (Moshashai et al. 2020; Ogarenko and Hubacek 2013; Sdralevich et al. 2014); and the ability to control country-specific shocks that ultimately have influence on macroeconomic variables (Caselli and Roitman 2019; Mishkin 2004). Thus, the inclusion of emerging economies to the system enriches our understanding of inflation spillover effects by revealing any dissimilarities in this respect between advanced and emerging economies. Most importantly, it enables us to determine whether the fluctuation in inflation is derived from idiosyncratic or global shocks, and whether emerging economies are transmitters or absorbers of spillovers.
To this end, we aim to evaluate the magnitude and direction of the inflation spillover between the G20 countries using the DY model. Our choice stems from the unique features of the DY model that enable us to quantify the transmission of inflation among advanced and emerging economies and determine whether emerging economies are net receivers or net transmitters of inflation. Examining the G20, which comprises the largest advanced and emerging economies, spanning different regions, provides enhancements to earlier work by allowing us to find out how common shocks and their associated inflation spillovers are transmitted among both advanced and emerging economies. In addition, the versatility of this modeling technique also enables us to track the evolution of inflation spillovers dynamically, thereby offering valuable insights on the impact of various shocks on the inflation transmission mechanism.
The results that emerge from the unconditional analysis show that advanced G20 economies have high connectedness and are more exposed to global shocks compared to their emerging counterparts. However, inflation fluctuations in emerging economies stemmed mostly from idiosyncratic shocks, while global shocks had a modest influence on their domestic inflation. Furthermore, emerging economies are mainly net receivers of spillovers rather than net transmitters, and their contributions to total spillovers are lower compared to their advanced counterparts. The pairwise directional spillover results between G20 economies show that advanced economies have strong bilateral connectedness, while spillovers coming from and transmitted to emerging economies exhibit weak bilateral connectedness among each other and also with advanced economies. On the other hand, the results based on spillover dynamic analysis show that total inflation spillover has a clear upward trend, indicating that the overall interconnectedness between G20 countries is increasing over time. Furthermore, estimates of spillover dynamics show a growing influence of received inflation spillovers from external shocks in the domestic economies of both advanced and emerging economies.
The rest of the paper is organized as follows: Section 2 describes the Diebold and Yilmaz (2012) approach that we employ to estimate inflation spillovers across the G20 members. Section 3 describes the data set and provides summary statistics and preliminary tests. Section 4 presents the results of unconditional and conditional inflation spillover analyses. Section 5 concludes the paper by offering policy implications, and suggestions for future research.

2. Methodology

Following Pham and Sala (2022) and Istiak et al. (2021), we employed the Diebold and Yilmaz (2012) spillover measurement approach to gauge the total, directional and net inflation spillovers. To this end, we specify a covariance stationary N-variable VAR(p) model as follows:
Π t = Φ 1 Π t 1 + Φ 2 Π t 2 + + Φ p Π t p + ε t
where Π t = ( π t , 1 , π t , 2 , , π t , N ) is an N-dimensional vector representing monthly inflation rates of the N-countries in present study, Φ is a matrix of dynamic parameters and ε ~ ( 0 , Σ ) is a vector of independently and identically distributed disturbances. Exploiting the generalized VAR framework of Koop et al. (1996) and Pesaran and Shin (1998), Diebold and Yilmaz (2012) were able to use variance decompositions that are invariant to ordering whereby the H-step-ahead forecast error variance decomposition is calculated as
θ i j g H = σ j j 1 h = 0 H 1 ( e i A h Σ e j ) 2 h = 0 H 1 ( e i A h Σ A h e i )
where Σ is the variance matrix for the error vector ε , A h is the parameter matrix that multiplies the h-lagged error in the infinite moving-average representation of the nonorthogonal VAR, σ j j is the standard deviation of the error term of the jth equation, and e i is the selection vector whose i th element is 1 and 0 for the remaining elements.
Because the sum of elements in each row of the variance decomposition table is not equal to 1: j = 1 N θ i j g H 1 under the generalized decomposition, the row sum is used to normalize each element of the variance decomposition matrix as
θ ~ i j g H = θ i j g H j = 1 N θ i j g H
where j = 0 N θ ~ i j g H = 1 and i j = 0 N θ ~ i j g H = N by construction. Based on variance decomposition, the total inflation spillover index is obtained using the ratio of contribution of spillovers of inflation shocks across the G20 member countries included in the system to the total forecast error variance as
S g H = i , j = 1 i j N θ ~ i j g H i , j = 1 N θ ~ i j g H × 100 = i , j = 1 i j N θ ~ i j g H N × 100
In essence, the total spillover index measures the average contribution of spillovers of inflation shocks to G20 member countries to the total forecast error variance. Moreover, based on the generalized VAR framework, we can measure the directional inflation spillovers across the G20 member countries whereby directional inflation spillovers received by country i from all other countries j is calculated as
S i g H = i , j = 1 i j N θ ~ i j g H i , j = 1 N θ ~ i j g H × 100 = i , j = 1 i j N θ ~ i j g H N × 100
By the same token, the directional inflation spillovers transmitted by country i to all other countries j is calculated as
S i g H = i , j = 1 i j N θ ~ j i g H i , j = 1 N θ ~ j i g H × 100 = i , j = 1 i j N θ ~ j i g H N × 100
Finally, net inflation spillovers through which we can ascertain whether a country is a source or a recipient of spillover on a net basis are computed by subtracting equation from equation as
S i g H = S i g H S i g H

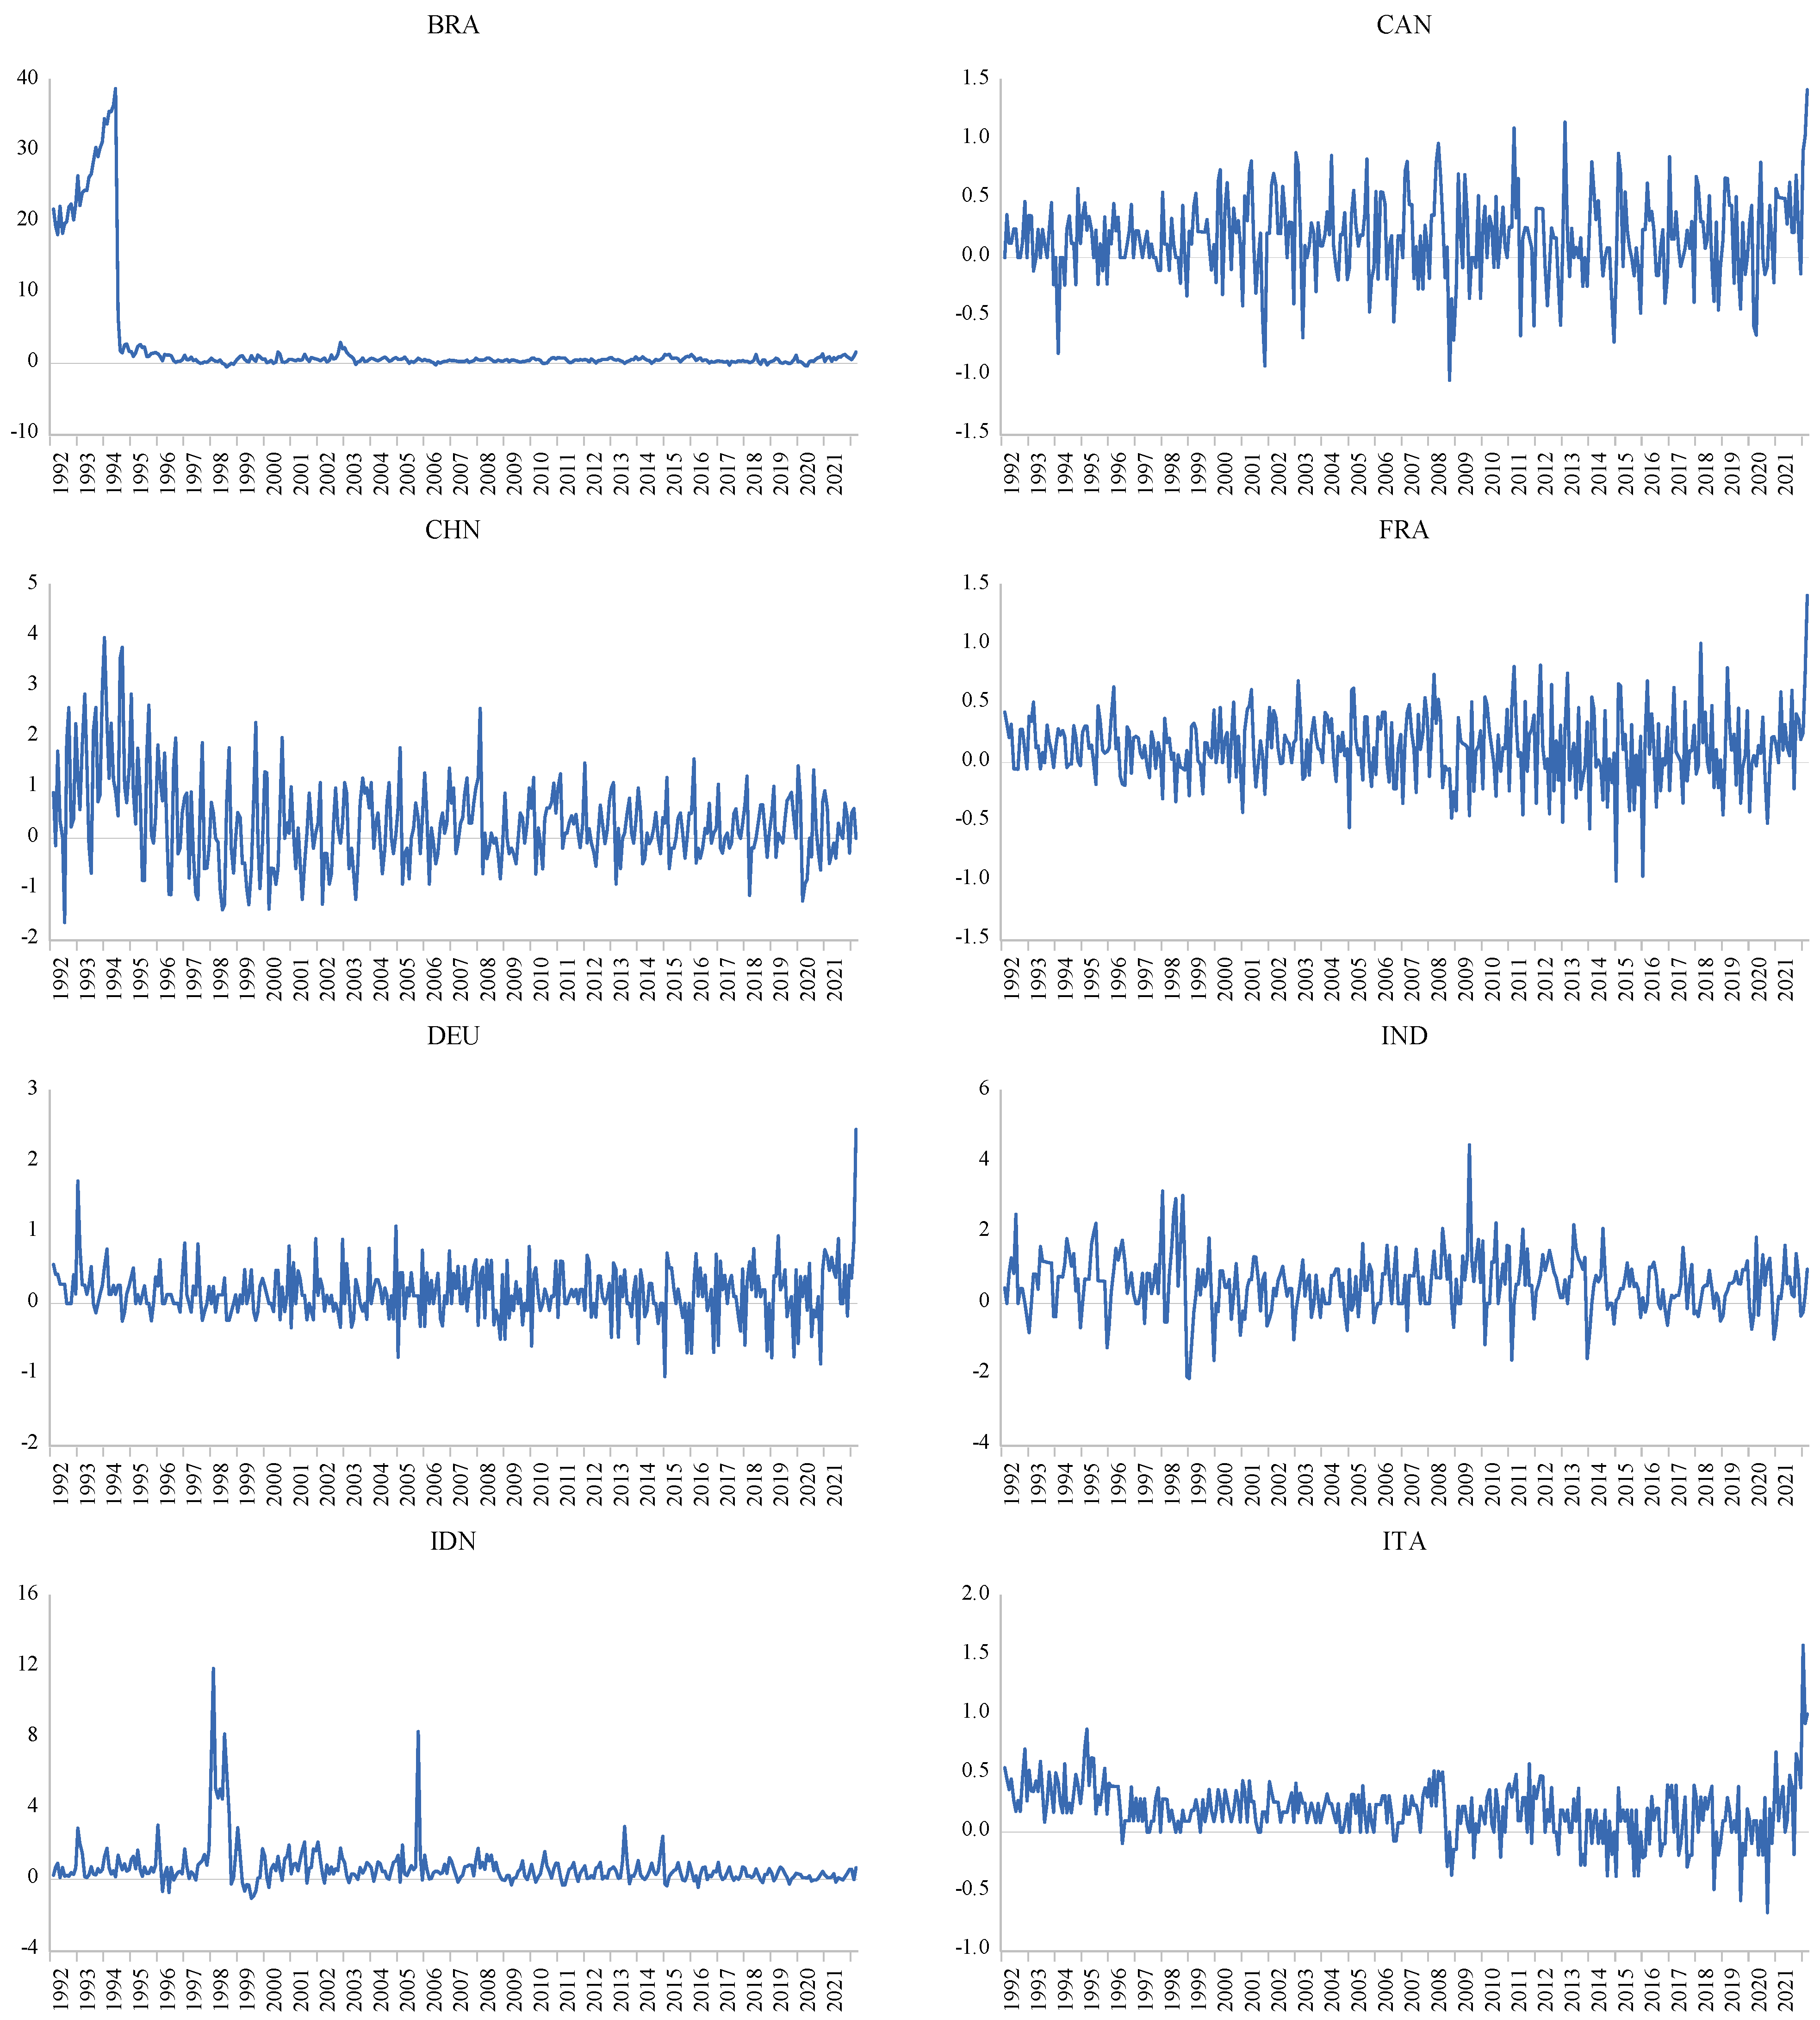
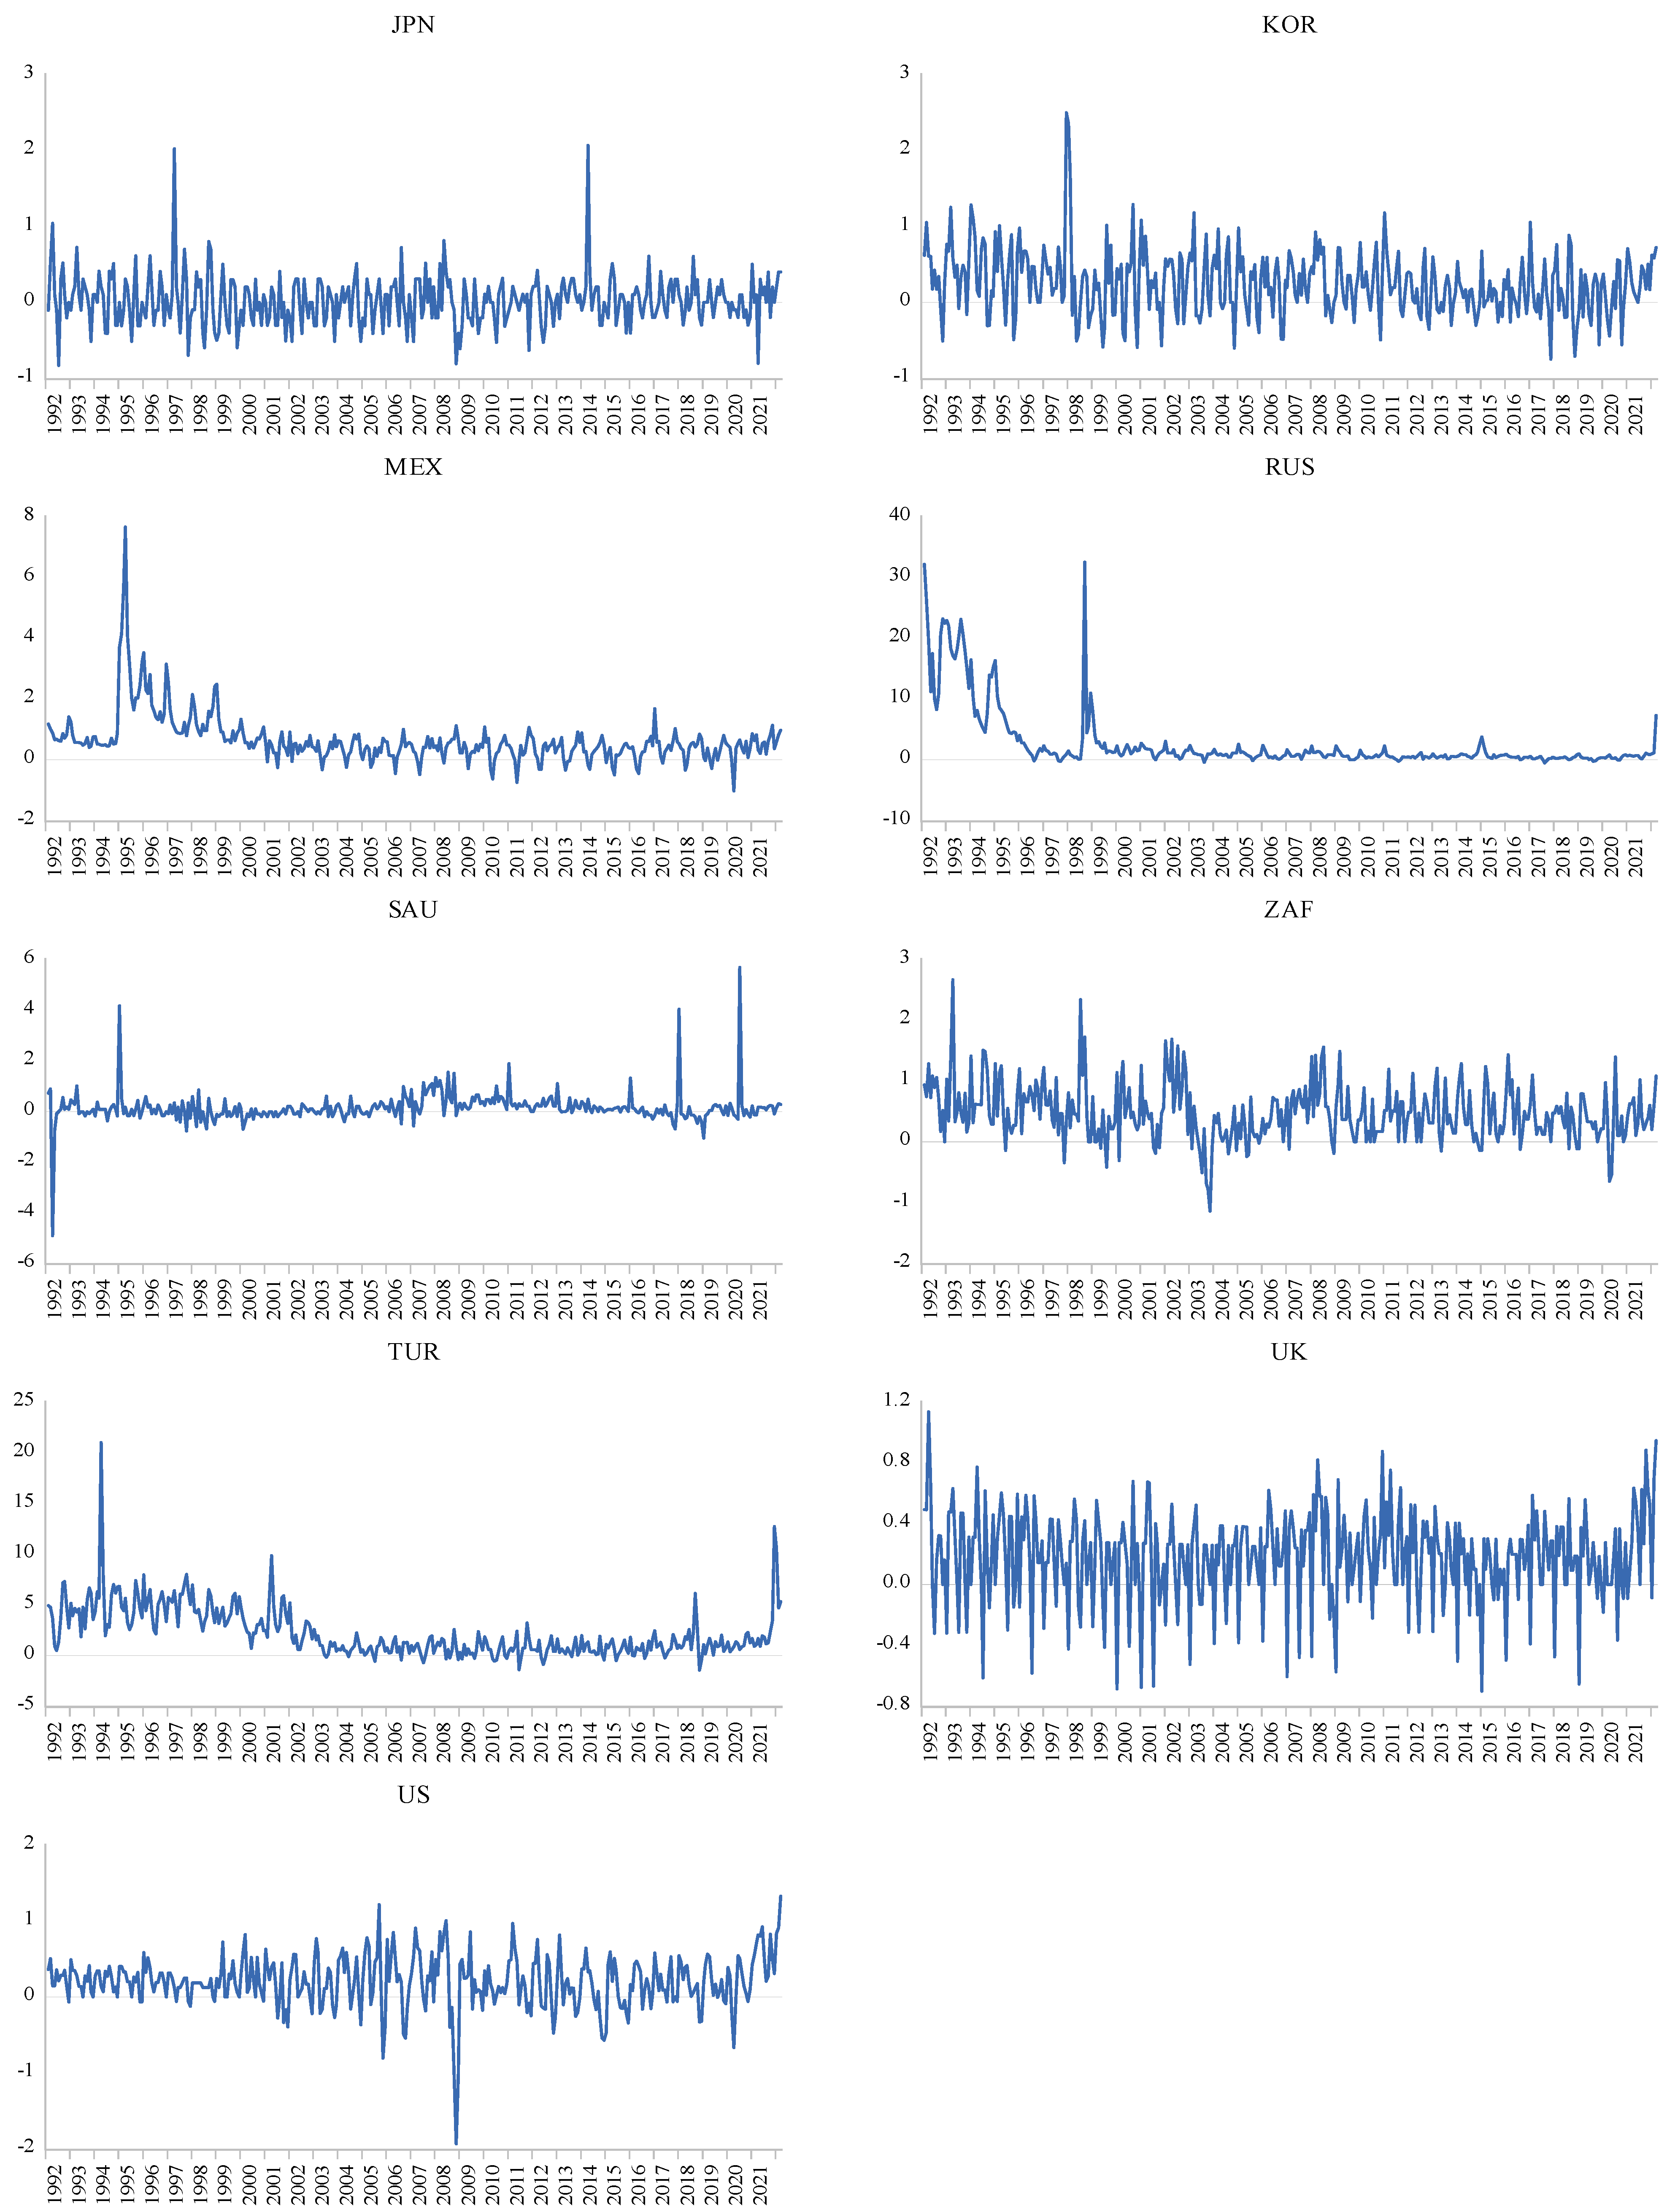
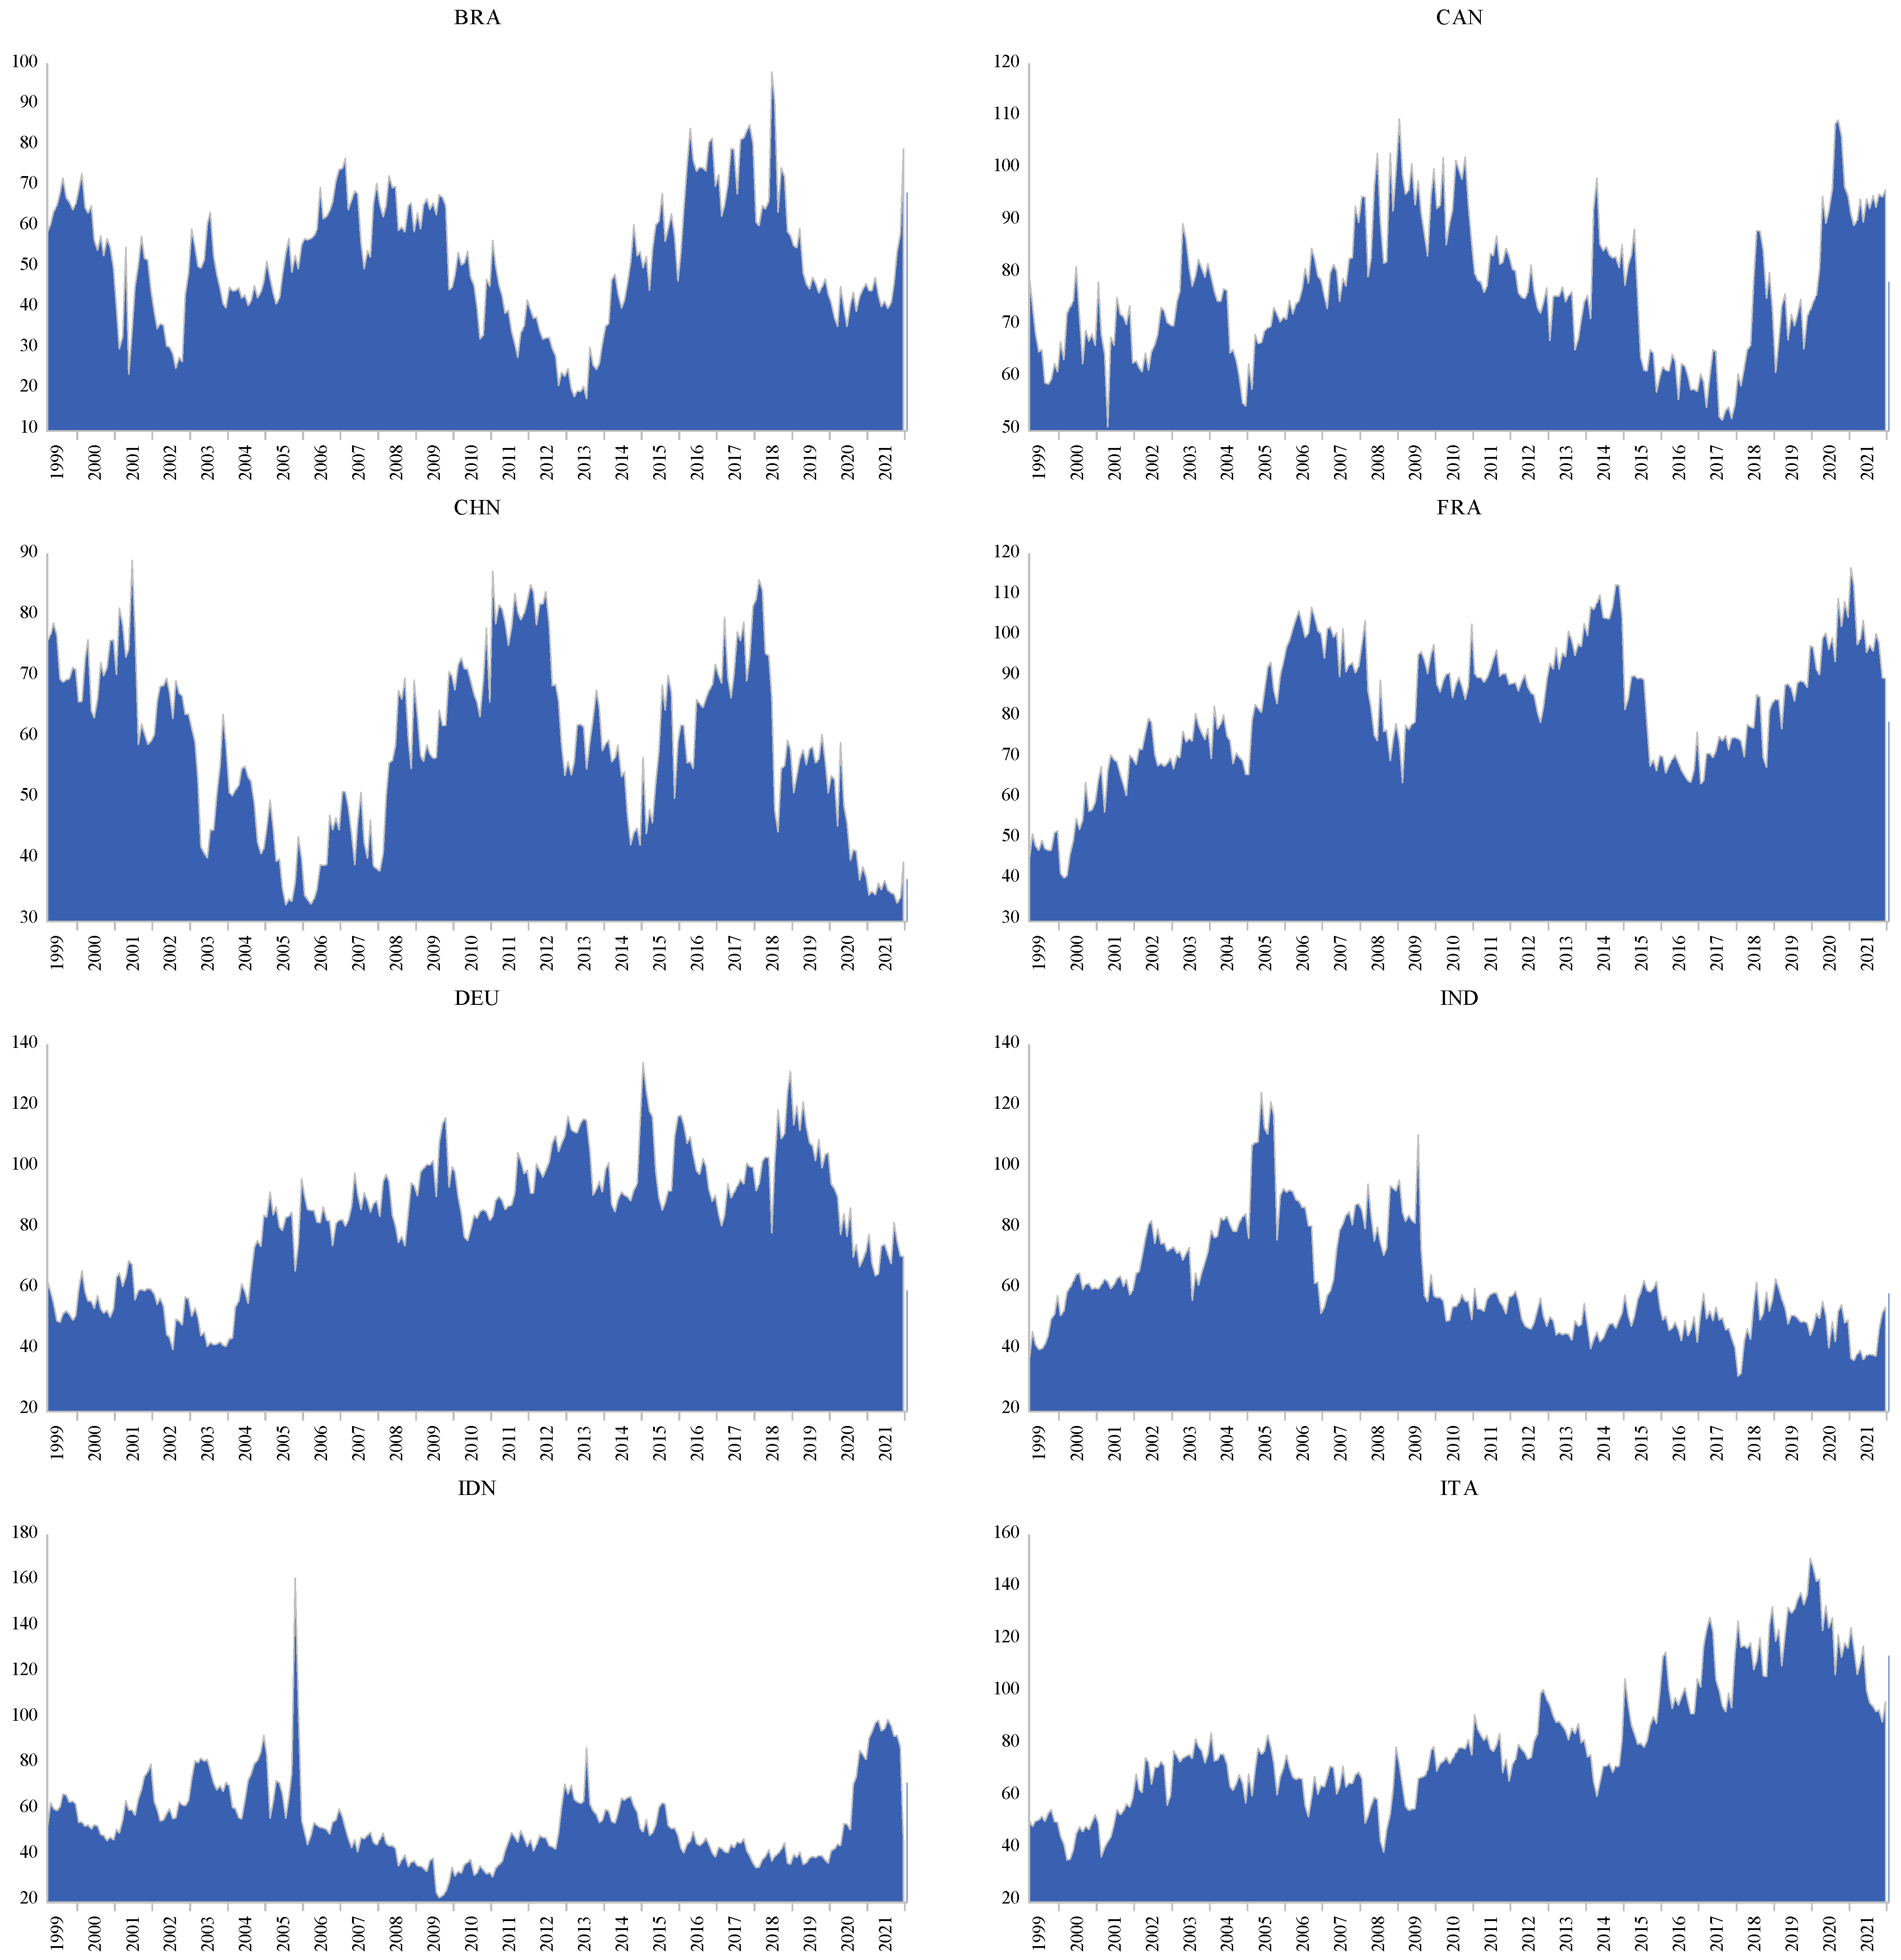
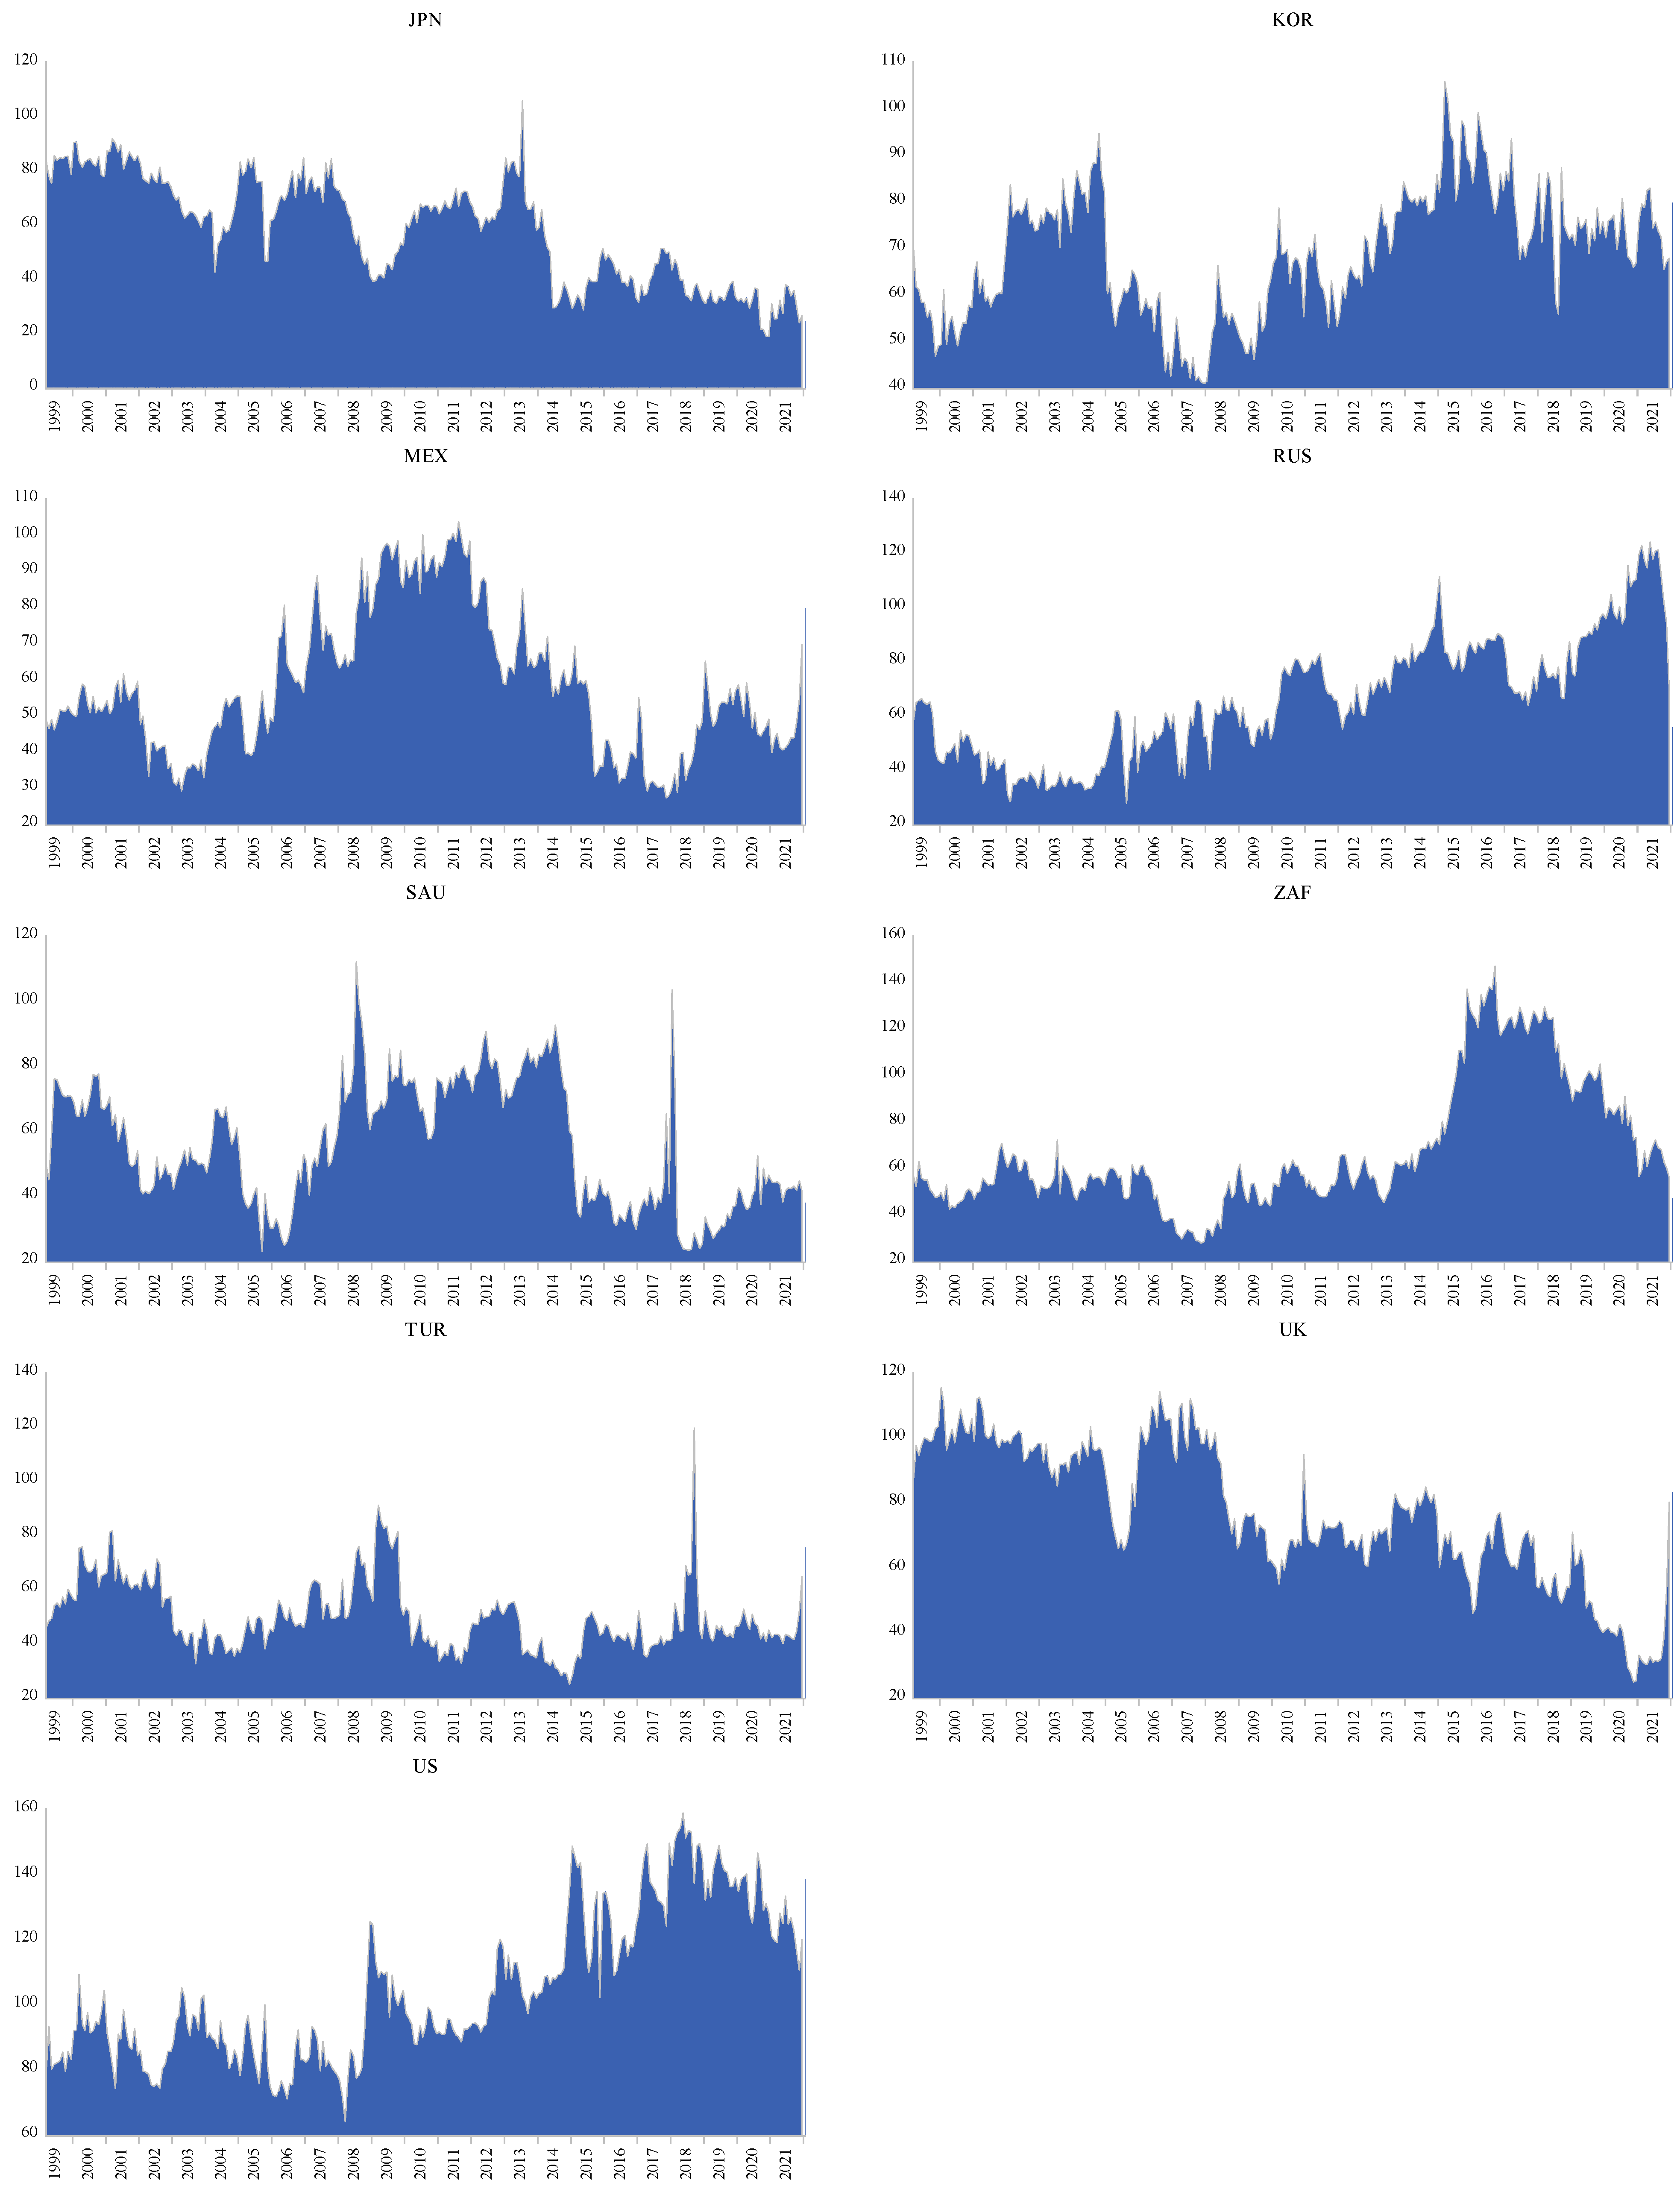
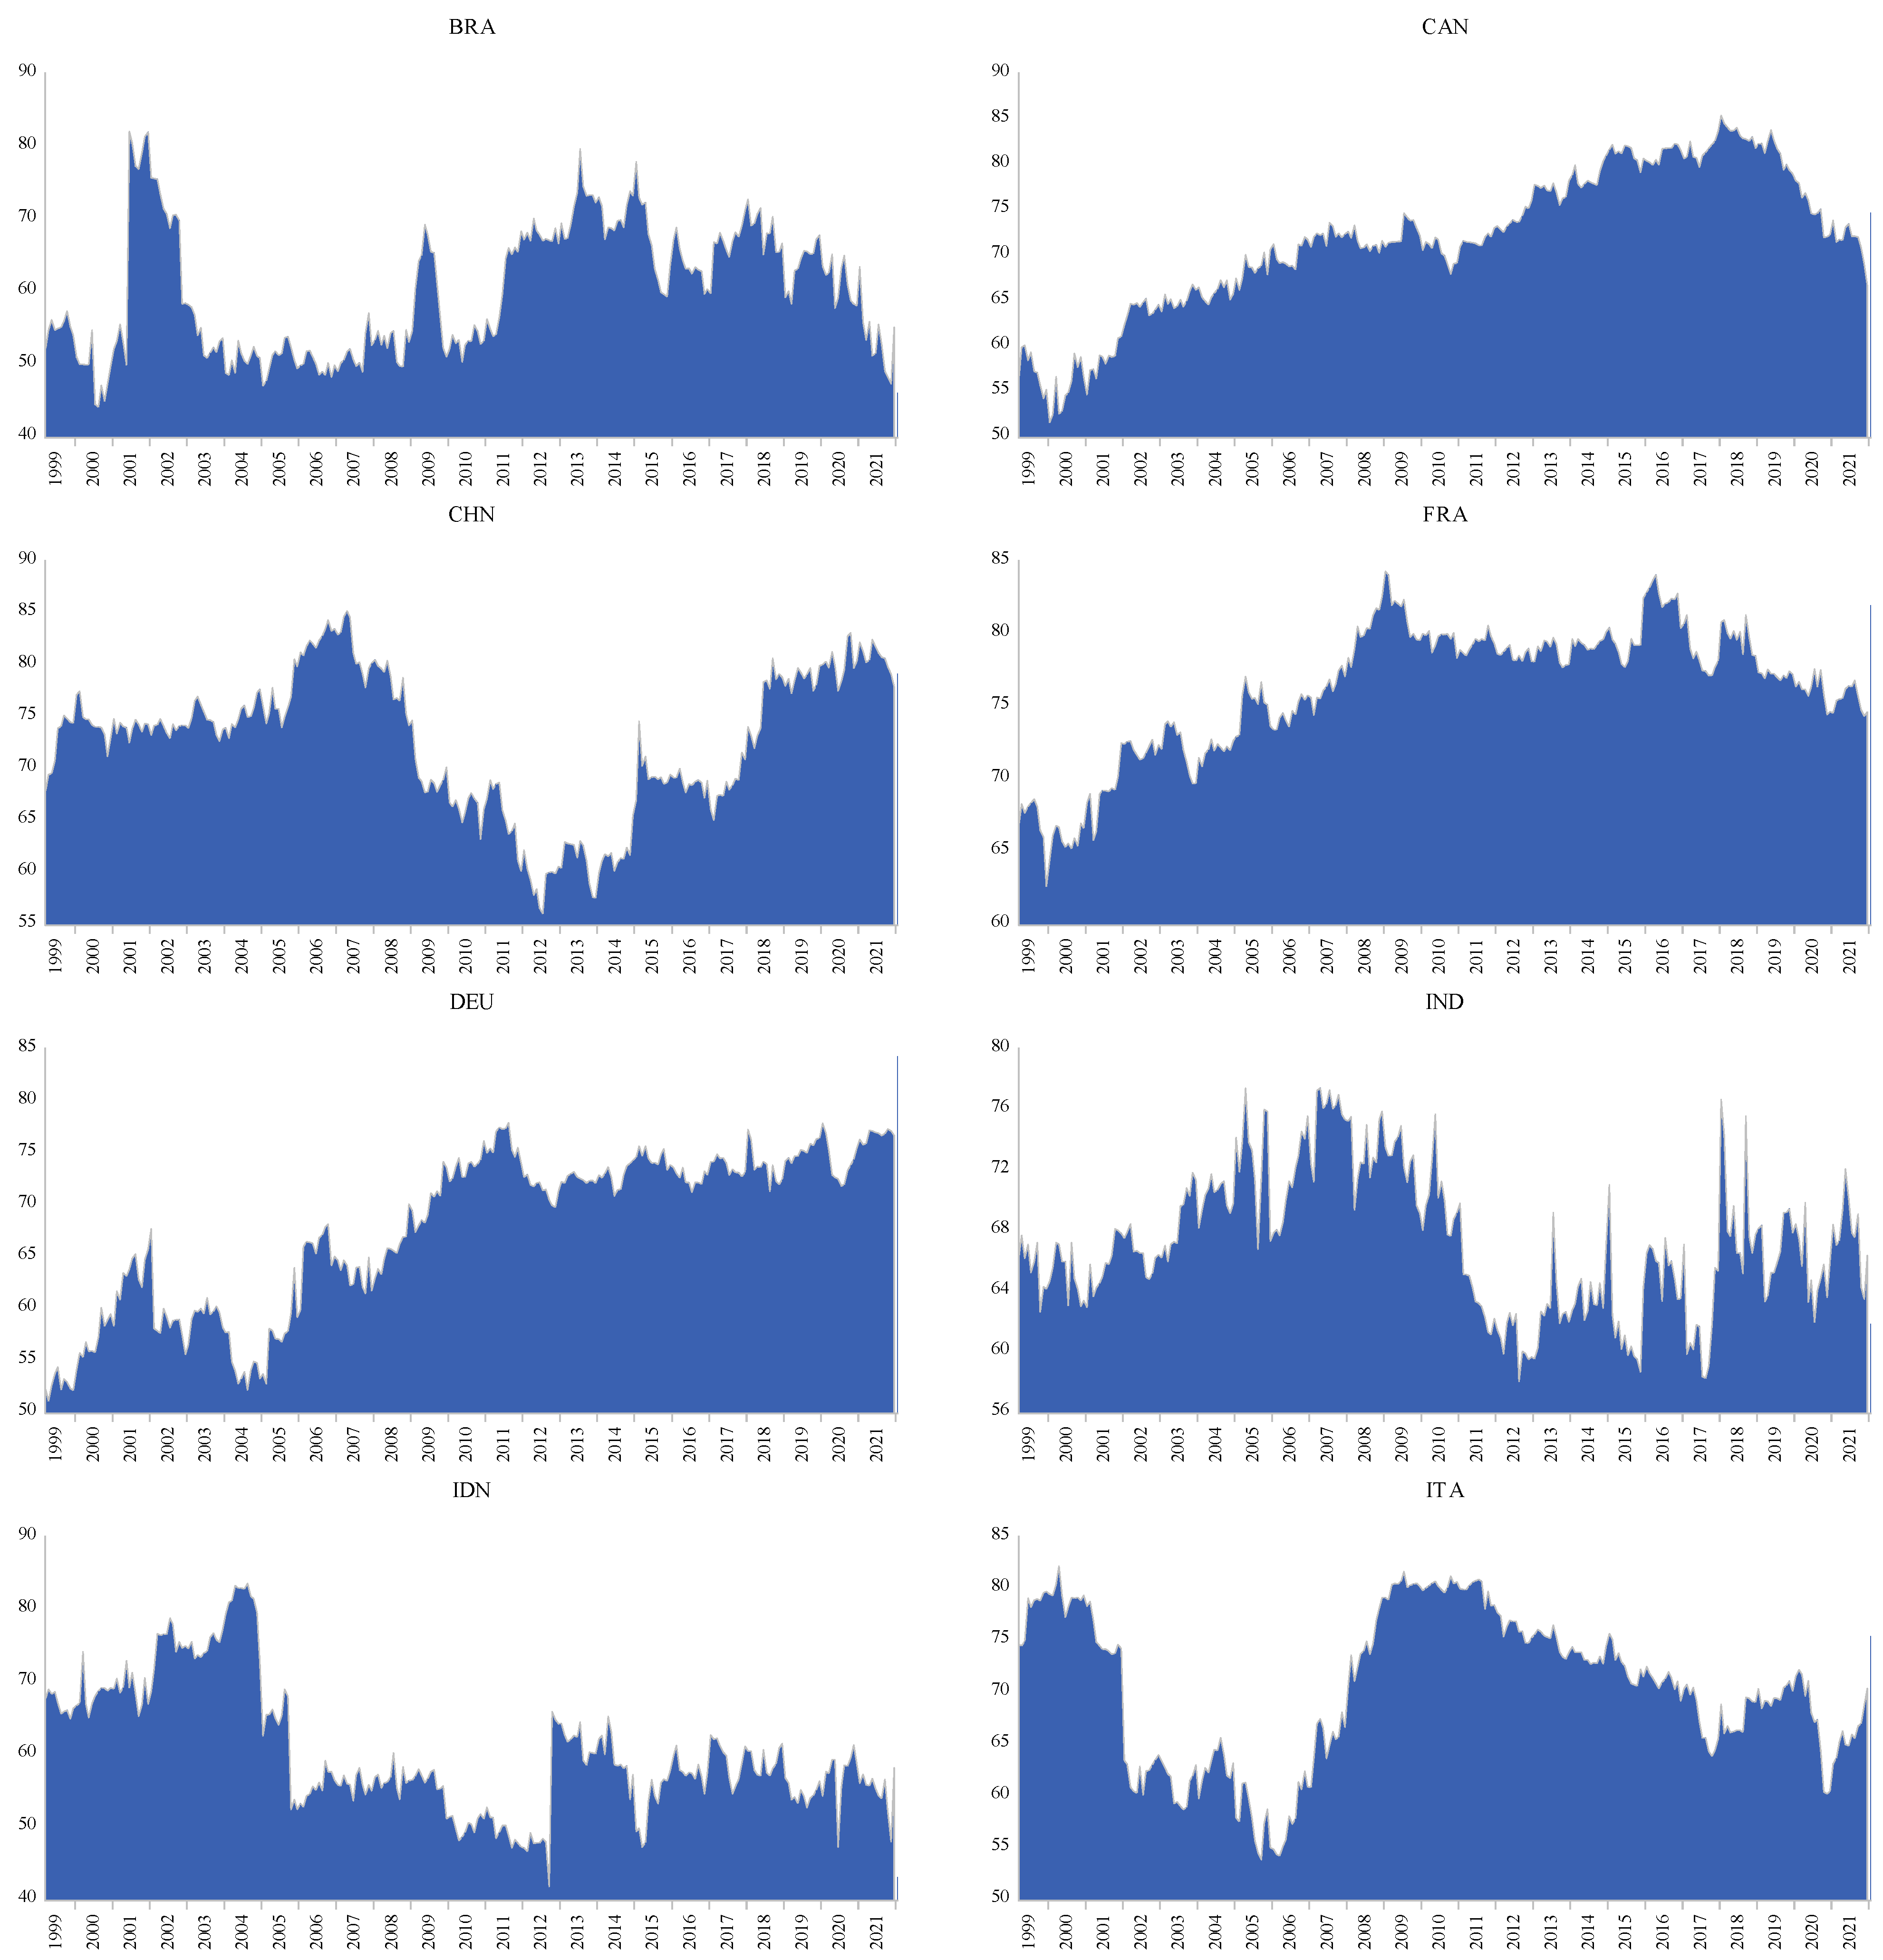
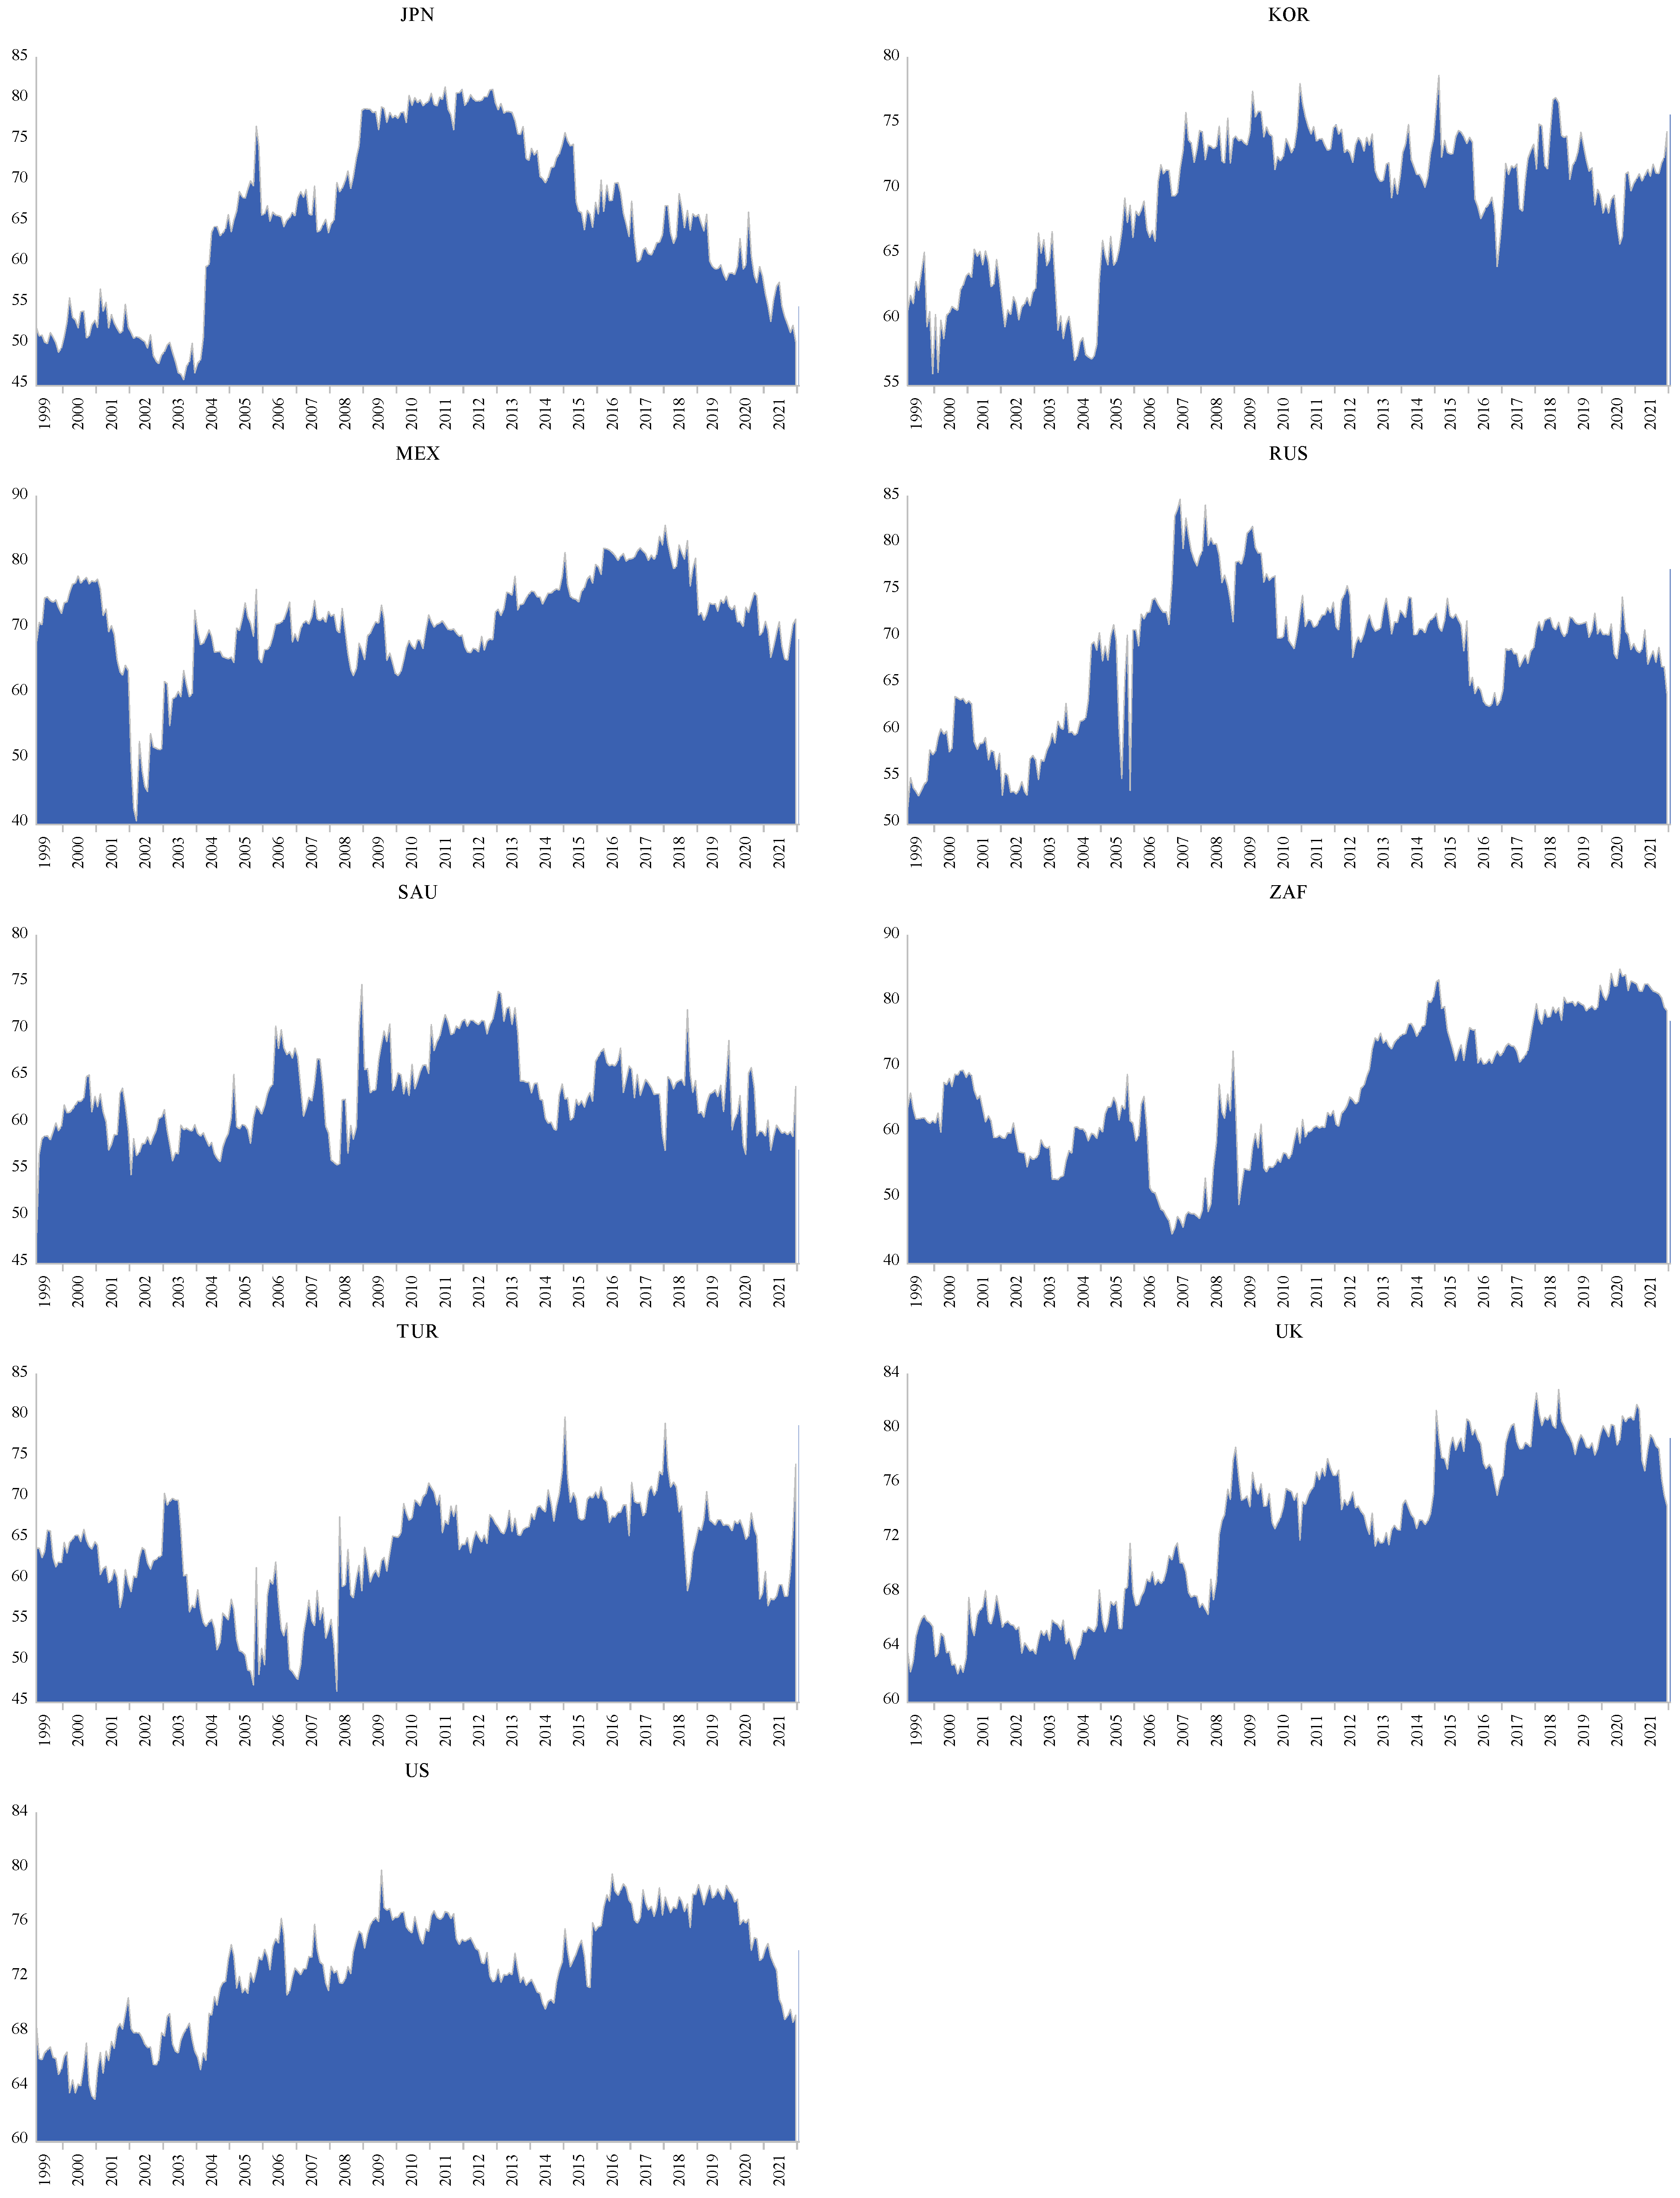
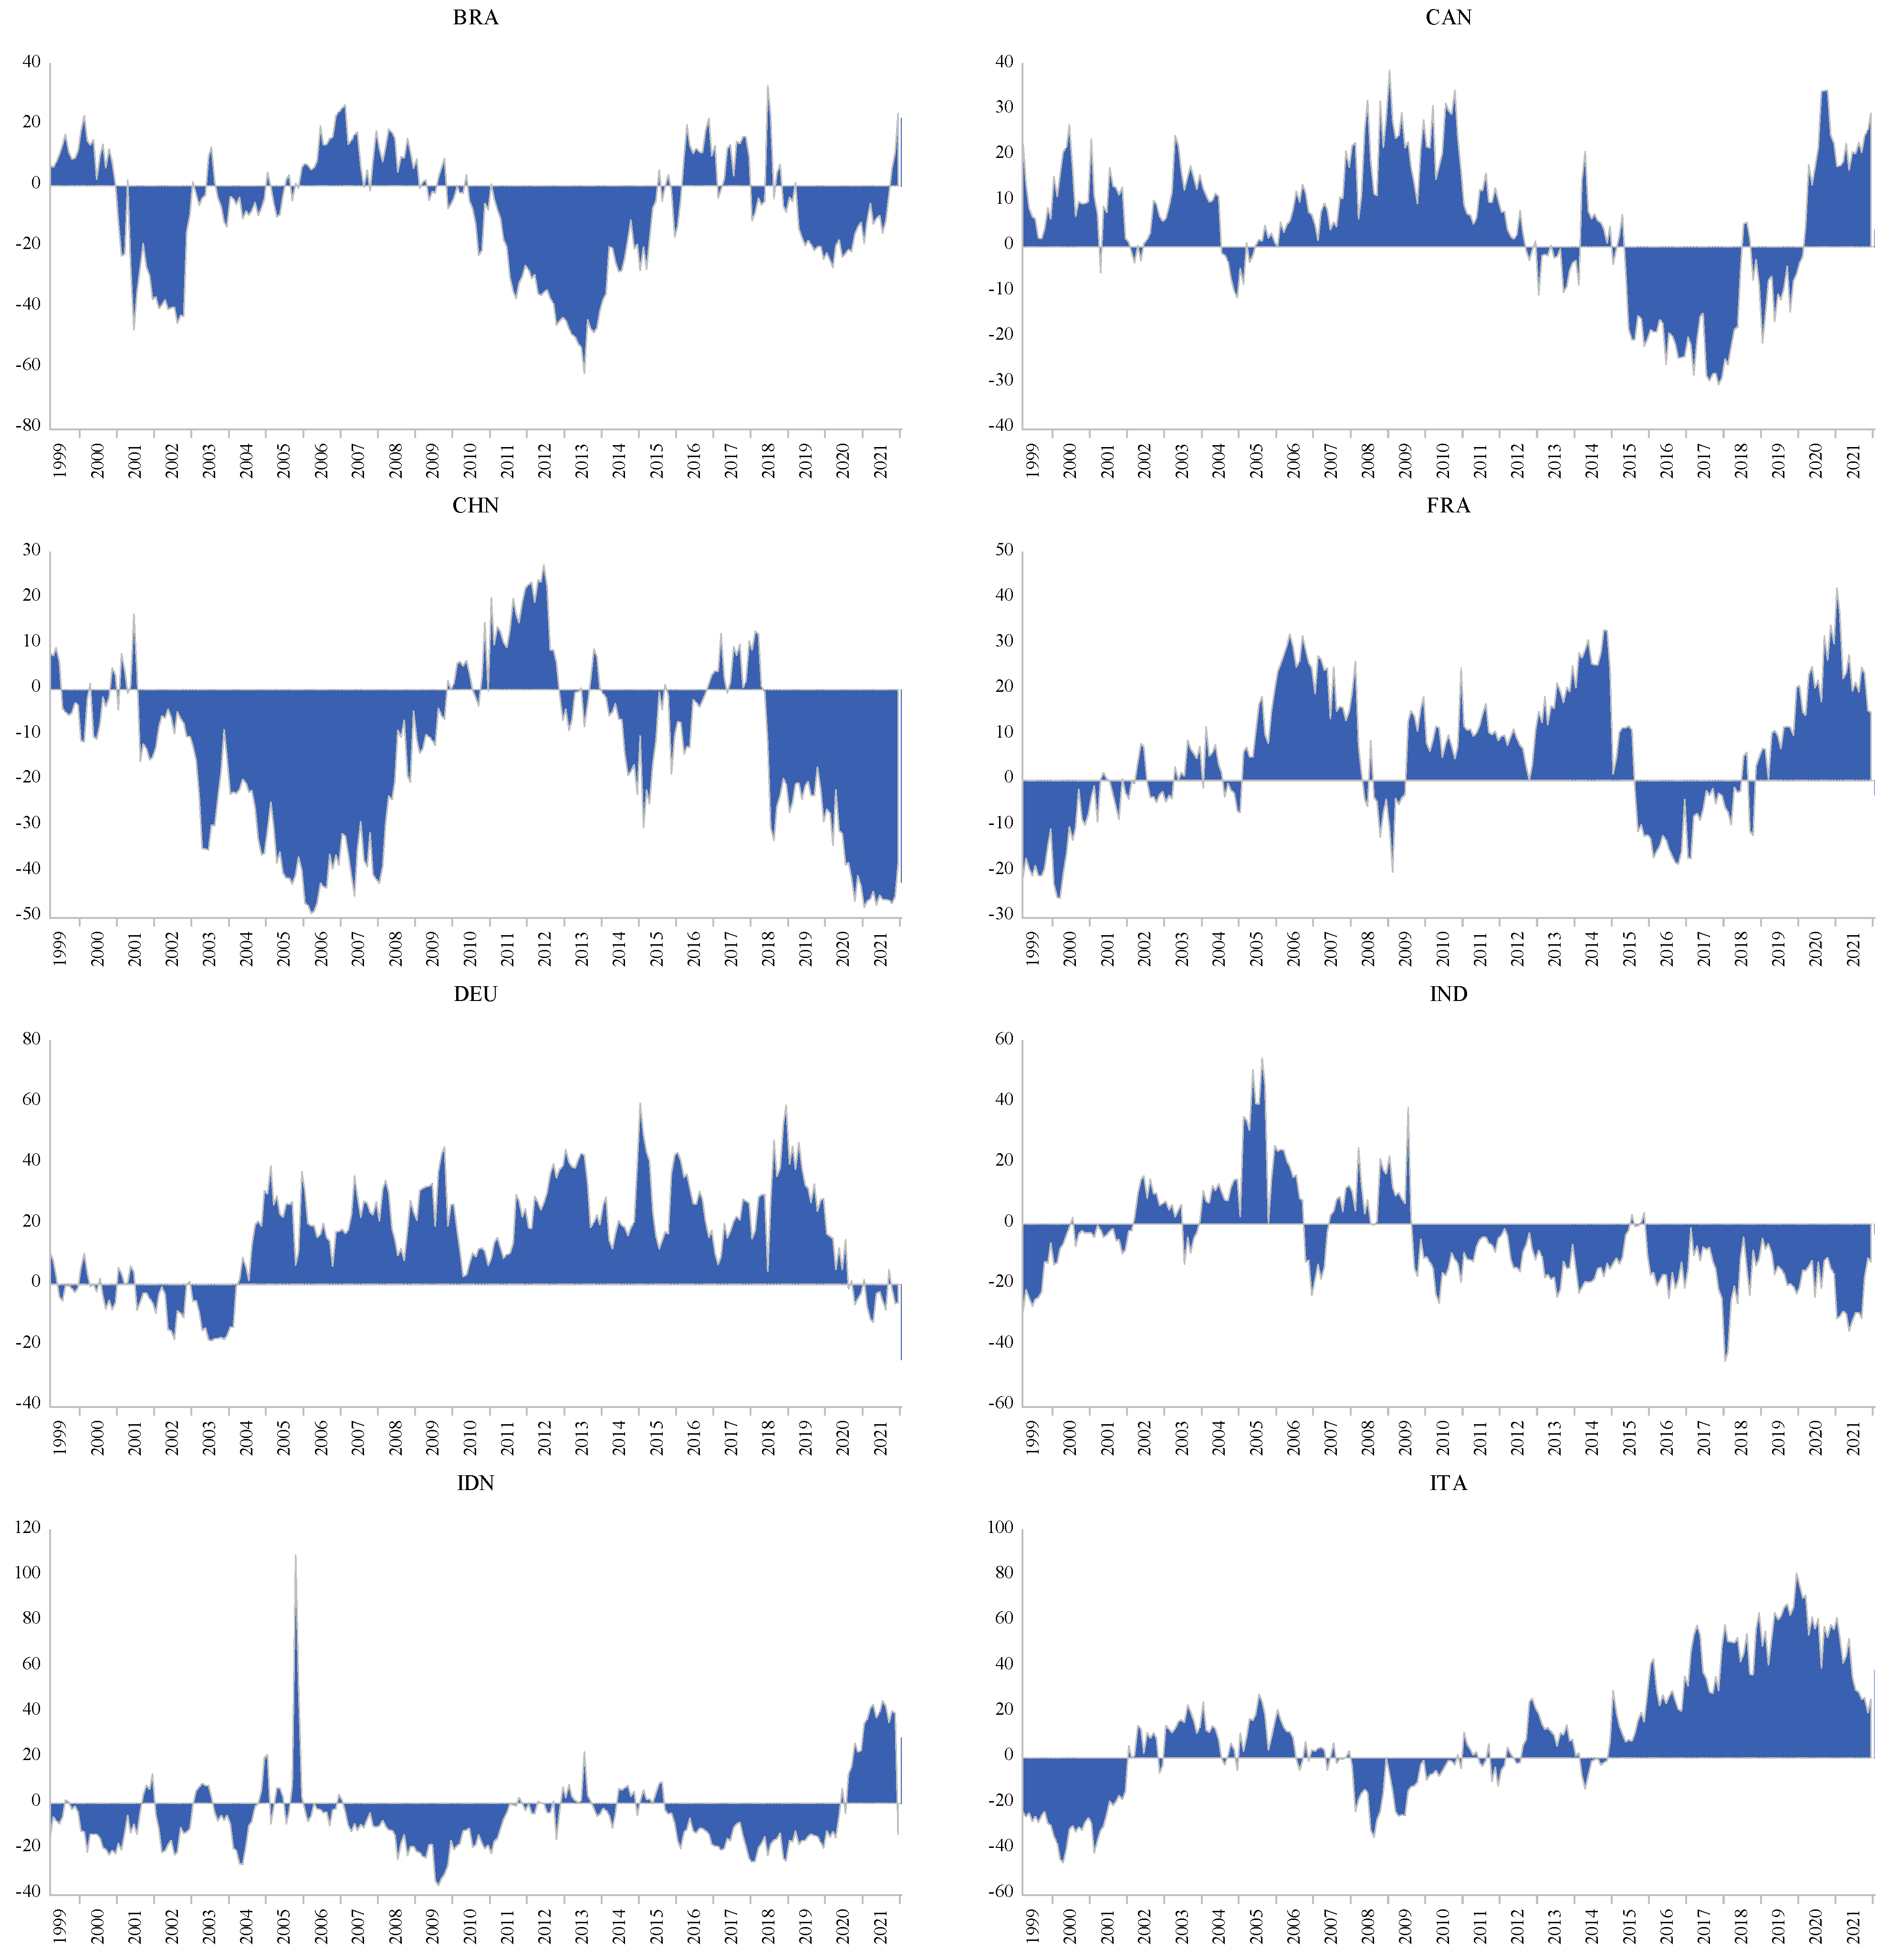
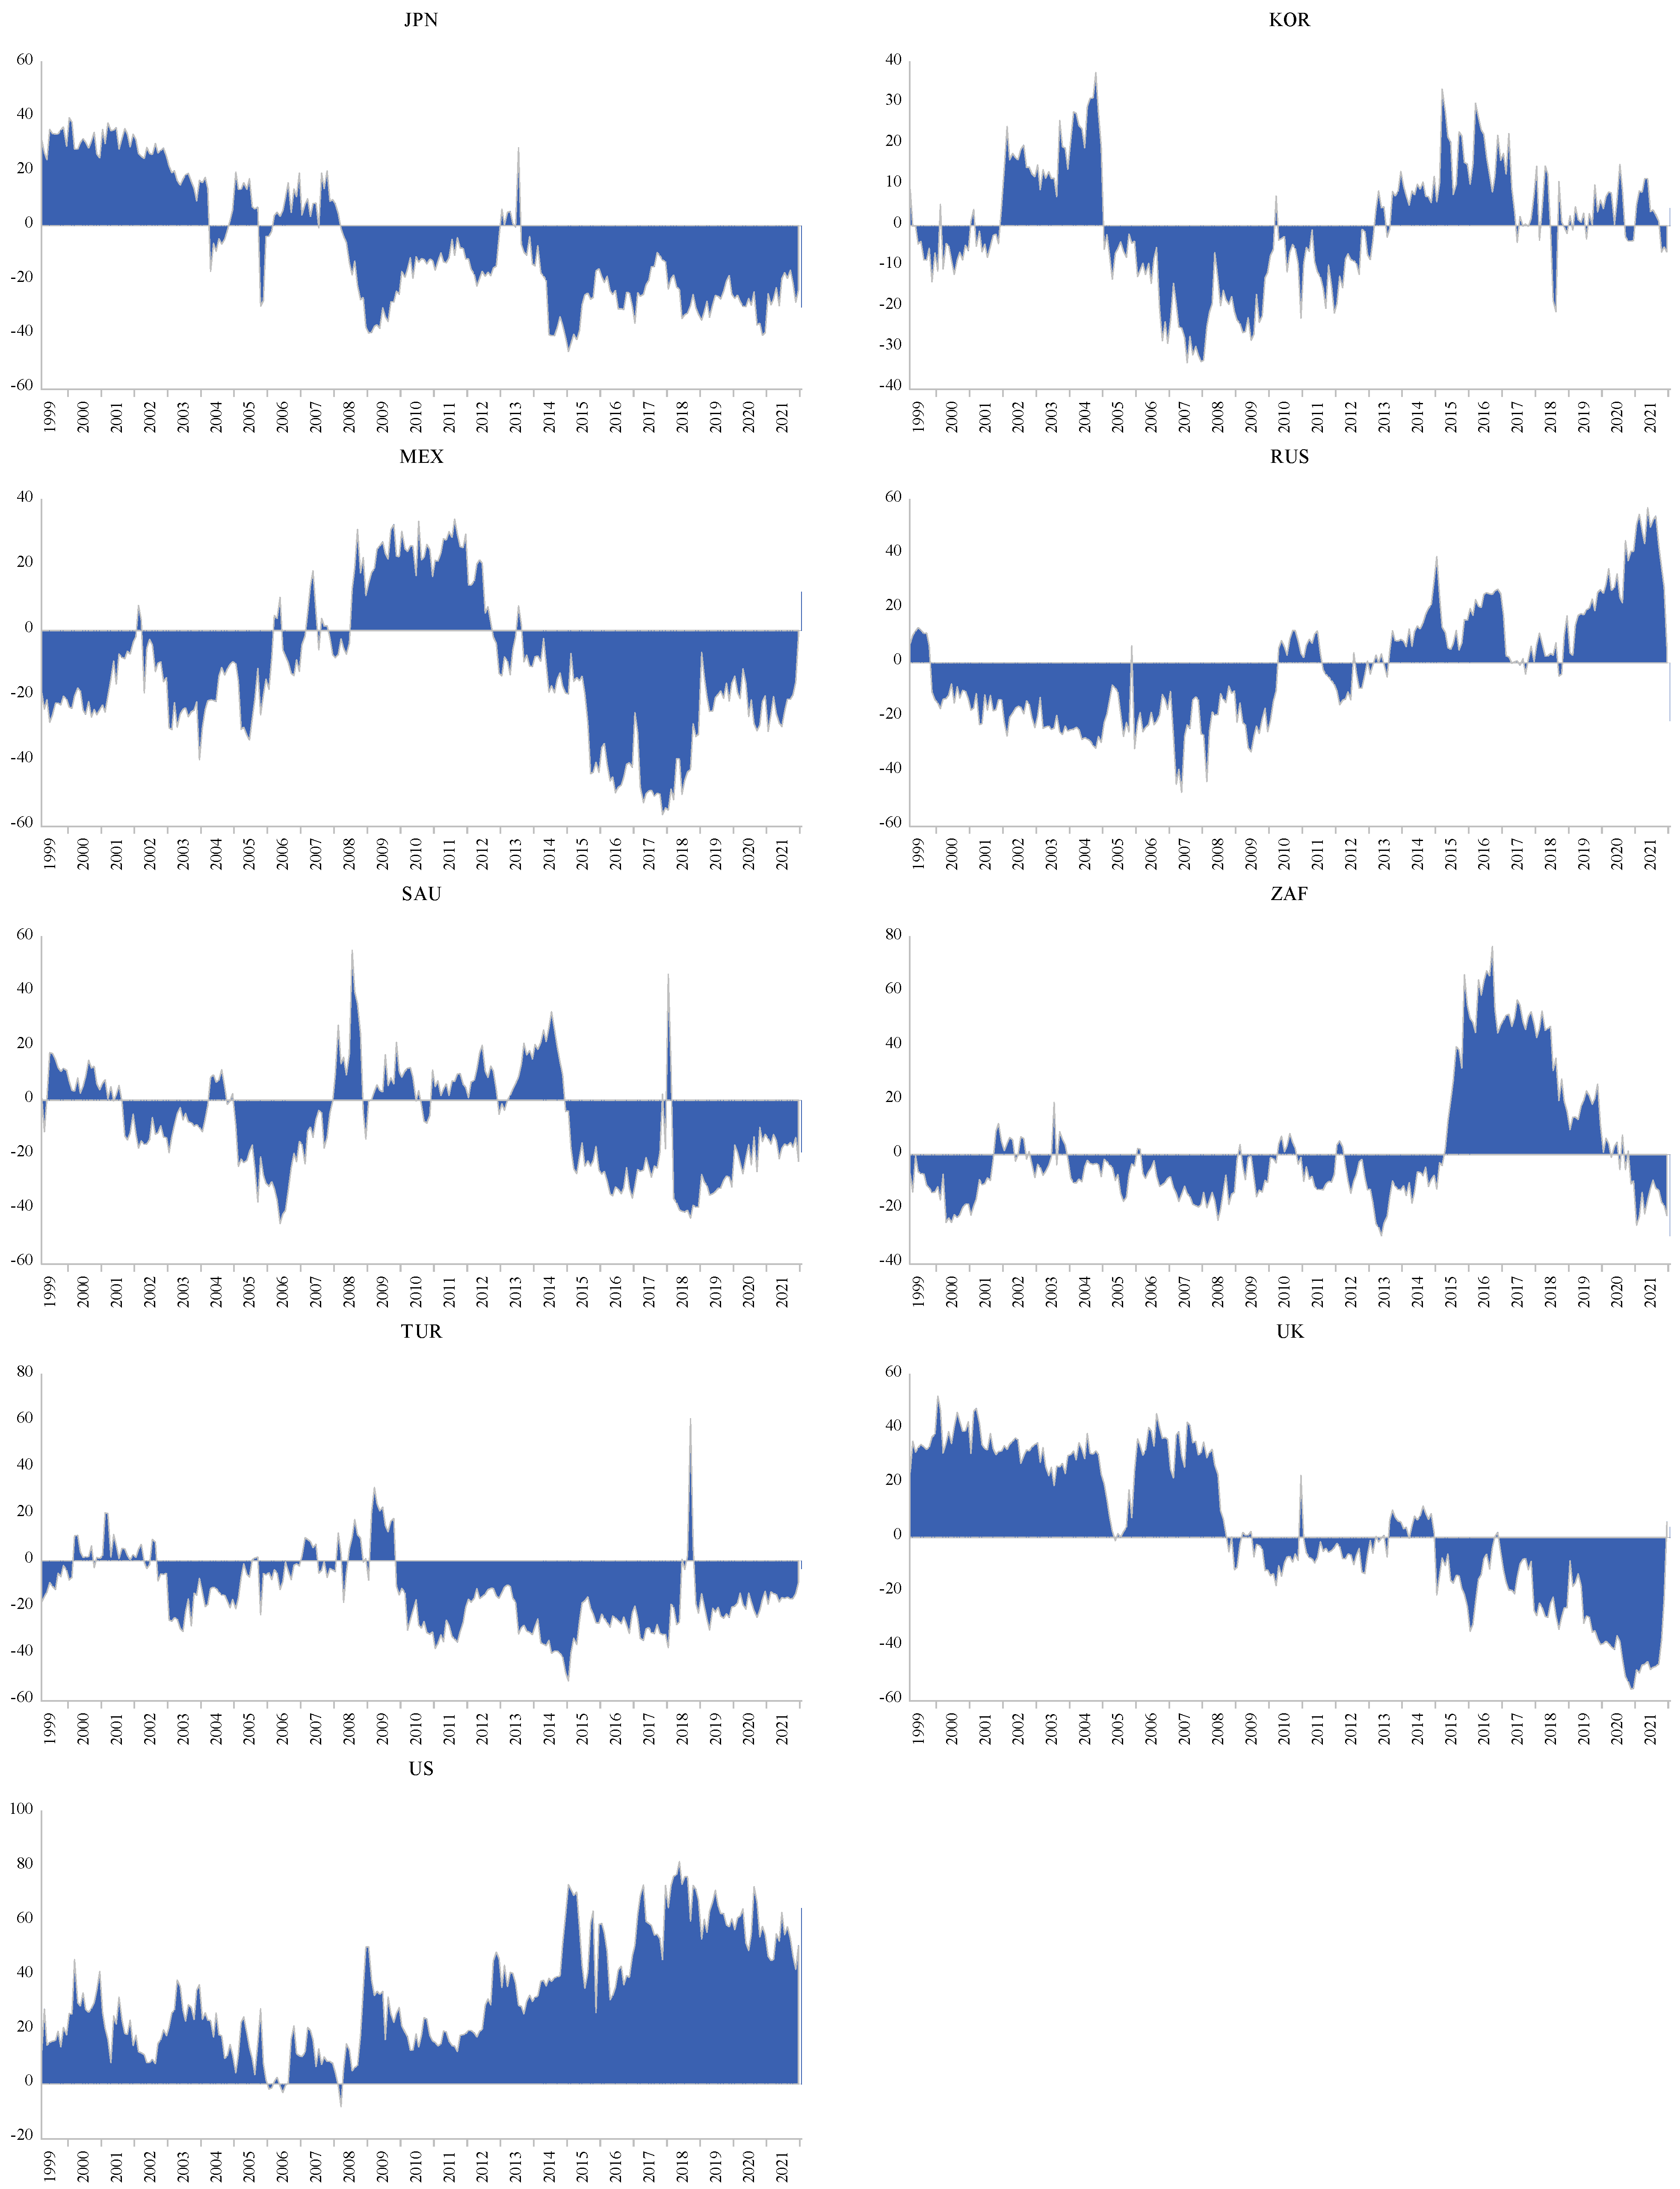
3. Data and Descriptive Statistics

This study considers monthly consumer price index (CPI) data for the G20 member countries. The sample length and the number of G20’s member countries included in our study are dictated by the availability of complete CPI time series with no missing data at monthly frequency. The beginning of the sample period is January 1992 (which corresponds to the first month where monthly CPI data became available for Russia) while March 2022 (the last month for which Russia reported a CPI figure) marks the end of the sample period. Based on these restrictions, we ended up with a total of 363 observations for each of the following 17 countries: Brazil (BRA), Canada (CAN), China (CHN), France (FRA), Germany (DEU), India (IND), Indonesia (IDN), Italy (ITA), Japan (JPN), Korea (KOR), Mexico (MEX), Russia (RUS), Saudi Arabia (SAU), South Africa (ZAF), Turkey (TUR), The United Kingdom (UK), and the United States (US). Argentina and Australia were excluded from the sample due to the incomplete time series for the former and the lack of monthly CPI data for the latter. The CPI data were retrieved from the IMF’s International Financial Statistics database. To measure inflation, we took the log difference of the CPI for each country in the usual manner as π t = ln ( C P I t ) ln ( C P I t 1 ) . Figure 1 graphically presents the time path of each G20 member’s continuously compounded monthly inflation rates. To obtain a visual prestation of the evolution of inflation rates over the sample period, we plotted all inflation rate series in Figure 1. Based on Figure 1, we can observe a fairly stable inflation rate for all advanced economies for the period 1992–2021, while we see remarkable fluctuation in the inflation rates of some emerging economies. The sharp inflation spikes in these emerging economies are primarily due to idiosyncratic shocks originated within the economy, which will be discussed in the subsequent sections.
The descriptive statistics for the inflation rates are reported in Table 1. A careful look at Table 1 reveals that the mean monthly inflation rate is below a single digit over the sample period, except for a few emerging economies, namely Brazil, due to the high costs of investment in the 1980s and the hyperinflation in the 1990s, and Russia and Turkey, which experienced high inflation during the sample period. Interestingly, the null hypothesis that the monthly inflation rate is equal to zero on average was rejected for all countries except for Japan where inflation was found to be virtually zero, reflecting more than two decades of price stagnation (Akram 2019). All series seem to deviate from the normality distribution, based on the Jarque and Bera (1980) test, displaying fat-tailedness, which is consistent with results reported elsewhere. Before moving to the analysis of inflation spillovers, we need to ascertain whether the inflation series are stationary or not. This is achieved by means of the Dickey and Fuller (1979) (ADF) and Phillips and Perron (1988) (PP) tests. In the case of inconsistent unit root results between the two tests, the conclusion as to whether a particular series contains a unit root or not is based on the latter test, since it is more robust against autocreation and time-dependent heteroscedasticity.4
The results pertaining to the ADF and PP tests concur in rejecting the unit root hypothesis in 12 out of the 17 instances, indicating that the inflation rate is stationary. For the remaining five countries for which the tests’ results are inconsistent, the outcome of the PP test indicates that inflation is stationary by rejecting the unit root hypothesis at the 1% significance level.
We move on to bivariate analysis by constructing the correlation matrix between the inflation rates of the G20 member countries to form a rough idea about the inflationary linkages among these economies. The correlation matrix presented in Table 2 shows that inflation rates for advanced countries with geographical proximity in North America and Europe are relatively more correlated, reaching 0.70 and 0.58 in the case of Canada with the US and France with the UK, respectively. Regardless of geographical vicinity, correlation among several emerging countries is also evident, particularly in the cases of Brazil with Russia, Mexico with Turkey, and Russia with Turkey, which reach 0.74, 0.42, and 0.41, respectively.
The East Asian countries paint a slightly different picture. Japan, being an industrialized economy, appears to be more correlated with some advanced countries in Europe and North America such as France, the UK, and the US than its neighboring countries, namely China and Korea. Interestingly, inflation in some emerging countries, including India and Saudi Arabia, seems to have very weak correlation with inflation as both their advanced and emerging counterparts barely exceed a single digit only with South Africa, reaching a mere 0.12 and 0.14, respectively.
Despite the intuitiveness of the unconditional correlation results, they have their caveats. First, the unconditional correlation coefficient only measures linear dependence and, as such, it ignores the potential nonlinearity induced by structural breaks arising due to significant economic events including the GFC and the COVID-19 pandemic. The presence of breaks present as an upward bias in the unconditional correlation coefficient (Forbes and Rigobon 2002). Second, the unconditional correlation coefficient does not convey any information about the directionality of the relation (Diebold and Yılmaz 2015). Third, the unconditional correlation coefficient merely measures pairwise dependence while there are valuable insights that can be gained from exploring linkages beyond pairwise association (Diebold and Yılmaz 2015). The Diebold and Yilmaz (2012) spillover measurement approach discussed above overcomes these shortcomings by offering rich insights to the direction of connectedness in multilateral settings and accommodates nonlinearities using dynamic spillover analysis. The subsequent section discusses the results obtained from using the Diebold and Yilmaz (2012) spillover measurement approach.

4. Results and Discussions

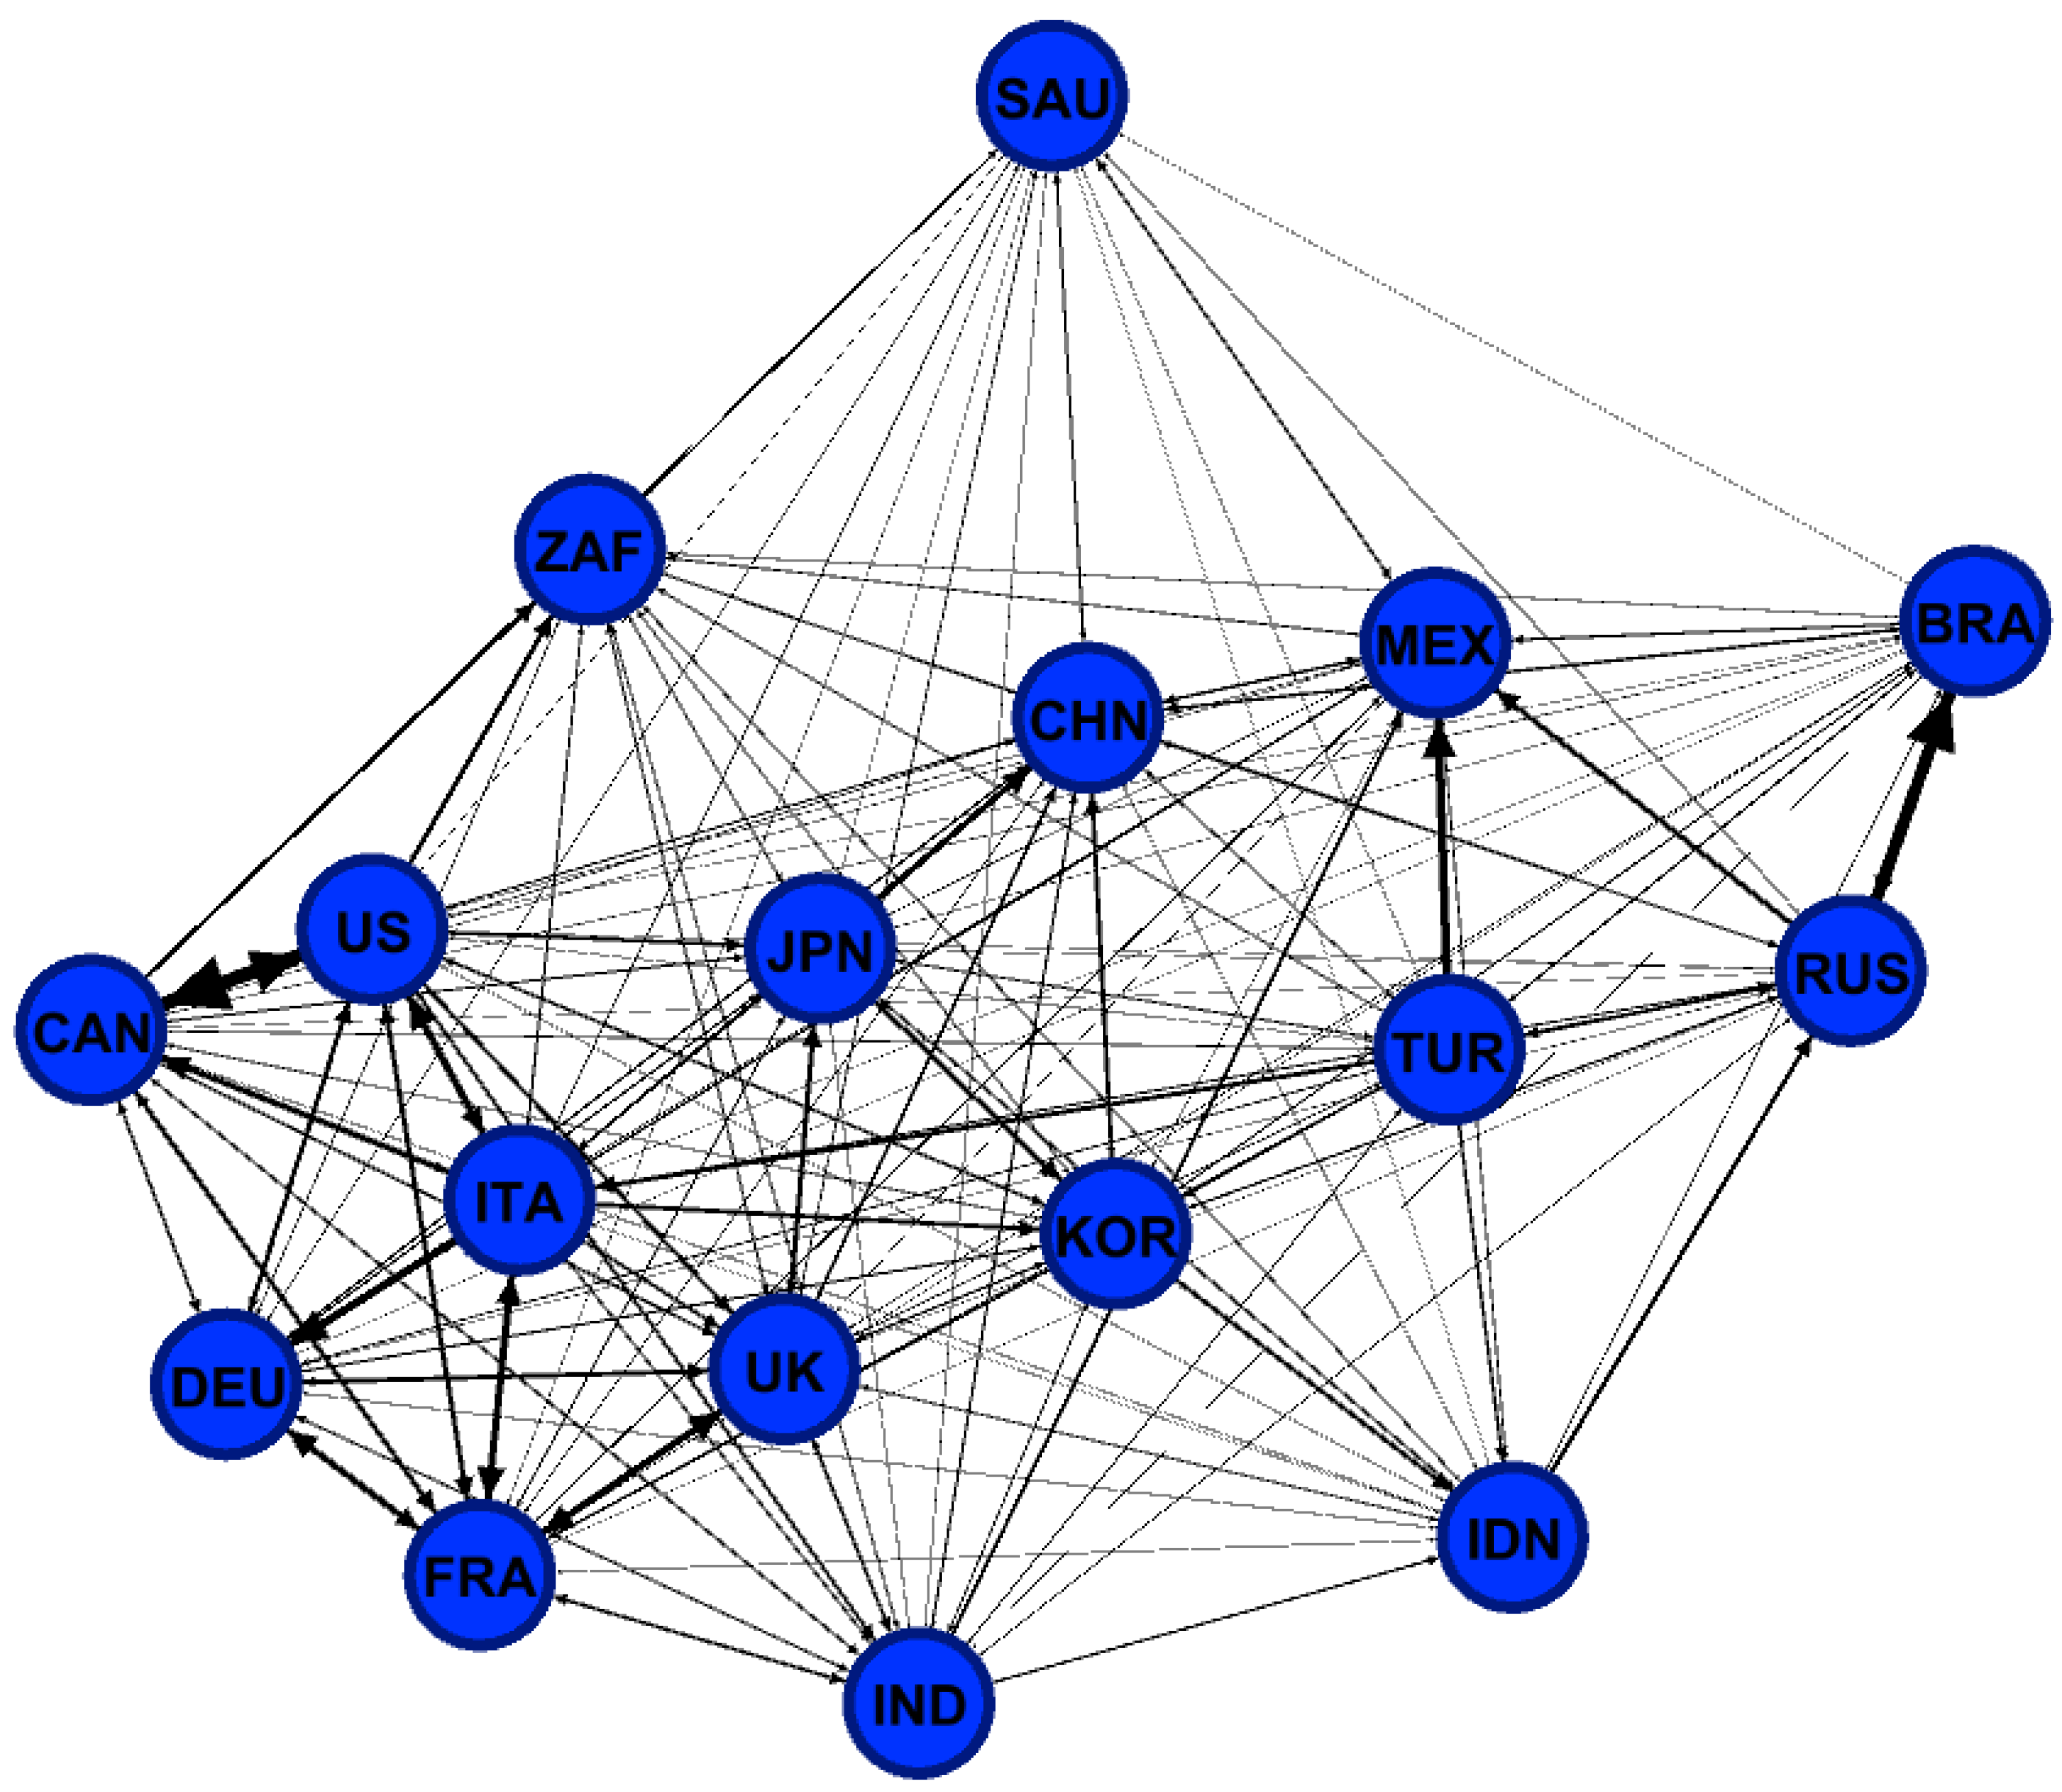
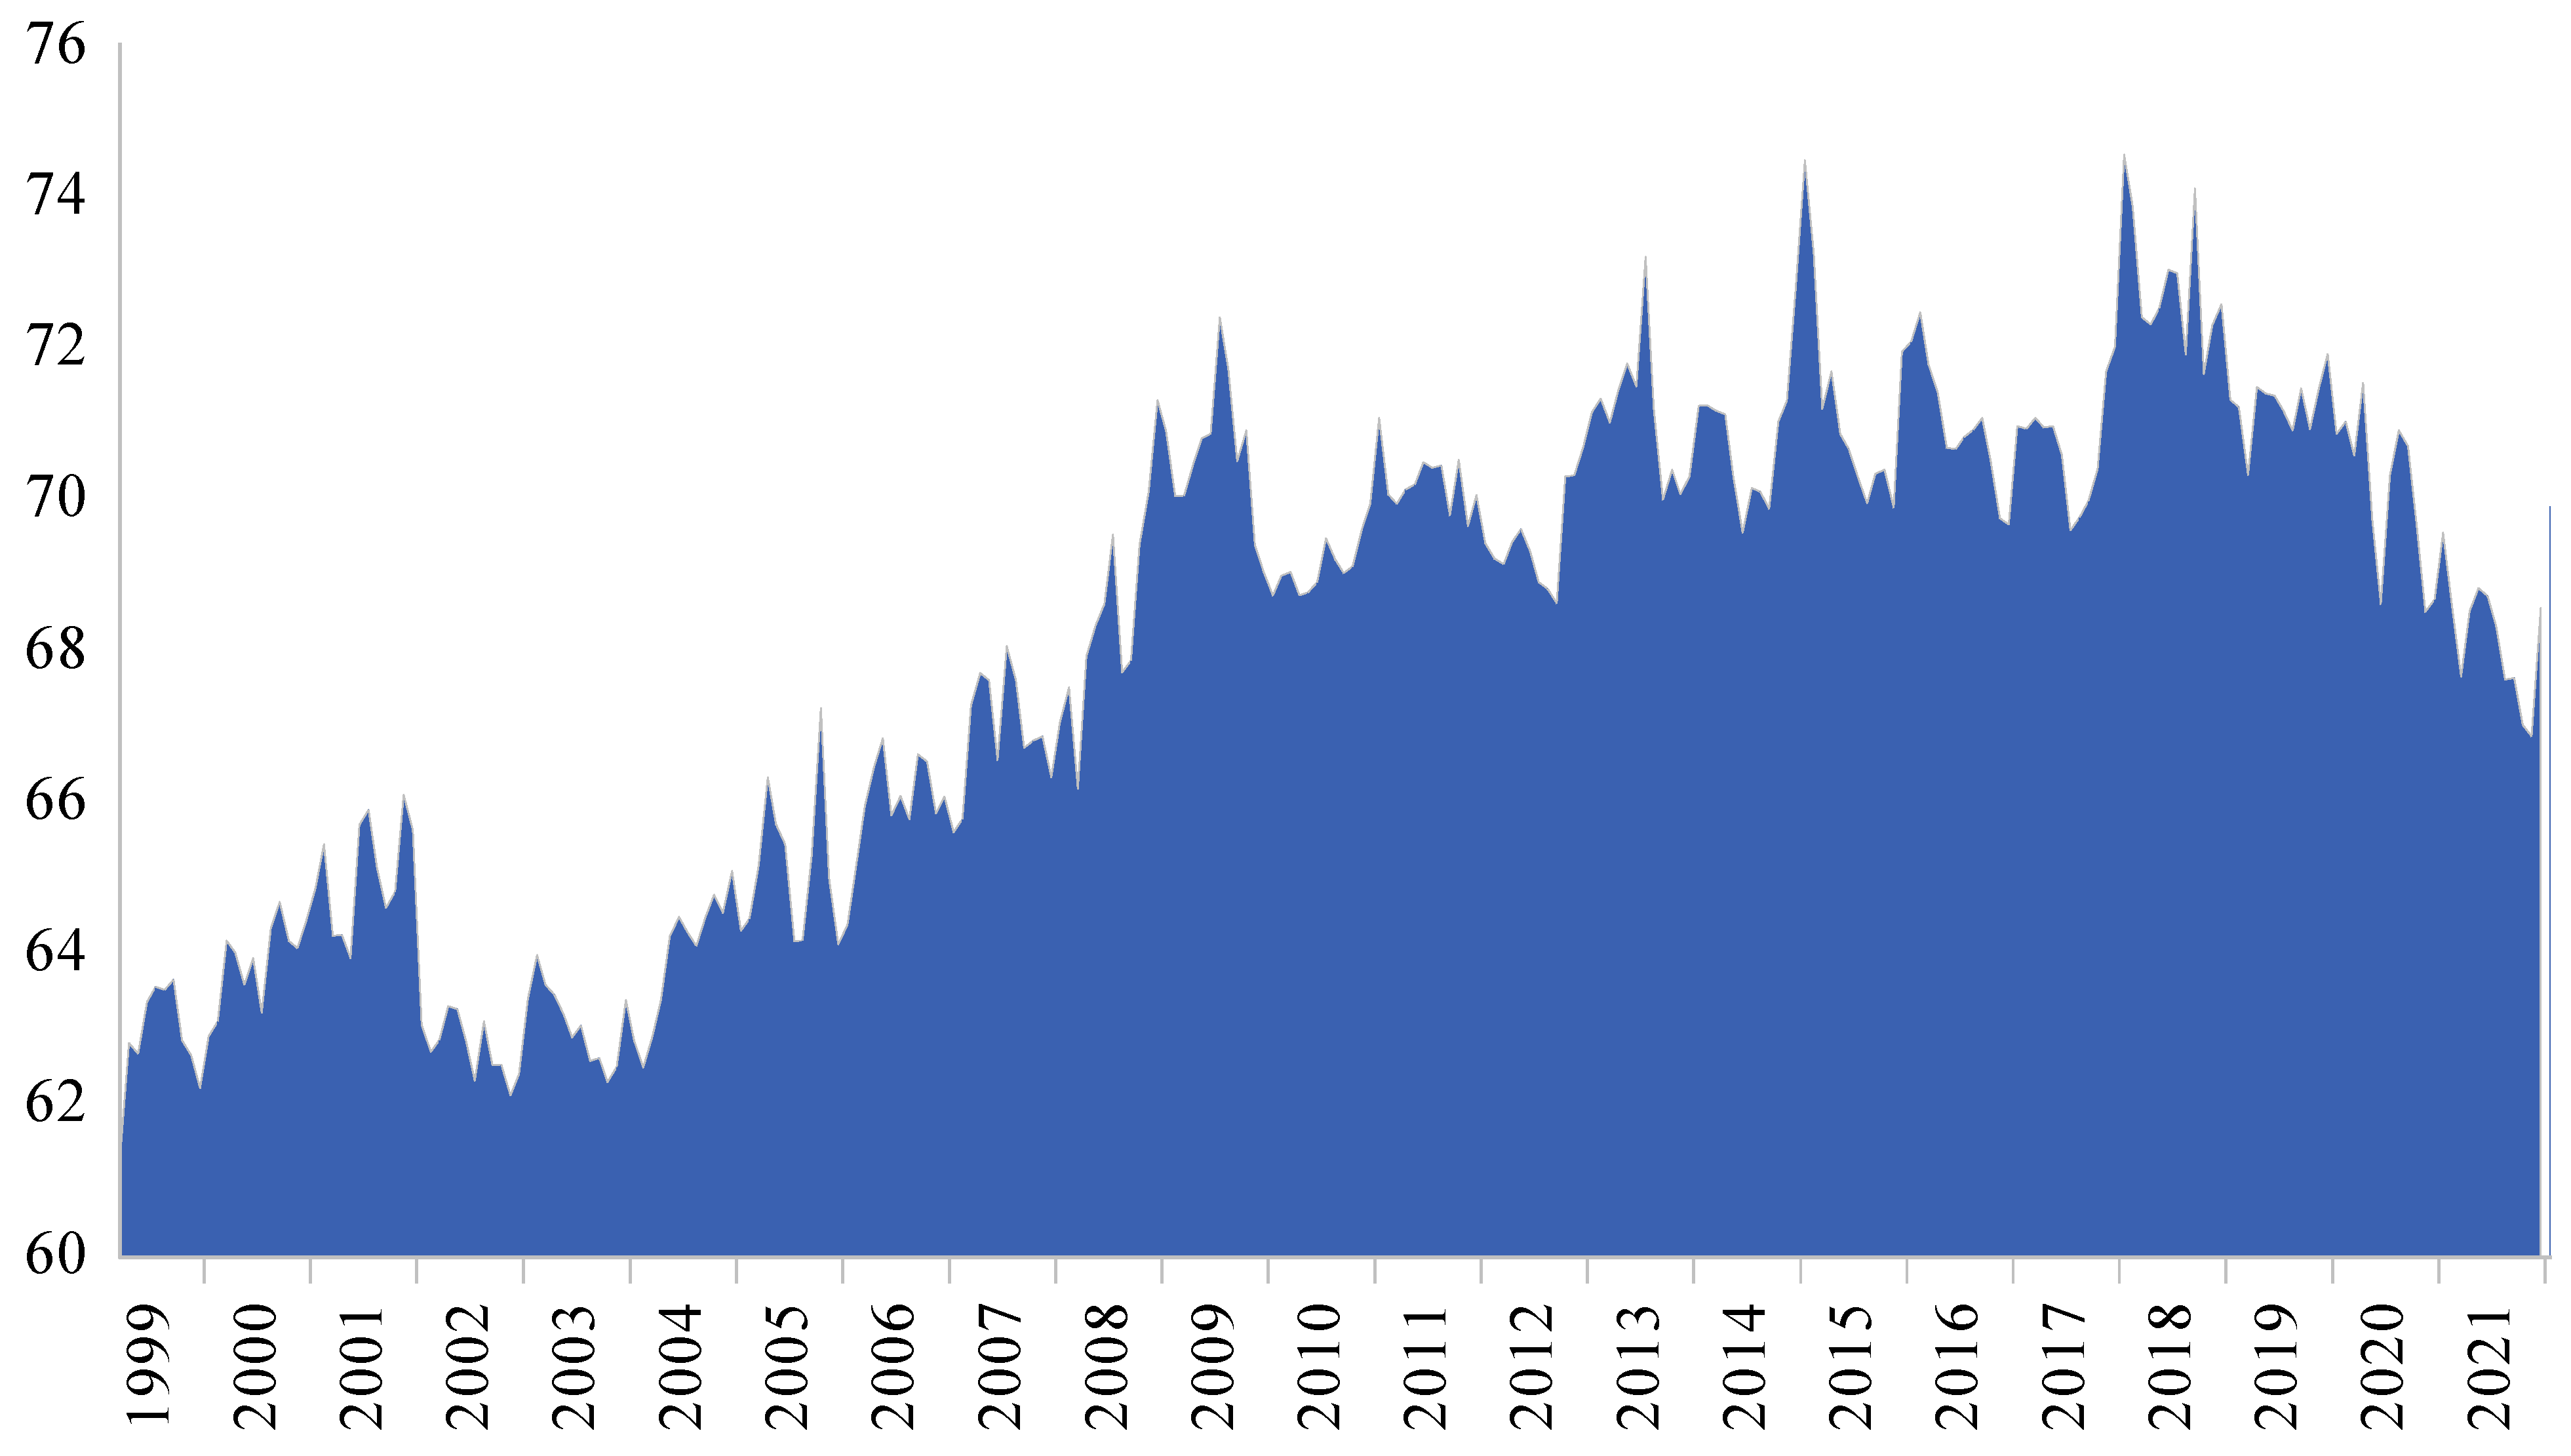
4.1. Unconditional Inflation Spillover Patterns

The variance decomposition matrix using spillover statistics for the entire sample period is presented in Table 3. The spillover statistics include pairwise directional, directional “to” and “from”, and total spillover index. A look at the right bottom corner of Table 3 reveals that the total spillover index is 43%, which means that slightly less than half of the inflation forecast error variance, on average, comes from spillovers among the G20 member countries, while the remaining 57% comes from idiosyncratic (country-specific) shocks. This is indicative of considerable linkages among the G20 member countries in terms of inflation spillovers highlighting the prominence of imported inflation. Indeed, our results are consistent with those of Istiak et al. (2021), Pham and Sala (2022), and Aharon and Qadan (2022), who found that the total spillover indices reach 35%, 41.81.%, and 44.62%, respectively. These findings reinforce the prominence of spillovers in the formation of domestic inflation.
Moving to directional spillovers received from others, as measured using S i g H , Saudi Arabia seems to receive the lowest percentage of inflation shocks from other G20 countries (21.40%) primarily due to generous energy subsidies (Sarrakh et al. 2020) and the alleviation of food price volatilities (Ianchovichina et al. 2014), while France received the highest percentage of inflation shocks (62.30%). By and large, advanced G20 member countries receive more inflation shocks compared to their emerging counterparts. As for the net directional inflation spillovers as measured by S i g H , a look at the bottom row of Table 3 shows that, among all examined G20 member countries, only Turkey, the US, Italy, Russia, Canada, and South Korea turned out to be net transmitters of inflation shocks to the remaining member countries. When evaluating the inflation dynamics of these net transmitting economies, we observed a clear distinction between advanced and emerging economies in terms of their contribution to inflation spillover and to what extent domestic inflation is influenced by international spillover (or global shocks). For the US, Italy, and Canada, we observed that these advanced economies transmit more inflation forecast error variance to other countries that amount to 80.6%, 73%, and 59.2%, respectively, suggesting a substantial contribution to the inflation total forecast error variance to be explained, amounting to 5% (80.6 ÷ 1699.9) for the US, 4.30% (73 ÷ 1699.9) for Italy, and 3.48% (59.2 ÷ 1699.9) for Canada. On the other hand, the inflation transmissions from Russia and Turkey were lower, amounting to 47.5% and 52.6%, respectively, which merely explain 2.7% (47.5 ÷ 1699.9) and 3.09% (52.6 ÷ 1699.9) of the total inflation forecast error variance. Interestingly, the contribution of France, which is a net inflation receiver, came out to be higher than the net transmitter emerging economies, i.e., Russia and Turkey, transmitting more than 58.5% to other economies, which explains 3.44% (58.5 ÷ 1699.9) of the total inflation forecast error variance.
In addition, we can also differentiate between advanced and emerging economies with respect to spillover coming from other countries. As shown in the right column of Table 3, inflation rates in advanced economies are more exposed to international spillover compared to emerging economies—The G7 advanced economies (namely, Canada, France, Germany, Italy, Japan, the UK, and the US) receive at least half of the inflation forecast error variance from global shocks, except for Japan. For the same token, a look at the diagonal elements of Table 3, which represent the portion of the inflation forecast error variance for individual member countries originating from idiosyncratic shocks, we can see that idiosyncratic shocks originating within the economies of emerging countries account for the majority of their respective inflation forecast error variances. In fact, the country-specific shocks’ contribution in some of these emerging G20 countries towards their respective inflation forecast error variances exceed a staggering 70%. In Saudi Arabia, the inflation rate was induced by pay rises (Woertz et al. 2008), the increase in government expenditure when the government’s size is large (Nademi and Winker 2022), while food subsidies (Hassen and El Bilali 2019; Ianchovichina et al. 2014) and energy subsidies (Sarrakh et al. 2020) mitigate the influence of inflated prices globally in the domestic Saudi food sector. In Turkey, the inflation rate was influenced by nearly two decades of inflationary uncertainty (Nas and Perry 2001; Neyapti and Kaya 2000) stemming from political instability (Reis 2022), which initiated periods of high inflation rates that continue, causing hyperinflation that has reached 85%. However, the inflation rate in Indonesia was majorly derived from regional shocks after the Asian economic crisis in 1997 and 1998 and remained high compared to other Asian economies (Ito and Sato 2008).
Thus far, we have interpreted the directional inflation spillovers received (transmitted) by each economy from (to) all other economies in the system. Indeed, while pairwise inflation spillovers are reported in Table 3, the presence of 17 × 17 = 289 combinations of pairwise inflation spillovers makes it somewhat difficult to comprehend these insightful linkages when relaying tabular representation. Therefore, following Demirer et al. (2018), we plotted a network graph, as presented in Figure 2. The network graph provides a comprehensible visual representation of the inflation spillover table. At this stage, a word on the interpretation of the network graph is warranted. Each node represents a country and the link arrow sizes and thicknesses indicate pairwise directional connectedness “to” and “from” based on average pairwise directional connectedness. The node location is determined based on average pairwise directional connectedness using the ForceAtlas2 algorithm proposed by Jacomy et al. (2014).
Figure 2 clearly demonstrates the strong connectedness among G7 countries and shows that the average pairwise directional connectedness between these major economies is higher compared with the connectedness outside the G7 group. It also shows that spillovers coming from and transmitted to emerging economies are lower among emerging economies compared to the bilateral spillovers among their advanced counterparts. The influence of geographical proximity on pairwise connectedness between countries is also reflected in Figure 2, indicating that the effect of spatial relationships on observed spillovers between France, Germany, Italy, and the UK in the Euro region; a strong bilateral connectedness between the US and Canada; and close ties between East Asian countries. Finally, countries with inflation rate variabilities coming from idiosyncratic shocks such India, Indonesia, and Saudi Arabia, are placed far-off from other countries, representing the weak bilateral connectedness with other countries and the modest influence of global shocks on domestic inflation.

4.2. Conditional Inflation Spillover Patterns

Suffice to say, our static spillover analysis provided a useful summary of “average” behavior over the entire sample period. However, numerous remarkable events and changes occurred in the period in-between the beginning and the end of our sample. Such events include the 9/11 terrorist attack, the global financial crisis (GFC) followed by the European sovereign debt crisis, and the COVID-19 pandemic. Other changes may be better viewed as an ongoing evolution, including reforms that support free trade (Jafari Samimi et al. 2012; Kwark and Lim 2020; Watson 2016), financial market liberalization (Alotaibi and Mishra 2017; Gelos and Sahay 2001; Kim and Rogers 1995), and the elimination of subsidies and dismantling price control (Ogarenko and Hubacek 2013; Sdralevich et al. 2014), particularly in emerging G20 member countries. Of course, these developments affect the spillover dynamics that are averaged out using static spillover analysis. To this end, we estimated the spillover indices using 60-month rolling samples, which offer valuable insight into the variation in inflation spillovers over time by means of the corresponding time series of the spillover indices. The resultant time series are examined graphically in spillover plots.
To begin with, we direct our attention to Figure 3, which presents the total inflation spillover plot. At first glance, we can see that Figure 3 displays a clear upward trend, starting from the turn of the century, before weakening after the GFC and being reversed at the beginning of 2018. These results are largely in line with those reported in Istiak et al. (2021), Pham and Sala (2022), and Aharon and Qadan (2022).
In the late 1990s, there was an increase in inflation spillovers fueled by the dot-com bubble before its bursting and the 9/11 terrorist attack that coincided with a drop in inflation spillovers, probably due to recession, that affected the advanced G20 countries around 2001–2002. The inflation spillover rebounded from 2005, following a sharp upward trend, potentially due to the increases in crude oil prices that are attributed to high demand generated by economic growth in China and India.
The oil supply shock due to the reduction in Libyan oil exports during the Arab spring in 2011 combined with the Western embargo on Iranian oil production due to its nuclear program (Fratzscher et al. 2014) contributed to the inflation spillover. The financial volatility in the Eurozone after Brexit weakened the trend (Belke et al. 2018). However, the spillover upward trend was prolonged after the trade war between the US and China. The total inflation spillover had downturned during the COVID-19 pandemic period, before gathering steam towards the end of our sample.
Next, to obtain a detailed picture of the inflation spillovers directed to and those stemming from each of the G20 member countries, the directional spillovers, which are calculated using S i g H and ( S i g H ), are estimated dynamically in the same fashion as the total spillover. The directional spillovers from each G20 member country to others (i.e., S i g H ) are presented in Figure 4.
Based on Figure 4, it appears that the directional spillovers from each G20 member country to others fluctuate considerably over time. Moreover, the G20 members display different behavior with US and the leading Euro area’s countries seem to have a growing influence in terms of transmitting inflation to the remaining G20 members. In contrast, Japan and the UK transmit declining inflation spillover to the remaining countries. Emerging economies show cyclical behavior, except for Russia, whereby a persistent increase in inflation spillover is evident. On the other hand, Figure 5 presents the directional spillovers from others to each G20 member country (i.e., S i g H ).
Looking at Figure 5, we can see a general increase in received inflation shocks coming from other countries and a higher contribution of global shocks to domestic inflation. In particular, advanced economies, except for Japan, exhibit clear upward trends and their inflation is subject to relatively higher spillovers compared to emerging economies. Figure 6 presents the net inflation spillovers obtained using S i g H , which is obtained by calculating the difference between directional spillovers from each G20 member country to others and from others to each G20 member country (i.e., S i g H = S i g H S i g H ). It provides interesting insights and clearly demonstrates the net inflation spillover of each G20 member over the sample period.
One remarkable observation gleaned from Figure 6 is that the US not only emerges as the largest net transmitter of inflation shocks to the G20 member countries, as documented by Istiak et al. (2021), Pham and Sala (2022), Aharon and Qadan (2022), and Hall et al. (2023), but also maintains an upward trend over the entire sample period. The Euro area’s countries are, for the most part, a net transmitter of inflation, but their influence is inconsistent and varies over time, while the UK turned into a net receiver of inflation spillover after Brexit. Our findings confirm the results reported by Hall et al. (2023) regarding inflationary shock transmissions pertaining to the US, the Euro area, and the UK. Japan turned into a net receiver after the GFC and the slowdown in economic growth due to the decline in aggregate demand (Akram 2019). China was also a net receiver of inflation spillovers, especially during times of high energy cost. Emerging economies, on the other hand, are mainly net receivers of inflation rather than net transmitters. Russia was the only exception among emerging economies that has a consistent contribution to inflation having grown over the past decade and continuing thereafter.5
Global economic events have an apparent yet diverse influence on the inflation transmission dynamics across economies. On one hand, we found that, during the GFC, both received and transmitted spillovers were inclined, and the overall spillover rate was also inflated. These findings are in accordance with those reported in Pham and Sala (2022). On the other hand, we observed a clear downtrend and reduced spillovers among economies during the COVID-19 pandemic. A plausible explanation is that the imposed lockdowns in several economies resulted in a decline in trade, which, in turn, dampened spillovers.

5. Conclusions

Motivated by the staggering inflation rates that have arisen due to the ramifications of the recent COVID-19 pandemic and the ongoing Russian–Ukrainian armed conflict, this paper investigated inflation spillovers among G20 economies using the Diebold and Yilmaz (2012) approach. The results we obtained show clear distinctions between advanced and emerging economies in their respective inflation spillover patterns. Advanced economies are the main contributors to total spillovers among the G20. Moreover, these economies absorb most of the spillovers originating from other countries, which indicates higher connectedness among these countries. The US, Canada, and Italy are net transmitters of spillovers, while France, Germany, the UK, and Japan are net receivers. When we evaluated spillovers in a dynamic setting, we observed that the US emerges as the largest net transmitter of inflation shocks to the G20 member countries and maintains an upward trend over the entire sample period, suggesting an increase in its influence on spillovers to other countries. Furthermore, France is the highest inflation absorber, while both the UK and Japan turned from being net transmitters to net receivers of inflation spillovers.
On the other hand, inflation rate fluctuations in emerging economies are mainly derived from idiosyncratic shocks, while global shocks make a modest contribution to domestic inflations. The contributions of these economies to total spillovers are lower compared to their advanced counterparts. All emerging economies are net inflation receivers except for Russia and Turkey. However, the contribution of these two economies to total spillovers is even lower than that of some advanced economies that are net absorbers of spillovers. Furthermore, the estimates of bilateral spillovers among the G20 group show that the average pairwise directional connectedness coming from and going to emerging economies is lower compared to their advanced counterparts.
The results show that spillovers have a significant impact on the observed inflation rate in advanced economies. The high spillover rate and the estimated pairwise directional spillovers explicate the synchronized behavior and the co-movement of macroeconomic variables across these economies. This implies that policymakers in advanced economies are expected to implement fairly similar policies to respond to global shocks and mitigate spillover effects. On the other hand, inflation rate variabilities in emerging economies mostly arise from country-specific shocks. However, estimates of spillover dynamics show a growing influence of received inflation spillovers from external shocks on domestic economies. Thus, while efforts to control inflation in these emerging economies should mainly be directed at shocks induced within the economy, policymakers must also contemplate external shocks and their influence on domestic economies. Taken altogether, monetary and fiscal authorities need to carefully evaluate inevitable spillover effects on domestic inflation and formulate adequate policy tools to confront external shocks. This is of crucial importance, particularly for economies that exhibit a high spillover rate and have turned out to be net receivers of spillovers.
The present study proposed three arguments for evaluating spillovers and their influence on domestic economies. First, advanced G20 economies are more inflation-dependent and absorb a higher rate of spillovers compared to emerging economies. Second, the total inflation spillover across G20 members and their interconnectedness, on average, is increasing over time. Third, spatial relationships and geographical distance play a role in augmenting spillovers and exhibit strong bilateral connectedness among the examined economies. The first two arguments were evaluated in static and dynamic settings, while the influence of spatial relationships and the contribution of regional shocks to global spillovers should be further investigated. Future research could illuminate whether inflation rates in emerging economies are more subject to regional spillovers than global shocks by using sub-samples across different regions and evaluating the connectedness levels among these economies.

Author Contributions

Conceptualization, N.S.A.-N. and A.A.A.; methodology, N.S.A.-N. and A.A.A.; software, N.S.A.-N. and A.A.A.; validation, N.S.A.-N. and A.A.A.; formal analysis, N.S.A.-N. and A.A.A.; investigation, N.S.A.-N. and A.A.A.; resources, N.S.A.-N. and A.A.A.; data curation, N.S.A.-N. and A.A.A.; writing—original draft preparation, N.S.A.-N. and A.A.A.; writing—review and editing, N.S.A.-N. and A.A.A.; visualization, N.S.A.-N. and A.A.A.; supervision, N.S.A.-N. and A.A.A.; project administration, N.S.A.-N. All authors have read and agreed to the published version of the manuscript.

Funding

Researchers would like to thank the Deanship of Scientific Research, Qassim University for funding publication of this project.

Institutional Review Board Statement

Not applicable.

Informed Consent Statement

Not applicable.

Data Availability Statement

The data were obtained from the IMF’s International Financial Statistics database and will be made available upon request.

Conflicts of Interest

The authors declare no conflict of interest.

Notes

1
Source: U.S. Energy Information Administration, Drilling Productivity Report (https://www.eia.gov/petroleum/drilling/pdf/dpr-full.pdf) (accessed on 1 March 2023)
2
The inflation rate in the United States remains well above the specified target set by the Federal Open Market Committee (FOMC) in the United States (Bordo and Levy 2022; Levy and Plosser 2022), even with instant review and the continuous rise in interest rates. The European Economic and Monetary Union (EMU) also set unified inflation target and contractionary monetary policies are implemented to stabilize prices, but the problem is persistent (Herr and Nettekoven 2022). Inflation rates of emerging economies also show behavior synchronized to the activated international monetary policy, which results in a diverse effect on inflation figures of those emerging economies (Azad and Serletis 2022; Nispi Landi and Flaccadoro 2022).
3
Neely and Rapach (2011) used common dynamic properties of business cycle fluctuations across countries using Bayesian dynamic latent factor models to evaluate the impact of global shocks on inflation rates through international trade. Their results show that these shocks produce common characteristics and international co-movements in inflation rates. Mumtaz et al. (2011) performed a variance decomposition analysis between world, regional, and country-specific features and show that there is an increasing similarity in the inflation rates of countries across regions but the regional factors account for the bulk of the fluctuations in inflation rates. Aastveit et al. (2016) also estimated factor-augmented VAR (FAVAR) with separate world, regional, and domestic blocks and showed that foreign shocks explain a major share of business cycle accounting for 50–70 percent of the variation in domestic variables while regional factors explain 20 percent of the fluctuations in domestic variables.
4
Moosa and Bhatti (1997, p. 149) argued, “If normality, serial correlation or heteroscedasticity statistics are significant, the Phillips–Perron procedure should be adopted”.
5
Russia has great exposure to the US, the UK, Germany, France, Italy, and China, wherein Russian demand accounts for 1–3.7 per cent of its GDP, it and has a significant economic output influence in some key areas, particularly energy and food (Liadze et al. 2022).

References

  1. Aastveit, Knut Are, Hilde C. Bjørnland, and Leif Anders Thorsrud. 2016. The World Is Not Enough! Small Open Economies and Regional Dependence. The Scandinavian Journal of Economics 118: 168–95. [Google Scholar] [CrossRef]
  2. Agarwal, Ruchir, and Miles Kimball. 2022. Will Inflation Remain High. IMF Finance & Development. June. Available online: https://www.imf.org/en/Publications/fandd/issues/2022/03/Future-of-inflation-partI-Agarwal-kimball (accessed on 5 January 2023).
  3. Aharon, David Y., and Mahmoud Qadan. 2022. Infection, invasion, and inflation: Recent lessons. Finance Research Letters 50: 103307. [Google Scholar] [CrossRef]
  4. Akram, Tanweer. 2019. The Japanese Economy: Stagnation, Recovery, and Challenges. Journal of Economic Issues 53: 403–10. [Google Scholar] [CrossRef]
  5. Alodadi, Ahmed, and James Benhin. 2015. Long term economic growth in oil-rich Saudi Arabia: What is the role for non-oil sectors. Economic Issues 20: 109–29. [Google Scholar]
  6. Alotaibi, Abdullah R., and Anil V. Mishra. 2017. Time varying international financial integration for GCC stock markets. The Quarterly Review of Economics and Finance 63: 66–78. [Google Scholar] [CrossRef]
  7. Azad, Nahiyan Faisal, and Apostolos Serletis. 2022. Spillovers of U.S. monetary policy uncertainty on inflation targeting emerging economies. Emerging Markets Review 51: 100875. [Google Scholar] [CrossRef]
  8. Azad, Nahiyan Faisal, Apostolos Serletis, and Libo Xu. 2021. Covid-19 and monetary–fiscal policy interactions in Canada. The Quarterly Review of Economics and Finance 81: 376–84. [Google Scholar] [CrossRef]
  9. Baqaee, David, and Emmanuel Farhi. 2022. Supply and Demand in Disaggregated Keynesian Economies with an Application to the COVID-19 Crisis. American Economic Review 112: 1397–436. [Google Scholar] [CrossRef]
  10. Baruník, Jozef, and Tomáš Křehlík. 2018. Measuring the Frequency Dynamics of Financial Connectedness and Systemic Risk. Journal of Financial Econometrics 16: 271–96. [Google Scholar] [CrossRef]
  11. Belke, Ansgar, Irina Dubova, and Thomas Osowski. 2018. Policy uncertainty and international financial markets: The case of Brexit. Applied Economics 50: 3752–70. [Google Scholar] [CrossRef]
  12. Bhatti, Razzaque H., and Nassar S. Al-Nassar. 2021. Price convergence and goods market integration in GCC countries. Macroeconomics and Finance in Emerging Market Economies 14: 86–104. [Google Scholar] [CrossRef]
  13. Bordo, Michael D., and Mickey D. Levy. 2022. The Fed’s Delayed Exits from Monetary Ease: The Fed Rarely Learns from History. Shadow Open Market Committee. February 11. Available online: https://www.shadowfed.org/wp-content/uploads/2022/02/Bordo-Levy-SOMC-February2022.pdf (accessed on 12 December 2022).
  14. Calvo, Guillermo A., and Frederic S. Mishkin. 2003. The Mirage of Exchange Rate Regimes for Emerging Market Countries. Journal of Economic Perspectives 17: 99–118. [Google Scholar] [CrossRef]
  15. Caselli, Francesca G., and Agustin Roitman. 2019. Nonlinear exchange-rate pass-through in emerging markets. International Finance 22: 279–306. [Google Scholar] [CrossRef]
  16. Ciccarelli, Matteo, and Benoît Mojon. 2010. Global Inflation. The Review of Economics and Statistics 92: 524–35. [Google Scholar] [CrossRef]
  17. Demirer, Mert, Francis X. Diebold, Laura Liu, and Kamil Yilmaz. 2018. Estimating global bank network connectedness. Journal of Applied Econometrics 33: 1–15. [Google Scholar] [CrossRef]
  18. Dickey, David A., and Wayne A. Fuller. 1979. Distribution of the estimators for autoregressive time series with a unit root. Journal of the American Statistical Association 74: 427–31. [Google Scholar] [CrossRef]
  19. Dickey, David A., and Wayne A. Fuller. 1981. Likelihood Ratio Statistics for Autoregressive Time Series with a Unit Root. Econometrica 49: 1057–72. [Google Scholar] [CrossRef]
  20. Diebold, Francis X., and Kamil Yilmaz. 2012. Better to give than to receive: Predictive directional measurement of volatility spillovers. International Journal of Forecasting 28: 57–66. [Google Scholar] [CrossRef]
  21. Diebold, Francis X., and Kamil Yılmaz. 2015. Financial and Macroeconomic Connectedness: A Network Approach to Measurement and Monitoring. New York: Oxford University Press. [Google Scholar]
  22. di Giovanni, Julian, Ṣebnem Kalemli-Özcan, Alvaro Silva, and Muhammed A. Yildirim. 2022. Global Supply Chain Pressures, International Trade, and Inflation. National Bureau of Economic Research Working Paper Series 30240; Cambridge: National Bureau of Economic Research. [Google Scholar] [CrossRef]
  23. Domash, Alex, and Lawrence H. Summers. 2022. How Tight Are U.S. Labor Markets? National Bureau of Economic Research Working Paper Series 29739; Cambridge: National Bureau of Economic. [Google Scholar] [CrossRef]
  24. Dräger, Lena, Klaus Gründler, and Niklas Potrafke. 2022. Political Shocks and Inflation Expectations: Evidence from the 2022 Russian Invasion of Ukraine. CESifo Working Paper No. 9649. Available online: https://www.cesifo.org/en/publikationen/2022/working-paper/political-shocks-and-inflation-expectations-evidence-2022-russian (accessed on 18 December 2022).
  25. Ebeke, Christian, and Armand Fouejieu. 2018. Inflation targeting and exchange rate regimes in emerging markets. The B.E. Journal of Macroeconomics 18. [Google Scholar] [CrossRef]
  26. Forbes, Kristin J., and Roberto Rigobon. 2002. No Contagion, Only Interdependence: Measuring Stock Market Comovements. The Journal of Finance 57: 2223–61. [Google Scholar] [CrossRef]
  27. Fratzscher, Marcel, Daniel Schneider, and Ine Van Robays. 2014. Oil Prices, Exchange Rates and Asset Prices. Frankfurt: European Central Bank. [Google Scholar]
  28. Gelos, R. Gaston, and Ratna Sahay. 2001. Financial market spillovers in transition economies. Economics of Transition 9: 53–86. [Google Scholar] [CrossRef]
  29. Gourinchas, Pierre-Olivier, Ṣebnem Kalemli-Özcan, Veronika Penciakova, and Nick Sander. 2021. Fiscal Policy in the Age of COVID: Does It ‘Get in All of the Cracks?’. National Bureau of Economic Research Working Paper Series 29293; Cambridge: National Bureau of Economic Research. [Google Scholar] [CrossRef]
  30. Hałka, Aleksandra, and Karol Szafranek. 2016. Whose Inflation Is It Anyway? Inflation Spillovers Between the Euro Area and Small Open Economies. Eastern European Economics 54: 109–32. [Google Scholar] [CrossRef]
  31. Hall, Stephen G., George S. Tavlas, and Yongli Wang. 2023. Drivers and spillover effects of inflation: The United States, the euro area, and the United Kingdom. Journal of International Money and Finance 131: 102776. [Google Scholar] [CrossRef]
  32. Hassen, Tarek Ben, and Hamid El Bilali. 2019. Food security in the gulf cooperation council countries: Challenges and prospects. Journal of Food Security 7: 159–69. [Google Scholar] [CrossRef]
  33. Herr, Hansjörg, and Zeynep Mualla Nettekoven. 2022. Macroeconomic Effects of the COVID-19 Pandemic in Germany and the European Monetary Union and Economic Policy Reactions. Berlin: Berlin School of Economics and Law, Institute for International Political Economy (IPE). [Google Scholar]
  34. Ianchovichina, Elena I., Josef L. Loening, and Christina A. Wood. 2014. How Vulnerable are Arab Countries to Global Food Price Shocks? The Journal of Development Studies 50: 1302–19. [Google Scholar] [CrossRef]
  35. Ilyas, Muhammad, Aamir Khan, Muhammad Nadeem, and Muhammad Tahir Suleman. 2021. Economic policy uncertainty, oil price shocks and corporate investment: Evidence from the oil industry. Energy Economics 97: 105193. [Google Scholar] [CrossRef]
  36. Istiak, Khandokar, Aviral Kumar Tiwari, Humaira Husain, and Kazi Sohag. 2021. The Spillover of Inflation among the G7 Countries. Journal of Risk and Financial Management 14: 392. [Google Scholar]
  37. Ito, Takatoshi, and Kiyotaka Sato. 2008. Exchange Rate Changes and Inflation in Post-Crisis Asian Economies: Vector Autoregression Analysis of the Exchange Rate Pass-Through. Journal of Money, Credit and Banking 40: 1407–38. [Google Scholar] [CrossRef]
  38. Jackson, James K., Martin A. Weiss, Andres B. Schwarzenberg, Rebecca M. Nelson, Karen M. Sutter, and Michael D. Sutherland. 2020. Global Economic Effects of COVID-19. Congressional Research Service, Report. Available online: https://fas.org/sgp/crs/row/R46270.pdf (accessed on 18 April 2023).
  39. Jacomy, Mathieu, Tommaso Venturini, Sebastien Heymann, and Mathieu Bastian. 2014. ForceAtlas2, a Continuous Graph Layout Algorithm for Handy Network Visualization Designed for the Gephi Software. PLoS ONE 9: e98679. [Google Scholar] [CrossRef]
  40. Jafari Samimi, Ahmad, Saman Ghaderi, Ramezan Hosseinzadeh, and Younes Nademi. 2012. Openness and inflation: New empirical panel data evidence. Economics Letters 117: 573–7. [Google Scholar] [CrossRef]
  41. Jarque, Carlos M., and Anil K. Bera. 1980. Efficient tests for normality, homoscedasticity and serial independence of regression residuals. Economics Letters 6: 255–9. [Google Scholar] [CrossRef]
  42. Jordà, Òscar, Celeste Liu, Fernanda Nechio, and Fabián Rivera-Reyes. 2022. Why Is US Inflation Higher than in Other Countries? FRBSF Economic Letter 7: 1–6. [Google Scholar]
  43. Kim, Sang W., and John H. Rogers. 1995. International stock price spillovers and market liberalization: Evidence from Korea, Japan, and the United States. Journal of Empirical Finance 2: 117–33. [Google Scholar] [CrossRef]
  44. Koop, Gary, M. Hashem Pesaran, and Simon M. Potter. 1996. Impulse response analysis in nonlinear multivariate models. Journal of Econometrics 74: 119–47. [Google Scholar] [CrossRef]
  45. Kose, M. Ayhan, Christopher Otrok, and Charles H. Whiteman. 2003. International Business Cycles: World, Region, and Country-Specific Factors. American Economic Review 93: 1216–39. [Google Scholar] [CrossRef]
  46. Kwark, Noh-Sun, and Hosung Lim. 2020. Have the free trade agreements reduced inflation rates? Economics Letters 189: 109054. [Google Scholar] [CrossRef]
  47. LaBelle, Jesse, and Ana Maria Santacreu. 2022. Global supply chain disruptions and inflation during the COVID-19 pandemic. Federal Reserve Bank of St. Louis Review 104: 78–91. [Google Scholar]
  48. Leibovici, Fernando, and Jason Dunn. 2021. Supply chain bottlenecks and inflation: The role of semiconductors. Federal Reserve Bank of St. Louis 28: 1–2. [Google Scholar] [CrossRef]
  49. Levy, Mickey D., and Charles I. Plosser. 2022. The Murky Future of Monetary Policy. Federal Reserve Bank of St. Louis Review 104: 178–88. [Google Scholar] [CrossRef]
  50. Liadze, Iana, Corrado Macchiarelli, Paul Mortimer-Lee, and Patricia Sanchez Juanino. 2022. The Economic Costs of the Russia-Ukraine Conflict. London: National Institute of Economic and Social Research Policy Papers. Available online: https://www.niesr.ac.uk/wp-content/uploads/2022/03/PP32-Economic-Costs-Russia-Ukraine.pdf (accessed on 18 April 2023).
  51. Mishkin, Frederic S. 2004. Can Inflation Targeting Work in Emerging Market Countries? National Bureau of Economic Research Working Paper Series 10646; Cambridge: National Bureau of Economic Research. [Google Scholar] [CrossRef]
  52. Moosa, Imad A., and Razzaque H. Bhatti. 1997. International Parity Conditions: Theory, Econometric Testing and Empirical Evidence. London: Palgrave Macmillan. [Google Scholar]
  53. Moshashai, Daniel, Andrew M. Leber, and James D. Savage. 2020. Saudi Arabia plans for its economic future: Vision 2030, the National Transformation Plan and Saudi fiscal reform. British Journal of Middle Eastern Studies 47: 381–401. [Google Scholar] [CrossRef]
  54. Mumtaz, Haroon, Saverio Simonelli, and Paolo Surico. 2011. International comovements, business cycle and inflation: A historical perspective. Review of Economic Dynamics 14: 176–98. [Google Scholar] [CrossRef]
  55. Nademi, Younes, and Peter Winker. 2022. Non-Linear Effects of Government Size on Inflation in OPEC Countries: A Threshold Panel Approach. Iranian Economic Review 26: 199–214. [Google Scholar] [CrossRef]
  56. Nas, Tevfik F., and Mark J. Perry. 2001. Turkish inflation and real output growth: 1963–2000. In Inflation and disinflation in Turkey. London: Routledge, pp. 145–60. [Google Scholar]
  57. Neely, Christopher J., and David E. Rapach. 2011. International comovements in inflation rates and country characteristics. Journal of International Money and Finance 30: 1471–90. [Google Scholar] [CrossRef]
  58. Neyapti, Bilin, and Neslihan Kaya. 2000. Inflation and Inflation Uncertainty in Turkey: Evidence from the Past Two Decades. Available online: https://www.researchgate.net/profile/Bilin-Neyapti/publication/228934677_Inflation_and_inflation_uncertainty_in_Turkey_evidence_from_the_past_two_decades/links/5def86134585159aa4712f3b/Inflation-and-inflation-uncertainty-in-Turkey-evidence-from-the-past-two-decades.pdf (accessed on 18 April 2023).
  59. Nispi Landi, Valerio, and Marco Flaccadoro. 2022. Foreign Monetary Policy and Domestic Inflation in Emerging Markets. Bank of Italy Temi di Discussione (Working Paper) 1365. Rome: Bank of Italy. [Google Scholar] [CrossRef]
  60. NU CEPAL. 2022. United States Economic Outlook: Inflation Trends Post COVID-19. ECLAC SYMBOL: LC/WAS/TS.2022/6. Santiago: Economic Commission for Latin America and the Caribbean. [Google Scholar]
  61. Ogarenko, Iuliia, and Klaus Hubacek. 2013. Eliminating Indirect Energy Subsidies in Ukraine: Estimation of Environmental and Socioeconomic Effects Using Input–Output Modeling. Journal of Economic Structures 2: 7. [Google Scholar] [CrossRef]
  62. Pesaran, H. Hashem, and Yongcheol Shin. 1998. Generalized impulse response analysis in linear multivariate models. Economics Letters 58: 17–29. [Google Scholar] [CrossRef]
  63. Pham, Binh Thai, and Hector Sala. 2022. Cross-country connectedness in inflation and unemployment: Measurement and macroeconomic consequences. Empirical Economics 62: 1123–46. [Google Scholar] [CrossRef]
  64. Phillips, Peter C. B., and Pierre Perron. 1988. Testing for a unit root in time series regression. Biometrika 75: 335–46. [Google Scholar] [CrossRef]
  65. Reis, Ricardo. 2022. Losing the inflation anchor. Brookings Papers on Economic Activity 2021: 307–79. [Google Scholar] [CrossRef]
  66. Romer, Christina D. 2021. The Fiscal Policy Response to the Pandemic. In Brookings Papers on Economic Activity. Washington, DC: Brookings Institution Press, pp. 89–110. [Google Scholar]
  67. Ropele, Tiziano, and Alex Tagliabracci. 2022. Perceived economic effects of the war in Ukraine: Survey-based evidence from Italian firms. Applied Economics Letters, 1–6. [Google Scholar] [CrossRef]
  68. Sarrakh, Redouane, Suresh Renukappa, Subashini Suresh, and Sabah Mushatat. 2020. Impact of subsidy reform on the kingdom of Saudi Arabia’s economy and carbon emissions. Energy Strategy Reviews 28: 100465. [Google Scholar] [CrossRef]
  69. Sdralevich, Carlo A., Randa Sab, Younes Zouhar, and Giorgia Albertin. 2014. Subsidy Reform in the Middle East and North Africa: Recent Progress and Challenges Ahead. Available online: https://www.imf.org/-/media/Websites/IMF/imported-full-text-pdf/external/pubs/ft/dp/2014/_1403mcd.ashx (accessed on 18 April 2023).
  70. Shapiro, Adam Hale. 2022. How Much do Supply and Demand Drive Inflation? FRBSF Economic Letter 15: 1–6. [Google Scholar]
  71. Su, D. Thanh, Nguyen Phuc Canh, and Christophe Schinckus. 2019. Impact of foreign direct investment, trade openness and economic institutions on growth in emerging countries: The case of Vietnam. Journal of International Studies 12: 243–64. [Google Scholar] [CrossRef]
  72. Summers, Lawrence. 2021. The Biden Stimulus Is Admirably Ambitious. But It Brings Some Big Risks, Too. Washington Post. February 4. Available online: https://www.washingtonpost.com/opinions/2021/02/04/larry-summers-biden-covid-stimulus/ (accessed on 18 April 2023).
  73. Tiwari, Aviral Kumar, Niyati Bhanja, Arif Billah Dar, and Olaolu Richard Olayeni. 2015. Analyzing Time–Frequency Based Co-movement in Inflation: Evidence from G-7 Countries. Computational Economics 45: 91–109. [Google Scholar] [CrossRef]
  74. Walmsley, Terrie, Adam Rose, Richard John, Dan Wei, Jakub P. Hlávka, Juan Machado, and Katie Byrd. 2023. Macroeconomic consequences of the COVID-19 pandemic. Economic Modelling 120: 106147. [Google Scholar] [CrossRef]
  75. Watson, Anna. 2016. Trade openness and inflation: The role of real and nominal price rigidities. Journal of International Money and Finance 64: 137–69. [Google Scholar] [CrossRef]
  76. Woertz, Eckart, Samir Pradhan, Nermina Biberovic, and Christian Koch. 2008. Food Inflation in the GCC Countries. Dubai: Gulf Research Center. Available online: https://www.files.ethz.ch/isn/111316/food_inflation_3609.pdf (accessed on 18 April 2023).
  77. Yamada, Hiroyuki. 2013. Does the exchange rate regime make a difference in inflation performance in developing and emerging countries?: The role of inflation targeting. Journal of International Money and Finance 32: 968–89. [Google Scholar] [CrossRef]
Figure 1. Inflation rate of G20 member countries over the full sample, expressed in percentages.
Economies 11 00126 g001aEconomies 11 00126 g001b
Figure 2. G20 members countries’ inflation network representing the full sample period.
Economies 11 00126 g002
Figure 3. Total inflation spillovers.
Economies 11 00126 g003
Figure 4. Directional inflation spillovers from G20 member countries.
Economies 11 00126 g004aEconomies 11 00126 g004b
Figure 5. Directional inflation spillovers to G20 member countries.
Economies 11 00126 g005aEconomies 11 00126 g005b
Figure 6. Net inflation spillovers, G20 member countries.
Economies 11 00126 g006aEconomies 11 00126 g006b
Table 1. Descriptive statistics.
BRACANCHNFRADEUINDIDNITAJPNKORMEXRUSSAUZAFTURUKUS
Mean2.730.160.310.120.150.540.660.180.020.250.652.650.150.482.220.180.20
Median0.520.170.200.120.120.560.420.190.000.200.520.800.100.431.340.230.20
Max38.821.423.971.412.464.4711.911.582.072.507.6732.525.702.6721.011.141.33
Min−0.51−1.04−1.67−1.01−1.04−2.12−1.07−0.68−0.83−0.75−1.02−0.54−4.91−1.14−1.45−0.70−1.93
Std7.320.350.860.290.370.791.200.240.330.430.815.220.610.472.460.300.34
Skew3.31−0.050.96−0.010.700.304.900.381.260.853.553.182.190.642.14−0.48−0.77
Kurt12.763.834.974.557.815.3135.607.0910.226.0724.1113.3842.434.8612.563.537.81
Student t7.10 *8.80 *6.77 *8.14 *7.71 *13.10 *10.50 *14.96 *1.2711.07 *15.17 *9.64 *4.66 *19.56 *17.20 *11.25 *11.35 *
Obs.363363363363363363363363363363363362363363363363363
JB
Prob
2101.3
0.00
10.4
0.00
114.4
0.00
36.5
0.00
380.0
0.00
85.9
0.00
17,523.2
0.00
261.4
0.00
885.3
0.00
186.3
0.00
7502.4
0.00
2236.5
0.00
23,806.5
0.00
77.4
0.00
1661.5
0.00
18.4
0.00
386.2
0.00
ADF−3.24 **−3.74 *−1.84−2.66 ***−1.12−3.60 *−5.72 *−1.55−3.81 *−3.19 **−2.70 ***−4.65 *−9.87 *−4.39 *−1.33−1.62−3.08 **
PP−3.27 **−14.61 *−13.78 *−18.83 *−19.31 *−12.42 *−9.59 *−15.48 *−15.49 *−12.65 *−5.54 *−6.57 *−17.52 *−13.84 *−7.74 *−18.80 *−9.60 *
Notes: The table reports the descriptive statistics of the monthly inflation series, including the mean (Mean), median (Median), standard deviation (Std), skewness (Skew), and kurtosis (Kurt); Student t is the Student’s t-test of the mean with the null that the mean of the inflation rate is equal to zero. JB is the normality test of Jarque and Bera (1980), and its test statistic is reported along with its associated p-values in square brackets. ADF = augmented Dickey and Fuller (1981); PP = Phillips and Perron (1988); the auxiliary regressions for the unit root tests are generated using y t = f ( d r i f t , y t 1 , y t 1 , y t 2 , , y t p ) ; the maximum lag length is set to 12 and the number of lags p for the ADF test regression are selected based on the Akaike information criterion (AIC). *, **, *** denotes the 1, 5, and 10 percent significance levels, respectively.
Table 2. Correlation matrix of monthly inflation rates.
BRACANCHNFRADEUINDIDNITAJPNKORMEXRUSSAUZAFTURUKUS
BRA1
CAN−0.071
CHN0.36−0.041
FRA0.050.360.011
DEU0.120.27−0.020.471
IND0.05−0.02−0.18−0.20−0.111
IDN0.00−0.100.03−0.080.040.051
ITA0.230.330.130.450.360.010.071
JPN0.050.110.190.24−0.010.03−0.090.111
KOR0.170.180.370.130.16−0.030.170.240.201
MEX0.04−0.010.210.01−0.01−0.040.190.22−0.020.201
RUS0.74−0.020.360.050.130.000.080.300.070.160.271
SAU−0.06−0.020.09−0.03−0.060.080.000.01−0.040.070.04−0.021
ZAF0.160.200.130.090.180.120.170.200.180.240.180.220.141
TUR0.380.030.280.100.04−0.030.160.320.120.180.420.41−0.060.161
UK0.050.200.120.580.29−0.07−0.130.190.370.070.030.06−0.130.010.091
US0.030.700.110.430.280.00−0.050.420.260.360.000.050.060.320.100.241
Table 3. Monthly inflation spillover table.
From
ToBRACANCHNFRADEUINDIDNITAJPNKORMEXRUSSAUZAFTURUKUSContribution
from Others
BRA64.710.891.940.030.030.391.530.180.532.371.0721.700.150.252.960.980.3235.30
CAN0.6246.780.154.643.902.220.839.830.781.550.770.150.101.570.490.6225.0053.20
CHN4.451.4047.051.243.283.300.661.4610.036.593.493.122.371.872.234.832.6352.90
FRA0.457.630.8237.677.914.200.7511.731.633.850.530.120.292.211.4210.977.8162.30
DEU0.134.131.0810.6749.162.750.7213.511.671.003.480.560.361.092.103.534.0650.80
IND0.523.521.114.883.0664.741.193.280.891.970.260.540.582.181.224.805.2435.30
IDN0.310.481.130.441.033.4471.930.402.236.772.161.090.121.464.431.860.7228.10
ITA0.194.183.4710.224.422.000.3550.440.891.380.932.600.241.447.081.258.9349.60
JPN0.312.983.162.412.950.523.702.2061.572.620.150.120.202.321.377.775.6538.40
KOR0.351.192.841.133.140.601.896.857.9558.630.711.640.951.183.822.844.2941.40
MEX3.390.664.402.472.375.520.650.421.200.4750.248.273.420.7214.230.680.8849.80
RUS7.670.083.220.220.171.416.870.930.063.260.8066.270.482.076.090.210.2033.70
SAU0.550.753.140.551.100.900.131.680.370.723.781.6778.593.080.641.990.3521.40
ZAF1.246.880.150.941.461.152.362.471.392.032.381.051.7762.212.292.617.6237.80
TUR1.481.712.330.460.421.761.280.842.600.784.324.440.200.4474.911.530.5125.10
UK0.684.101.8411.686.992.362.335.144.073.320.610.211.332.811.3844.726.4255.30
US0.0818.600.806.507.312.150.9012.072.083.230.890.180.111.640.851.6041.0159.00
Contribution to others22.459.231.658.549.534.726.17338.341.926.347.512.626.352.648.180.6729.4
Contribution including own87.110678.696.298.799.498.1123.499.9100.676.6113.791.288.5127.592.8121.6Spillover index
Net inflation spillover−12.96−21.3−3.8−1.3−0.6−223.4−0.10.5−23.513.8−8.8−11.527.5−7.221.6 729.40 1699.9 = 43 %
Notes: The underlying variance decomposition is based upon a monthly VAR of order 2. The i ,   j -th value is the estimated contribution to the variance of 12-month-ahead monthly inflation forecast error of country i coming from innovations to monthly inflation of county j . In terms of directional spillovers transmitted to others as measured using S i g H , the US emerges as the largest contributor to the other G20 member countries’ forecast error variance with 80.6%, while Saudi Arabia appears to be the smallest contributor to other countries with only 12.6%. The finding regarding the US is in accordance with Pham and Sala (2022) and Aharon and Qadan (2022) while the low contribution of Saudi Arabia is not surprising given the relatively small proportion of Saudi nonoil exports compared to other G20 countries (Alodadi and Benhin 2015). For the most part, advanced G20 member countries seem to transmit more inflation shocks to other countries. A remarkable exception is Japan whose contribution to other countries’ inflation is exceeded by some emerging countries such as Turkey and Russia and that the inflation rate of Japan majorly stems from idiosyncratic shocks as pointed out by Aharon and Qadan (2022). The stable and low inflation rate in Japan over the sample period justifies this finding.
Disclaimer/Publisher’s Note: The statements, opinions and data contained in all publications are solely those of the individual author(s) and contributor(s) and not of MDPI and/or the editor(s). MDPI and/or the editor(s) disclaim responsibility for any injury to people or property resulting from any ideas, methods, instructions or products referred to in the content.

