Inflation Spillovers among Advanced and Emerging Economies: Evidence from the G20 Group
Abstract
1. Introduction
2. Methodology
3. Data and Descriptive Statistics
4. Results and Discussions
4.1. Unconditional Inflation Spillover Patterns
4.2. Conditional Inflation Spillover Patterns
5. Conclusions
Author Contributions
Funding
Institutional Review Board Statement
Informed Consent Statement
Data Availability Statement
Conflicts of Interest
| 1 | Source: U.S. Energy Information Administration, Drilling Productivity Report (https://www.eia.gov/petroleum/drilling/pdf/dpr-full.pdf) (accessed on 1 March 2023) |
| 2 | The inflation rate in the United States remains well above the specified target set by the Federal Open Market Committee (FOMC) in the United States (Bordo and Levy 2022; Levy and Plosser 2022), even with instant review and the continuous rise in interest rates. The European Economic and Monetary Union (EMU) also set unified inflation target and contractionary monetary policies are implemented to stabilize prices, but the problem is persistent (Herr and Nettekoven 2022). Inflation rates of emerging economies also show behavior synchronized to the activated international monetary policy, which results in a diverse effect on inflation figures of those emerging economies (Azad and Serletis 2022; Nispi Landi and Flaccadoro 2022). |
| 3 | Neely and Rapach (2011) used common dynamic properties of business cycle fluctuations across countries using Bayesian dynamic latent factor models to evaluate the impact of global shocks on inflation rates through international trade. Their results show that these shocks produce common characteristics and international co-movements in inflation rates. Mumtaz et al. (2011) performed a variance decomposition analysis between world, regional, and country-specific features and show that there is an increasing similarity in the inflation rates of countries across regions but the regional factors account for the bulk of the fluctuations in inflation rates. Aastveit et al. (2016) also estimated factor-augmented VAR (FAVAR) with separate world, regional, and domestic blocks and showed that foreign shocks explain a major share of business cycle accounting for 50–70 percent of the variation in domestic variables while regional factors explain 20 percent of the fluctuations in domestic variables. |
| 4 | Moosa and Bhatti (1997, p. 149) argued, “If normality, serial correlation or heteroscedasticity statistics are significant, the Phillips–Perron procedure should be adopted”. |
| 5 | Russia has great exposure to the US, the UK, Germany, France, Italy, and China, wherein Russian demand accounts for 1–3.7 per cent of its GDP, it and has a significant economic output influence in some key areas, particularly energy and food (Liadze et al. 2022). |
References
- Aastveit, Knut Are, Hilde C. Bjørnland, and Leif Anders Thorsrud. 2016. The World Is Not Enough! Small Open Economies and Regional Dependence. The Scandinavian Journal of Economics 118: 168–95. [Google Scholar] [CrossRef]
- Agarwal, Ruchir, and Miles Kimball. 2022. Will Inflation Remain High. IMF Finance & Development. June. Available online: https://www.imf.org/en/Publications/fandd/issues/2022/03/Future-of-inflation-partI-Agarwal-kimball (accessed on 5 January 2023).
- Aharon, David Y., and Mahmoud Qadan. 2022. Infection, invasion, and inflation: Recent lessons. Finance Research Letters 50: 103307. [Google Scholar] [CrossRef]
- Akram, Tanweer. 2019. The Japanese Economy: Stagnation, Recovery, and Challenges. Journal of Economic Issues 53: 403–10. [Google Scholar] [CrossRef]
- Alodadi, Ahmed, and James Benhin. 2015. Long term economic growth in oil-rich Saudi Arabia: What is the role for non-oil sectors. Economic Issues 20: 109–29. [Google Scholar]
- Alotaibi, Abdullah R., and Anil V. Mishra. 2017. Time varying international financial integration for GCC stock markets. The Quarterly Review of Economics and Finance 63: 66–78. [Google Scholar] [CrossRef]
- Azad, Nahiyan Faisal, and Apostolos Serletis. 2022. Spillovers of U.S. monetary policy uncertainty on inflation targeting emerging economies. Emerging Markets Review 51: 100875. [Google Scholar] [CrossRef]
- Azad, Nahiyan Faisal, Apostolos Serletis, and Libo Xu. 2021. Covid-19 and monetary–fiscal policy interactions in Canada. The Quarterly Review of Economics and Finance 81: 376–84. [Google Scholar] [CrossRef]
- Baqaee, David, and Emmanuel Farhi. 2022. Supply and Demand in Disaggregated Keynesian Economies with an Application to the COVID-19 Crisis. American Economic Review 112: 1397–436. [Google Scholar] [CrossRef]
- Baruník, Jozef, and Tomáš Křehlík. 2018. Measuring the Frequency Dynamics of Financial Connectedness and Systemic Risk. Journal of Financial Econometrics 16: 271–96. [Google Scholar] [CrossRef]
- Belke, Ansgar, Irina Dubova, and Thomas Osowski. 2018. Policy uncertainty and international financial markets: The case of Brexit. Applied Economics 50: 3752–70. [Google Scholar] [CrossRef]
- Bhatti, Razzaque H., and Nassar S. Al-Nassar. 2021. Price convergence and goods market integration in GCC countries. Macroeconomics and Finance in Emerging Market Economies 14: 86–104. [Google Scholar] [CrossRef]
- Bordo, Michael D., and Mickey D. Levy. 2022. The Fed’s Delayed Exits from Monetary Ease: The Fed Rarely Learns from History. Shadow Open Market Committee. February 11. Available online: https://www.shadowfed.org/wp-content/uploads/2022/02/Bordo-Levy-SOMC-February2022.pdf (accessed on 12 December 2022).
- Calvo, Guillermo A., and Frederic S. Mishkin. 2003. The Mirage of Exchange Rate Regimes for Emerging Market Countries. Journal of Economic Perspectives 17: 99–118. [Google Scholar] [CrossRef]
- Caselli, Francesca G., and Agustin Roitman. 2019. Nonlinear exchange-rate pass-through in emerging markets. International Finance 22: 279–306. [Google Scholar] [CrossRef]
- Ciccarelli, Matteo, and Benoît Mojon. 2010. Global Inflation. The Review of Economics and Statistics 92: 524–35. [Google Scholar] [CrossRef]
- Demirer, Mert, Francis X. Diebold, Laura Liu, and Kamil Yilmaz. 2018. Estimating global bank network connectedness. Journal of Applied Econometrics 33: 1–15. [Google Scholar] [CrossRef]
- Dickey, David A., and Wayne A. Fuller. 1979. Distribution of the estimators for autoregressive time series with a unit root. Journal of the American Statistical Association 74: 427–31. [Google Scholar] [CrossRef]
- Dickey, David A., and Wayne A. Fuller. 1981. Likelihood Ratio Statistics for Autoregressive Time Series with a Unit Root. Econometrica 49: 1057–72. [Google Scholar] [CrossRef]
- Diebold, Francis X., and Kamil Yilmaz. 2012. Better to give than to receive: Predictive directional measurement of volatility spillovers. International Journal of Forecasting 28: 57–66. [Google Scholar] [CrossRef]
- Diebold, Francis X., and Kamil Yılmaz. 2015. Financial and Macroeconomic Connectedness: A Network Approach to Measurement and Monitoring. New York: Oxford University Press. [Google Scholar]
- di Giovanni, Julian, Ṣebnem Kalemli-Özcan, Alvaro Silva, and Muhammed A. Yildirim. 2022. Global Supply Chain Pressures, International Trade, and Inflation. National Bureau of Economic Research Working Paper Series 30240; Cambridge: National Bureau of Economic Research. [Google Scholar] [CrossRef]
- Domash, Alex, and Lawrence H. Summers. 2022. How Tight Are U.S. Labor Markets? National Bureau of Economic Research Working Paper Series 29739; Cambridge: National Bureau of Economic. [Google Scholar] [CrossRef]
- Dräger, Lena, Klaus Gründler, and Niklas Potrafke. 2022. Political Shocks and Inflation Expectations: Evidence from the 2022 Russian Invasion of Ukraine. CESifo Working Paper No. 9649. Available online: https://www.cesifo.org/en/publikationen/2022/working-paper/political-shocks-and-inflation-expectations-evidence-2022-russian (accessed on 18 December 2022).
- Ebeke, Christian, and Armand Fouejieu. 2018. Inflation targeting and exchange rate regimes in emerging markets. The B.E. Journal of Macroeconomics 18. [Google Scholar] [CrossRef]
- Forbes, Kristin J., and Roberto Rigobon. 2002. No Contagion, Only Interdependence: Measuring Stock Market Comovements. The Journal of Finance 57: 2223–61. [Google Scholar] [CrossRef]
- Fratzscher, Marcel, Daniel Schneider, and Ine Van Robays. 2014. Oil Prices, Exchange Rates and Asset Prices. Frankfurt: European Central Bank. [Google Scholar]
- Gelos, R. Gaston, and Ratna Sahay. 2001. Financial market spillovers in transition economies. Economics of Transition 9: 53–86. [Google Scholar] [CrossRef]
- Gourinchas, Pierre-Olivier, Ṣebnem Kalemli-Özcan, Veronika Penciakova, and Nick Sander. 2021. Fiscal Policy in the Age of COVID: Does It ‘Get in All of the Cracks?’. National Bureau of Economic Research Working Paper Series 29293; Cambridge: National Bureau of Economic Research. [Google Scholar] [CrossRef]
- Hałka, Aleksandra, and Karol Szafranek. 2016. Whose Inflation Is It Anyway? Inflation Spillovers Between the Euro Area and Small Open Economies. Eastern European Economics 54: 109–32. [Google Scholar] [CrossRef]
- Hall, Stephen G., George S. Tavlas, and Yongli Wang. 2023. Drivers and spillover effects of inflation: The United States, the euro area, and the United Kingdom. Journal of International Money and Finance 131: 102776. [Google Scholar] [CrossRef]
- Hassen, Tarek Ben, and Hamid El Bilali. 2019. Food security in the gulf cooperation council countries: Challenges and prospects. Journal of Food Security 7: 159–69. [Google Scholar] [CrossRef]
- Herr, Hansjörg, and Zeynep Mualla Nettekoven. 2022. Macroeconomic Effects of the COVID-19 Pandemic in Germany and the European Monetary Union and Economic Policy Reactions. Berlin: Berlin School of Economics and Law, Institute for International Political Economy (IPE). [Google Scholar]
- Ianchovichina, Elena I., Josef L. Loening, and Christina A. Wood. 2014. How Vulnerable are Arab Countries to Global Food Price Shocks? The Journal of Development Studies 50: 1302–19. [Google Scholar] [CrossRef]
- Ilyas, Muhammad, Aamir Khan, Muhammad Nadeem, and Muhammad Tahir Suleman. 2021. Economic policy uncertainty, oil price shocks and corporate investment: Evidence from the oil industry. Energy Economics 97: 105193. [Google Scholar] [CrossRef]
- Istiak, Khandokar, Aviral Kumar Tiwari, Humaira Husain, and Kazi Sohag. 2021. The Spillover of Inflation among the G7 Countries. Journal of Risk and Financial Management 14: 392. [Google Scholar]
- Ito, Takatoshi, and Kiyotaka Sato. 2008. Exchange Rate Changes and Inflation in Post-Crisis Asian Economies: Vector Autoregression Analysis of the Exchange Rate Pass-Through. Journal of Money, Credit and Banking 40: 1407–38. [Google Scholar] [CrossRef]
- Jackson, James K., Martin A. Weiss, Andres B. Schwarzenberg, Rebecca M. Nelson, Karen M. Sutter, and Michael D. Sutherland. 2020. Global Economic Effects of COVID-19. Congressional Research Service, Report. Available online: https://fas.org/sgp/crs/row/R46270.pdf (accessed on 18 April 2023).
- Jacomy, Mathieu, Tommaso Venturini, Sebastien Heymann, and Mathieu Bastian. 2014. ForceAtlas2, a Continuous Graph Layout Algorithm for Handy Network Visualization Designed for the Gephi Software. PLoS ONE 9: e98679. [Google Scholar] [CrossRef]
- Jafari Samimi, Ahmad, Saman Ghaderi, Ramezan Hosseinzadeh, and Younes Nademi. 2012. Openness and inflation: New empirical panel data evidence. Economics Letters 117: 573–7. [Google Scholar] [CrossRef]
- Jarque, Carlos M., and Anil K. Bera. 1980. Efficient tests for normality, homoscedasticity and serial independence of regression residuals. Economics Letters 6: 255–9. [Google Scholar] [CrossRef]
- Jordà, Òscar, Celeste Liu, Fernanda Nechio, and Fabián Rivera-Reyes. 2022. Why Is US Inflation Higher than in Other Countries? FRBSF Economic Letter 7: 1–6. [Google Scholar]
- Kim, Sang W., and John H. Rogers. 1995. International stock price spillovers and market liberalization: Evidence from Korea, Japan, and the United States. Journal of Empirical Finance 2: 117–33. [Google Scholar] [CrossRef]
- Koop, Gary, M. Hashem Pesaran, and Simon M. Potter. 1996. Impulse response analysis in nonlinear multivariate models. Journal of Econometrics 74: 119–47. [Google Scholar] [CrossRef]
- Kose, M. Ayhan, Christopher Otrok, and Charles H. Whiteman. 2003. International Business Cycles: World, Region, and Country-Specific Factors. American Economic Review 93: 1216–39. [Google Scholar] [CrossRef]
- Kwark, Noh-Sun, and Hosung Lim. 2020. Have the free trade agreements reduced inflation rates? Economics Letters 189: 109054. [Google Scholar] [CrossRef]
- LaBelle, Jesse, and Ana Maria Santacreu. 2022. Global supply chain disruptions and inflation during the COVID-19 pandemic. Federal Reserve Bank of St. Louis Review 104: 78–91. [Google Scholar]
- Leibovici, Fernando, and Jason Dunn. 2021. Supply chain bottlenecks and inflation: The role of semiconductors. Federal Reserve Bank of St. Louis 28: 1–2. [Google Scholar] [CrossRef]
- Levy, Mickey D., and Charles I. Plosser. 2022. The Murky Future of Monetary Policy. Federal Reserve Bank of St. Louis Review 104: 178–88. [Google Scholar] [CrossRef]
- Liadze, Iana, Corrado Macchiarelli, Paul Mortimer-Lee, and Patricia Sanchez Juanino. 2022. The Economic Costs of the Russia-Ukraine Conflict. London: National Institute of Economic and Social Research Policy Papers. Available online: https://www.niesr.ac.uk/wp-content/uploads/2022/03/PP32-Economic-Costs-Russia-Ukraine.pdf (accessed on 18 April 2023).
- Mishkin, Frederic S. 2004. Can Inflation Targeting Work in Emerging Market Countries? National Bureau of Economic Research Working Paper Series 10646; Cambridge: National Bureau of Economic Research. [Google Scholar] [CrossRef]
- Moosa, Imad A., and Razzaque H. Bhatti. 1997. International Parity Conditions: Theory, Econometric Testing and Empirical Evidence. London: Palgrave Macmillan. [Google Scholar]
- Moshashai, Daniel, Andrew M. Leber, and James D. Savage. 2020. Saudi Arabia plans for its economic future: Vision 2030, the National Transformation Plan and Saudi fiscal reform. British Journal of Middle Eastern Studies 47: 381–401. [Google Scholar] [CrossRef]
- Mumtaz, Haroon, Saverio Simonelli, and Paolo Surico. 2011. International comovements, business cycle and inflation: A historical perspective. Review of Economic Dynamics 14: 176–98. [Google Scholar] [CrossRef]
- Nademi, Younes, and Peter Winker. 2022. Non-Linear Effects of Government Size on Inflation in OPEC Countries: A Threshold Panel Approach. Iranian Economic Review 26: 199–214. [Google Scholar] [CrossRef]
- Nas, Tevfik F., and Mark J. Perry. 2001. Turkish inflation and real output growth: 1963–2000. In Inflation and disinflation in Turkey. London: Routledge, pp. 145–60. [Google Scholar]
- Neely, Christopher J., and David E. Rapach. 2011. International comovements in inflation rates and country characteristics. Journal of International Money and Finance 30: 1471–90. [Google Scholar] [CrossRef]
- Neyapti, Bilin, and Neslihan Kaya. 2000. Inflation and Inflation Uncertainty in Turkey: Evidence from the Past Two Decades. Available online: https://www.researchgate.net/profile/Bilin-Neyapti/publication/228934677_Inflation_and_inflation_uncertainty_in_Turkey_evidence_from_the_past_two_decades/links/5def86134585159aa4712f3b/Inflation-and-inflation-uncertainty-in-Turkey-evidence-from-the-past-two-decades.pdf (accessed on 18 April 2023).
- Nispi Landi, Valerio, and Marco Flaccadoro. 2022. Foreign Monetary Policy and Domestic Inflation in Emerging Markets. Bank of Italy Temi di Discussione (Working Paper) 1365. Rome: Bank of Italy. [Google Scholar] [CrossRef]
- NU CEPAL. 2022. United States Economic Outlook: Inflation Trends Post COVID-19. ECLAC SYMBOL: LC/WAS/TS.2022/6. Santiago: Economic Commission for Latin America and the Caribbean. [Google Scholar]
- Ogarenko, Iuliia, and Klaus Hubacek. 2013. Eliminating Indirect Energy Subsidies in Ukraine: Estimation of Environmental and Socioeconomic Effects Using Input–Output Modeling. Journal of Economic Structures 2: 7. [Google Scholar] [CrossRef]
- Pesaran, H. Hashem, and Yongcheol Shin. 1998. Generalized impulse response analysis in linear multivariate models. Economics Letters 58: 17–29. [Google Scholar] [CrossRef]
- Pham, Binh Thai, and Hector Sala. 2022. Cross-country connectedness in inflation and unemployment: Measurement and macroeconomic consequences. Empirical Economics 62: 1123–46. [Google Scholar] [CrossRef]
- Phillips, Peter C. B., and Pierre Perron. 1988. Testing for a unit root in time series regression. Biometrika 75: 335–46. [Google Scholar] [CrossRef]
- Reis, Ricardo. 2022. Losing the inflation anchor. Brookings Papers on Economic Activity 2021: 307–79. [Google Scholar] [CrossRef]
- Romer, Christina D. 2021. The Fiscal Policy Response to the Pandemic. In Brookings Papers on Economic Activity. Washington, DC: Brookings Institution Press, pp. 89–110. [Google Scholar]
- Ropele, Tiziano, and Alex Tagliabracci. 2022. Perceived economic effects of the war in Ukraine: Survey-based evidence from Italian firms. Applied Economics Letters, 1–6. [Google Scholar] [CrossRef]
- Sarrakh, Redouane, Suresh Renukappa, Subashini Suresh, and Sabah Mushatat. 2020. Impact of subsidy reform on the kingdom of Saudi Arabia’s economy and carbon emissions. Energy Strategy Reviews 28: 100465. [Google Scholar] [CrossRef]
- Sdralevich, Carlo A., Randa Sab, Younes Zouhar, and Giorgia Albertin. 2014. Subsidy Reform in the Middle East and North Africa: Recent Progress and Challenges Ahead. Available online: https://www.imf.org/-/media/Websites/IMF/imported-full-text-pdf/external/pubs/ft/dp/2014/_1403mcd.ashx (accessed on 18 April 2023).
- Shapiro, Adam Hale. 2022. How Much do Supply and Demand Drive Inflation? FRBSF Economic Letter 15: 1–6. [Google Scholar]
- Su, D. Thanh, Nguyen Phuc Canh, and Christophe Schinckus. 2019. Impact of foreign direct investment, trade openness and economic institutions on growth in emerging countries: The case of Vietnam. Journal of International Studies 12: 243–64. [Google Scholar] [CrossRef]
- Summers, Lawrence. 2021. The Biden Stimulus Is Admirably Ambitious. But It Brings Some Big Risks, Too. Washington Post. February 4. Available online: https://www.washingtonpost.com/opinions/2021/02/04/larry-summers-biden-covid-stimulus/ (accessed on 18 April 2023).
- Tiwari, Aviral Kumar, Niyati Bhanja, Arif Billah Dar, and Olaolu Richard Olayeni. 2015. Analyzing Time–Frequency Based Co-movement in Inflation: Evidence from G-7 Countries. Computational Economics 45: 91–109. [Google Scholar] [CrossRef]
- Walmsley, Terrie, Adam Rose, Richard John, Dan Wei, Jakub P. Hlávka, Juan Machado, and Katie Byrd. 2023. Macroeconomic consequences of the COVID-19 pandemic. Economic Modelling 120: 106147. [Google Scholar] [CrossRef]
- Watson, Anna. 2016. Trade openness and inflation: The role of real and nominal price rigidities. Journal of International Money and Finance 64: 137–69. [Google Scholar] [CrossRef]
- Woertz, Eckart, Samir Pradhan, Nermina Biberovic, and Christian Koch. 2008. Food Inflation in the GCC Countries. Dubai: Gulf Research Center. Available online: https://www.files.ethz.ch/isn/111316/food_inflation_3609.pdf (accessed on 18 April 2023).
- Yamada, Hiroyuki. 2013. Does the exchange rate regime make a difference in inflation performance in developing and emerging countries?: The role of inflation targeting. Journal of International Money and Finance 32: 968–89. [Google Scholar] [CrossRef]
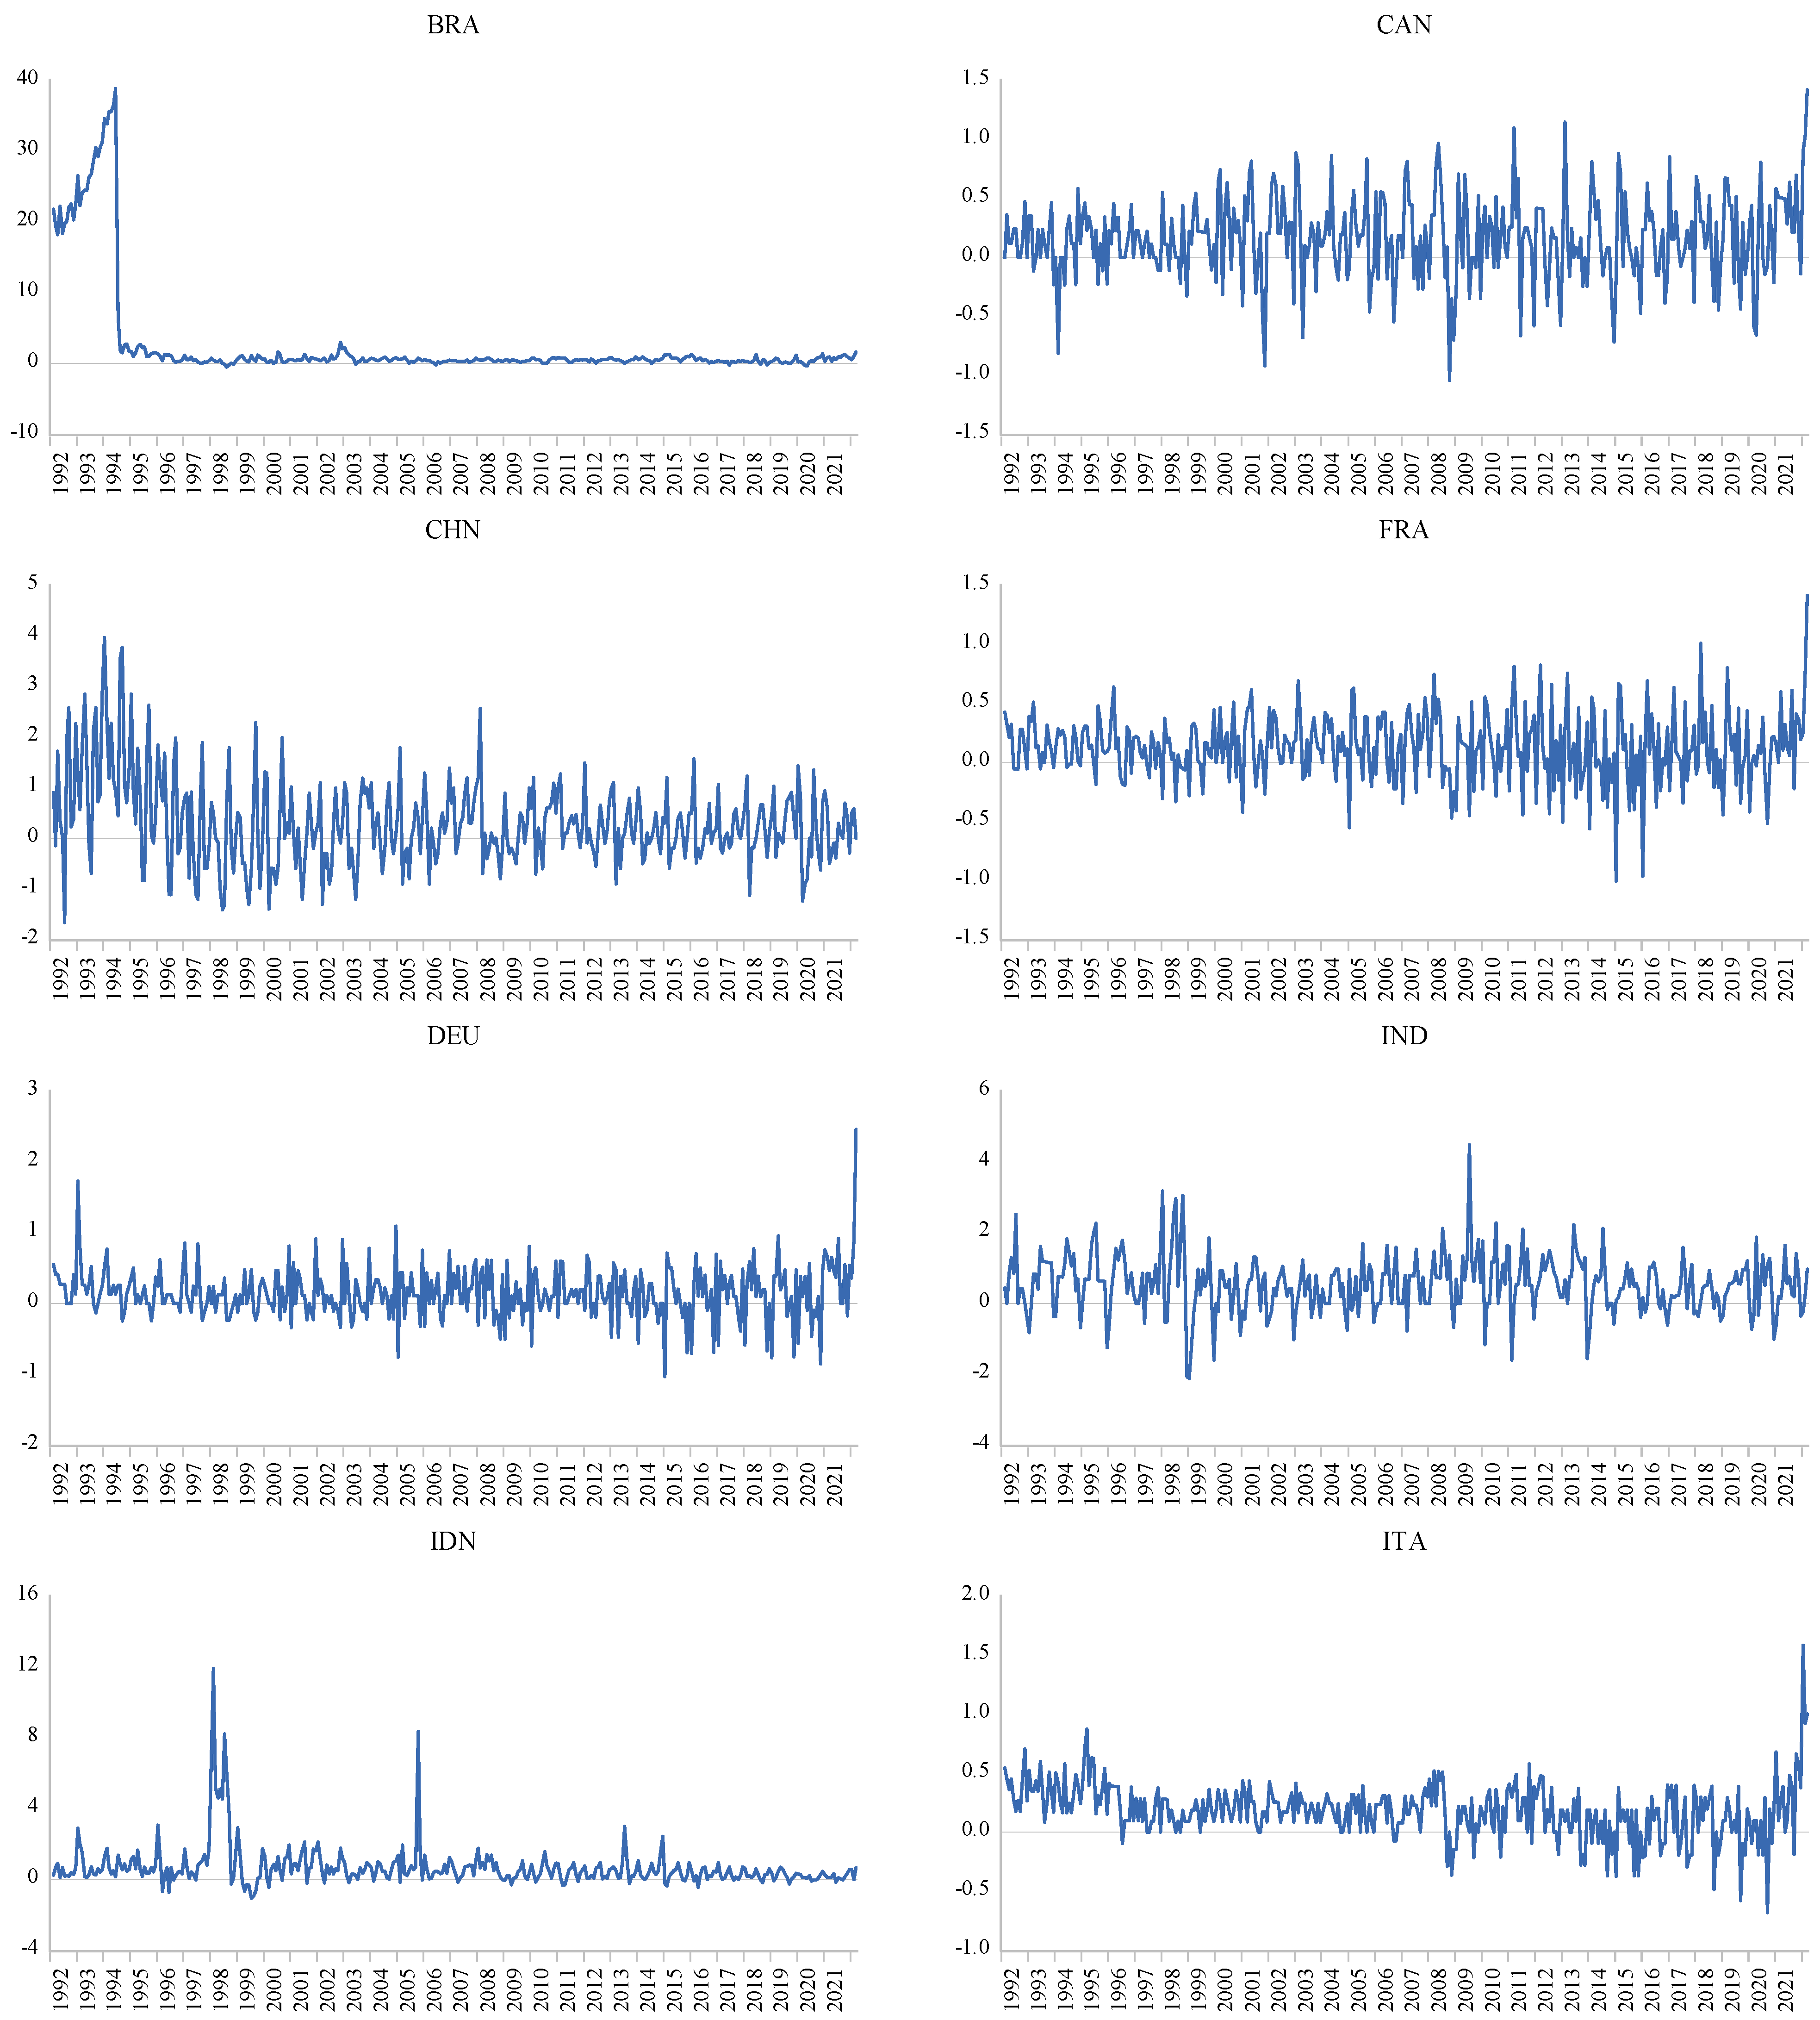
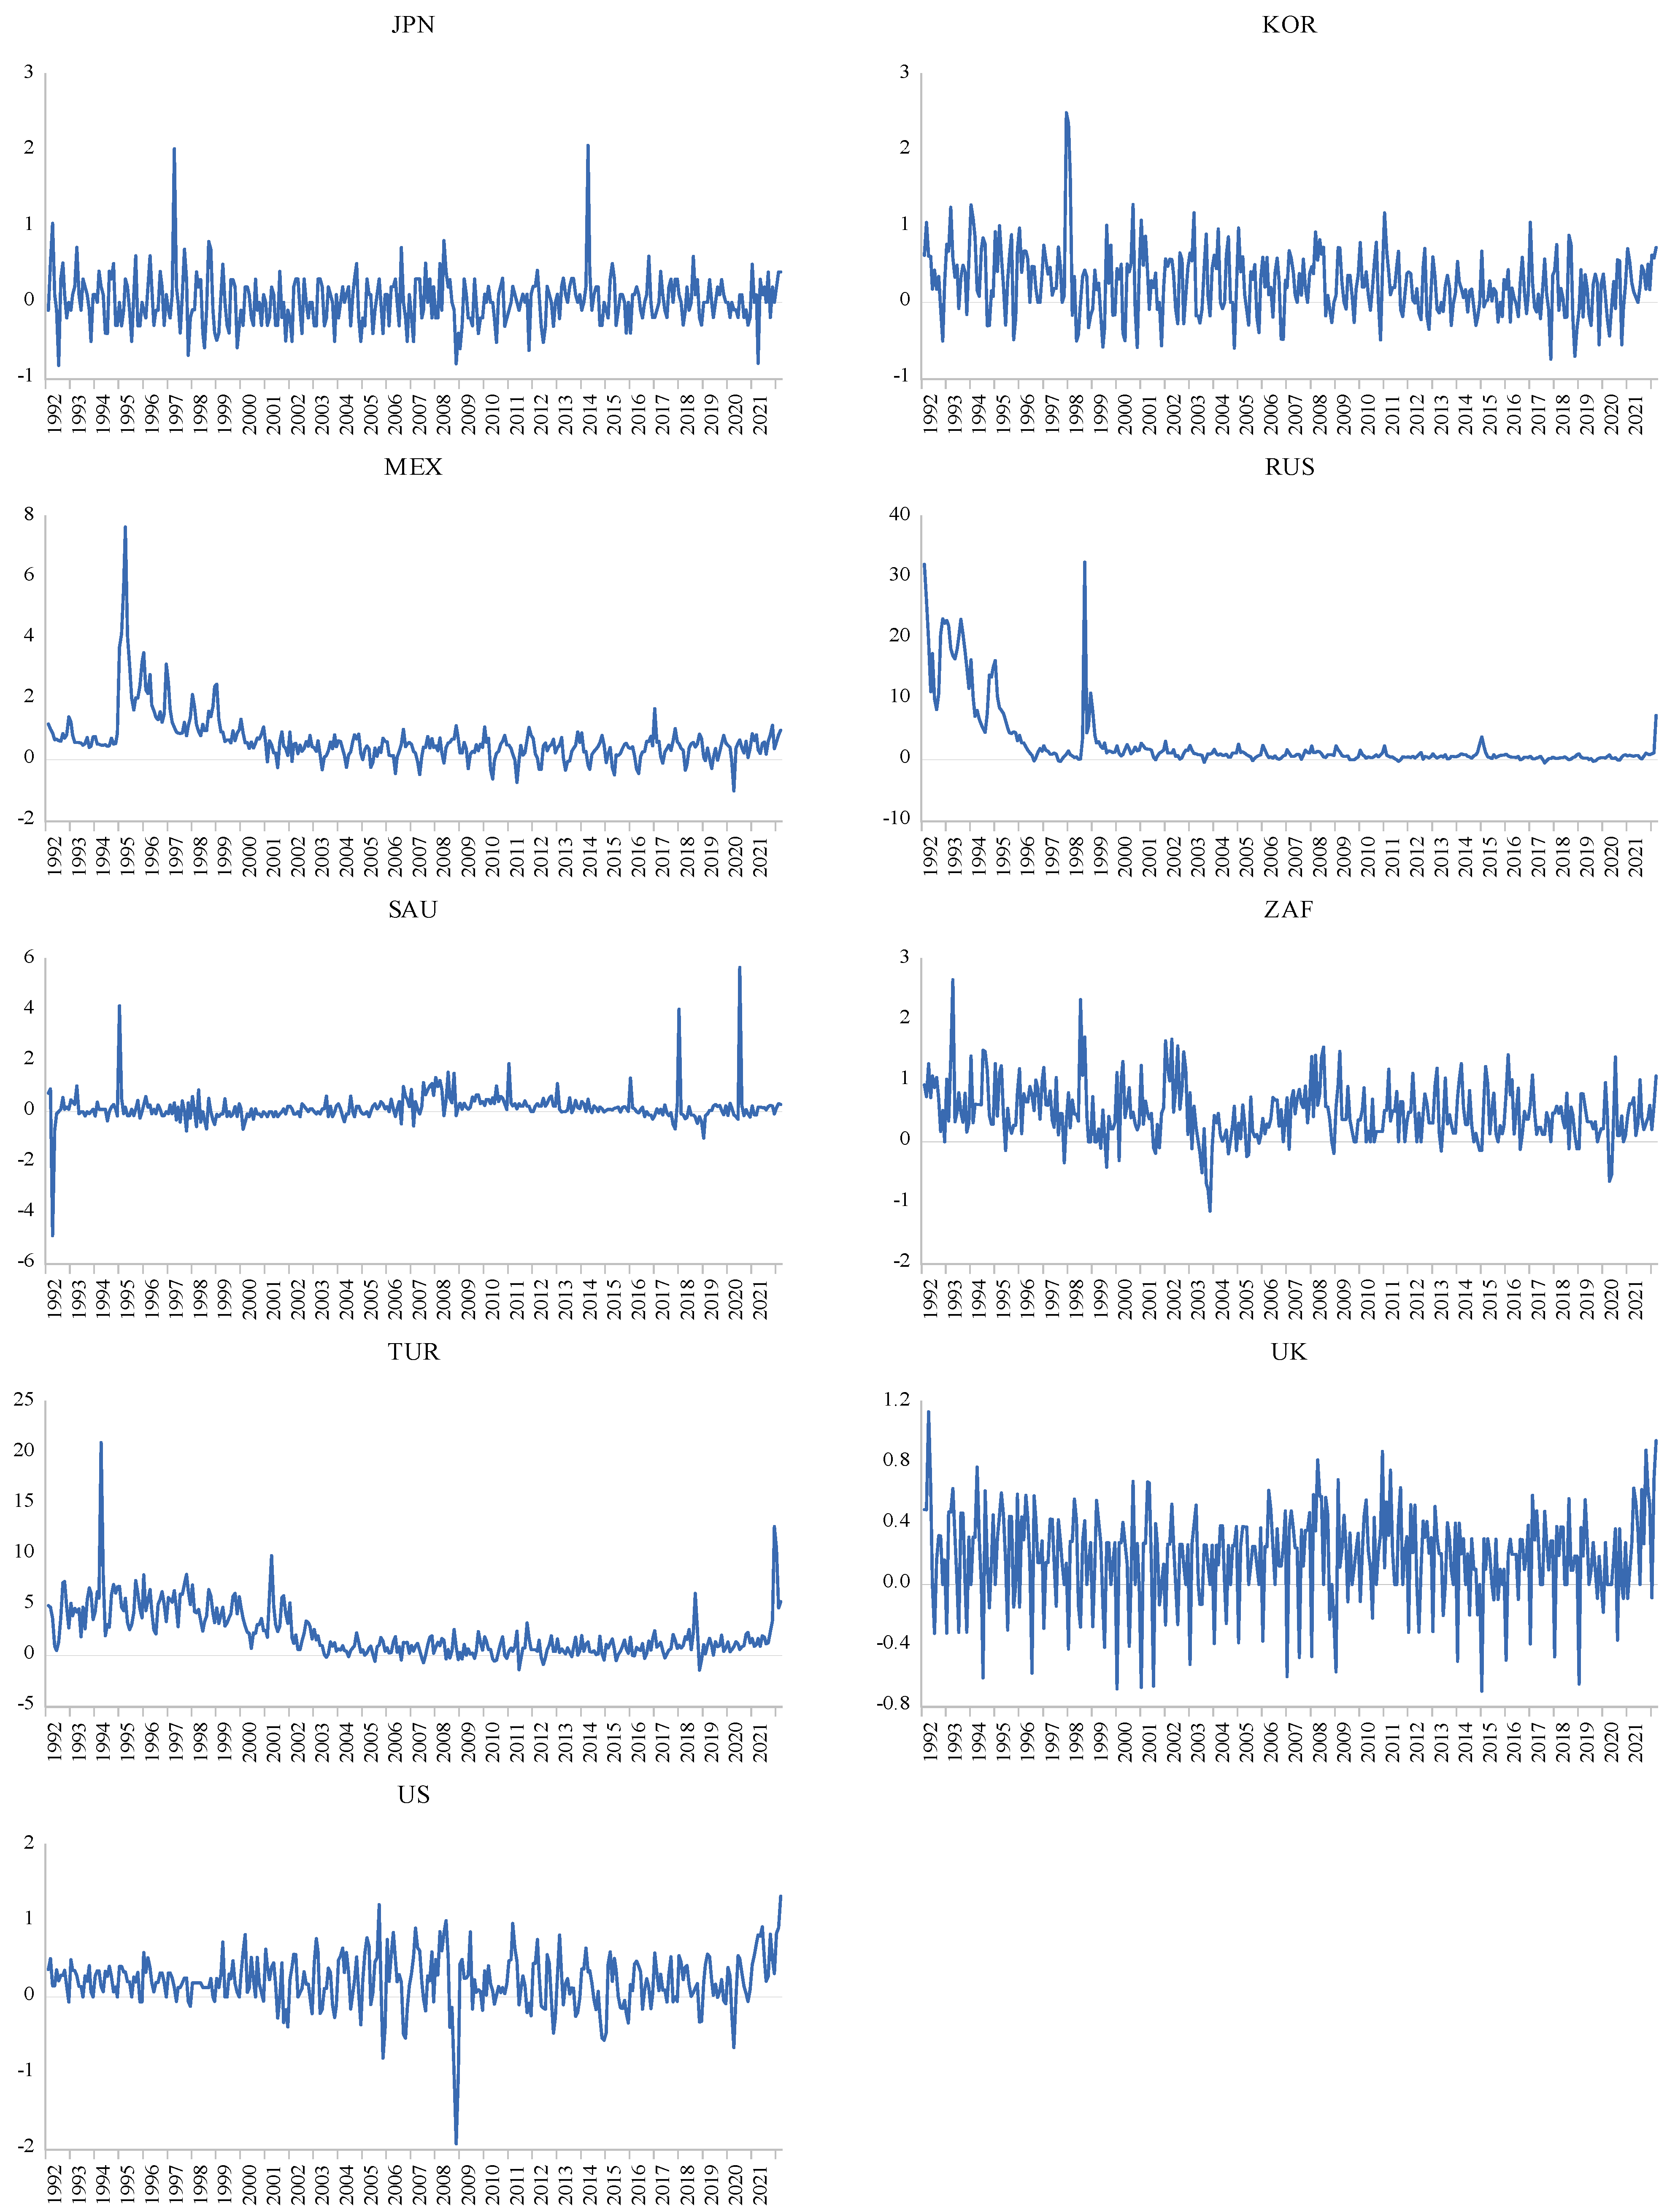
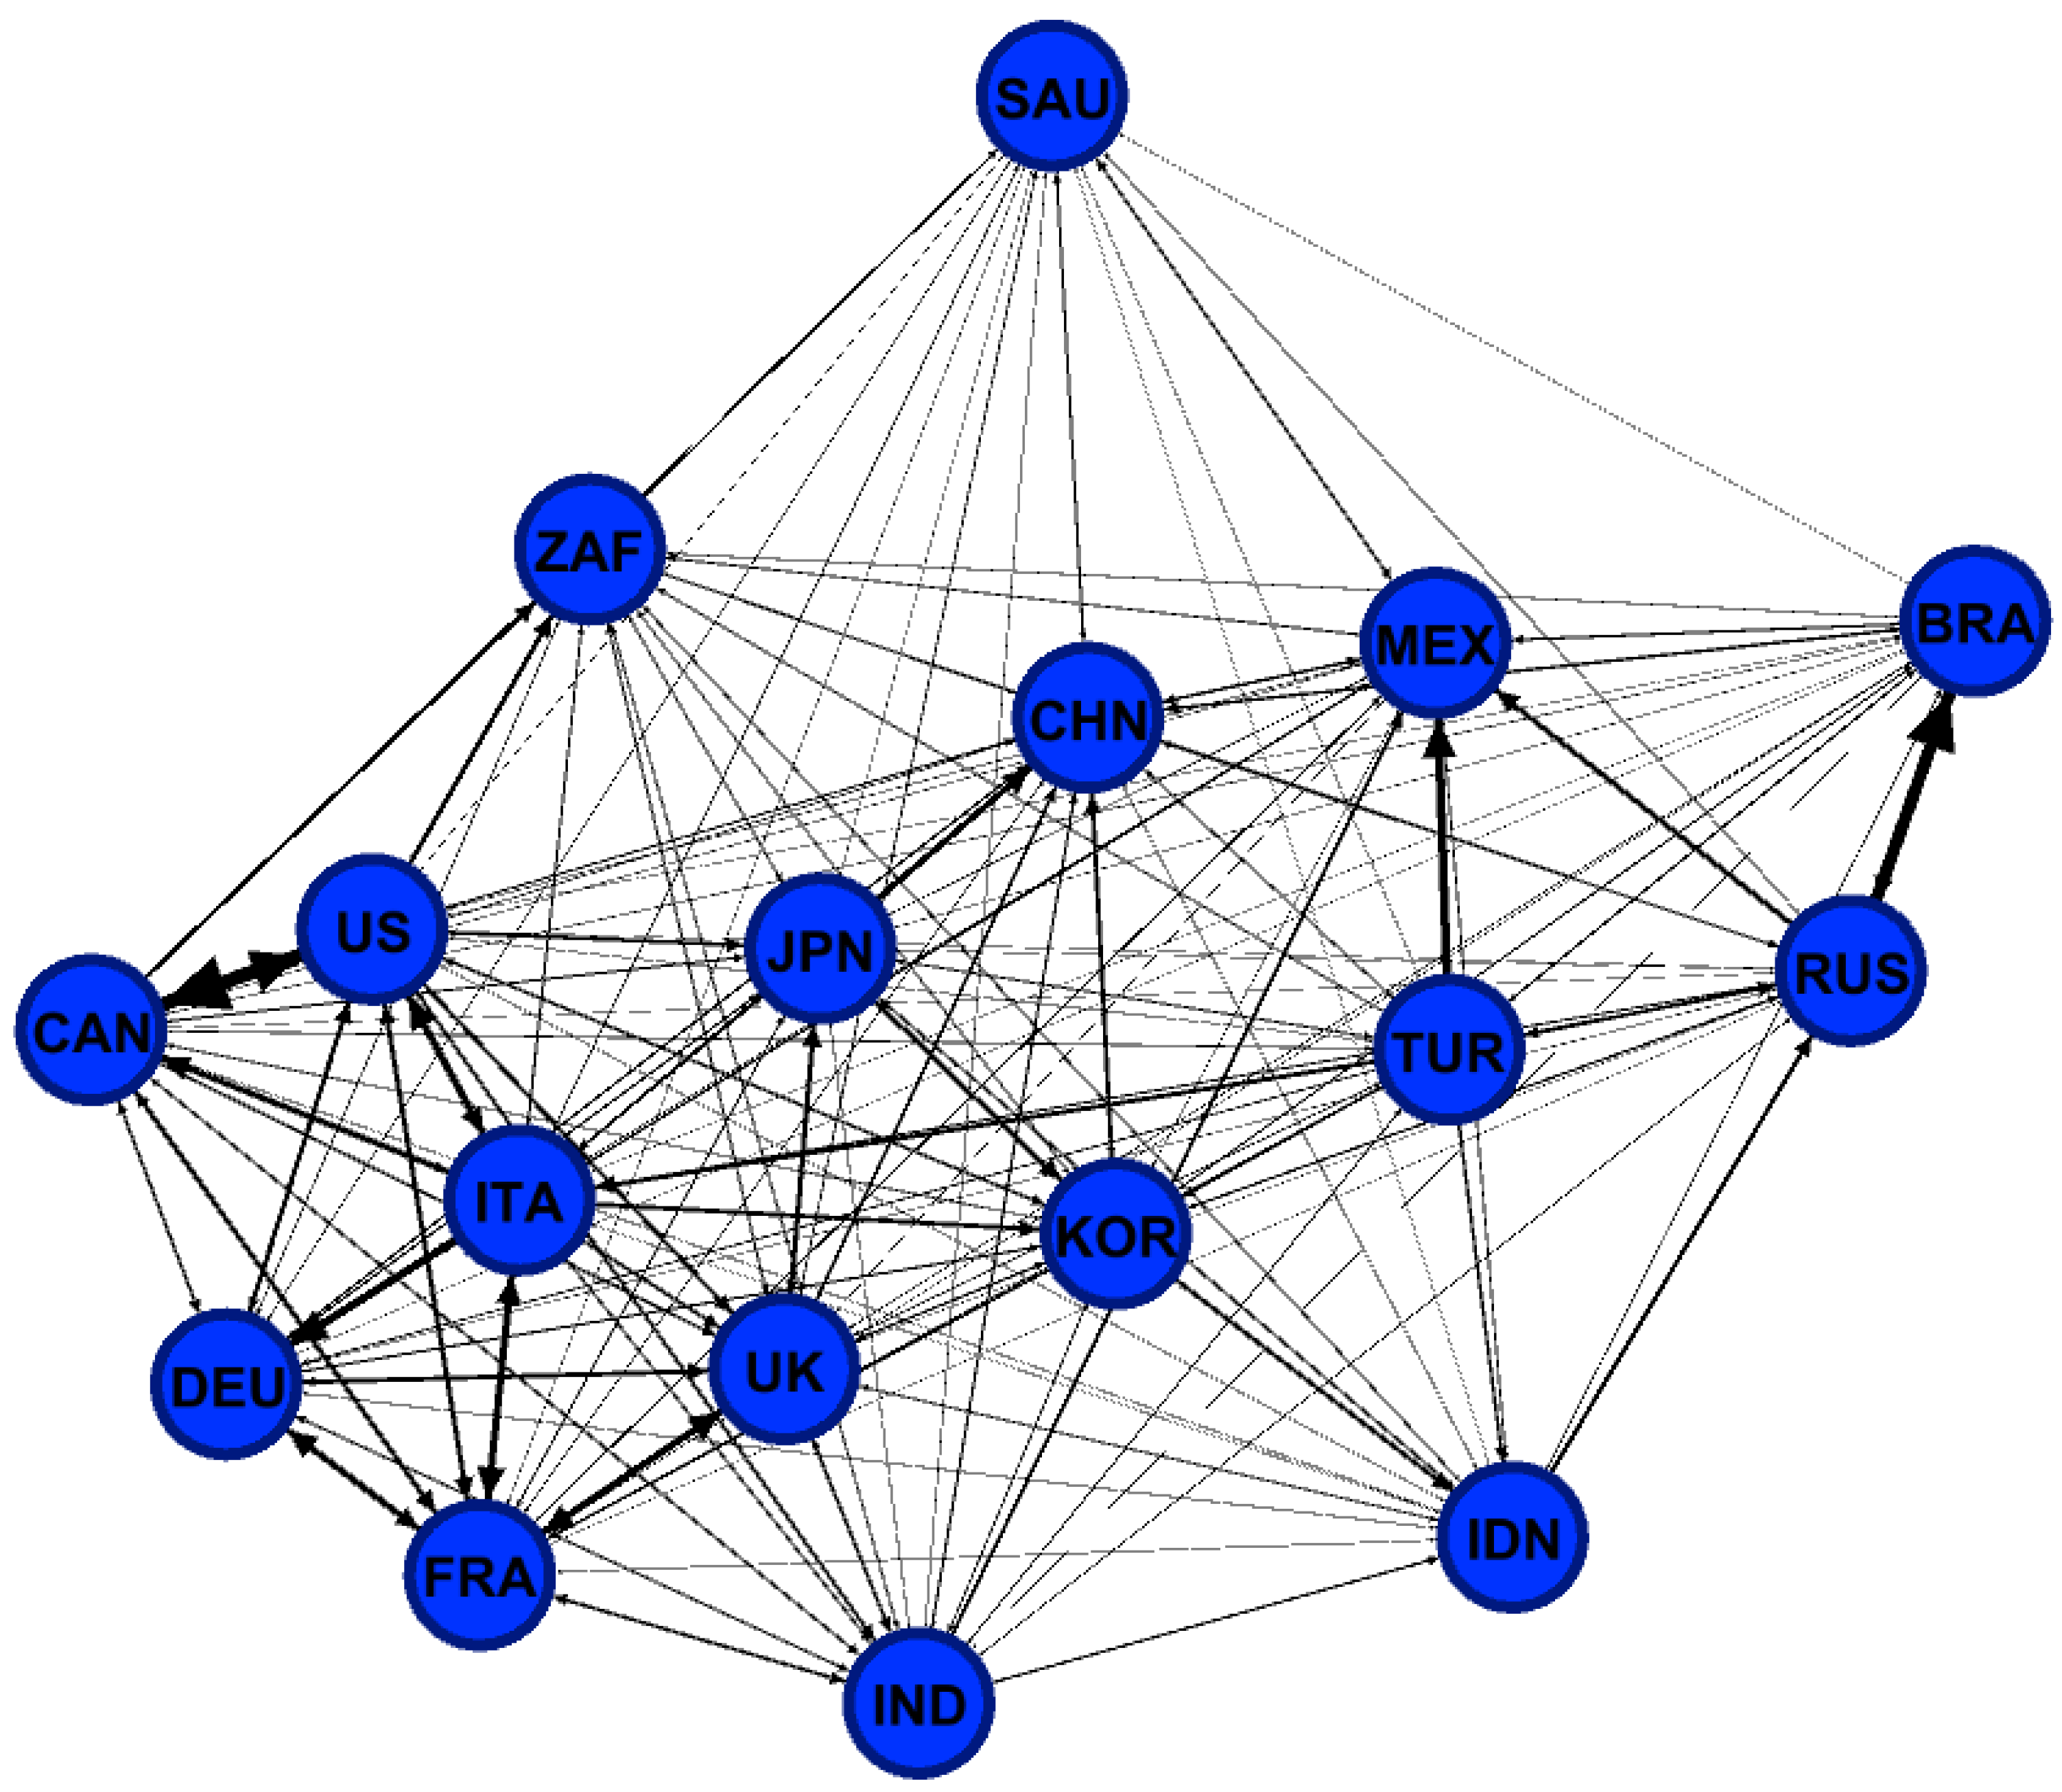
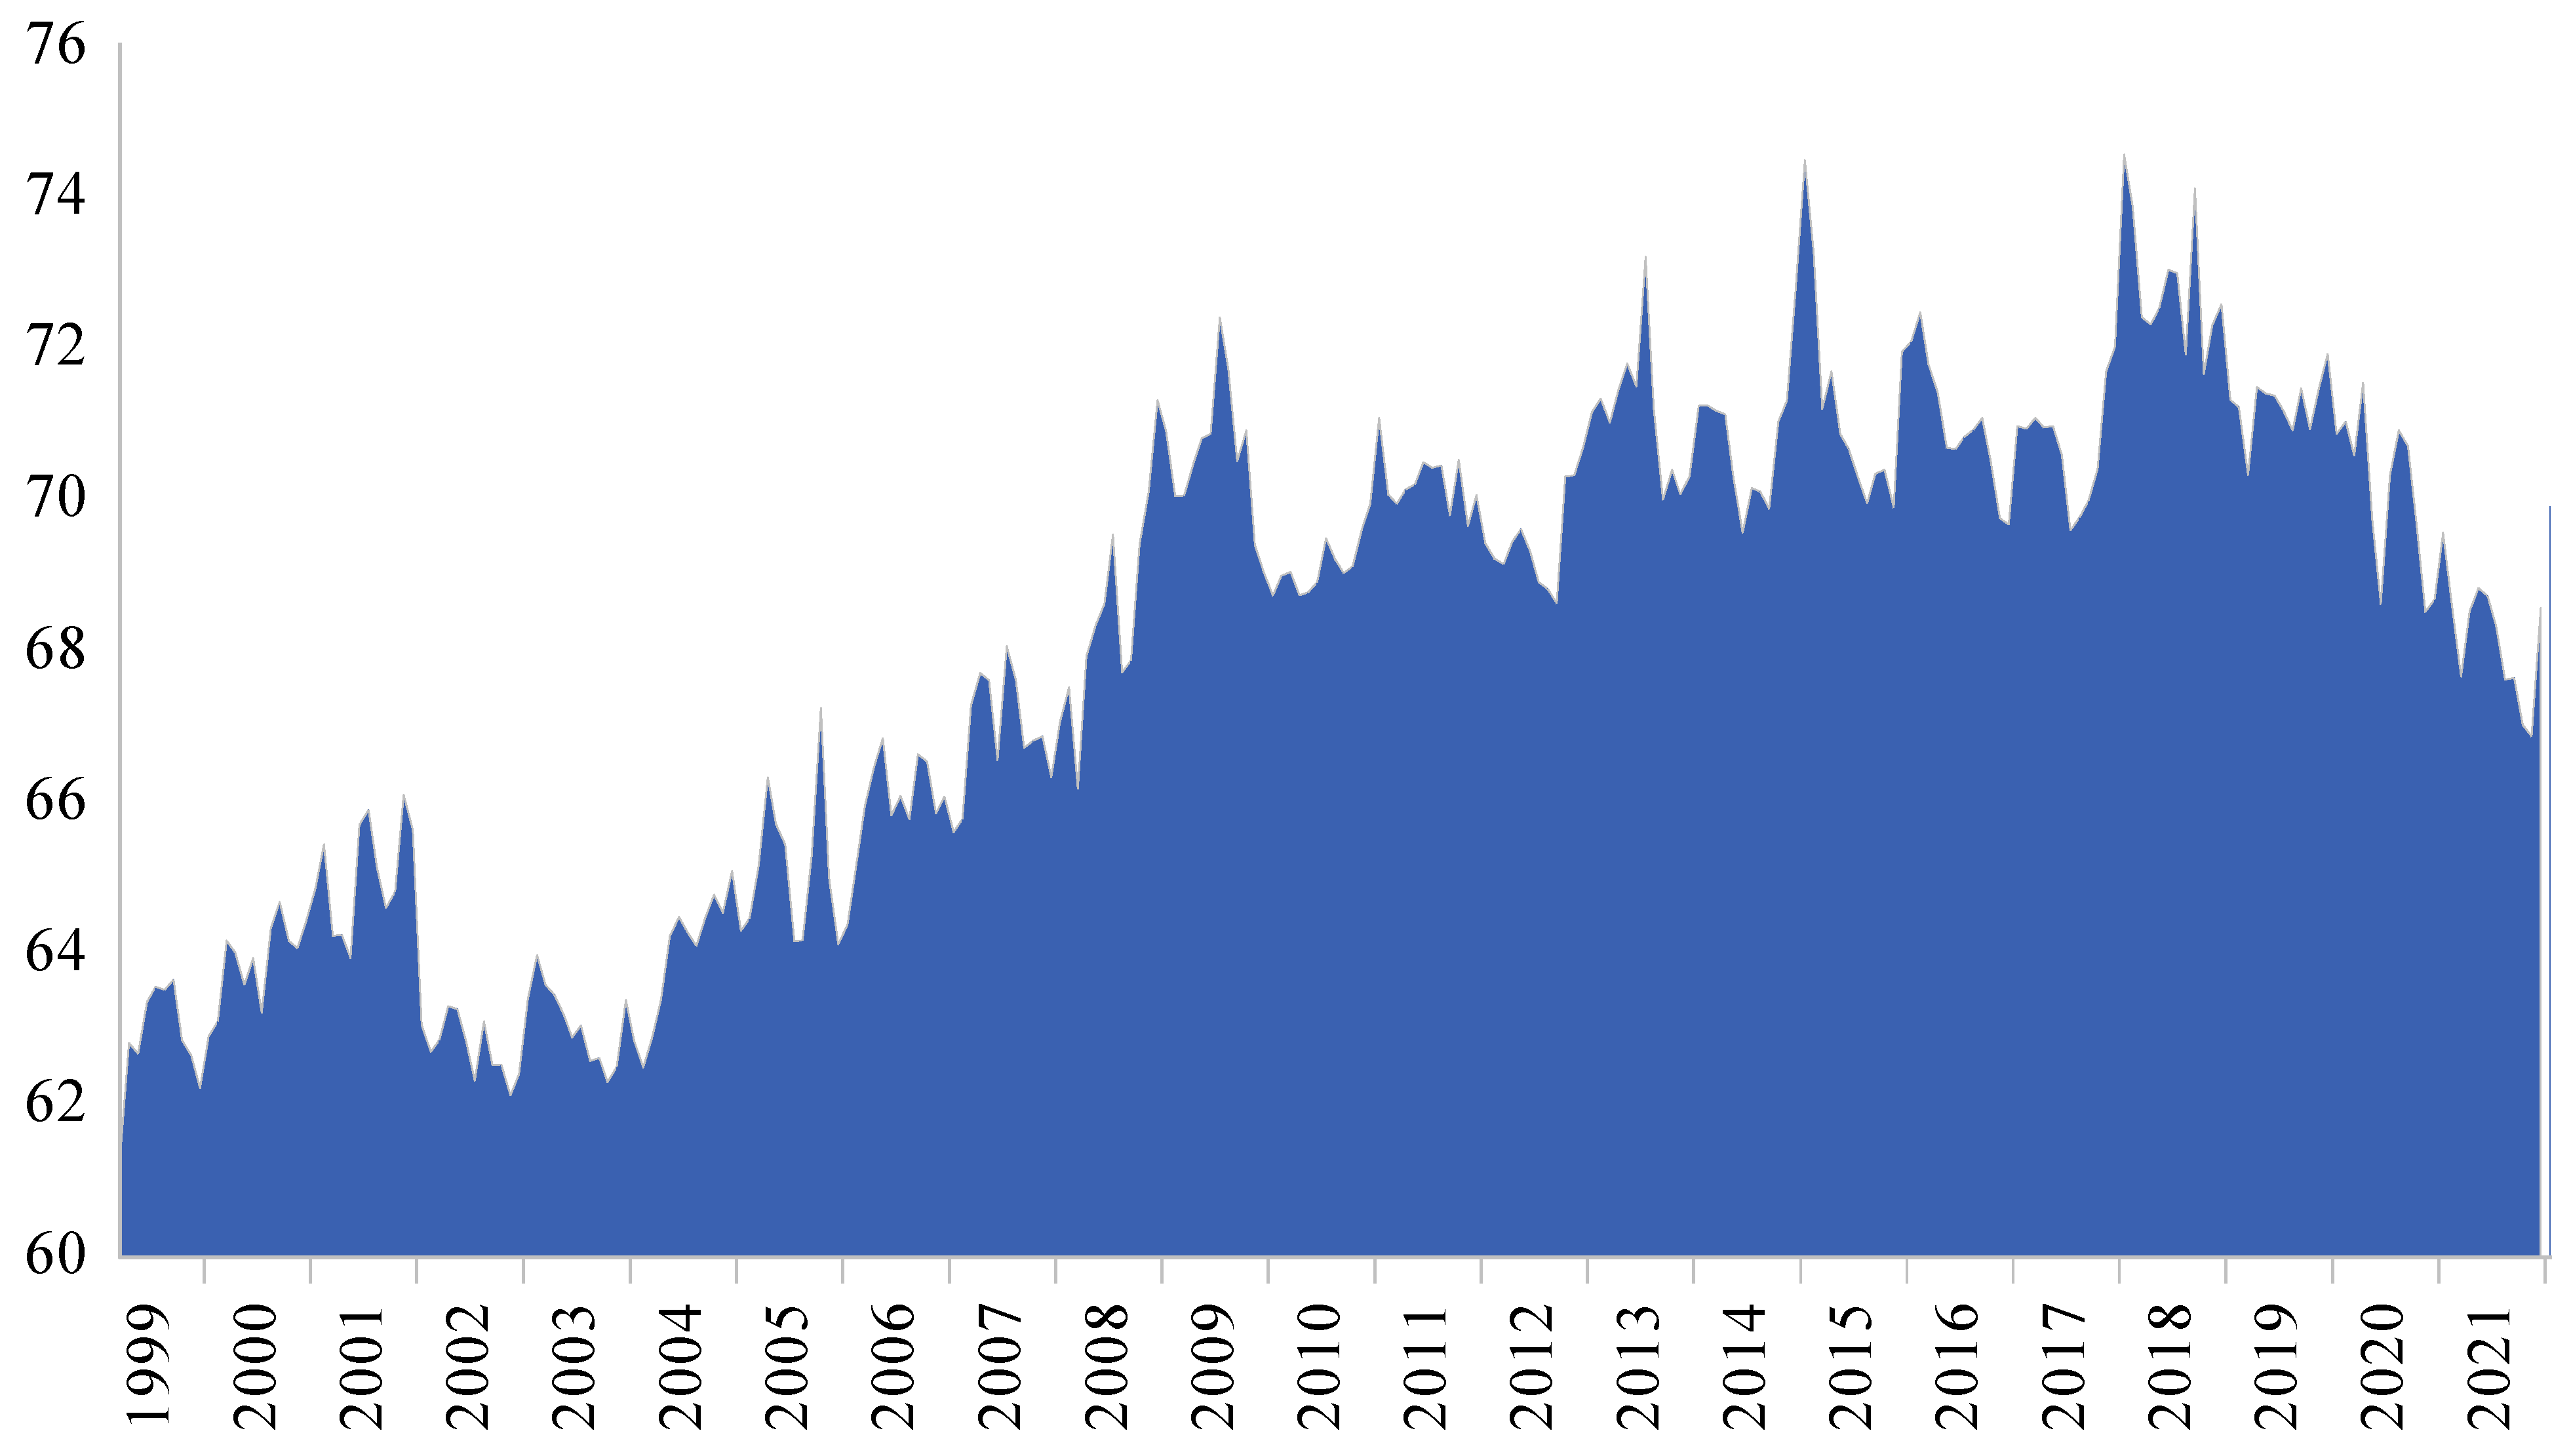


| BRA | CAN | CHN | FRA | DEU | IND | IDN | ITA | JPN | KOR | MEX | RUS | SAU | ZAF | TUR | UK | US | |
|---|---|---|---|---|---|---|---|---|---|---|---|---|---|---|---|---|---|
| Mean | 2.73 | 0.16 | 0.31 | 0.12 | 0.15 | 0.54 | 0.66 | 0.18 | 0.02 | 0.25 | 0.65 | 2.65 | 0.15 | 0.48 | 2.22 | 0.18 | 0.20 |
| Median | 0.52 | 0.17 | 0.20 | 0.12 | 0.12 | 0.56 | 0.42 | 0.19 | 0.00 | 0.20 | 0.52 | 0.80 | 0.10 | 0.43 | 1.34 | 0.23 | 0.20 |
| Max | 38.82 | 1.42 | 3.97 | 1.41 | 2.46 | 4.47 | 11.91 | 1.58 | 2.07 | 2.50 | 7.67 | 32.52 | 5.70 | 2.67 | 21.01 | 1.14 | 1.33 |
| Min | −0.51 | −1.04 | −1.67 | −1.01 | −1.04 | −2.12 | −1.07 | −0.68 | −0.83 | −0.75 | −1.02 | −0.54 | −4.91 | −1.14 | −1.45 | −0.70 | −1.93 |
| Std | 7.32 | 0.35 | 0.86 | 0.29 | 0.37 | 0.79 | 1.20 | 0.24 | 0.33 | 0.43 | 0.81 | 5.22 | 0.61 | 0.47 | 2.46 | 0.30 | 0.34 |
| Skew | 3.31 | −0.05 | 0.96 | −0.01 | 0.70 | 0.30 | 4.90 | 0.38 | 1.26 | 0.85 | 3.55 | 3.18 | 2.19 | 0.64 | 2.14 | −0.48 | −0.77 |
| Kurt | 12.76 | 3.83 | 4.97 | 4.55 | 7.81 | 5.31 | 35.60 | 7.09 | 10.22 | 6.07 | 24.11 | 13.38 | 42.43 | 4.86 | 12.56 | 3.53 | 7.81 |
| Student t | 7.10 * | 8.80 * | 6.77 * | 8.14 * | 7.71 * | 13.10 * | 10.50 * | 14.96 * | 1.27 | 11.07 * | 15.17 * | 9.64 * | 4.66 * | 19.56 * | 17.20 * | 11.25 * | 11.35 * |
| Obs. | 363 | 363 | 363 | 363 | 363 | 363 | 363 | 363 | 363 | 363 | 363 | 362 | 363 | 363 | 363 | 363 | 363 |
| JB Prob | 2101.3 0.00 | 10.4 0.00 | 114.4 0.00 | 36.5 0.00 | 380.0 0.00 | 85.9 0.00 | 17,523.2 0.00 | 261.4 0.00 | 885.3 0.00 | 186.3 0.00 | 7502.4 0.00 | 2236.5 0.00 | 23,806.5 0.00 | 77.4 0.00 | 1661.5 0.00 | 18.4 0.00 | 386.2 0.00 |
| ADF | −3.24 ** | −3.74 * | −1.84 | −2.66 *** | −1.12 | −3.60 * | −5.72 * | −1.55 | −3.81 * | −3.19 ** | −2.70 *** | −4.65 * | −9.87 * | −4.39 * | −1.33 | −1.62 | −3.08 ** |
| PP | −3.27 ** | −14.61 * | −13.78 * | −18.83 * | −19.31 * | −12.42 * | −9.59 * | −15.48 * | −15.49 * | −12.65 * | −5.54 * | −6.57 * | −17.52 * | −13.84 * | −7.74 * | −18.80 * | −9.60 * |
| BRA | CAN | CHN | FRA | DEU | IND | IDN | ITA | JPN | KOR | MEX | RUS | SAU | ZAF | TUR | UK | US | |
|---|---|---|---|---|---|---|---|---|---|---|---|---|---|---|---|---|---|
| BRA | 1 | ||||||||||||||||
| CAN | −0.07 | 1 | |||||||||||||||
| CHN | 0.36 | −0.04 | 1 | ||||||||||||||
| FRA | 0.05 | 0.36 | 0.01 | 1 | |||||||||||||
| DEU | 0.12 | 0.27 | −0.02 | 0.47 | 1 | ||||||||||||
| IND | 0.05 | −0.02 | −0.18 | −0.20 | −0.11 | 1 | |||||||||||
| IDN | 0.00 | −0.10 | 0.03 | −0.08 | 0.04 | 0.05 | 1 | ||||||||||
| ITA | 0.23 | 0.33 | 0.13 | 0.45 | 0.36 | 0.01 | 0.07 | 1 | |||||||||
| JPN | 0.05 | 0.11 | 0.19 | 0.24 | −0.01 | 0.03 | −0.09 | 0.11 | 1 | ||||||||
| KOR | 0.17 | 0.18 | 0.37 | 0.13 | 0.16 | −0.03 | 0.17 | 0.24 | 0.20 | 1 | |||||||
| MEX | 0.04 | −0.01 | 0.21 | 0.01 | −0.01 | −0.04 | 0.19 | 0.22 | −0.02 | 0.20 | 1 | ||||||
| RUS | 0.74 | −0.02 | 0.36 | 0.05 | 0.13 | 0.00 | 0.08 | 0.30 | 0.07 | 0.16 | 0.27 | 1 | |||||
| SAU | −0.06 | −0.02 | 0.09 | −0.03 | −0.06 | 0.08 | 0.00 | 0.01 | −0.04 | 0.07 | 0.04 | −0.02 | 1 | ||||
| ZAF | 0.16 | 0.20 | 0.13 | 0.09 | 0.18 | 0.12 | 0.17 | 0.20 | 0.18 | 0.24 | 0.18 | 0.22 | 0.14 | 1 | |||
| TUR | 0.38 | 0.03 | 0.28 | 0.10 | 0.04 | −0.03 | 0.16 | 0.32 | 0.12 | 0.18 | 0.42 | 0.41 | −0.06 | 0.16 | 1 | ||
| UK | 0.05 | 0.20 | 0.12 | 0.58 | 0.29 | −0.07 | −0.13 | 0.19 | 0.37 | 0.07 | 0.03 | 0.06 | −0.13 | 0.01 | 0.09 | 1 | |
| US | 0.03 | 0.70 | 0.11 | 0.43 | 0.28 | 0.00 | −0.05 | 0.42 | 0.26 | 0.36 | 0.00 | 0.05 | 0.06 | 0.32 | 0.10 | 0.24 | 1 |
| From | ||||||||||||||||||
|---|---|---|---|---|---|---|---|---|---|---|---|---|---|---|---|---|---|---|
| To | BRA | CAN | CHN | FRA | DEU | IND | IDN | ITA | JPN | KOR | MEX | RUS | SAU | ZAF | TUR | UK | US | Contribution from Others |
| BRA | 64.71 | 0.89 | 1.94 | 0.03 | 0.03 | 0.39 | 1.53 | 0.18 | 0.53 | 2.37 | 1.07 | 21.70 | 0.15 | 0.25 | 2.96 | 0.98 | 0.32 | 35.30 |
| CAN | 0.62 | 46.78 | 0.15 | 4.64 | 3.90 | 2.22 | 0.83 | 9.83 | 0.78 | 1.55 | 0.77 | 0.15 | 0.10 | 1.57 | 0.49 | 0.62 | 25.00 | 53.20 |
| CHN | 4.45 | 1.40 | 47.05 | 1.24 | 3.28 | 3.30 | 0.66 | 1.46 | 10.03 | 6.59 | 3.49 | 3.12 | 2.37 | 1.87 | 2.23 | 4.83 | 2.63 | 52.90 |
| FRA | 0.45 | 7.63 | 0.82 | 37.67 | 7.91 | 4.20 | 0.75 | 11.73 | 1.63 | 3.85 | 0.53 | 0.12 | 0.29 | 2.21 | 1.42 | 10.97 | 7.81 | 62.30 |
| DEU | 0.13 | 4.13 | 1.08 | 10.67 | 49.16 | 2.75 | 0.72 | 13.51 | 1.67 | 1.00 | 3.48 | 0.56 | 0.36 | 1.09 | 2.10 | 3.53 | 4.06 | 50.80 |
| IND | 0.52 | 3.52 | 1.11 | 4.88 | 3.06 | 64.74 | 1.19 | 3.28 | 0.89 | 1.97 | 0.26 | 0.54 | 0.58 | 2.18 | 1.22 | 4.80 | 5.24 | 35.30 |
| IDN | 0.31 | 0.48 | 1.13 | 0.44 | 1.03 | 3.44 | 71.93 | 0.40 | 2.23 | 6.77 | 2.16 | 1.09 | 0.12 | 1.46 | 4.43 | 1.86 | 0.72 | 28.10 |
| ITA | 0.19 | 4.18 | 3.47 | 10.22 | 4.42 | 2.00 | 0.35 | 50.44 | 0.89 | 1.38 | 0.93 | 2.60 | 0.24 | 1.44 | 7.08 | 1.25 | 8.93 | 49.60 |
| JPN | 0.31 | 2.98 | 3.16 | 2.41 | 2.95 | 0.52 | 3.70 | 2.20 | 61.57 | 2.62 | 0.15 | 0.12 | 0.20 | 2.32 | 1.37 | 7.77 | 5.65 | 38.40 |
| KOR | 0.35 | 1.19 | 2.84 | 1.13 | 3.14 | 0.60 | 1.89 | 6.85 | 7.95 | 58.63 | 0.71 | 1.64 | 0.95 | 1.18 | 3.82 | 2.84 | 4.29 | 41.40 |
| MEX | 3.39 | 0.66 | 4.40 | 2.47 | 2.37 | 5.52 | 0.65 | 0.42 | 1.20 | 0.47 | 50.24 | 8.27 | 3.42 | 0.72 | 14.23 | 0.68 | 0.88 | 49.80 |
| RUS | 7.67 | 0.08 | 3.22 | 0.22 | 0.17 | 1.41 | 6.87 | 0.93 | 0.06 | 3.26 | 0.80 | 66.27 | 0.48 | 2.07 | 6.09 | 0.21 | 0.20 | 33.70 |
| SAU | 0.55 | 0.75 | 3.14 | 0.55 | 1.10 | 0.90 | 0.13 | 1.68 | 0.37 | 0.72 | 3.78 | 1.67 | 78.59 | 3.08 | 0.64 | 1.99 | 0.35 | 21.40 |
| ZAF | 1.24 | 6.88 | 0.15 | 0.94 | 1.46 | 1.15 | 2.36 | 2.47 | 1.39 | 2.03 | 2.38 | 1.05 | 1.77 | 62.21 | 2.29 | 2.61 | 7.62 | 37.80 |
| TUR | 1.48 | 1.71 | 2.33 | 0.46 | 0.42 | 1.76 | 1.28 | 0.84 | 2.60 | 0.78 | 4.32 | 4.44 | 0.20 | 0.44 | 74.91 | 1.53 | 0.51 | 25.10 |
| UK | 0.68 | 4.10 | 1.84 | 11.68 | 6.99 | 2.36 | 2.33 | 5.14 | 4.07 | 3.32 | 0.61 | 0.21 | 1.33 | 2.81 | 1.38 | 44.72 | 6.42 | 55.30 |
| US | 0.08 | 18.60 | 0.80 | 6.50 | 7.31 | 2.15 | 0.90 | 12.07 | 2.08 | 3.23 | 0.89 | 0.18 | 0.11 | 1.64 | 0.85 | 1.60 | 41.01 | 59.00 |
| Contribution to others | 22.4 | 59.2 | 31.6 | 58.5 | 49.5 | 34.7 | 26.1 | 73 | 38.3 | 41.9 | 26.3 | 47.5 | 12.6 | 26.3 | 52.6 | 48.1 | 80.6 | 729.4 |
| Contribution including own | 87.1 | 106 | 78.6 | 96.2 | 98.7 | 99.4 | 98.1 | 123.4 | 99.9 | 100.6 | 76.6 | 113.7 | 91.2 | 88.5 | 127.5 | 92.8 | 121.6 | Spillover index |
| Net inflation spillover | −12.9 | 6 | −21.3 | −3.8 | −1.3 | −0.6 | −2 | 23.4 | −0.1 | 0.5 | −23.5 | 13.8 | −8.8 | −11.5 | 27.5 | −7.2 | 21.6 | |
Disclaimer/Publisher’s Note: The statements, opinions and data contained in all publications are solely those of the individual author(s) and contributor(s) and not of MDPI and/or the editor(s). MDPI and/or the editor(s) disclaim responsibility for any injury to people or property resulting from any ideas, methods, instructions or products referred to in the content. |
© 2023 by the authors. Licensee MDPI, Basel, Switzerland. This article is an open access article distributed under the terms and conditions of the Creative Commons Attribution (CC BY) license (https://creativecommons.org/licenses/by/4.0/).
Share and Cite
Al-Nassar, N.S.; Albahouth, A.A. Inflation Spillovers among Advanced and Emerging Economies: Evidence from the G20 Group. Economies 2023, 11, 126. https://doi.org/10.3390/economies11040126
Al-Nassar NS, Albahouth AA. Inflation Spillovers among Advanced and Emerging Economies: Evidence from the G20 Group. Economies. 2023; 11(4):126. https://doi.org/10.3390/economies11040126
Chicago/Turabian StyleAl-Nassar, Nassar S., and Abdulrahman A. Albahouth. 2023. "Inflation Spillovers among Advanced and Emerging Economies: Evidence from the G20 Group" Economies 11, no. 4: 126. https://doi.org/10.3390/economies11040126
APA StyleAl-Nassar, N. S., & Albahouth, A. A. (2023). Inflation Spillovers among Advanced and Emerging Economies: Evidence from the G20 Group. Economies, 11(4), 126. https://doi.org/10.3390/economies11040126


