1. Introduction
Captivating the interest of primary market investors to ensure that initial public offering (IPO) issues are completely subscribed is a challenging task. Investor demand, which is often measured using the over subscription ratio, plays a significant role in inducing the after-market performance of IPOs (
Chowdhry and Sherman 1996;
Arora and Singh 2020;
Mohd-Rashid et al. 2022a). Consequently, IPOs with higher public demand will see higher levels of initial return (
Mehmood et al. 2021b;
Mohd-Rashid et al. 2022b). Higher investor demand, which is largely attributed to better market conditions and investment opportunities, has led to significant oversubscriptions in Asian IPO markets and turned into a serious concern among investors and financial market regulators in emerging markets such as China, Hong Kong, Singapore, and Malaysia (
Agarwal et al. 2008;
Chowdhry and Sherman 1996;
Loughran et al. 1995).
Table 1 provides a brief overview of the IPO allocation rules in some Asian countries in terms of the allocation process and any restrictions on institutional or foreign investors.
The diverse characteristics of investor demand in different countries indicate the presence of market-specific factors that influence oversubscription. For example, the A-Class shares listed on the Shenzhen Stock Exchange, China, can only be traded by Chinese citizens and are often in high demand or oversubscribed (
Yu and Tse 2006). Major portions of these companies are government-linked and offer high underpricing to save investors the agency cost of investing in IPOs issued by government-linked companies. Moreover, for each company, the higher the equity retained by the government, the lower the liquidity of the equities (
Chen et al. 2004). As such, investors need to be compensated for the lower liquidity with a premium, i.e., underpricing. However, potentially high underpricing increases the demand from investors (
Mohd-Rashid et al. 2019). The underpricing and oversubscription rates of Malaysian IPOs were among the highest in the world, as the country was well-known for offering deep discounts on its IPOs compared to other developing markets (
Loughran et al. 1995). In Malaysia, a government regulation requires a fraction of the IPOs issued to be allocated to indigenous
Bumiputera investors, identified as
Bumiputera investors. According to
Prasad et al. (
2006), the implementation of the
Bumiputera equity requirement policy since 1976 has influenced the underpricing levels of Malaysian IPOs. Thus, this institutional difference that is unique to Malaysia may influence the oversubscription phenomenon. The present paper examines whether share allocations to the
Bumiputera people have any influence on the demand for IPOs in Malaysia. To date, this factor by all accounts has been neglected by numerous researchers (
Abdullah and Taufil-Mohd 2004;
How et al. 2007;
Jelic et al. 2001;
Paudyal et al. 1998;
Prasad et al. 2006;
Taufil-Mohd 2007). However, the high oversubscription rates observed cannot be treated as isolated cases. Thus, it is important to understand if the fractions of shares set aside for
Bumiputera investors would affect the oversubscription of IPOs, especially in the Malaysian market, which is characterized by a high degree of information asymmetry (
Eldomiaty 2008;
Mohd-Rashid et al. 2017). In addition, there is a wide gap between the lowest and highest oversubscription ratios (demand from investors), as shown in
Table 2, which motivated the researchers to carry out this study.
This study differs from others in two ways. First, this paper highlights the
Bumiputera equity ownership, which is said to influence oversubscription.
Prasad et al. (
2006) found that the 30%
Bumiputera equity requirement imposed by the Malaysian government in 1976 has an impact on IPO underpricing. However, the findings have not been followed up by further investigations on the relationship between
Bumiputera equity ownership and the oversubscription ratio. Similarly,
Abdullah and Taufil-Mohd (
2004) noted that
Bumiputera ownership is one of the variables affecting the underpricing of IPOs in Malaysia. However, they found that the
Bumiputera ownership allocation reduces the underpricing levels of Malaysian IPOs. In contrast,
Taufil-Mohd (
2007) found no link between
Bumiputera equity ownership and IPO underpricing. The inconsistent evidence warrants further examination to determine whether
Bumiputera equity ownership has some effect on the level of IPO oversubscription. The authors of the present paper are of the opinion that this factor requires special considerations given its uniqueness to the Malaysian market, where it has been one of the New Economic Policy (NEP) tools used to increase
Bumiputera participation in the equity market since 1976.
Second, previous studies did not consider the revised guidelines on Bumiputera equity requirements, and this is another motivation for conducting this research. The 30% Bumiputera equity requirement for firms seeking a listing was removed on 30 June 2009. Since then, all firms seeking a listing are required to allocate only 12.5% of their shares to Bumiputera investors, signifying a reduction in the distribution of wealth to the Bumiputera. This move has reduced Bumiputera investors’ opportunity to own IPO shares. It is likely that the revised requirement could reduce investor demand, especially among Bumiputera investors, and could jeopardize the objective of the NEP for the Bumiputera investors to own 30% of the shares in the equity market. Therefore, the impact of the revised Bumiputera equity requirement on oversubscription needs to be empirically examined. In addition, this study contributes to the literature on oversubscription by examining the impact of the change in the Bumiputera equity requirement (before and after 30 June 2009) on IPO oversubscription, which has not been tested yet in previous studies.
Overall, policy-makers in Malaysia may need to consider the unique characteristics of the market and consider the potential impact of policies on investor demand and market outcomes. The allocation of shares to Bumiputera investors has a potential impact on the oversubscription of IPOs in Malaysia; therefore, policy-makers may need to consider this factor in their decision-making. The revision of the Bumiputera equity requirement from 30% to 12.5% may have reduced investor demand, especially among Bumiputera investors, and could jeopardize the objective of the New Economic Policy (NEP) for Bumiputera investors to own 30% of the shares in the equity market. Policy-makers may need to reevaluate this policy and consider whether it is achieving its intended goals.
2. Review of the Literature
Theoretical and empirical studies have revealed that the IPO pricing mechanism has a non-trivial role in creating international discrepancies in IPO oversubscription and underpricing among various countries (
Agarwal et al. 2008;
Benveniste and Busaba 1997;
Benveniste and Spindt 1989;
Chahine 2007;
Chowdhry and Sherman 1996;
Low and Yong 2011;
Rahman et al. 2017).
Chowdhry and Sherman (
1996) in their model stated that higher rates of oversubscription are relatively normal in Asian countries. They noted that high oversubscription ratios of between 200 and 300 times are common in some countries. They also found that countries adopting the fixed pricing mechanism have high degrees of underpricing and IPO oversubscription ratios compared to countries using the book-building mechanism. As mentioned earlier, high IPO oversubscription ratios occur mainly in Asian markets such as China, Hong Kong, Singapore, and Malaysia (
Agarwal et al. 2008;
Low and Yong 2011). In China,
Tian and Megginson (
2007) recorded an average IPO oversubscription ratio of 187.4 times between 1992 and 2001. Meanwhile,
Gao’s (
2010) review of a sample of 217 IPOs listed between 2006 and 2008 revealed an average IPO oversubscription ratio of 100.9 times. In Hong Kong,
Agarwal et al. (
2008),
Cheng et al. (
2005), and
Mazouz et al. (
2009) reported that the IPOs were oversubscribed on average by 91.36 times, 93.83 times, and 76.12 times, respectively. Similar to Hong Kong, in Singapore,
Reber and Fong (
2006) showed that the average oversubscription ratio from 1998 to 2000 was 55.67 times, while
Lee et al. (
1999) documented that between 1973 and 1992, IPOs were oversubscribed by 41.28 times. Meanwhile,
Dawson (
1987),
Taufil-Mohd (
2007),
Yong and Isa (
2003), and
Low and Yong (
2011) found that IPOs were oversubscribed by 44, 41.14, 43.71, and 33.59 times, respectively, in Malaysia.
There has been an emergence of research studies on investor demand for IPOs or IPO oversubscription (
Alqahtani and Boulanouar 2017;
Eng and Aw 2000;
Low and Yong 2011;
Mohd-Rashid et al. 2022a;
Mehmood et al. 2020;
Rahman et al. 2017;
Tajuddin et al. 2015;
Tajuddin et al. 2019). For example,
Alqahtani and Boulanouar (
2017) examined the roles of the
Shariah-compliant status and investors’ IPO demand in Saudi Arabia. Based on a sample of 80 IPOs listed from 2004 to 2011, the study found an inverse relationship between
Shariah-compliant status and IPO oversubscription. In contrast, in a study conducted in Malaysia by
Tajuddin et al. (
2019),
Shariah-compliant status was found to have a positive relationship with IPO oversubscription. Meanwhile,
Rahman et al. (
2017) observed a positive relationship between the lot size of an issue with IPO oversubscription in Bangladesh. This finding implies that an IPO with a larger lot size will have a relatively higher subscription rate. In Singapore,
Eng and Aw (
2000) investigated the factors affecting IPO subscription and found that the largest investors demanded IPOs with higher earning yields, especially for the Singapore dollar denominated issues. This finding indicates that earnings performance drives the demand for IPOs. Recently,
Mehmood et al. (
2020) examined the impact of the pricing mechanism on IPO oversubscription in Pakistan. They found that the pricing mechanism has a negative impact on oversubscription due to higher information asymmetry and uncertainty in the valuation of the IPOs.
Low and Yong (
2011) addressed the factors determining IPO oversubscription in the Malaysian market. They argue that pre-listing information affects the IPO oversubscription ratio, especially among firms that employ the fixed price mechanism. They also found that the investors’ demand for IPOs is significantly influenced by the IPO volume, opportunity cost of funds, offer price, and investors’ optimism. Subsequently,
Tajuddin et al. (
2015) investigated the effects of informed investors’ involvement and firm size on IPO oversubscription from 2000 to 2012. Their results showed that IPO oversubscription is positively influenced by institutional investors’ involvement. The recent study by
Mohd-Rashid et al. (
2022b), who examined the impact of the lock-up provision on IPO oversubscription, found out that issuers with a lower lockup ratio and a shorter lockup term exhibit a lack of confidence in their future. Thus, to increase investors’ intention to subscribe to IPOs, issuers would demonstrate a propensity to underprice.
Several theories have been used in the discussions on IPO underpricing, such as the bandwagon effect, information asymmetry, lawsuit avoidance, signaling theory, prospect theory, and the winner’s curse. In addition, there are also models of rent-seeking that could be applied in the context of IPO underpricing (
Sadik-Zada et al. 2021;
Sadik-Zada 2020,
2021,
2023;
Sadik-Zada and Gatto 2021;
Sadik-Zada and Loewenstein 2018). Given that this study focuses on share allocations to the
Bumiputera population as the main factor influencing IPO oversubscription, the signaling model proposed by
Leland and Pyle (
1977) is suitable to be investigated in this study. Leland and Pyle developed the signaling model based on the valuation of IPOs with high fractional ownership rates. The model shows that fractional ownership by a firm’s existing owners signifies its confidence in the company’s future success. Superior ownership indicates a firm’s higher future cash flows. Accordingly, higher ownership will also contribute to lower underpricing and affect the demand for the IPOs. In further developments, signaling models were formalized by
Allen and Faulhaber (
1989),
Grinblatt and Hwang (
1989), and
Welch (
1989). These models are based on the view that companies have better information about their qualities than do underwriters and investors. In addition, these models express that companies use underpricing to show their values and qualities in order to influence the demand for IPOs. According to
Vong (
2006), investor demand is an essential element in ensuring the success of an IPO, as it shows that the firm has good quality. Firms that manage to gain a high demand from investors will have a better opportunity to sell their shares in the future (subsequent equity offerings) because they may garner favorable market reactions due to the reputation they gain from the high oversubscription of their issues (
Vong 2006). As for the present study, the focus is on examining the share allocations to the
Bumiputera population and the revision to this regulation as a signal to attract investor demand. Share allocations to
Bumiputera investors are considered unique to the Malaysian IPO market.
A few studies have looked at
Bumiputera equity ownership in Malaysia, such as
Abdullah and Taufil-Mohd (
2004),
How et al. (
2007),
Jelic et al. (
2001),
Paudyal et al. (
1998),
Prasad et al. (
2006), and
Taufil-Mohd (
2007).
Abdullah and Taufil-Mohd (
2004) found a significant negative link between
Bumiputera equity ownership and underpricing.
Abdullah and Taufil-Mohd (
2004), who examined the factors influencing the underpricing of Malaysian IPOs, argued that government regulatory intervention through the
Bumiputera equity requirement affects the underpricing of Malaysian IPOs. Using observations of 70 IPOs listed on Bursa Malaysia between 1991 and 1998, they concluded that higher allocations of shares to
Bumiputera investors reduce underpricing. However,
Taufil-Mohd (
2007) opined that allocating shares to
Bumiputera investors does not affect underpricing due to the competition among them, which allows the issuers to set competitive offer prices, resulting in an insignificant effect on underpricing. According to
Taufil-Mohd (
2007), IPO issuers may find it easier to deal with government agencies, especially if they plan to issue more shares in the future through rights issues.
Meanwhile,
Paudyal et al. (
1998) evaluated the performance of Malaysia’s private placement of initial public offerings (PIPO) for the period from January 1984 to September 1995. Their study highlighted that Malaysia’s PIPOs provide significantly higher initial returns than other IPOs. Based on 95 observations of PIPOs, the average allocation of shares to
Bumiputera investors (institutions and individuals) was 45.8% and the shares were oversubscribed by 23 times. Their finding suggests that Malaysian PIPOs experience higher underpricing than other markets due to the country’s regulation on
Bumiputera equity ownership. The study by
Jelic et al. (
2001) reported a similar finding, where the average share allocation to
Bumiputera investors was 44.45%. Their study examined the role of management’s earnings forecast and underwriters in the valuation of IPOs. Using observations of 182 IPOs listed on Bursa Malaysia between 1980 and 1995, they found support for signaling theory, where initial returns were found to be significantly linked to demand multiple, market sentiment, and book-to-market value.
This finding is supported by
Prasad et al. (
2006), who examined the impacts of government public policy and regulatory intervention on the underpricing of Malaysian IPOs. They argued that the implementation of the
Bumiputera equity requirement in 1976 had influenced the underpricing level of Malaysian IPOs. Based on 75 observations of IPOs listed from 1976 to 1992, they found that the
Bumiputera equity ownership policy significantly and positively influenced IPO underpricing. This finding indicates that government intervention through the
Bumiputera equity requirement has a great impact on IPO underpricing in Malaysia, as evidenced by the increase in the first day underpricing by an average of 61% during the period after the regulation was introduced. Their finding showed that the underpricing level increased from 57% before the implementation of the
Bumiputera equity policy to 118% post-implementation. This finding demonstrates that the
Bumiputera equity requirement or government intervention had raised investors’ interest to subscribe to IPOs. There are other similar findings.
How et al. (
2007) examined the performance of IPO shares among Malaysian Second Board companies. Their observation of 322 IPOs listed on Bursa Malaysia from 1989 to 2000 showed that about 40% of the shares were allocated to retail
Bumiputera investors. This finding indicates that a higher allocation of IPOs to
Bumiputera investors tends to lead to underpricing. Furthermore, using the
Bumiputera investors’ (retail and institutional investors) shareholding proportion, they identified a positive relationship between
Bumiputera investors’ shareholding and initial returns. From the signaling theory point of view, a high proportion of
Bumiputera ownership may entice investors to participate in an IPO exercise. The reason may be due to the issuers’ belief that they should give greater discounts to enable
Bumiputera investors to subscribe to their IPOs. This argument suggests that the
Bumiputera equity requirement has a positive influence on oversubscription. In accordance with this, the following hypothesis was examined:
H1. Bumiputera equity ownership has a positive relationship with the demand for IPOs.
The introduction of the 30%
Bumiputera equity requirement under the NEP led to an increase in
Bumiputera investors’ participation in the equity market. The NEP also reduced poverty and increased the number of
Bumiputera representations in professional and technical services, as well as at managerial and administrative levels. Consequently, since 30 June 2009, the proportion to be distributed to
Bumiputera investors has been reduced to at least 12.5% of the total enlarged issued and paid-up capital of the issuing firm. This move reflects the government’s effort to liberalize the equity market to make the market more competitive, attractive, and open (
Invest Malaysia 2009). Most previous studies that looked at the impact of the
Bumiputera equity requirement on underpricing used the
Bumiputera shareholding ratio of 30%. To the best of the researcher’s knowledge, no research has been conducted on the effect of the revision of the
Bumiputera equity requirement to 12.5% effective from 30 June 2009.
Prasad et al. (
2006) reported that after the Malaysian government implemented the 30%
Bumiputera equity requirement in 1976, the Malaysia IPO market experienced a higher level of underpricing. They added that issuers needed to lower their IPO offer prices to attract participation from
Bumiputera investors. As a result, the underpriced IPOs received higher subscriptions from investors and often generated high initial returns on the listing day. Similarly,
Jelic et al. (
2001) and
Paudyal et al. (
1998) found that this policy had increased the underpricing level. Given that the Malaysian government through the SC has loosened the
Bumiputera equity requirement from 30% to 12.5%, it seems that the opposite is expected to occur. It might be that the underpricing and oversubscription could decrease as the government relaxes this policy.
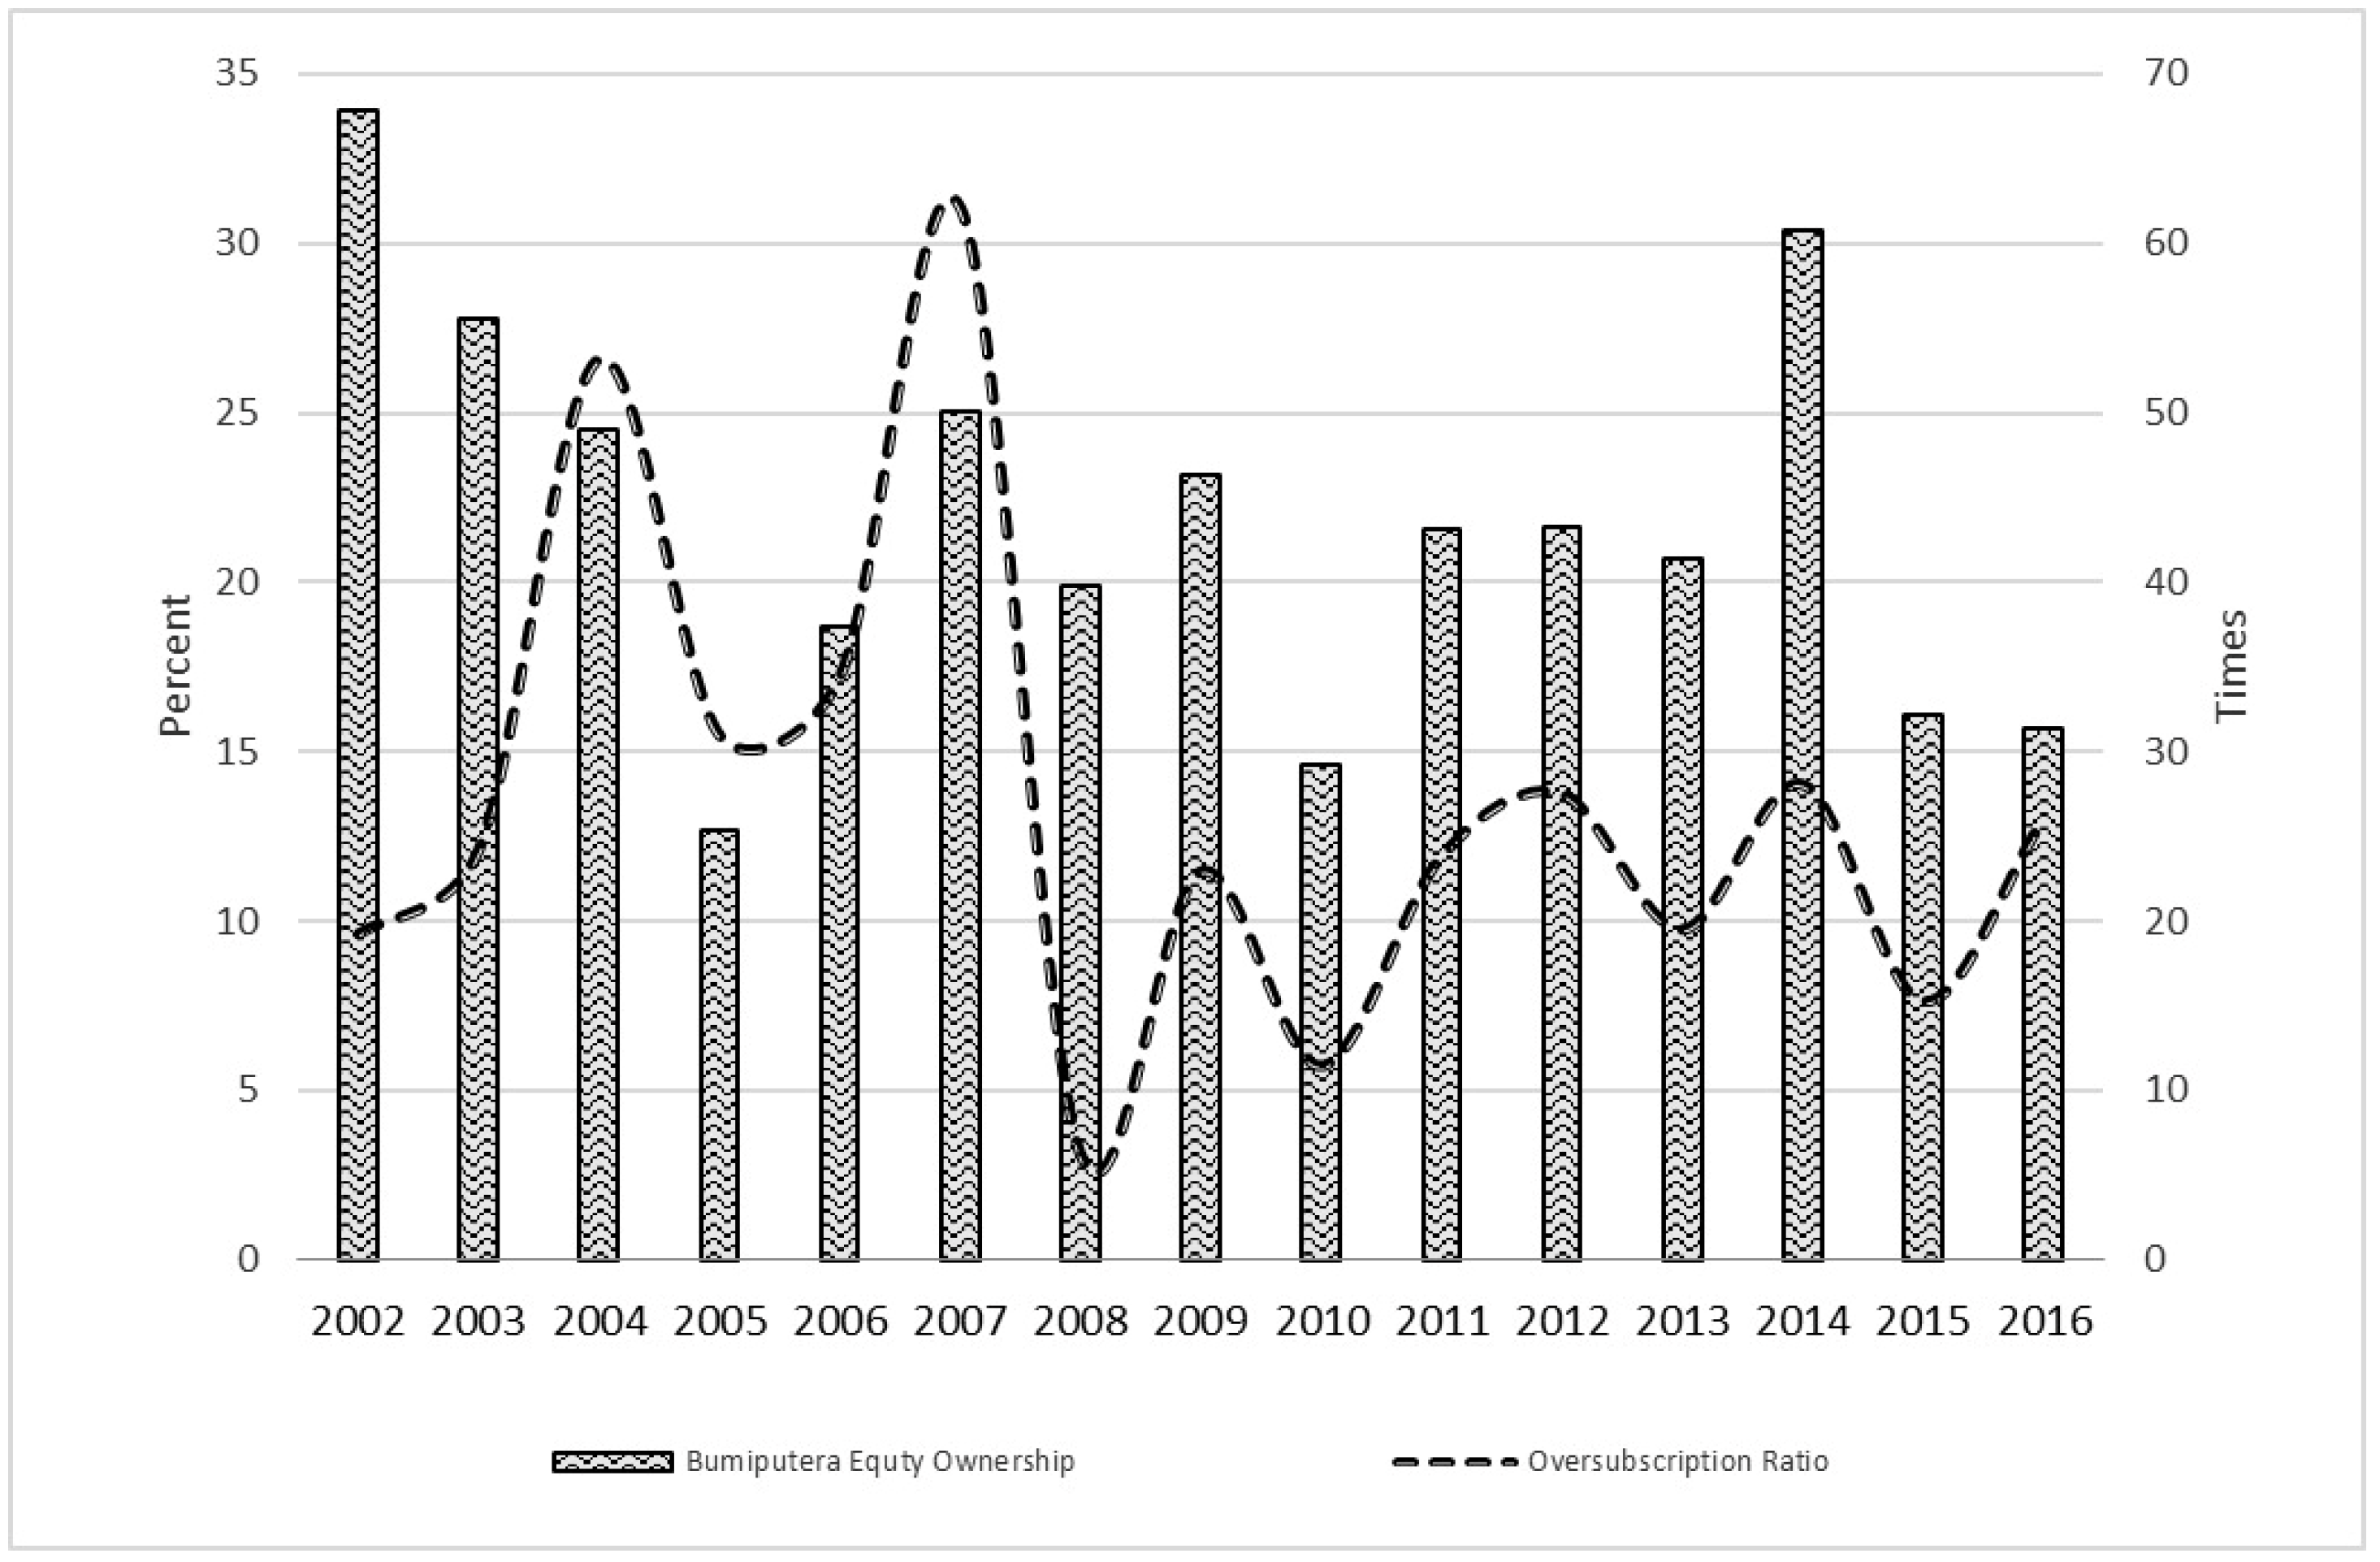
Figure 1 depicts that the yearly average for oversubscription has shown a decreasing trend, especially after the
Bumiputera equity requirement was revised in 2009. However,
Taufil-Mohd (
2007) opined that share allocations to
Bumiputera investors do not affect underpricing due to the competition among
Bumiputera investors that helps the issuer to set reasonable offer prices, resulting in a negligible effect on underpricing.
Taufil-Mohd (
2007), who investigated the regulations and underpricing, also mentioned that IPO issuers might find it easier to deal with government agencies, particularly if the companies want to issue more shares through rights issues in the future.
This study expounds the idea that the revised Bumiputera equity requirement could provide a negative signal to investors in terms of underpricing, as they could perceive that there would be fewer allocations to Bumiputera investors. Following the introduction of the revised regulation, an issuer needs not lower its IPO price to attract Bumiputera investors. Therefore, this study hypothesized that the less stringent Bumiputera equity requirement indicates that the offer prices of IPOs would be higher, leading to investors’ reluctance to subscribe to these shares. Furthermore, an increase in the allocation to non-Bumiputera investors would reduce the competition among this group of investors in subscribing to the IPOs, which could result in lower oversubscription. These arguments suggest that the revised Bumiputera regulation has a negative effect on IPO oversubscription. In accordance with this, the following hypothesis was examined:
H2. The revised regulation on the Bumiputera equity requirement in June 2009 has a negative relationship with the demand for IPOs.
3. Data and Methodology
The key sources of data collection are IPO prospectuses, downloaded from the website of Bursa Malaysia at
http://www.bursamalaysia.com/ (accessed on 1 January 2013). These prospectuses contain information on the offer price, market capitalization, share allocation to retail and institutional investors,
Bumiputera investors, listing day, and opening and closing application dates of each IPO. The sample of this study was chosen from the IPOs listed on Bursa Malaysia between January 2002 and December 2018. For this study, the IPO sample was selected among those offered as private placements, offers for sale, and public issues. However, financial companies which include banks, financial services companies, insurance companies, and real estate investment trusts (REITS) were excluded from the sample. In addition, the study restricted the sample such as excluding uncommon types of issues and outliers from the analysis to avoid less meaningful outcomes. Thus, the final sample of 348 IPOs was used for estimation using the regression model.
This paper presents the descriptive statistics for the whole sample and an analysis of median differences for two samples of IPOs. In addition, we also segregated the IPOs based on listing date between before and after 30 June 2009, when the revised
Bumiputera equity requirement became effective. The Wilcoxon signed-rank test is non-parametric and can be used to determine whether two dependent samples were selected from populations having the same distribution. We segregated the IPOs with high and low investor demand rates based on the median of all investor demand rates. All IPOs with investor demand above the median were categorised as high-investor-demand IPOs. Likewise, the low-investor-demand IPOs included those that fell below the median. The same classification was used to segregate the IPOs with high and low initial returns. In addition, we also segregated the IPOs based on listing date between before and after 30 June 2009, when the revised
Bumiputera equity requirement became effective. This study employed a cross-sectional multiple regression analysis to test the hypotheses. The main focus of this study was exploring the impacts of
Bumiputera equity ownership and the revised
Bumiputera equity requirement on the demand for IPOs. This study’s regression model had two independent variables and five control variables to attain the research objectives. The equation is set out as follows:
where the dependent variable in this study is the investors’ demand for IPOs (
DD), measured using the oversubscription ratio (
Mehmood et al. 2021a). Oversubscription is determined by dividing the total number of shares demanded by investors over the total number of shares offered.
Bumiputera equity ownership (BEQ) is the total number of shares allocated to
Bumiputera public investors over the total number of shares offered, since
Bumiputera public investors represent the
Bumiputera equity requirement under the retail offering. The revised
Bumiputera regulation is proxied by
DBUMI∆.
DBUMI∆ is a dummy variable that takes the value of “1” for the new
Bumiputera equity ruling after 30 June 2009 and “0” otherwise. The natural logarithm of market capitalization (
MCAP) represents the firm size, while risk (
RISK) is the reciprocal of the offer price. DELAY is the number of days from the opening application date to the listing date to capture information leakage. Retail investors’ involvement (
RETAIL) is measured using the percentage of retail offering over the total number of shares issued. Finally, the weighted average return of the EMAS index three months before listing is used to reflect the market condition (
3MR).
In addition, the interaction between the
Bumiputera equity ownership and firm size was added, as the authors of this study believe that the signaling mechanisms differ according to the firm size. This argument is also consistent with
Abdullah and Taufil-Mohd (
2004) and
Tajuddin et al. (
2018), who claimed that the firm size of the IPOs does affect the signaling mechanism. This interaction effect is examined using the interaction term (BEQ × MCAP), which is entered into the regression model as follows:
A further analysis was carried out using least squares with breakpoints (LSWB). The breakpoints were determined using the methods used by
Bai and Perron (
1998). LSWB is a statistical method that is commonly used to model relationships between variables that exhibit abrupt changes or “breakpoints” in their behavior. The method involves dividing the data into several segments and fitting a linear regression model to each segment. The goal of the method is to find the best fit for the data, minimizing the sum of squared differences between the observed values and the predicted values. This is achieved by minimizing a cost function that penalizes deviations from the fitted model. LSWB is a statistical method that can be used to model the relationship between variables that exhibit abrupt changes or “breakpoints” in their behavior. In the context of an IPOs oversubscription, this method can be useful in analyzing the demand of the IPOs, particularly in identifying any significant changes in the stock price trend. By fitting linear regression models to each segment of the data, we can identify any changes or breakpoints in the stock price trend and determine the strength and significance of these changes. For example, we may find that there was a significant increase in stock prices during a particular segment of the data, or that there was a sudden drop in stock prices during another segment. By dividing each period into segments of the breakpoints or changes in the demand trend, we can then fit a linear regression model to each segment using the least squares method, which minimizes the sum of squared differences between the observed stock prices and the predicted values.
4. Empirical Results
Table 2 presents the descriptive statistics for the sample of 348 IPOs listed between January 2002 and December 2018. The oversubscription ratio for the entire sample is 33.97 times on average. The lowest oversubscription is −0.67 times, equivalent to 67% undersubscription or 33% subscription for the overall issue. Meanwhile, the highest oversubscription is 229.20 times. The large gap between the lowest and highest oversubscription ratios reflects the variation in demand across the IPOs issued in Malaysia. This phenomenon provided an opportunity for this study to further explore a variety of factors that may influence oversubscription.
The IPO sample was segregated between those listed before and after the revision of the Bumiputera equity requirement on 30 June 2009. The IPO sample listed before the revision recorded an average oversubscription ratio of 33.97 times, which was close to the ratio of the full sample of 30.13 times. This result was expected, as out of the total number of IPOs issued between 2002 and 2018, 67% were issued before the revision. Next, the IPOs issued after the revision showed a lower oversubscription ratio of 21.10%. Regarding Bumiputera equity ownership, slight differences were recorded between before the revision, after the revision, and for the full sample, with averages of 22.43, 20.16, and 21.75 times, respectively.
The firm size, represented by market capitalization, is RM485 million on average, with the smallest firm size being RM16 million and the biggest being RM40.4 billion. This shows large differences between small and big firms in the Malaysian IPO market in terms of market capitalization. Further, the average firm size before the revision of the Bumiputera equity requirement is smaller (RM135 million) than after the revision (RM1.31 billion). Meanwhile, the offer price is RM0.86 on average, with values ranging from RM0.12 to RM5.05, signifying a huge gap between the lowest and highest IPO offer prices. The average offer price before the revision is RM0.81, which is lower than the average offer price of RM0.99 after the revision. Next, the DELAY as a proxy for information leakage is an average of 28 days from the opening application date to the listing date. The longest DELAY is about 86 days and the shortest is 14 days. The retail investors’ involvement is 16.73% on average, with a maximum of 75%. Finally, the market return shows a mean of 0.8% and a range of −6.6% to 7.1%.
Table 3 presents a comparison of the median values of the main variables using the independent sample Wilcoxon signed-rank test results. The basic purpose of using the Wilcoxon–Mann–Whitney (WMW) rank test is to compare nonparametric groups, specifically when the normality of the underlying distribution is questionable, which commonly exists in secondary data (
Rosner and Glynn 2009;
Lehmann 2009). Therefore, the Wilcoxon signed-rank test results explain the differences in medians between two groups. Non-parametric tests would assume that the investor demand is not normally distributed. In reporting the results of an independent Wilcoxon signed-rank test, the significant value of the test’s
T value is required. The values of high and low investor demand rates for IPOs, high and low
Bumiputera equity ownership (BEQ) rates, and the rates before and after the revised
Bumiputera equity requirement (
DBUMI∆) in June 2009 are reported in panels A, B, and C, respectively.
In panel A, the levels of investor demand vary considerably between high- and low-demand groups based on the observed median values. The median oversubscription is 39.86 times for the high-demand group but only 5.07 times for the low-demand group. This implies that a high oversubscription ratio is associated with high investor demand. Next, the median BEQ is 30.02% for the high-investor-demand group and 12.5% for the low-investor-demand group. This indicates that high allocations to Bumiputera investors would increase the subscription rates, since issuers would offer larger discounts to attract Bumiputera investors. In addition, the competition among non-Bumiputera investors could lead to higher oversubscription. This result is consistent with panel B, showing that a high BEQ allocation increased oversubscription to as much 20.07 times as compared to a low BEQ allocation, which reported an oversubscription rate of only 12.17 times. Meanwhile, in panel C, before the revision of the Bumiputera equity requirement, the median is 18.17 times (244 IPOs), while after the revision, the median is lower at 12.82 times (104 IPOs). The reduction in the percentage of shares to be allocated to Bumiputera investors indicates that issuers no longer need to reduce their offer prices to attract Bumiputera subscription. This move also reduces the competition among non-Bumiputera investors in subscribing to IPOs, resulting in less oversubscription.
Panel A also shows that the median market capitalization rate of the IPOs is RM64.8 for the IPO group with high demand and RM91.67 for the IPO group with low demand. This indicates that a small company would have higher investor demand than a large company. In general, small companies apparently set lower offer prices, which would attract investor demand for their IPOs (
Bradley and Jordan 2002). This argument is supported by the result shown in panel A that the median offer price for the high-demand IPO group is RM0.60, which is much cheaper than the median offer price of RM0.755 reported by the low-demand IPO group. Next, a longer time from the opening application date to the listing date of an IPO (
DELAY) would make it more risky for investors to participate in the IPO, since information about the company could be revealed (information leakage) during this period. From panel A, it can be seen that the longer time (28 days) is associated with low demand compared to the shorter time (25 days), which has higher demand. Next, the percentage of retail investors for the high-demand IPOs group is 12.01%, which is lower than the 16.05% recorded by the high-demand IPOs group. This finding is consistent with the result found by
Easley and O’hara (
2004) that retail investors own a substantial number of shares that carry bad news and fewer stocks that carry good news. This would be affected by the demand for IPOs. Finally, a comparison of the three-month weighted average market return revealed that a good market return of 0.012 or 1.2% led to higher demand from investors compared to an average of 0.6% market return, which caused lower demand from investors. Overall, the observed median differences for oversubscription,
Bumiputera equity ownership, revised
Bumiputera requirement, offer price, market capitalization, information leakage, retail offering, and market return rates were observed to be significant at least at the 5% level between high- and low-investor-demand groups.
Pearson’s bivariate correlation coefficient analysis between independent variables was used to ensure that there were no multicollinearity issues. Pearson’s correlation matrix between variables is presented in
Table 4. The results show that all independent variables recorded correlations of less than 0.50. A further test using variance inflation factors (VIF) generated VIF values ranging from 1.07 to 2.23, as shown in
Table 5. Therefore, there was no multicollinearity issue, as the results were far below the 10.00 cut-off point (
Gujarati and Porter 2010;
Kleinbaum et al. 2013;
Sadik-Zada and Loewenstein 2020).
Table 5 shows the results of the ordinary least squares regression based on the model shown in Equation (1) to examine the impacts of share allocations to
Bumiputera investors, the revised
Bumiputera equity requirement in June 2009, and five other control variables on the demand for IPOs. We present the findings for before and after the revision of the
Bumiputera equity requirement in June 2009, the full sample, and the interaction. In the full sample, the
Bumiputera equity ownership (BEQ) is not statistically significant. This finding is in line with the view that as there are a number of
Bumiputera investors who are likely to participate in the IPOs, the high competition among the
Bumiputera investors would allow firms to set competitive offer prices, resulting in an insignificant impact of this variable on oversubscription. Next, the revised
Bumiputera regulatory requirement (
DBUMIΔ) that became effective in June 2009 has an influence on the investors’ demand for IPOs. As expected, the revised
Bumiputera regulatory requirement has a significant but negative relationship with oversubscription. The coefficient of
DBUMIΔ is −10.5299, which means that after the revision of the
Bumiputera regulatory requirement, the oversubscription was reduced by 10.5299 times. Therefore, the second hypothesis of this study is not rejected. According to
Prasad et al. (
2006), after the Malaysian government implemented the 30%
Bumiputera equity requirement in 1976, the Malaysian IPO market experienced an increasing trend of underpricing and oversubscription. It appeared that the reverse occurred when the government relaxed the requirement from 30% to 12.5%. Due to the less stringent requirement, issuers and underwriters no longer need to underprice their IPOs to attract
Bumiputera investors. Better IPO prices allow issuers to raise higher proceeds. However, lower underpricing means lower returns, which may reduce the number of applications from among the
Bumiputera investors. Another explanation is that the increased allocation of shares to non-
Bumiputera investors would likely reduce the competition among them, since there are more shares available for subscription. Subsequently, the reduced comptetion would reduce the probability of IPOs being oversubscribed.
There are mixed results on the impact of the control variables on IPO demand. Market capitalization (
MCAP) was found to be significantly and negatively related to oversubscription. The negative result for MCAP, which represents the size of the firms, shows that there is less investor demand for large firms. The possible reason is that since large firms have good track records and good corporate governance ethics, issuers and underwriters do not need to discount their IPO prices. This might explain why large firms have lower demand from investors than smaller firms. Next, the
RISK, which is the reciprocal to the offer price, has a significant positive relationship with investor demand. The result indicates that there is higher investor demand for higher risk firms (lower offer prices). There is a high probability that issuers and underwriters underprice IPOs to attract investors to high-risk firms. Meanwhile, the duration from the opening application date to the listing date (
DELAY), which is a proxy for information leakage, is negatively related to oversubscription. This means that a longer time between the opening application date and the listing date would reduce the demand for the IPO. The possible explanation is that investors are exposed to more risks as the firms’ bad information might be revealed (information leakage) during this time period, thereby reducing oversubscription, as modeled by
Chowdhry and Sherman (
1996) and
Chen et al. (
2004). Regarding the retail investors (RETAIL), their participation in the IPOs will not increase the demand for IPOs. Unlike institutional investors, retail investors generally do not invest in large amounts. This phenomenon may explain why the result shows a significantly negative link between RETAIL and oversubscription. Finally, the market return, represented by a three-month weighted average market return before listing (3MR), was found to be significant and positively related to oversubscription. This positive result was expected, since investors would invest more money during a bullish market, which is in line with
Goergen et al. (
2006) and
Gounopoulos (
2006).
As mentioned in
Section 2, the
Bumiputera equity allocation is only mandatory for all corporations seeking a listing on the Main Market of Bursa Malaysia. In general, companies listed on the main market are larger (higher market capitalization), have better earnings, and have been operating longer than companies on the ACE Market. Since the
Bumiputera equity allocation is only mandatory for companies seeking a listing on the main market, the interaction between
Bumiputera equity ownership (BEQ) and market capitalization (MCAP) was included in the analysis for robustness. Thus, the previous models were re-estimated by including an interaction variable between
Bumiputera equity ownership and market capitalization (
BEQ × MCAP). The interaction result shows that
BEQ × MCAP is significant and positively related to oversubscription at the 5% level. This finding implies that the oversubscription rates of IPOs are significantly higher for the companies listed on the main market but mitigated by market capitalization, which supports the signaling theory argument. The positive coefficient is due to three reasons. First, during the listing process, issuers must comply with the
Bumiputera equity requirement policy. Therefore, it is believed that issuers would offer their IPOs at larger discounts even though they would receive less proceeds in order to attract
Bumiputera investors, which is in line with
How et al. (
2007),
Paudyal et al. (
1998), and
Prasad et al. (
2006). With the underpriced IPOs, the subscription rates among
Bumiputera investors would increase as they would earn higher returns. Second, the positive coefficient might be due to the participation of institutional investors or
Bumiputera trust agencies such as
Permodalan Nasional Berhad (PNB),
Pelaburan MARA, and
Equinas. These agencies or investors would generally agree in advance to purchase a large number of shares in an IPO issued by a well-established firm, which would in turn increase the oversubscription rate of the IPO.
Third, the purchasing power of non-
Bumiputera investors also increases the probability of oversubscription. Non-
Bumiputera investors, particularly the Chinese ethnic group, constitute 80% of the Malaysian stock market participants, indicating their superior purchasing power to speculate or invest (
Ramayah et al. 2009). Thus, given that the
Bumiputera equity requirement policy reduces the numbers of shares allocated to this ethnic group, the competition among them causes oversubscription of IPOs. In other words, the competition among investors would be higher due to the lower allocation of shares to them at a lower offer price, since successful applicants would generate higher returns. This is demonstrated in
Table 6, which compares the share allocations and oversubscriptions between
Bumiputera and non-
Bumiputera investors. This could be explained as the significant effect of this variable on the oversubscription ratio.
Table 6 presents a comparison of the shares allocated to
Bumiputera and non-
Bumiputera investors along with the oversubscription ratios. The analysis is based on 54 IPOs that went public after 30 June 2009 until December 2018. During the period, only those companies provided detailed breakdowns of the share allocations and oversubscriptions among
Bumiputera and non-
Bumiputera investors. It can be seen from the table that the same number of shares was offered to
Bumiputera and non-
Bumiputera investors (674.64 million each). This is in line with the SC’s guidelines requiring 50% of the 25% public spread to be allocated to
Bumiputera (12.5%) and the remaining to non-
Bumiputera (12.5%) investors. Out of 674.64 million shares offered to each group,
Bumiputera investors applied for 7.7 billion shares, whereas non-
Bumiputera investors applied for 11.4 billion shares. Thus, the shares allocated to
Bumiputera investors were oversubscribed by 15.55 times, while those allocated to non-
Bumiputera investors were oversubscribed by 23.97 times. This finding indicates that non-
Bumiputera investors have higher purchasing power than
Bumiputera investors to speculate or invest, which is in line with
Ramayah et al. (
2009).
Table 7 shows the estimation results based on least squares with breakpoints (LSWB). We identified the changes or breakpoints in the demand trend during the period of the study. The results showed two separate periods of January 2002 to July 2004 and August 2004 to December 2018.
Prior to July, the demand for IPOs was extremely oversubscribed. After July 2004, the Kuala Lumpur Composite Index (KLCI) experienced a significant decline, dropping by over 8% in a single day of trading. This decline was part of a broader sell-off in emerging market equities that was triggered by concerns about rising US interest rates and a slowdown in global economic growth, which was the beginning of “the great recession”. The decline in the KLCI had several implications for the Malaysian market. Firstly, it created uncertainty and risk for investors, who may have become more cautious about investing in Malaysian equities. This could have made it more difficult for companies to raise capital through the stock market, as investors may have been less willing to participate in IPOs or buy shares in listed companies. Secondly, the decline in the KLCI could have had negative implications for the broader Malaysian economy. The stock market is an important source of financing for companies, and a decline in the market can make it more difficult for companies to invest in new projects or expand their operations. This, in turn, can slow down economic growth and have negative implications for employment and other economic indicators. Finally, the decline in the KLCI highlighted the importance of monitoring global economic trends and market conditions for Malaysian investors and companies. As a small, open economy, Malaysia is particularly susceptible to external shocks, and events in other parts of the world can have significant implications for the Malaysian market. As such, investors and companies need to be aware of these risks and take steps to manage them. Overall, the use of least squares with break points can provide valuable insights into the behavior for IPOs over time, particularly in identifying any significant changes or breakpoints in the trend. This can be useful in analyzing a company’s performance and making informed investment decisions.


 ,
, 

