
Productivity and Global Value Chains: A Tale from the Indonesian Automobile Sector


Abstract
:1. Introduction
2. Literature Review
2.1. Global Value Chain and Global Production Networks
2.2. Labor Productivity
2.3. Linking Labor Productivity and GVC
3. Data and Methodology
- (1)
- Exporting domestic value added in intermediate exports used by other countries as an input for other countries domestically consumed final products.
- (2)
- Exporting domestic value added in intermediate exports used by other countries to produce exports directly or indirectly.
- (3)
- Using other countries’ value added to produce its gross exports directly or indirectly.
- (4)
- Using other countries’ value added to produce its gross output for domestic use directly or indirectly.
4. Results
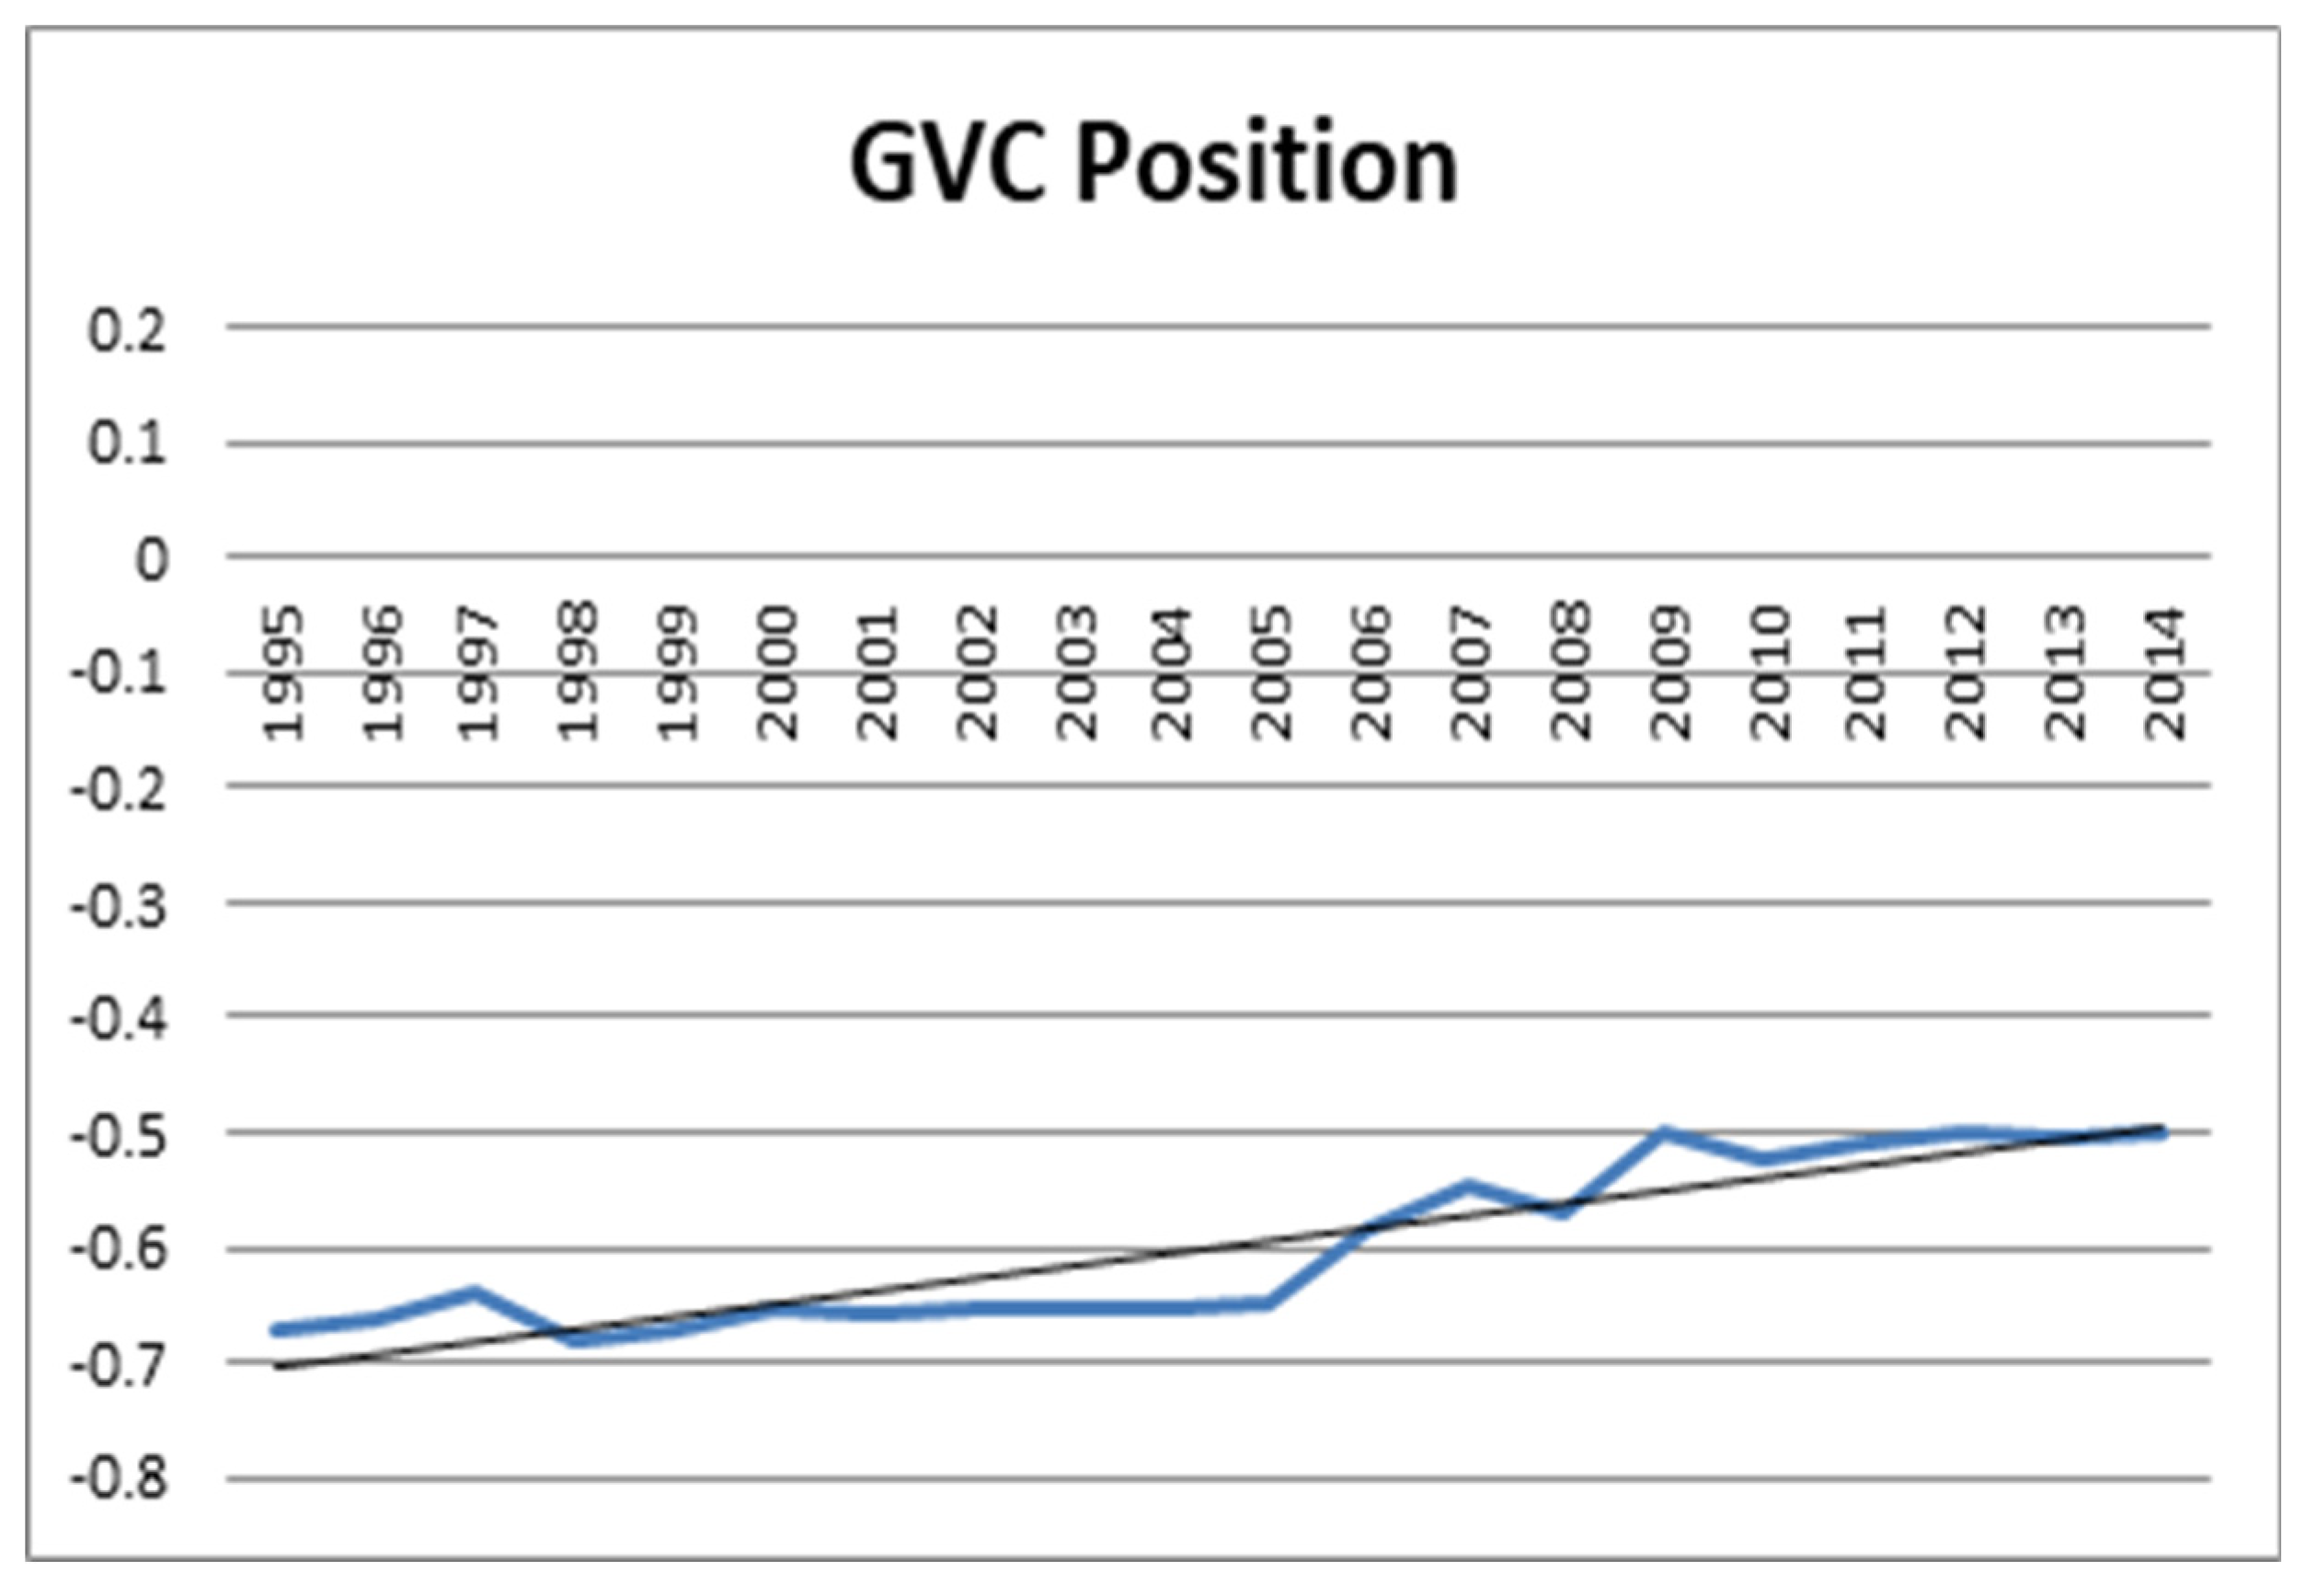
4.1. GVC Position
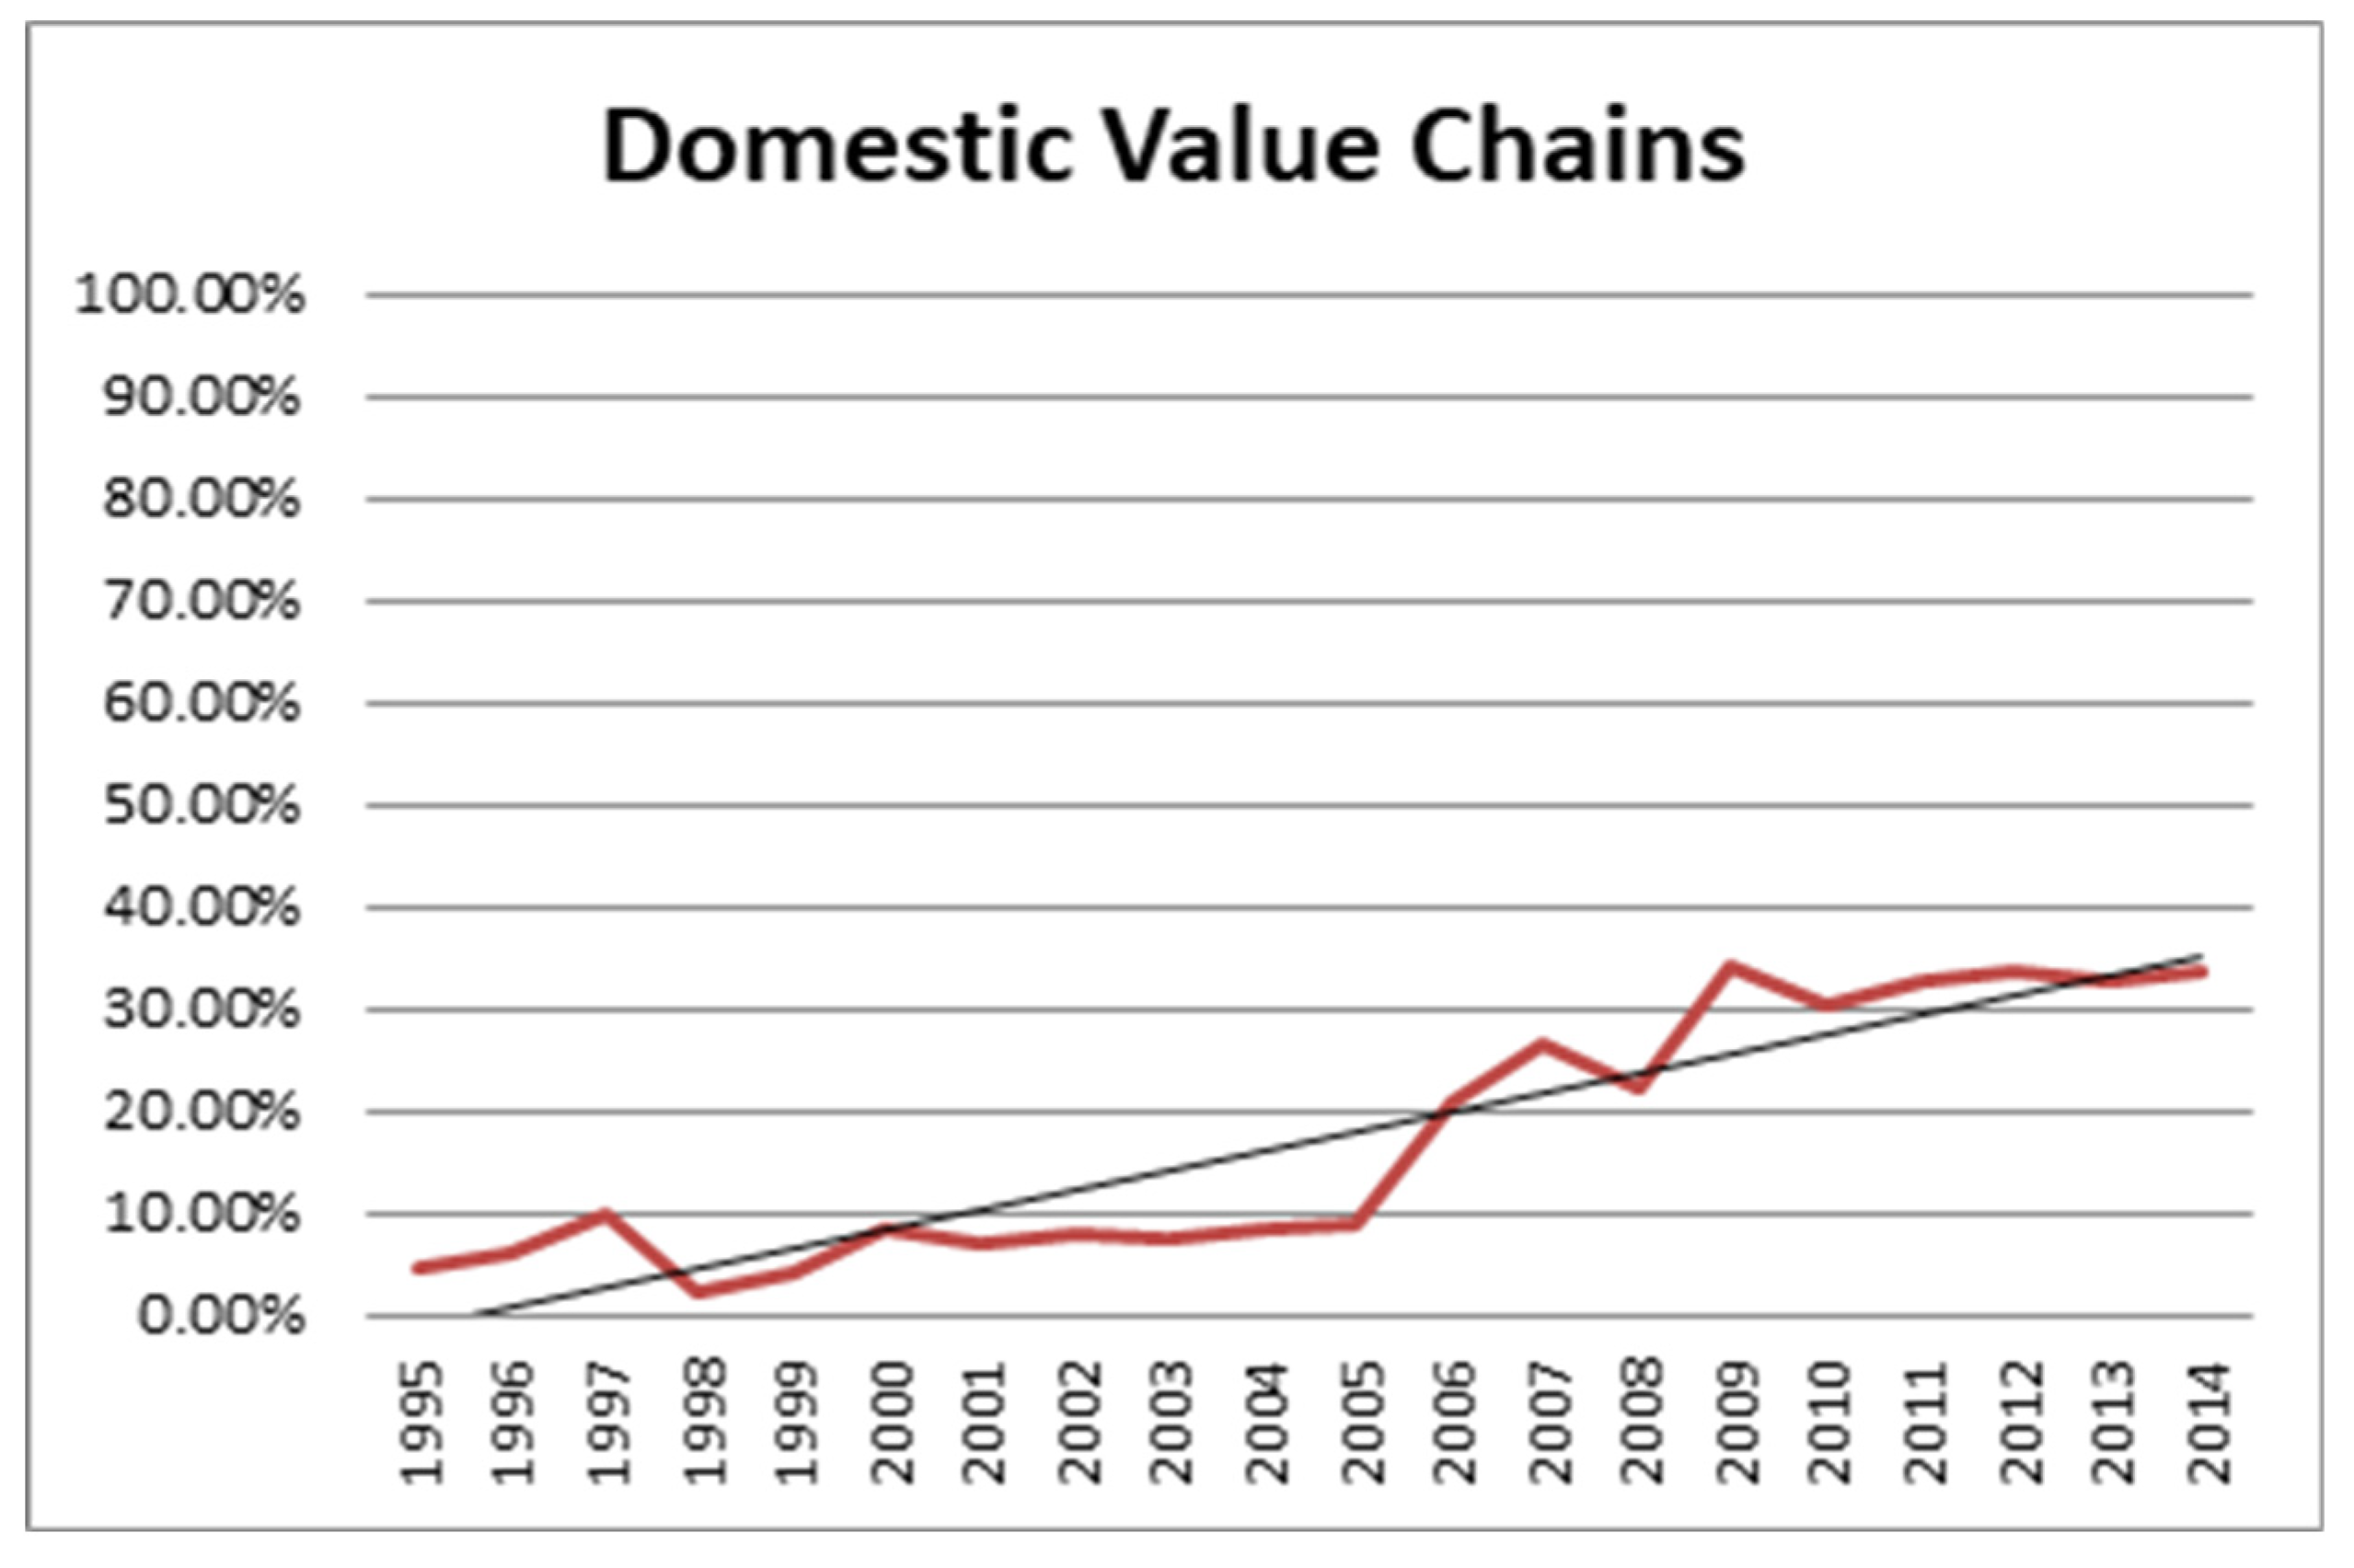
4.2. Domestic Value Chain
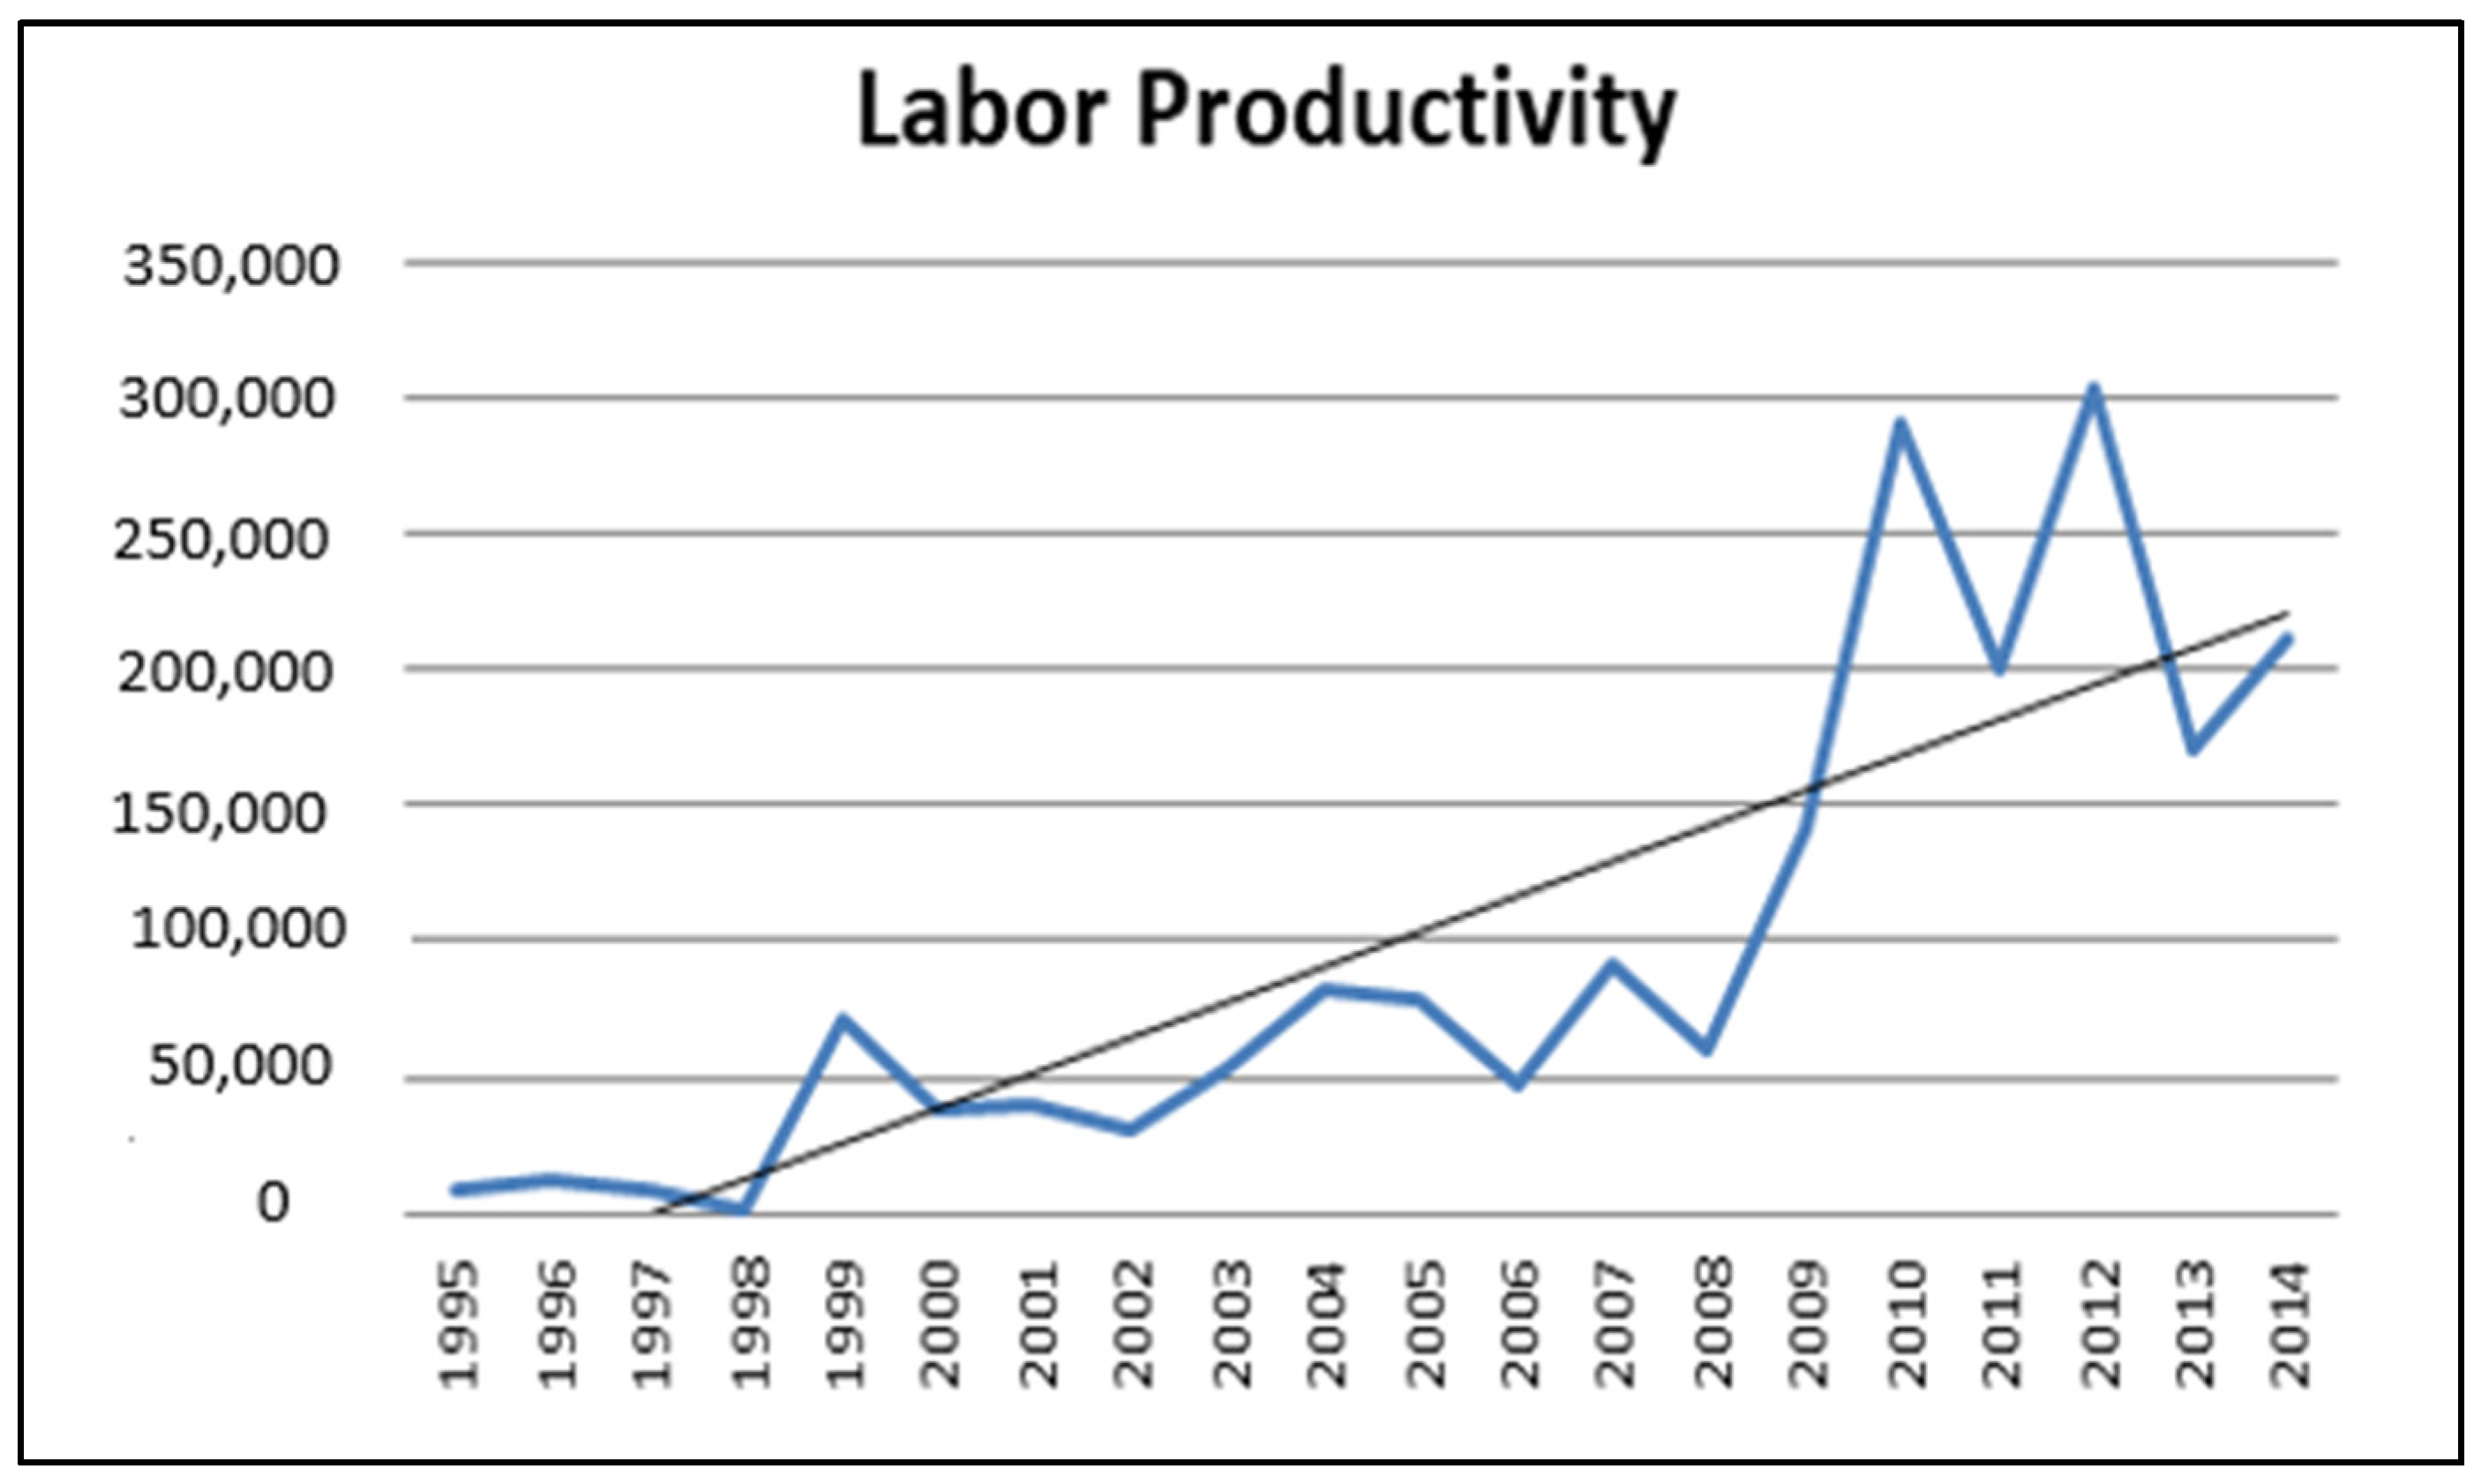
4.3. Labor Productivity
5. Discussion
6. Conclusions
Author Contributions
Funding
Informed Consent Statement
Data Availability Statement
Conflicts of Interest
References
- Afrooz, Ahmad, Khalid B Abdul Rahim, Zaleha Bt Mohd Noor, and Lee Chin. 2010. Human Capital and Labor Productivity in Food Industries of Iran. International Journal of Economics and Finance 2: 47–51. [Google Scholar] [CrossRef]
- Allen, Emma R. 2016. Analysis of Trends and Challenges in the Indonesian Labor Market. ADB Papers on Indonesia No. 16. Manila: ADB. [Google Scholar]
- Antras, Pol, Davin Chor, Thibault Fally, and Russell Hillberry. 2012. Measuring the Upstreamness of Production and Trade Flows. American Economic Review 102: 412–16. [Google Scholar] [CrossRef]
- Baldwin, John R., and Beiling Yan. 2014. Global Value Chain Participation and the Productivity of Canadian Manufacturing Firms. Economic Analysis Research Paper 11. Montreal: Statistics Canada. [Google Scholar]
- Banga, Karishma. 2016. Impact of Global Value Chains on Employment in India. Journal of Economic Integration 31: 631–73. [Google Scholar] [CrossRef]
- Barrientos, Stephanie, Gary Gereffi, and Arianna Rossi. 2010. Economic and social upgrading in global production networks: Developing a framework for analysis. International Labor Review 150: 319–40. [Google Scholar] [CrossRef]
- Belderbos, René, Vincent Van Roy, and Florence Duvivier. 2013. International and Domestic Technology Transfers and Productivity Growth: Firm-Level Evidence. Industrial and Corporate Change 22: 1–32. [Google Scholar] [CrossRef]
- Beverelli, Cosimo, Victor Stolzenburg, Robert B. Koopman, and Simon Neumueller. 2019. Domestic Value Chains as Stepping Stones to Global Value Chain Integration. The World Economy 42: 1467–94. [Google Scholar] [CrossRef]
- Blalock, Garrick, and Francisco M. Veloso. 2007. Imports, productivity growth, and supply chain learning. World Development 35: 1134–51. [Google Scholar] [CrossRef]
- Chopra, Sunil, and Peter Meindl. 2016. Supply Chain Management, 6th ed. New York: Pearson. [Google Scholar]
- Collewet, Marion, and Jan Sauermann. 2017. Working Hours and Productivity. Labor Economics 47: 96–106. [Google Scholar] [CrossRef]
- Criscuolo, Chiara, and Jonathan Timmis. 2017. The Relationship Between Global Value Chains and Productivity. International Productivity Monitor 32: 61–83. [Google Scholar]
- Doran, Desmond. 2004. Rethinking the supply chain: An automotive perspective. Supply Chain Management: An International Journal 9: 102–9. [Google Scholar] [CrossRef]
- Gereffi, Gary, and Karina Fernandez-Stark. 2016. Global Value Chain Analysis: A Primer, 2nd ed. Durham: Center on Globalization Governance and Competitiveness—Duke University. [Google Scholar]
- Heshmati, Almas, and Masoomeh Rashidghalam. 2018. Labor Productivity in Kenyan Manufacturing and Service Industries. In Determinants of Economic Growth in Africa. Edited by Almas Heshmati. Cham: Palgrave Macmillan, pp. 259–86. [Google Scholar]
- Humphrey, John. 2003. Globalization and supply chain networks: The auto industry in Brazil and India. Global Networks 3: 121–44. [Google Scholar] [CrossRef]
- Inomata, Satoshi. 2017. Analytical frameworks for global value chains: An Overview. In Global Value Chain Development Report. Geneva: World Trade Organization. [Google Scholar]
- Islam, Rizwanul. 2015. Globalization of Production Work and Human Development: Is a Race to the Bottom Inevitable? New York: UNDP Human Development Report. [Google Scholar]
- Islam, Rizwanul, Kinyondo Abel, and Nganga Joseph. 2015. Real wages and labor productivity in Tanzania: How do they link? Journal of African Studies and Development 7: 81–98. [Google Scholar]
- Jafari, Mostafa, Peyman Akhavan, and Abbas Rafiei. 2014. Technology Transfer Effectiveness in Knowledge-Based Centers: Providing a Model Based on Knowledge Management. International Journal of Scientific Knowledge 4: 24–39. [Google Scholar]
- Javorsek, Marko, and Ignacio Camacho. 2015. Trade in Value Added: Concepts, Estimation, and Analysis. ARTNeT Working Paper Series No. 150. Bangkok: ESCAP. [Google Scholar]
- Johnson, Robert C. 2017. Measuring Global Value Chains. NBER Working Paper 24027. Cambridge: NBER. [Google Scholar]
- Kimura, Fukunari, and Mitsuyo Ando. 2005. Two-dimensional fragmentation in East Asia: Conceptual framework and empirics. International Review of Economics and Finance 14: 317–48. [Google Scholar] [CrossRef]
- Koopman, Robert, William Powers, Zhi Wang, and Shang-Jin Wei. 2010. Give Credit Where Credit Is Due: Tracing Value Added in Global Production Chains. NBER Working Paper 16426. Cambridge: NBER. [Google Scholar]
- Koopman, Robert, Zhi Wang, and Shang-Jin Wei. 2012. Tracing Value-Added and Double Counting in Gross Exports. NBER Working Paper 18579. Cambridge: NBER. [Google Scholar]
- Krugman, Paul. 1990. Increasing Returns and Economic Geography. NBER Working Paper 18579. Cambridge: NBER. [Google Scholar]
- Kummritz, V. 2015. Global Value Chains: Benefiting the Domestic Economy? IHEID Working Papers 02-2015. Geneva: Economics Section, the Graduate Institute of International Studies. [Google Scholar]
- Kuruvila, Satosh, and Tashlin Lakhani. 2013. Globalization. In Comparative Employment Relations in the Global Economy. Edited by Carola Frege and John Kelly. New York: Routledge, pp. 369–89. [Google Scholar]
- Man, Ng Chi, and Tsang Wan Ling. 2014. Relationships between Working Hours and Productivity: The Case of Food Services and Information Communication Industries in Hong Kong. Advances in Economics and Business 2: 281–92. [Google Scholar] [CrossRef]
- Mihaljek, Dubravko, and Sweta Saxena. 2010. Wages, Productivity, and Structural Inflation in Emerging Market Economies. BIS Papers 49: 53–75. [Google Scholar]
- Montalbano, Pierluigi, Silvia Nenci, and Carlo Pietrobelli. 2017. Opening and Linking Up: Firms, GVCs, and Productivity in Latin America. UNU-MERIT Working Papers No. 030. Maastricht: UNU-MERIT. [Google Scholar]
- Newman, Carol, John Rand, Theodore Talbot, and Finn Tarp. 2015. Technology Transfers, Foreign Investment and Productivity Spillovers. European Economic Review 76: 168–87. [Google Scholar] [CrossRef]
- Okamoto, Yumiko, and Fredrik Sjöholm. 2000. Protection and the Dynamics of Productivity Growth: The Case of Automotive Industries in Indonesia. ASEAN Economic Bulletin 17: 60–73. [Google Scholar] [CrossRef]
- Oyeranti, Gboyega. 2000. Concept and measurement of productivity. Paper presented at the CBN 9th Annual Conference Proceedings, Abeokuta, Nigeria, June 12–16. [Google Scholar]
- Pietrobelli, Carlo, and Roberta Rabellotti. 2011. Global value chains meet innovation systems: Are there learning opportunities for developing countries. World Development 39: 1261–69. [Google Scholar] [CrossRef]
- Rees, Albert, and Donald P. Jacobs. 1961. Real Wage in Manufacturing, 1890–1914. NBER Working Paper 61. Cambridge: NBER. [Google Scholar]
- Rusinova, Desislava, Vilen Lipatov, and Frigyes Ferdinand Heinz. 2015. How Flexible are Real Wages in EU Countries? A Panel Investigation. Journal of Macroeconomics 43: 140–54. [Google Scholar] [CrossRef]
- Sturgeon, Timothy, Johannes Van Biesebroeck, and Gary Gereffi. 2008. Value chains, networks and clusters: Reframing the global automotive industry. Journal of Economic Geography 8: 297–321. [Google Scholar] [CrossRef]
- Timmer, Marcel P., Erik Dietzenbacher, Bart Los, Robert Stehrer, and Gaaitzen J. De Vries. 2015. An Illustrated User Guide to the World Input-Output Database: The Case of Global Automotive Production. Review of International Economics 23: 575–605. [Google Scholar] [CrossRef]
- Turcotte, Julie, and Lori Whewell Rennison. 2004. The Link between Technology Use, Human Capital, Productivity and Wages: Firm-level Evidence. International Productivity Monitor 9: 25–36. [Google Scholar]
- Wang, Zhi, Shang-Jin Wei, Xinding Yu, and Kunfu Zhu. 2017. Measures of Participation in Global Value Chains and Global Business Cycles. NBER Working Paper 2322. Cambridge: NBER. [Google Scholar]
- Wicaksono, Padang, and Lionel Priyadi. 2016. Decent Work in Global Production Network: Lessons Learnt from the Indonesian Automotive Sector. Journal of Southeast Asian Economies 33: 95–110. [Google Scholar] [CrossRef]
- Wicaksono, Padang, Nanetta Hardini, and Toni Bakhtiar. 2019. Economic and Social Development in Global Production Networks: Lessons from the Indonesian Footwear Industry. International Journal of Business and Society 20: 127–44. [Google Scholar]
- Yeung, Henry Wai-chung, and Neil Coe. 2014. Toward a Dynamic Theory of Global Production Networks. Economic Geography 91: 29–58. [Google Scholar] [CrossRef]

| Year | Forward Linkage | Backward Linkage | Net Gains |
|---|---|---|---|
| 1995 | 5.46 | 13,992.76 | 0.00039 |
| 1996 | 9.89 | 11,954.65 | 0.00083 |
| 1997 | 18.12 | 9799.42 | 0.00185 |
| 1998 | 4.91 | 20,700.50 | 0.00024 |
| 1999 | 4.39 | 13,372.52 | 0.00033 |
| 2000 | 3.84 | 8036.83 | 0.00048 |
| 2001 | 4.12 | 8891.17 | 0.00046 |
| 2002 | 4.59 | 10,134.46 | 0.00045 |
| 2003 | 3.54 | 9694.10 | 0.00036 |
| 2004 | 6.86 | 14,933.71 | 0.00046 |
| 2005 | 9.42 | 15,511.73 | 0.00061 |
| 2006 | 18.38 | 7887.50 | 0.00233 |
| 2007 | 39.63 | 10,734.70 | 0.00369 |
| 2008 | 54.86 | 10,350.57 | 0.00530 |
| 2009 | 47.81 | 4586.10 | 0.01043 |
| 2010 | 53.27 | 6223.50 | 0.00856 |
| 2011 | 77.63 | 7767.29 | 0.00999 |
| 2012 | 122.40 | 8933.05 | 0.01370 |
| 2013 | 122.72 | 9090.61 | 0.01350 |
| 2014 | 140.53 | 9210.10 | 0.01526 |
| Year | DVC | GVC Position | Net Gains | Labor Productivity |
|---|---|---|---|---|
| 1995 | 4.51% | −0.66991 | 0.00039 | 8583.69 |
| 2014 | 33.51% | −0.49970 | 0.01526 | 210,643.02 |
| Difference | 28.98% | 0.17021 | 0.01487 | 202,059.33 |
Disclaimer/Publisher’s Note: The statements, opinions and data contained in all publications are solely those of the individual author(s) and contributor(s) and not of MDPI and/or the editor(s). MDPI and/or the editor(s) disclaim responsibility for any injury to people or property resulting from any ideas, methods, instructions or products referred to in the content. |
© 2023 by the authors. Licensee MDPI, Basel, Switzerland. This article is an open access article distributed under the terms and conditions of the Creative Commons Attribution (CC BY) license (https://creativecommons.org/licenses/by/4.0/).
Share and Cite
Wicaksono, P.; Hikmah, Y.; Ilmiawani, R.N. Productivity and Global Value Chains: A Tale from the Indonesian Automobile Sector. Economies 2023, 11, 262. https://doi.org/10.3390/economies11100262
Wicaksono P, Hikmah Y, Ilmiawani RN. Productivity and Global Value Chains: A Tale from the Indonesian Automobile Sector. Economies. 2023; 11(10):262. https://doi.org/10.3390/economies11100262
Chicago/Turabian StyleWicaksono, Padang, Yulial Hikmah, and Rayinda Nur Ilmiawani. 2023. "Productivity and Global Value Chains: A Tale from the Indonesian Automobile Sector" Economies 11, no. 10: 262. https://doi.org/10.3390/economies11100262
APA StyleWicaksono, P., Hikmah, Y., & Ilmiawani, R. N. (2023). Productivity and Global Value Chains: A Tale from the Indonesian Automobile Sector. Economies, 11(10), 262. https://doi.org/10.3390/economies11100262