Article

How Trade Dampens the Impact of Financial Frictions in the Presence of Large Firms

Department of Economics, University of Athens, 1 Sofokleous Str., 10559 Athens, Greece
Economies 2022, 10(11), 266; https://doi.org/10.3390/economies10110266
Submission received: 23 August 2022 / Revised: 3 October 2022 / Accepted: 22 October 2022 / Published: 27 October 2022
(This article belongs to the Section International, Regional, and Transportation Economics)

Abstract

:
In this paper we aim, first, to examine how an economy’s financial development affects the welfare gains from trade and, second, to uncover how large firms threaten to suppress these gains, through the exertion of market power and their confirmed preferential access to liquidity. To this purpose, we propose a theoretical model of international trade with financial constraints, which are different between large oligopolists and small monopolistic competitors. We show that trade diminishes the impact of credit misallocation and financial frictions and creates welfare gains by intensifying selection and boosting competition. We find that welfare gains are higher under harsher domestic distortions, meaning that trade particularly benefits developing economies, acting as a substitute for financial development. Nevertheless, in the shadow of large firms, gains from trade are diminished, even more so when such firms are rare and, therefore, more powerful. We conclude that international trade is a prerequisite for financial and economic development but the benefits from globalization are not fully reaped unless large-firm entry and competition are facilitated. We trust that our findings are extremely relevant for developing economies, which are often export-oriented, but, at the same time, suffer from severe credit market inefficiencies and a shortage of large incumbents.

1. Introduction

The ability to access financial capital has a profound impact on firm entry, production and export behavior, all of which often require large upfront costs that cannot be funded internally (Bekaert and Harvey 1995; Bekaert et al. 2011; Henderson et al. 2006). Firms are constrained by the stage of financial development of the country in which they are located, but there is also substantial within-country heterogeneity in firms’ financial inclusion. Notably, firm size appears to be a decisive variable. Small firms face higher transaction costs and higher risk premia, since they have less collateral to offer and their internal information is less transparent. As a result, they tend to operate under stringent credit constraints (Beck et al. 2005; Beck and Demirguc-Kunt 2006; Cleary 2006).
In this paper, we aim, first, to examine how an economy’s financial development affects the welfare gains from trade and, second, to uncover how large firms shape these gains, through their exertion of market power and confirmed preferential access to liquidity. Our research is particularly relevant for developing economies, many of which are export-oriented but, at the same time, suffer from severe credit market imperfections and low competitive pressures for large incumbents (Ciani et al. 2020).
To this purpose, we propose a theoretical model of international trade with financial constraints, which are different between large and small competitors. To explicitly model large firms and, in particular, to replicate their key characteristic, namely their well-documented ability to behave strategically and exert market power (Hottman et al. 2016), we build a novel model economy with a continuum of closely substitutable product lines, where each one of them is produced by large oligopolists and a fringe of small monopolistic competitors. Our economy is characterized by the existence of credit constraints and small firms are assumed to be more severely impeded by them.
In this framework, we introduce international trade between countries that are either symmetric or asymmetric in their financial development. We obtain that trade always raises aggregate welfare by creating pro-competitive and selection gains, a finding evident in empirical works of the likes of Pavcnik (2002), Trefler (2004) and Bernard et al. (2007). More specifically, in our setup, trade liberalization intensifies competition via new entry, lowering the average markup and raising cutoff productivities. We also show that these effects are stronger when the trading partner is more financially advanced. Furthermore, via the trade-induced selection of the most productive producers, openness limits the inefficiency resulting from preferential access to credit for large firms. Thus, our first contribution to the literature is to highlight an overlooked source of gains from trade that is of uttermost importance for developing economies: opening up to trade could, at least partially, make up for financial underdevelopment and credit misallocation.
Regarding large firms, we demonstrate that, in their shadow, welfare gains are suppressed more when such firms are less numerous and, therefore, more powerful. This happens because large firms are these “happy few” that are capable of charging a markup that is both higher compared to their smaller counterparts (Mayer and Ottaviano 2008; De Loecker and Warzynski 2012) and selected in a strategic fashion (Hottman et al. 2016; Neary 2010). Thus, large-firm presence creates a markup inefficiency that becomes more severe as such producers become rare and market concentration rises. Consequently, our second contribution is to unveil a crucial mechanism through which the presence of big companies poses a major threat to potential gains from trade. This is an issue of great relevance to trade economists, given the extreme concentration of global markets (Bernard et al. 2007; Mayer and Ottaviano 2008; Freund and Pierola 2015) and it is also critical for developing economies that tend to exhibit a shortage of large firms and dedicate considerable resources to fill the “missing top” of the firm distribution (Ciani et al. 2020). We conclude that, in their attempt to encourage big businesses and attract foreign direct investment, as a means for growth, it is imperative that developing governments do not neglect competition considerations.
In the remaining part of this Introduction, we offer a review of the literature related to this paper. First, we consider the recent resurgence of interest involving strategic market power and international trade, as a result of the increasing role of large enterprises in the global economy. Second, we present the extensive new literature on trade and financial constraints.
Research on large “superstar” firms dates back to Rosen (1981), but interest in the field has recently intensified due to an emerging new empirical literature emphasizing globalization as, arguably, the most powerful force behind their increasingly dominant presence (Autor et al. 2020; Head and Spencer 2017). Such evidence motivated the mixed market competition model, in which a small number of large firms operates alongside a fringe of infinitesimally small competitors (Shimomura and Thisse 2012; Parenti 2018; Vavoura 2017). Our model complements this literature by introducing productivity heterogeneity among firms in a manner (across a continuum of closely substitutable products) that allows for general equilibrium considerations and free entry, as well as by incorporating credit constraints that differ across firms. The aforementioned extensions allow us to introduce insights from corporate finance into the model and account for the impact of financial conditions on trade at the industry and at the aggregate level (Leibovici 2021).
By introducing credit constraints into a trade model, we also add to the prominent field at the intersection of trade and finance, reviewed in Foley and Manova (2015). Most importantly, Manova (2013) considers a model where productivity determines the amount of funding. Abstracting from the assumption that productivity and access to capital are perfectly positively correlated, our paper is, to our knowledge, the first theoretical attempt to add firm size as a new source of differential credit constraints. By doing so, our model is also related to the research on firm size and liquidity, such as Beck et al. (2005), Beck and Demirguc-Kunt (2006), Bloom et al. (2010) and Cleary (2006) and, more recently, Pietrovito and Pozzolo (2021), Rodríguez-Pose et al. (2021) and Singh and Kaur (2021), which is reviewed in Segarra and Teruel Carrizosa (2009) and Atkin and Khandelwal (2020). Finally, using a different methodological approach, our findings confirm evidence from theoretical (Antras and Caballero 2009) but also empirical works (Tito and Wang 2017), documenting the complementarities between trade and capital mobility that underline inter-sector reallocations as a prominent source of gains from trade.
The remainder of the paper is organized as follows. In Section 2, we build the model economy and specify the markups and survival cutoff productivities for large and small firms. In Section 3, we introduce bilateral trade between symmetric and asymmetric countries and derive a number of testable results regarding how markups, survival cutoffs and welfare gains from trade change with the trade cost, competition and financial frictions. Then, we state our policy implications. Section 4 concludes.

2. The Model Economy

The model economy involves one homogeneous and one horizontally differentiated sector and one production factor, labor. The homogeneous sector operates under constant returns and perfect competition and its output is used as the numeraire. The differentiated sector exhibits increasing returns and is an aggregate of Ω goods (also referred to as product lines) ω [ 0 , Ω ] , each produced by N ω Cournot oligopolistic (CO) firms n = 1 , , N ω and M ω monopolistically competitive (MC) firms m [ 0 , M ω ] . Each firm j = m , n produces a differentiated variety of ω and therefore, given that MC firms are of infinitesimal mass and setting the mass of each CO firm equal to one1, the total mass of varieties of ω provided is equal to K ω = N ω + M ω .

2.1. Preferences and Demand

The economy is populated by a continuum of identical consumers of measure one who supply one unit of labor inelastically. Labor can be transformed one-to-one into the homogeneous good. Hence, without loss of generality, the total size of the population as well as the equilibrium wage are both set equal to one.
The aggregate consumption of each good ω is given by:
X ω = n = 1 N ω x ω n + 0 M ω x ω m d m
where x ω n is the consumption of variety n of good ω produced by the CO firm n and x ω m is the consumption of variety m of good ω produced by the MC firm m. The utility of the representative consumer of consuming good ω is quadratic:
u ( X ω ) = 0 K ω α x ω j β 2 x ω j 2 d j γ 2 0 K ω x ω j d j 2
where the consumption profile X ω of good ω consists of varieties and j = m , n [ 0 , K ω ] . The parameters α , β , γ are positive. The parameters α and γ control the substitutability between the differentiated and the homogeneous sector, with higher α and lower γ leading to increased demand for the former versus the latter. The parameter β captures the degree of product differentiation between the differentiated goods. As β tends to zero, consumers tend to care only about their aggregate consumption of all differentiated varieties. The upper-tier utility function is quasi-linear:
U = A + 0 Ω u ( X ω ) d ω
where A is the consumption from the homogeneous sector. Finally, we define X to be the total consumption of the differentiated sector, which is equal to X = 0 Ω X ω d ω . The representative consumer faces the following budget constraint:
A + 0 Ω 0 K ω p ω j x ω j d j d ω I
where I is the consumer income, which is equal to the wage income plus any firm profit2. Under the assumption of positive consumption of the numeraire A > 0 , the inverse demand function for variety j = m , n of good ω is p ω j = α β x ω j γ X ω .

2.2. Production

All firms use only labor to cover their costs. We assume that firms are heterogeneous in their productivity across product lines ω [ 0 , Ω ] but homogeneous within each ω . A firm j [ 0 , K ω ] producing good ω has productivity z ω and uses the following production function:
z ω 1 x ω j + λ = l j
where l j is the labor input of firm j, x ω j is the quantity produced by firm j and λ > 0 is the fixed production cost. Each firm producing the same good ω behaves non-cooperatively and maximizes its operating profit subject to the inverse demand. We avoid introducing productivity heterogeneity among the producers of each ω since this would complicate the model without adding any new intuition3.
We go on to incorporate credit constraints into the model following Manova (2013). We assume that variable costs are funded internally but, to pay their fixed production cost λ , firms must bear a fraction d ( 0 , 1 ) of λ upfront. This upfront cost is covered via borrowing from financial institutions by pledging a fraction t ( 0 , 1 ) of λ as collateral. Higher d and lower t indicate stronger financial vulnerability of the firm or product line. We assume that all firms in all product lines face the exact same d and t. Due to imperfect financial contractability, credit institutions expect to be repaid by firms with probabilities δ m , δ n ( 0 , 1 ) , which represent the willingness of these institutions to enforce credit constraints. The δ ’s of a given country capture its financial development4.
The objective function of firm j = m , n indicates that a fraction ( 1 d ) of the fixed cost λ and the full variable cost are financed internally and that, if the contract is enforced (with probability δ j δ m , δ n ), firms must pay F z ω to the financial institution. In case of default, firms lose the collateral. The general maximization problem follows:
max x ω j , F π ω j = p ω j 1 z ω x ω j 1 d λ δ j F z ω 1 δ j t λ s . t . p ω j = α β x ω j γ X ω ( inverse demand ) A ω j p ω j 1 z ω x ω j 1 d λ F z ω ( liquidity constraint ) B ω j d λ + δ j F z ω + 1 δ j t λ 0 ( participation constraint )
The liquidity constraint implies that, in case of repayment, firms can pay up to their net revenue A ω j . The participation constraint implies that the financial institution is willing to enter the contract only if their net return B ω j exceeds the outside option, normalized to zero.
In their maximization, CO firms face the additional constraint:
X ω = x ω n + x ^ ω n + 0 M ω x ω m d m
where x ^ ω n represents the quantity sold by the other ( N ω 1 ) CO firms. The reason behind (3) is that, contrary to MC firms, CO firms do not treat the aggregate X ω parametrically but take into account, when they form their decisions, their ability to manipulate it.
With the inclusion of this additional constraint, but only for the few large producers, we move away from pure monopolistic competition and pure oligopoly. As a result, we are able to relax the uniform supply-side market power assumption that is built into both of these modes of competition but appears to have little empirical support (Bernard et al. 2018; De Loecker et al. 2016; De Loecker and Van Biesebroeck 2018; De Loecker and Warzynski 2012).

2.3. Equilibrium

Each MC firm maximizes its operating profit subject to the inverse demand, the liquidity and the participation constraint. Each CO firm maximizes its operating profit subject to the inverse demand, the liquidity and the participation constraint as well as the additional constraint (3). Our structure follows the “small in the large and large in the small” approach to model oligopoly in general equilibrium as in Neary (2003). Under our assumption that there exists a continuum of ω , CO firms can manipulate the market of their product line but are unable to affect the aggregate economy.
Moving on to the role of credit constraints, since net revenues A ω j increase with productivity z ω , the liquidity constraint is binding for firms below a cutoff z ω j * , where index j indicates that this cutoff is different between CO and MC firms. The optimal decision of firms is to adjust their payment F to take investors to their participation constraint which, in equilibrium, holds with equality: B ω j = 0 .
Proposition 1
(markups). CO firms charge a higher markup than the MC firms operating within the same product line.
Proof. 
We obtain the following markups for MC and CO firms, respectively:
μ ω m = p ω m 1 z ω = 1 2 α 1 z ω γ X ω ,
μ ω n = p ω n 1 z ω = β + γ 2 β + γ α 1 z ω γ X ω
Since β + γ 2 β + γ > 1 2 , we obtain that μ ω n > μ ω m . □
This result is supported by the empirical literature: among others, Hottman et al. (2016) found that markups are higher for larger firms who depart substantially from the monopolistically competitive benchmark and appear to behave strategically. This is a key reason why controlling for productivity differences across firms, both in monopolistically competitive and oligopolistic models, does not lead to markup equalization but leaves out a significant residual markup inequality (De Loecker and Warzynski 2012).
Plugging B ω j = 0 into the liquidity constraint for each type yields the following cutoff conditions for MC and CO firms, respectively:
z ω m * = α γ X ω 2 β λ ^ m 1
z ω n * = α γ X ω 2 β + γ λ ^ n β + γ 1
where the term λ ^ j 1 + 1 δ j δ j d t λ includes the additional cost of financing firms’ fixed cost due to the presence of credit constraints5. If credit constraints are stronger for MC firms, then fixed operating costs are also higher for MC firms λ ^ m > λ ^ n .
The relationship between the two cutoff productivities, z ω m * and z ω n * , is in principle ambiguous. However, we can derive the conditions under which the empirically-relevant scenario z ω n * < z ω m * occurs. In what follows we assume that z ω n * < z ω m * in order to replicate works such as Beck et al. (2005), who argue that firm size remains an important determinant of the level of financial obstacles, even after controlling for the quality of a country’s institutions, financial system and the overall level of economic freedom.
Assumption 1
(credit constraints). MC firms are more financially constrained than CO firms.
By comparing z ω m * to z ω n * , we can pinpoint the parameter values for which Assumption 1 holds.More specifically, CO firms face a lower cutoff productivity than MC firms when financial vulnerability is sufficiently high ( d > t ) and credit constraints are sufficiently stronger for MC firms compared to CO firms ( δ m δ n )6.
We go on to specify our assumptions on entry. Normalizing Ω to be equal to one, there is a unit mass of potential product lines. We assume that a product line is created by the M ω MC firms and the N ω CO firms associated with ω , which enter together by paying a sunk entry cost f E . Within each product line ω , all firms jointly draw the same productivity z ω from a distribution G z ω common to both CO and MC firms. Next, all CO and MC firms choose their output simultaneously. Due to the presence of fixed operating costs, there exist two cutoff productivities z ω j * where j = m , n given by Equations (6) and (7) below, in which type-j firms do not enter and therefore exit. Exit also takes place simultaneously for all type-j firms producing the same ω . Under Assumption 1, z ω n * < z ω m * and so we can simplify our notation as follows:
M ω = M z ω z ω m * and M ω = 0 z ω < z ω m *
where the mass of MC firms per product line M is pinned down by free entry and:
N ω = N z ω z ω n * and N ω = 0 z ω < z ω n *
where the number of CO firms N is exogenous7. Consequently, in our setup, each product line is produced by a total mass of K ω = N + M firms of which N are CO and M are MC firms, if it corresponds to z ω [ z ω m * , ) , or just by K ω = N firms, where all N are CO firms, if it corresponds to z ω [ z ω n * , z ω m * ] . Finally, K ω = 0 for product lines corresponding to z ω ( 0 , z ω n * ) .
Using (6) and (7) we can write the free entry condition that applies to MC firms, which states that the expected MC firm profit prior to entry is equal to the entry cost f E > 0 . We go on to specify a productivity distribution.
Assumption 2
(productivity distribution). The productivity distribution, common to both CO and MC firms, is Pareto with scale z ω m i n and shape k.
As a result of Assumption 2:
d G z ω = k z ω m i n z ω m i n z ω k 1
where z ω m i n can be normalized to one. The free entry condition with Pareto distribution implies that:
Φ = ϕ 1 1 z ω m * k + 2 + ϕ 2 λ ^ m 1 z ω m * k + 1 f E = 0
where ϕ 1 = 1 2 β k + 1 k + 2 and ϕ 2 = 1 β k + 1 .
We move on to calculating the equilibrium mass of the competitive fringe producing each product line. To do this, we write the free entry condition as a function of the equilibrium number of MC firms per product line M and the cutoff z ω m * which, using (6) and the definition of the aggregate output X ω , gives M:
M = 2 β γ α 2 k + 1 k + 2 β f E + 2 k + 2 2 β λ ^ m + k α β λ ^ m 2 k + 1 k + 2 β f E + 2 ( k + 2 ) β λ ^ m 1 2 β N 2 β + γ
From the above expression, we obtain that the equilibrium mass of the MC fringe is decreasing in the number of their CO competitors, the fixed entry cost and the fixed operating cost.
Regarding selection, first, from (8), using the implicit function theorem, we obtain that tougher competition implies tougher selection for MC firms. Second, writing z ω n * as follows, for a given N:
z ω n * = 1 z ω m * + 2 β λ ^ m 2 β + γ λ ^ n β + γ 1 = = α 2 β + γ 1 + N λ ^ n β + γ 1
and so z ω n * N > 0 : similarly to the MC case, higher N, which is equivalent to a more competitive CO subsector within each ω , creates more selection among CO firms.
We go on to analyze the impact of the different parameters on markups in order to calculate the pro-competitive and the selection effect.
Proposition 2
(pro-competitive and selection effects). Selection effects and pro-competitive effects move together.
Proof. 
Optimal prices can be written in terms of the cutoff productivities, and hence markups are calculated as follows:
μ ω m = 1 2 2 β λ ^ m + 1 z ω m * 1 z ω
μ ω n = β + γ 2 β + γ 2 β + γ λ ^ n β + γ + 1 z ω n * 1 z ω
Therefore, pro-competitive and selection effects move together. □
To close the model, we need to add the labor market clearing condition:
Ω n N z ω n * 1 ( 2 β + γ ) z ω 2 β λ ^ m + 1 z ω m * 1 z ω + λ ^ n + f E d G z ω + Ω m M z ω m * 1 2 β z ω 2 β λ ^ m + 1 z ω m * 1 z ω + λ ^ m + f E d G z ω + A = 1
where Ω j = 1 F ( z ω j * ) is the mass of varieties produced by type-j firms with F being the cumulative distribution function of z ω . The labor market clearing condition specifies that, in equilibrium, the total labor supply, normalized to one, should be equal to the labor demand, which is either transformed into the numeraire or used to cover the fixed and variable production cost of the firms operating in the differentiated sector, as well as their entry cost. Notice that although there is no free entry for the CO firms, they still have to pay an entry cost.
We wrap up this section by calculating the welfare in our closed economy. For this, we use the indirect utility function that corresponds to the quasi-linear upper-tier utility function:
U = I + 1 2 γ + β Ω n N + Ω m M 1 α p ¯ 2 + Ω n N + Ω m M 2 β σ p 2
In (12), p ¯ represents the average price, σ p 2 stands for the variance of prices and income I is equal to the labor income (normalized to one) plus the total CO firm profit.

3. Open Economy Model

We analyze bilateral trade between countries Home H and Foreign F that could only differ in their financial development. In particular, financial institutions expect to be repaid by firms with probability δ m H , δ n H ( 0 , 1 ) in H and with probability δ m F , δ n F ( 0 , 1 ) in F. We assume that, in order to export, there is an iceberg-type trade cost τ 1 , where τ = 1 corresponds to free trade, and there is also a fixed cost to export λ X , on which firms face credit constraints with a structure similar to the closed economy case. Trade liberalization is captured by a decrease in τ .
Focusing on H, the optimal behavior of the H-country firms in the domestic market is given by the same equations as in the closed economy, whereas their behavior in the foreign market incorporates the additional trade cost. Exactly as in the closed economy case, we obtain that CO firms charge a higher markup8 than MC firms. This is true both in the domestic and in the export market.
We proceed to compute the cutoff productivities. We find that, under Assumption 1, CO firms face a lower domestic and export cutoff productivity than MC firms. This is true when financial vulnerability is sufficiently high ( d > t ) and credit constraints are sufficiently stronger for MC firms compared to CO firms, which holds under the parametric conditions specified in the closed economy case.

3.1. Symmetric Trade

First we explore the case where H and F are characterized by the same δ ’s. When trade takes place, there are four cutoff productivities: two domestic cutoffs, z ω n * and z ω m * , and two export cutoffs, z ω n * X and z ω m * X . By Assumption 1, z ω n * < z ω m * and z ω n * X < z ω m * X . Domestic cutoffs are the same as in the closed economy scenario, given by (6) and (7). Export cutoffs z ω m * X and z ω n * X take into consideration the fixed and variable trade costs and, using (6), we can express them in terms of z ω m * .
1 z ω m * X = 1 τ 1 z ω m * + 2 β λ ^ m λ ^ X m = 1 τ ζ ω m
1 z ω n * X = 1 τ 1 z ω m * + 2 β λ ^ m 2 β + γ λ ^ X n β + γ
where ζ ω m 1 z ω m * + 2 β λ ^ m λ ^ X m . As a result, selection in the export market increases with the fixed costs to export and decreases with the domestic fixed operating costs.
Using the profit functions, we can state the free entry condition in the case of symmetric trade, which, under Pareto distribution, is an augmented version of (8). To close the model, we add the labor market clearing condition, which specifies the optimal consumption of the homogeneous A, which is traded freely and whose consumption must be positive, and is analogous to the closed economy case.

3.1.1. Selection Effect of Trade

We go on to investigate the effect of trade liberalization on domestic cutoffs z ω m * and z ω n * , in the presence of credit constraints:
Proposition 3
(selection effect of trade). A decrease in the trade cost increases cutoff productivities for MC and CO firms.
First, our model confirms the standard result of trade models with heterogeneous firms, namely that trade liberalization (captured by a reduction of τ ) increases selection. This is true for both MC and CO firms. To prove Proposition 3 we apply the implicit function theorem to the free entry condition9. We obtain that z ω m * τ < 0 and then, from (9), it is easy to see that z ω n * τ = z ω m * τ < 0 .
The intuition behind this result is that a decrease in the trade cost τ generates entry of MC firms in each product line, which creates additional competition and drives markups down. By (10) and (11), lower markups mean more selection for both MC and CO firms, which corresponds to higher cutoffs, and therefore the production of fewer product lines. The selection effect has been extensively documented in empirical trade literature (Pavcnik 2002; Trefler 2004; Bernard et al. 2007) although not all authors confirm its existence (see for example De Loecker et al. 2016). In our model it is important to notice that the selection effect of trade is of the same magnitude for the two types of firms. This is because selection operates through the extensive margin, via an increase of the MC fringe (per product line), given that the number of oligopolists (per product line) is exogenously given.
Finally, notice that, in our model, there are also “variety” gains from trade. As a matter of fact, with trade, the varieties available to consumers increase along two dimensions. For the product lines above z ω m * , varieties per product line increase due to new entry of MC firms. In addition, although due to selection, the number of product lines produced in each country decreases when the economy transitions from autarky to trade, the total number of closely substitutable product lines available to consumers (produced domestically and imported) increases, as in Melitz and Ottaviano (2008).

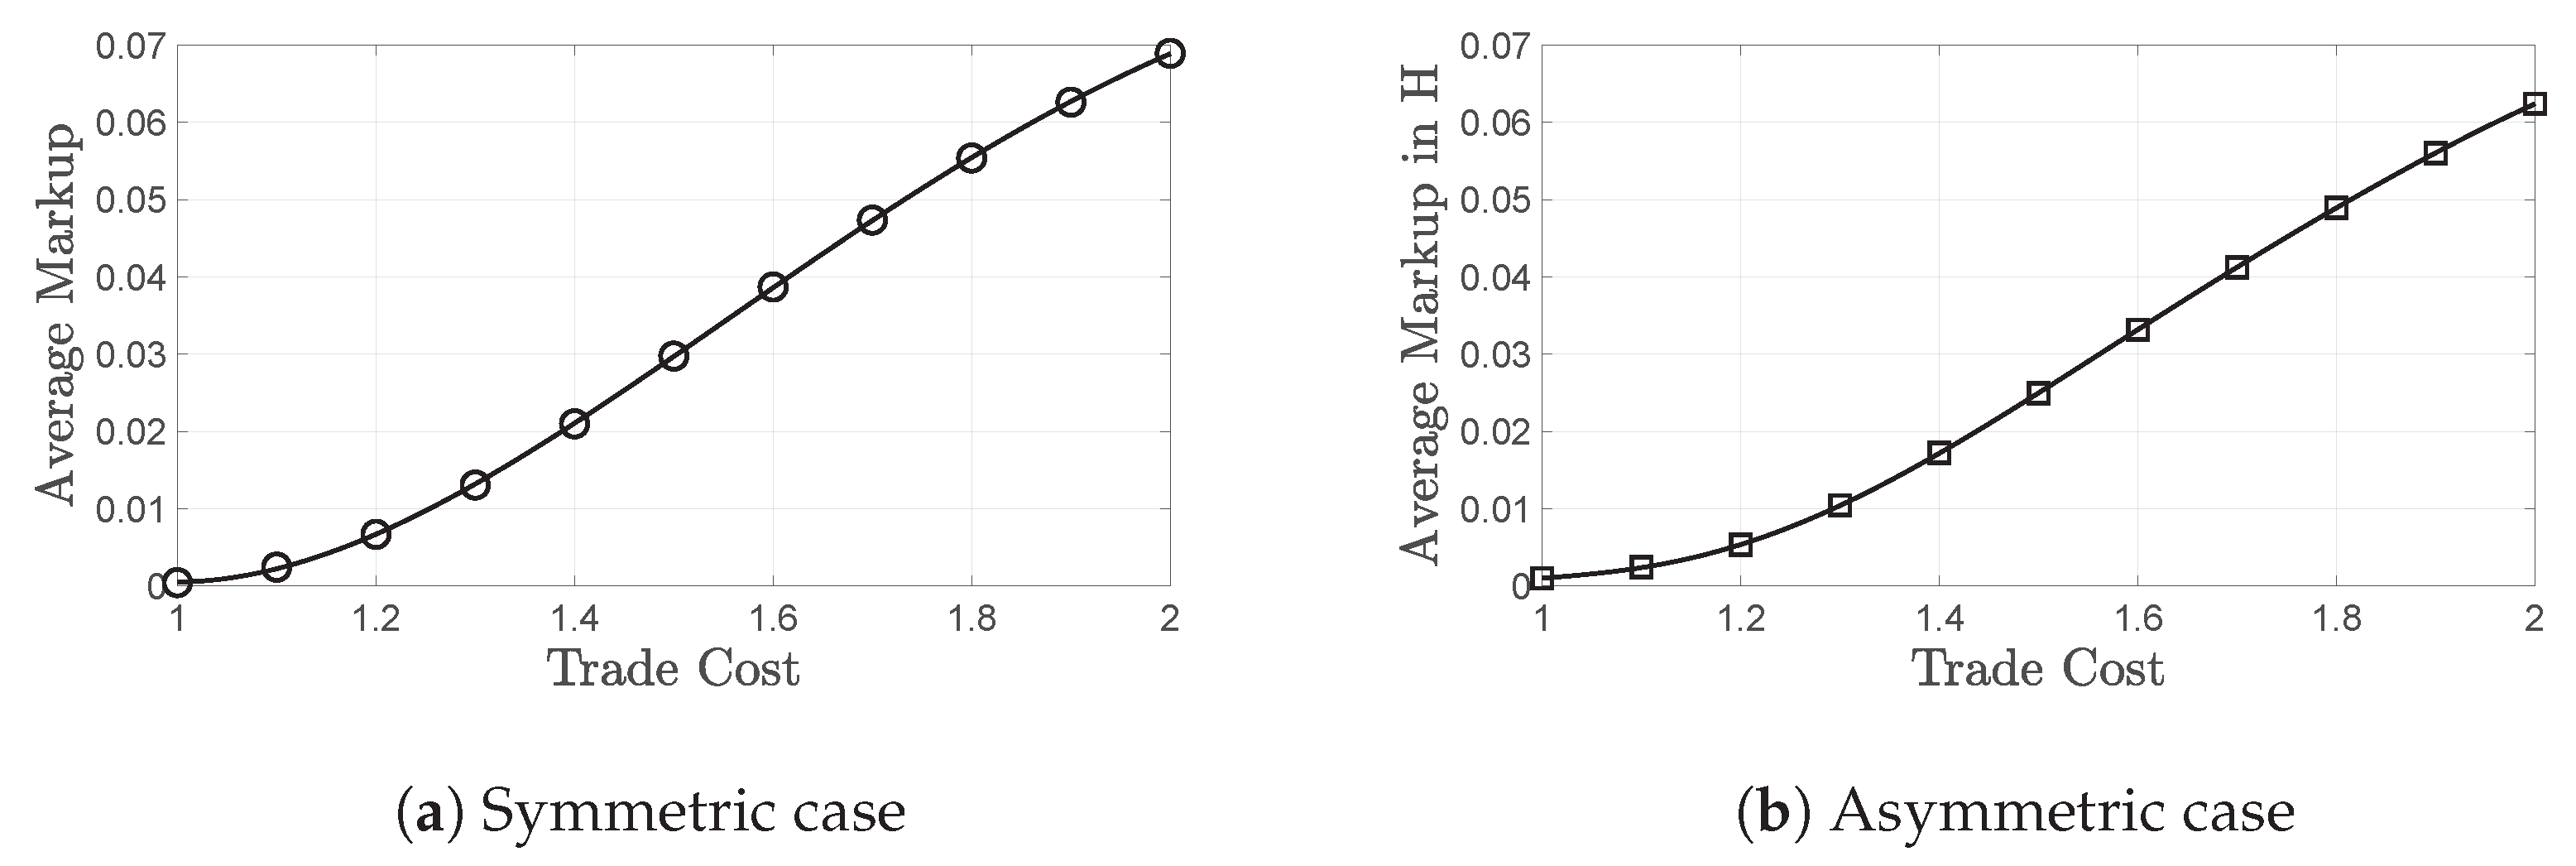
3.1.2. Pro-Competitive Effect of Trade

We can dig deeper into the effect of trade on markups, and confirm another standard result of trade literature, which is that trade liberalization strengthens competition10.
Proposition 4
(pro-competitive effect of trade). A decrease in the trade cost decreases the average markup.
The proof follows from Proposition 2. From (10), a decrease in τ drives domestic markups down and export markups up for all domestic firms. However, the decrease of the former exceeds the increase of the latter. Since the number of firms that operate domestically exceeds the number of exporters, and because entry increases the total mass of MC firms (charging a relatively lower markup) relatively to the one of CO firms (charging a relatively higher markup), the average markup in the domestic (H) market goes down.
Our model has an analytical solution, but we use a numerical exploration11 in order to illustrate the pro-competitive effect of trade in Figure 1a. More specifically, through the decrease in markups, trade liberalization drives average MC and CO profit down.

3.1.3. Selection Effect and Credit Constraints

The model also allows us to examine how the selection (and pro-competitive) effect of trade liberalization changes with the severity of financial frictions and the magnitude of fixed costs.
Proposition 5
(selection and credit constraints). The selection effect of trade is (1) increasing in the entry cost, (2) decreasing in the financial frictions faced by the MC firms and (3) unaffected by the financial frictions faced by the CO firms.
The first result occurs because higher entry costs imply less selection, high markups and low competition. In this case, trade hits the market more severely because the scope for a trade-induced increase in competition is larger ( 2 z ω m * τ f E = 2 z ω n * τ f E < 0 ). The second and third results imply that, although 2 z ω m * τ λ ^ m < 0 and 2 z ω n * τ λ ^ m < 0 , it holds that 2 z ω n * τ λ ^ n = 0 and 2 z ω m * τ λ ^ n = 0 . In other words, fewer financial frictions in the domestic market for MC firms (decrease in λ ^ m ) translate into more entry of MC firms and hence more competition and stronger selection for both MC and CO firms and, therefore, trade generates a weaker selection effect. However, a decrease in the financial frictions for CO firms (decrease in λ ^ n ) does not produce more entry and, thus, leaves the selection effect totally unaffected. Consequently, we contribute to the literature by showing that trade creates more selection for financially underdeveloped economies but, also, that financial development per se is unlikely to create significant selection in the presence of barriers to large-firm entry and large-firm creation.
Regarding the export cutoffs z ω m * X and z ω n * X , we can observe that z ω m * X τ > 0 and z ω n * X τ > 0 . The intuition behind this result is that trade liberalization makes exporting easier for both MC and CO firms, as long as, as in Melitz (2003), certain goods ω are traded domestically but are not being exported, so that the export cutoff is higher than the domestic cutoff. In other words, for firms that are already domestic producers, trade liberalization means easier exporting and hence weaker selection among exporters.

3.1.4. Selection of Small versus Large Firms

Regarding the relative cutoff Z = z ω m * z ω n * we obtain the following result.
Proposition 6
(relative selection). By inducing a weaker selection effect for MC, as opposed to CO firms, trade mitigates the misallocation resulting from preferential access to credit for the latter.
For the proof, we use (9) and obtain that, under Assumption 1, Z τ > 0 and therefore the increase in z ω n * is larger than the increase in z ω m * with a given decrease of τ 12. Therefore, our work complements the literature by showing that trade liberalization not only creates more selection for financially underdeveloped economies but it also generates weaker selection for MC firms than for CO firms, thus dampening firm-size related financial misallocation.
Proposition 6 is a corollary of the differential entry technology between MC and CO firms. In general, the selection effect occurs through entry of new firms in each product line and the decrease of markups resulting in the increase of the surviving cutoff productivity. If both subsectors were subject to a free entry condition or if neither of them was, then, as in the oligopolistic model of Baccini et al. (2019), trade liberalization would induce weaker selection for the enterprises facing weaker credit constraints. In our setup, however, where N is fixed, this result is reversed: with a decrease in τ both types of firms adjust their markups but, although M increases, N remains constant. Hence the selection effect is found to be stronger for CO firms, whose number per product line cannot be affected by globalization.
Propositions 6 and 5 are crucial for developing economies, where large firms are found to enjoy significantly more government protection, in comparison to high-income countries (Ciani et al. 2020). For these markets, where the fixed N hypothesis is actually a good approximation, big companies have an increased incentive to resort to uncompetitive practices and oppose market contestability.

3.2. Asymmetric Trade

In this part of our open economy analysis we look into the case where countries differ in their financial development13 and use this asymmetric scenario for comparison purposes to the symmetric case presented above. We can use the numerical exploration of our model14 to illustrate our main findings. We are interested in the effect of trade with a more financially developed country and assume that cross-country differences in financial constraints are more severe than cross-firm differences, since this scenario is empirically relevant. In this case the full ranking of the cutoffs is the following:
z ω n * F < z ω m * F < z ω n * H < z ω m * H
We start off by exploring the impact of globalization. As trade cost decreases, exactly as in the symmetric case, markups decrease due to a trade-induced increase in competition. The selection effect of trade occurs in both countries as cutoff productivities increase with incremental trade liberalization. In Figure 2, we show the increase in z ω m * F and z ω m * H as τ decreases from τ = 2 to free trade. All other cutoffs move accordingly, as we proved in the symmetric case, since they can be expressed in terms of z ω m * H and z ω m * F . Therefore, we obtain that trade always generates selection, regardless of the partner’s financial development: when two countries trade, a selection effect occurs in both the less and the more financially developed one. However, this effect is stronger in the more constrained economy.
Focusing on H, in Figure 1b we can observe the decrease in markups charged by firms originating from country H, as a result of trading with a more financially developed partner whose firms can afford to charge lower markups. Comparing Figure 1a to Figure 1b, we obtain that markups are lower when trade is with a less constrained economy: opening up to trade with a country with a higher number of MC firms, due to lower credit constraints, implies a stronger selection and pro-competitive effect.

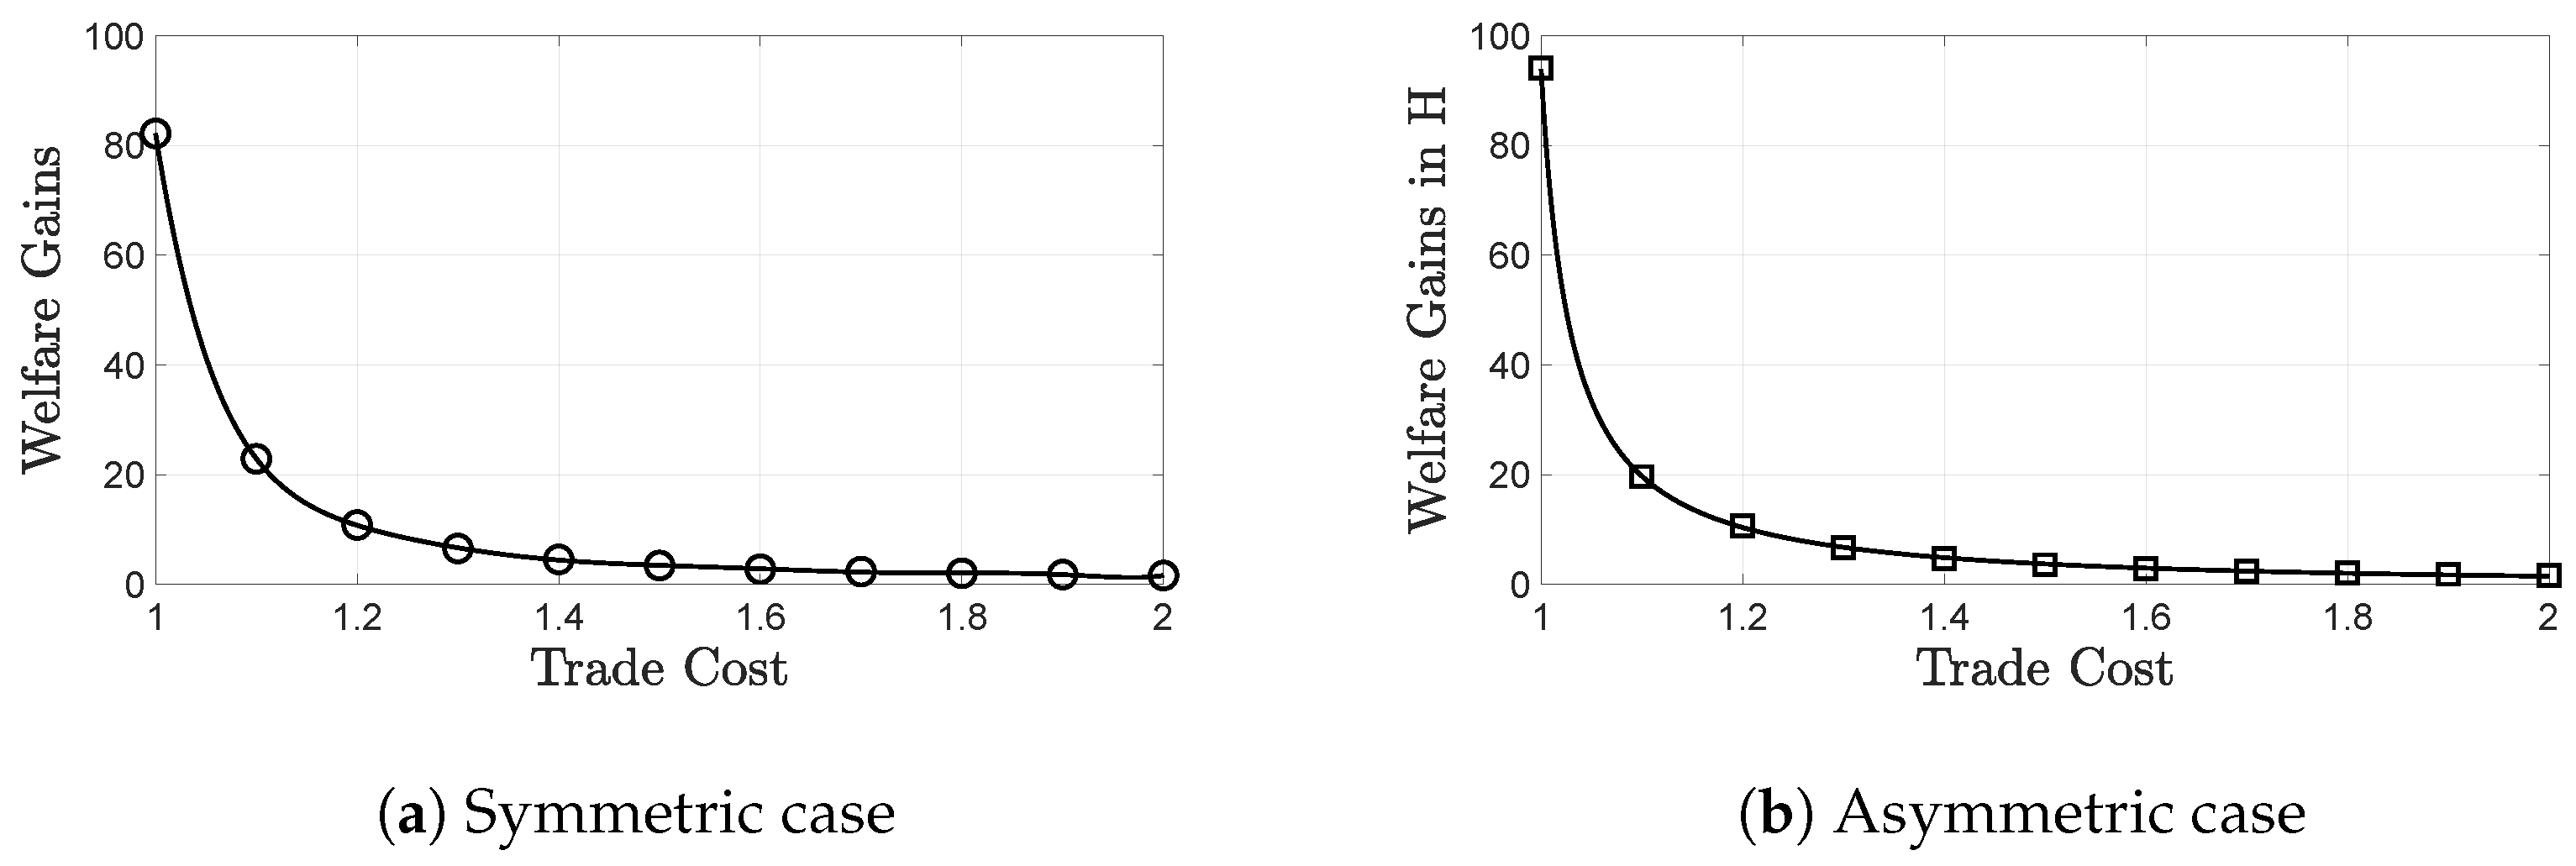
3.3. Welfare Gains from Trade

As in the closed economy case, welfare under symmetric trade can be calculated using the indirect utility function U S T . The welfare gains from (symmetric) trade W S T can be calculated by comparing U S T to its autarky analogue (12):
W S T = U S T U
In the asymmetric case, the gains from trade W A T can be calculated accordingly, by comparing welfare under asymmetric trade U A T to its autarky analogue (12):
W A T = U A T U
We find that trade raises aggregate welfare via the decrease in average markup and the increase of cutoff productivities. Given that the trade cost is below its prohibitive level, the transition from autarky to international trade creates welfare gains through tougher selection and the competition effect that tend to suppress markups and generate new entry and increase product variety. These gains increase as trade becomes cheaper with incremental trade liberalization. We use the numerical version of our model to illustrate the welfare gains from symmetric trade in Figure 3a. In Figure 3a, welfare gains are always positive, even when the trade cost τ is as high as 2. Incremental trade liberalization generates further gains and welfare is maximized when trade is free at τ = 1 .
This finding is in accordance with the main result of the so-called new trade theory, reviewed in Melitz and Redding (2014), to which we add that when trading is with a more financially developed partner, as shown in Figure 3b, the pro-competitive and selection gains from trade are always higher. This is because the foreign country’s financial conditions create a positive spillover effect: markups in country H drop more in the asymmetric case causing an increase in welfare.

3.3.1. Welfare and the Oligopolistic Inefficiency

In this part of the paper we compare the welfare gains from trade as we increase the number of oligopolists, intensifying competition within the CO subsectors. We find that welfare gains from trade are lower in more concentrated industries, with fewer operating CO firms. In our numerical example we start from N = 1 and move up to N = 10 (Figure 4a,b). Observe that, as N increases, welfare gains from trade slightly increase, and that this increase is monotonic in the number of CO firms. This result is intuitive and constitutes our first key contribution to the literature: given that N > 0 , lower N implies a more severe oligopolistic inefficiency in the presence of which the pro-competitive effect of trade is weakened. We show that, contrary to a purely oligopolistic setup such as, for example, that of Edmond et al. (2015), when large and small firms co-exist, markup distortions are more evident in markets where large firms are rare. In such markets, similarly to Vavoura (2017), the welfare boost from trade liberalization is predicted to be less significant.
This result is particularly relevant for developing economies where the scarcity of large firms, regarded as an obstacle to economic growth, is often treated as a justification for regulatory protection from competition (Ciani et al. 2020). We conclude that increasing competition, via taking measures such as lowering entry barriers, encouraging foreign direct investment and discouraging entry deterrence practices, is expected to boost gains from trade. However, note that market contestability, as measured by the trade cost, is a more important determinant of welfare compared to the presence of large firms. Hence, trade policy is found to be a more welfare-promoting measure compared to competition policy, although the two work best when combined.

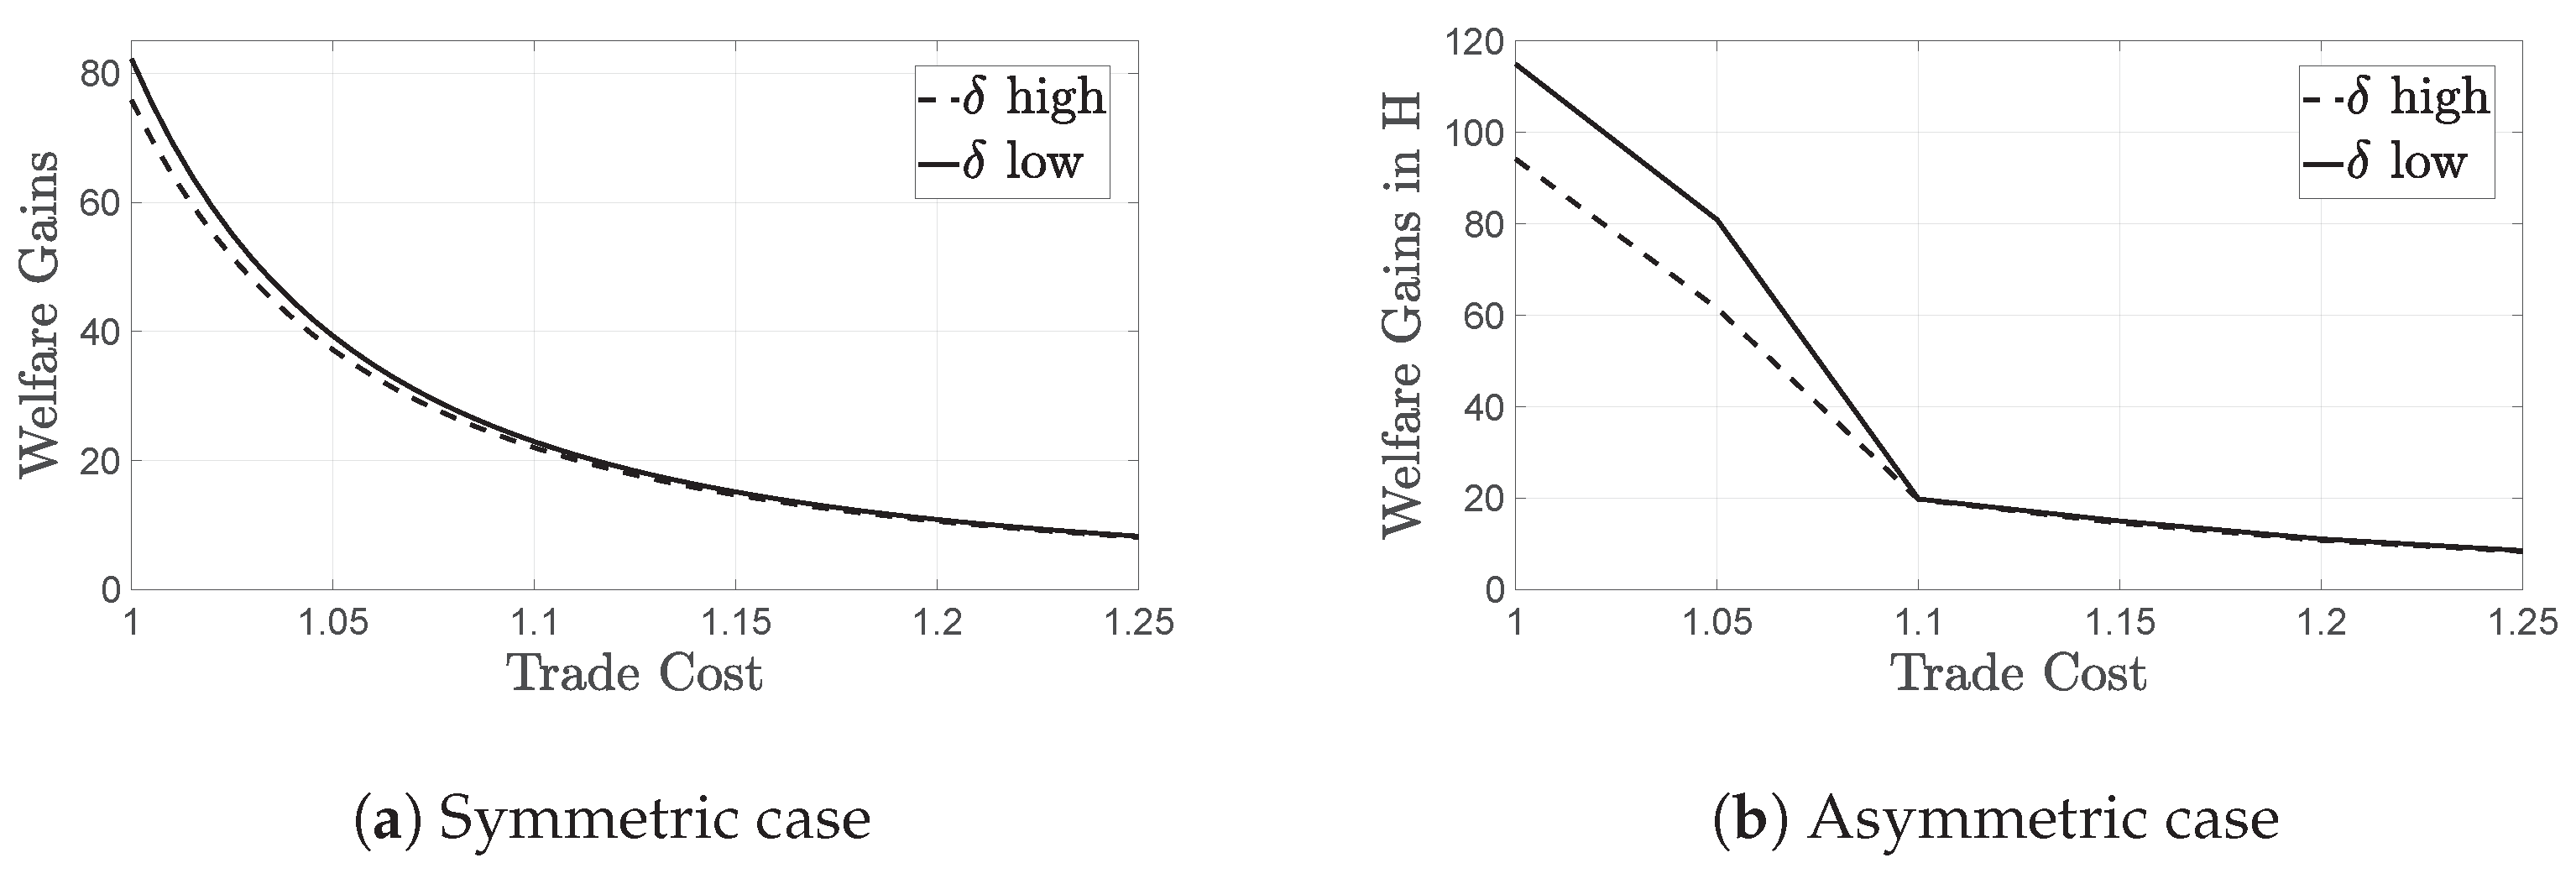
3.3.2. Welfare and Credit Constraints

We now move on to the importance of financial development in shaping the gains from trade and find that welfare gains from trade are lower in the presence of weaker credit constraints. More specifically, our second key contribution is that, when credit constraints are less severe (higher δ ’s), cutoff productivities decrease, more unproductive firms operate and inefficient product lines are being produced. This lowers welfare and welfare gains. In other words, trade benefits more the more financially constrained countries and could, at least partially, make up for financial underdevelopment.
In Figure 5a,b we perform an interesting exercise. We compare the welfare effect of a 25 percent decrease in all δ ’s to that of a 25 percent increase in the trade cost τ . We obtain that, in our framework, trade liberalization is relatively more efficient in the presence of tougher credit constraints although globalization appears to be a more important determinant of welfare compared to financial development. In the asymmetric scenario, we find that trade liberalization is more beneficial for less-developed economies and that the importance of local credit frictions is reduced more when trading with a more developed partner.
We conclude that trade openness could substitute for financial development in the sense that, when opening up to trade, less-developed economies benefit from a positive spillover from their more developed partners, namely the increased ability of foreign less-constrained firms to lower their markups.
This result is critical in the case of lower-income countries, reinforcing the widespread belief that trade is a sine qua non for economic development, and it brings to mind theoretical works, such as (Antras and Caballero 2009), highlighting the complementarity between trade and capital mobility. Our work uncovers another reason why that is true: trade dampens the impact of financial frictions and this effect becomes stronger as frictions become more substantial. Crucially, although our setup is strictly theoretical, the mechanism described in our paper is consistent with empirical evidence (Tito and Wang 2017), reporting that within-sector reallocations constitute an important misallocation-correcting channel.

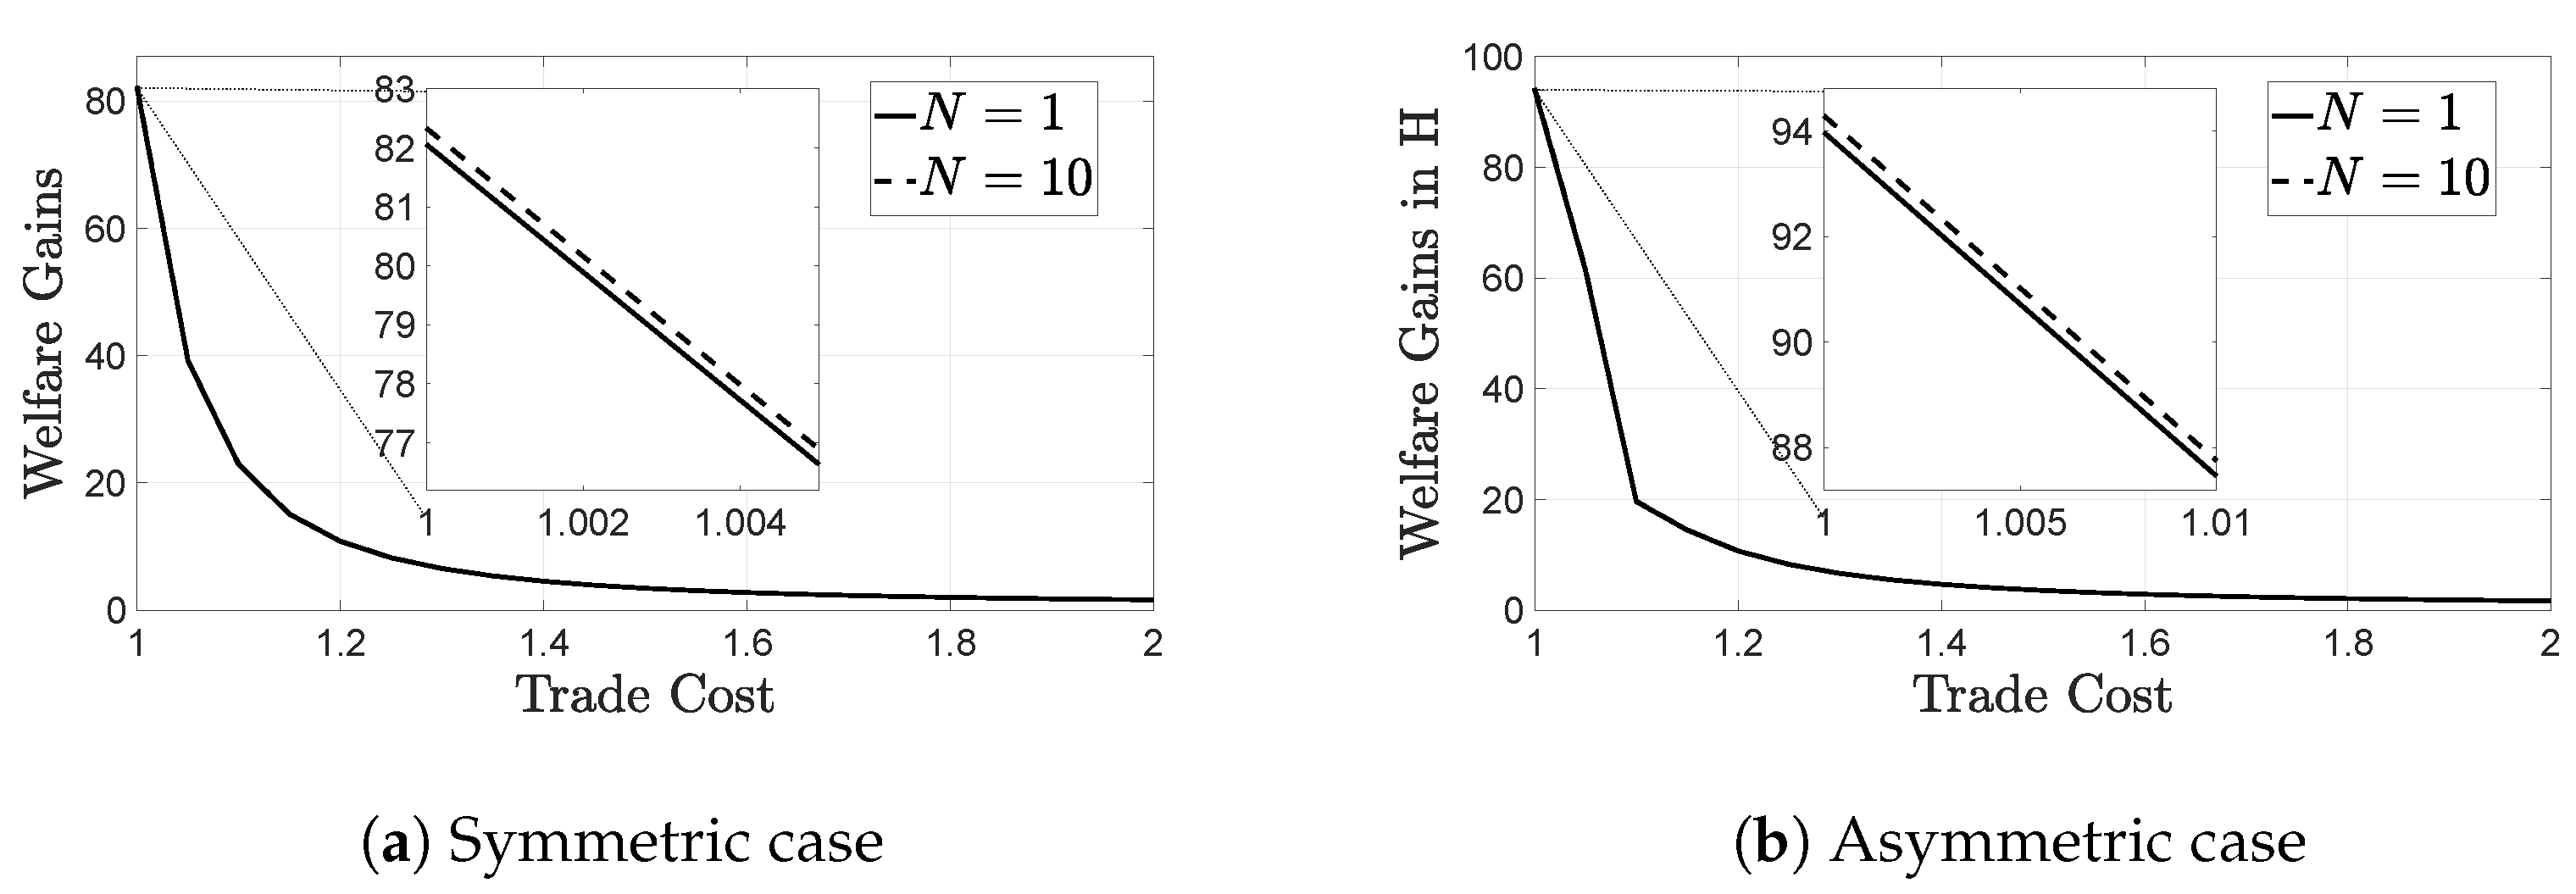
3.4. The Importance of Modeling Large Firms

In this section we illustrate the importance of taking into consideration the role of large firms. We compare our model to the standard monopolistically competitive framework of Melitz and Ottaviano (2008). To do so, we assume away the existence of an oligopolistic subsector and set N = 0 . In Figure 6, we present the welfare gains from trade with a more developed partner for our standard value of N, which is N = 2 , and compare them with the N = 0 case15. We find that gains from trade are not monotonically linked to the level of domestic markup-related inefficiencies for any N. Although, given the existence of an inefficiency ( N > 0 ), more inefficiency implies lower gains from trade, in the binary comparison of zero ( N = 0 ) versus positive ( N > 0 ) inefficiency, trade creates more gains when domestic markets are inefficient (for realistically low levels of trade cost). Hence, when trade is relatively cheap, liberalization in an economy dominated by superstar firms creates higher pro-competitive gains than it would in a purely monopolistically competitive framework. We conclude that, in the spirit of Bertoletti and Epifani (2014), pro-competitive gains from trade are systematically miscalculated in purely monopolistically competitive models that dismiss the ability of large firms to influence market aggregates.

4. Conclusions

In a model with big and small competitors, we introduce credit constraints, assumed stringent for the latter. We use our model to investigate how an economy’s financial development is affected by international trade and show that trade creates welfare gains, first, from boosting competition and productivity and, second, from limiting the impact of financial market imperfections and the credit misallocation that stems from large firms’ increased access to liquidity. Since welfare gains from trade are found to be higher under harsher domestic financial distortions, we conclude that trade benefits developing economies more, acting as a substitute for financial development.
Moreover, we show that welfare gains from trade are suppressed when markets are concentrated, with only a few operating large firms. Consequently, we deduce that encouraging large-firm entry and discouraging anti-competitive behavior are expected to act as effective complements to globalization-promoting measures.
Finally, we go on to perform a reduced-form policy comparison, based on our model economy, setting side by side the relative efficiency of policies promoting trade, competition and access to financial capital. We find that trade cost appears to be a more important determinant of aggregate welfare. Hence, our paper underlines the role of trade as a prerequisite for financial and economic development.
We trust that our results on the complementarity of trade and financial development are particularly relevant for the, often export-oriented, developing economies, which are usually characterized by severe credit market imperfections and low levels of competitive pressures, especially for large firms. In many ways, our findings echo works such as Nunn and Trefler (2014), among many others, bringing to the fore the role of trade as a force for changing weak institutions and fixing distortions and market failures that rampage through the developing world.
We also believe that our analysis of the potentially ominous role of superstar firms comes at an important time for global business and competitiveness. In the wake of the COVID-19 pandemic, largely due to credit constraints, small firms, especially but not exclusively in developing markets, find themselves on a longer and bumpier road to recovery in comparison to large establishments (Bloom et al. 2021; Cirera et al. 2021; Fairlie 2020; Bartik et al. 2020). With an impending energy crisis and small firms about to take another hit (Greve et al. 2022), we hope that our paper could be the starting point for an in-depth exploration of size-dependent policies and their potentially welfare- and competition-enhancing role.
In a different direction, future research could endogenize credit constraints in a dynamic setup and analyze the ways in which trade between developed and developing nations could not just substitute for financial development, but induce it. How will our findings change if trading economies differ, not only in their financial markets, but also in their competitiveness and productivity distribution? How can foreign direct investment and firm ownership considerations alter the results? How do the gains computed in this paper translate to economic growth? These are all issues at the heart of economic development and of uttermost importance in an era when the very value of globalization is being questioned.

Funding

This research received no external funding.

Informed Consent Statement

Not applicable.

Data Availability Statement

Not applicable.

Acknowledgments

I am grateful to Giammario Impullitti and Spiros Bougheas for their guidance and support. I also thank Peter Neary, Holger Breinlich and Paolo Epifani for their valuable comments and suggestions. Finally, I thank the participants at the European Trade Study Group (ETSG) and the European Association for Research in Industrial Economics (EARIE) conference, were earlier versions of this paper were presented, for their helpful comments.

Conflicts of Interest

The authors declare no conflict of interest.

Notes

1
Endogenizing the mass of CO firms, as in Parenti (2018), would generalize the model but without affecting its qualitative results.
2
In equilibrium, MC firms make zero profit and hence I is equal to the wage income plus the profits of the CO firms. How these profits are distributed among consumers is irrelevant in models with quasi-linear preferences.
3
We go on to show that, even with homogenous productivities, CO firms charge higher markups. Therefore, assuming a productivity advantage for CO firms would only strengthen the results of our study. See for example Vavoura (2017) for a model where large firms are more productive than their smaller counterparts.
4
There is a growing literature documenting that large firms differ from their smaller counterparts also in their borrowing sources: large firms borrow from large digitalized banks, whereas small firms find it easier to obtain a loan from small banks (Lu et al. 2022; Mkhaiber and Werner 2021). As a result, although it remains beyond the scope of this paper, the number of operating small banks constitutes an important variable that should be considered separately from our measure of financial development.
5
As a result, credit constraints differences across firms are isomorphic to any differences in fixed operational costs regardless of whether they originate from credit market imperfections or not.
6
In fact, the cutoff relationship is preserved and Assumption 1 holds as long as the ratio of probabilities δ n δ m is higher than γ 2 4 β ( β + γ ) 1 + δ n 1 d t 1 + 1 .
7
This assumption is common in oligopoly models. It implies that oligopoly rents are not eroded by entry (Neary 2016) and is supported by the empirical literature (see for example Barkai (2020) and Head and Spencer (2017)). CO firms can still choose to produce zero output in equilibrium, effectively exiting the market when they cannot make positive profits. Adding free entry for the CO firms is an interesting generalisation (see Section 3.1.4).
8
We compare the absolute markups.
9
The equilibrium condition giving the mass of MC firms M operating per product line follows:
z ω m * 1 4 β 1 + 2 M ˜ 2 α 1 + M ˜ 1 τ 1 z ω 2 λ ^ m d G z ω + z ω m * X 1 4 β 1 + 2 M ˜ 2 α τ + M ˜ 1 τ 1 z ω 2 λ ^ X m d G z ω f E = 0
where M ˜ = γ M 2 β + N 2 β + γ .
10
See Melitz and Redding (2014) for a review of the literature.
11
We use the following parameter values: α = 0.5 , β = 0.1 , γ = 8.2 , k = 3 , f E = 6 , d = 0.12 , t = 0.1 , δ m = 0.5 , δ n = 0.8 , λ = 0.3 , λ X = 0.01 , N = 2 . Given that the same results can be shown analytically, our findings are not sensitive to changes in parameter values.
12
Z = z ω m * z ω n * = M M 1 / z ω m * + 2 β λ ^ m 2 β + γ M M λ ^ n / β + γ M M 1 / z ω m * and hence Z τ > 0 since 2 β λ ^ m 2 β + γ M M λ ^ n / β + γ < 0 .
13
Analyzing trade between countries that are also asymmetric in their market size, is an interesting extension but we do not expect the results to differ from those of Melitz and Ottaviano (2008): in bigger markets, operate larger and more productive firms, both CO and MC in our case, product variety is larger and prices and markups are lower.
14
This generalized version of the model is not tractable enough to provide results analytically. To illustrate our findings, we use the same parameter values as in the symmetric case, with the additional parameters δ m F = 0.9 and δ n F = 0.95 . As shown below, our results are not sensitive to changes in parameter values of our key variables.
15
The exact same results hold in the symmetric case.

References

  1. Antras, Pol, and Ricardo J. Caballero. 2009. Trade and capital flows: A financial frictions perspective. Journal of Political Economy 117: 701–44. [Google Scholar] [CrossRef]
  2. Atkin, David, and Amit K. Khandelwal. 2020. How distortions alter the impacts of international trade in developing countries. Annual Review of Economics 12: 213–38. [Google Scholar] [CrossRef]
  3. Autor, David, David Dorn, Lawrence F. Katz, Christina Patterson, and John Van Reenen. 2020. The fall of the labor share and the rise of superstar firms. The Quarterly Journal of Economics 135: 645–709. [Google Scholar] [CrossRef] [Green Version]
  4. Baccini, Leonardo, Giammario Impullitti, and Edmund J. Malesky. 2019. Globalization and state capitalism: Assessing vietnam’s accession to the wto. Journal of International Economics 119: 75–92. [Google Scholar] [CrossRef] [Green Version]
  5. Barkai, Simcha. 2020. Declining labor and capital shares. The Journal of Finance 75: 2421–463. [Google Scholar] [CrossRef] [Green Version]
  6. Bartik, Alexander W., Marianne Bertrand, Zoe Cullen, Edward L. Glaeser, Michael Luca, and Christopher Stanton. 2020. The impact of covid-19 on small business outcomes and expectations. Proceedings of the National Academy of Sciences USA 117: 17656–666. [Google Scholar] [CrossRef]
  7. Beck, Thorsten, and Asli Demirguc-Kunt. 2006. Small and medium-size enterprises: Access to finance as a growth constraint. Journal of Banking & Finance 30: 2931–943. [Google Scholar]
  8. Beck, Thorsten, Asli Demirgüç-Kunt, and Vojislav Maksimovic. 2005. Financial and legal constraints to growth: Does firm size matter? Journal of Finance 60: 137–77. [Google Scholar] [CrossRef]
  9. Bekaert, Geert, and Campbell R. Harvey. 1995. Time-varying world market integration. The Journal of Finance 50: 403–44. [Google Scholar] [CrossRef]
  10. Bekaert, Geert, Campbell R. Harvey, Christian T. Lundblad, and Stephan Siegel. 2011. What segments equity markets? The Review of Financial Studies 24: 3841–90. [Google Scholar] [CrossRef] [Green Version]
  11. Bernard, Andrew B., J. Bradford Jensen, Stephen J. Redding, and Peter K. Schott. 2007. Firms in international trade. The Journal of Economic Perspectives 21: 105–30. [Google Scholar] [CrossRef]
  12. Bernard, Andrew B., J. Bradford Jensen, Stephen J. Redding, and Peter K. Schott. 2018. Global firms. Journal of Economic Literature 56: 565–619. [Google Scholar]
  13. Bertoletti, Paolo, and Paolo Epifani. 2014. Monopolistic competition: Ces redux? Journal of International Economics 93: 227–38. [Google Scholar] [CrossRef] [Green Version]
  14. Bloom, Nicholas, Robert S. Fletcher, and Ethan Yeh. 2021. The Impact of COVID-19 on Us Firms. Technical Report. Cambridge, MA: National Bureau of Economic Research. [Google Scholar]
  15. Bloom, Nicholas, Aprajit Mahajan, David McKenzie, and John Roberts. 2010. Why do firms in developing countries have low productivity? American Economic Review 100: 619–23. [Google Scholar] [CrossRef] [Green Version]
  16. Ciani, Andrea, Marie Caitriona Hyland, Nona Karalashvili, Jennifer L. Keller, and Trang Thu Tran. 2020. Making It Big: Why Developing Countries Need More Large Firms. Washington, DC: World Bank Publications. [Google Scholar]
  17. Cirera, Xavier, Marcio Cruz, Arti Grover, Leonardo Iacovone, Denis Medvedev, Mariana Pereira-Lopez, and Santiago Reyes. 2021. Firm Recovery during COVID-19. Washington, DC: World Bank. [Google Scholar]
  18. Cleary, Sean. 2006. International corporate investment and the relationships between financial constraint measures. Journal of Banking & Finance 30: 1559–80. [Google Scholar]
  19. De Loecker, Jan, Pinelopi K. Goldberg, Amit K. Khandelwal, and Nina Pavcnik. 2016. Prices, markups, and trade reform. Econometrica 84: 445–510. [Google Scholar] [CrossRef] [Green Version]
  20. De Loecker, Jan, and Johannes Van Biesebroeck. 2018. Effect of international competition on firm productivity and market power. In The Oxford Handbook of Productivity Analysis. Oxford: Oxford University Press, p. 463. [Google Scholar] [CrossRef]
  21. De Loecker, Jan, and Frederic Warzynski. 2012. Markups and firm-level export status. The American Economic Review 102: 2437–71. [Google Scholar] [CrossRef] [Green Version]
  22. Edmond, Chris, Virgiliu Midrigan, and Daniel Yi Xu. 2015. Competition, markups, and the gains from international trade. The American Economic Review 105: 3183–221. [Google Scholar] [CrossRef] [Green Version]
  23. Fairlie, Robert. 2020. The impact of covid-19 on small business owners: Evidence from the first three months after widespread social-distancing restrictions. Journal of Economics & Management Strategy 29: 727–40. [Google Scholar]
  24. Foley, C. Fritz, and Kalina Manova. 2015. International trade, multinational activity, and corporate finance. Annual Review of Economics 7: 119–46. [Google Scholar] [CrossRef] [Green Version]
  25. Freund, Caroline, and Martha Denisse Pierola. 2015. Export superstars. Review of Economics and Statistics 97: 1023–32. [Google Scholar] [CrossRef]
  26. Greve, Hannes, Jann Lay, and Ana Negrete. 2022. How vulnerable are small firms to energy price increases? evidence from mexico. Environment and Development Economics, 1–21. [Google Scholar] [CrossRef]
  27. Head, Keith, and Barbara J. Spencer. 2017. Oligopoly in international trade: Rise, fall and resurgence. Canadian Journal of Economics/Revue Canadienne D’économique 50: 1414–44. [Google Scholar] [CrossRef]
  28. Henderson, Brian J., Narasimhan Jegadeesh, and Michael S. Weisbach. 2006. World markets for raising new capital. Journal of Financial Economics 82: 63–101. [Google Scholar] [CrossRef] [Green Version]
  29. Hottman, Colin, Stephen J. Redding, and David E. Weinstein. 2016. Quantifying the sources of firm heterogeneity. The Quarterly Journal of Economics 131: 1291–364. [Google Scholar] [CrossRef] [Green Version]
  30. Leibovici, Fernando. 2021. Financial development and international trade. Journal of Political Economy 129: 3405–46. [Google Scholar] [CrossRef]
  31. Lu, Zhiqiang, Junjie Wu, Hongyu Li, and Duc Khuong Nguyen. 2022. Local bank, digital financial inclusion and sme financing constraints: Empirical evidence from china. Emerging Markets Finance and Trade 58: 1712–25. [Google Scholar] [CrossRef]
  32. Manova, Kalina. 2013. Credit constraints, heterogeneous firms, and international trade. Review of Economic Studies 80: 711–44. [Google Scholar] [CrossRef] [Green Version]
  33. Mayer, Thierry, and Gianmarco I. P. Ottaviano. 2008. The happy few: The internationalisation of european firms. Intereconomics 43: 135–48. [Google Scholar] [CrossRef] [Green Version]
  34. Melitz, Marc J. 2003. The impact of trade on intra-industry reallocations and aggregate industry productivity. Econometrica 71: 1695–725. [Google Scholar] [CrossRef] [Green Version]
  35. Melitz, Marc J., and Gianmarco I. P. Ottaviano. 2008. Market size, trade, and productivity. The Review of Economic Studies 75: 295–316. [Google Scholar] [CrossRef] [Green Version]
  36. Melitz, Marc J., and Stephen J. Redding. 2014. Heterogeneous firms and trade. Handbook of International Economics 4: 1–54. [Google Scholar]
  37. Mkhaiber, Achraf, and Richard A. Werner. 2021. The relationship between bank size and the propensity to lend to small firms: New empirical evidence from a large sample. Journal of International Money and Finance 110: 102281. [Google Scholar] [CrossRef]
  38. Neary, J. Peter. 2003. Globalization and market structure. Journal of the European Economic Association 1: 245–71. [Google Scholar] [CrossRef]
  39. Neary, J. Peter. 2010. Two and a half theories of trade. The World Economy 33: 1–19. [Google Scholar] [CrossRef] [Green Version]
  40. Neary, J. Peter. 2016. International trade in general oligopolistic equilibrium. Review of International Economics 24: 669–98. [Google Scholar] [CrossRef] [Green Version]
  41. Nunn, Nathan, and Daniel Trefler. 2014. Domestic institutions as a source of comparative advantage. Handbook of International Economics 4: 263–315. [Google Scholar]
  42. Parenti, Mathieu. 2018. Large and small firms in a global market: David vs. goliath. Journal of International Economics 110: 103–18. [Google Scholar] [CrossRef] [Green Version]
  43. Pavcnik, Nina. 2002. Trade liberalization, exit, and productivity improvements: Evidence from chilean plants. The Review of Economic Studies 69: 245–76. [Google Scholar] [CrossRef] [Green Version]
  44. Pietrovito, Filomena, and Alberto Franco Pozzolo. 2021. Credit constraints and exports of smes in emerging and developing countries. Small Business Economics 56: 311–32. [Google Scholar] [CrossRef]
  45. Rodríguez-Pose, Andrés, Roberto Ganau, Kristina Maslauskaite, and Monica Brezzi. 2021. Credit constraints, labor productivity, and the role of regional institutions: Evidence from manufacturing firms in europe. Journal of Regional Science 61: 299–328. [Google Scholar] [CrossRef]
  46. Rosen, Sherwin. 1981. The economics of superstars. The American Economic Review 71: 845–58. [Google Scholar]
  47. Segarra, Agustí, and Mercedes Teruel Carrizosa. 2009. Small Firms, Growth and Financial Constraints. Technical Report. Xarxa de Referència en Economia Aplicada (XREAP). Barcelona: Universitat de Barcelona. Available online: https://www.urv.cat/media/upload/arxius/catedra-innovacio-empresarial/SmallFirmsGrowth.pdf (accessed on 2 August 2022).
  48. Shimomura, Ken-Ichi, and Jacques-François Thisse. 2012. Competition among the big and the small. The Rand Journal of Economics 43: 329–47. [Google Scholar] [CrossRef] [Green Version]
  49. Singh, Prakash, and Charanjit Kaur. 2021. Factors determining financial constraint of smes: A study of unorganized manufacturing enterprises in india. Journal of Small Business & Entrepreneurship 33: 269–87. [Google Scholar]
  50. Tito, Maria, and Ruoying Wang. 2017. Exporting and Frictions in Input Markets: Evidence from Chinese Data. Finance and Economics Discussion Series 2017-077. SSRN 3016790. Washington, DC: Board of Governors of the Federal Reserve System. [Google Scholar] [CrossRef]
  51. Trefler, Daniel. 2004. The long and short of the canada-us free trade agreement. American Economic Review 94: 870–95. [Google Scholar] [CrossRef]
  52. Vavoura, Chara. 2017. Liberalising Trade in the Shadow of Superstar Firms. Helsinki: Centre for research on Globalisation and Economic Policy (GEP), University of Nottingham, European Trade Study Group. Available online: http://www.etsg.org/ETSG2016/Papers/199.pdf (accessed on 2 August 2022).
Figure 1. The average markup drops as trade cost decreases, implying the existence of a pro-competitive effect of trade. This result is true both for symmetric (a) and asymmetric (b) trade. However, when trade is with a more, as opposed to an equally, financially developed partner, markups are always lower, since the curve displayed on (b) is below the line on (a), for all levels of trade cost.
Economies 10 00266 g001
Figure 2. Trade always creates selection, regardless of the partner’s financial development. When two countries trade, a selection effect occurs in both the less financially developed Home (a) and the more developed Foreign (b), because cutoff productivities increase with the decrease of the trade cost. However, trade-induced selection is stronger in the more constrained economy, given that the curve on (a) is below the one on (b), for all levels of trade cost.
Economies 10 00266 g002
Figure 3. Trade generates welfare gains that increase with incremental trade liberalization and are maximized when trade is free at τ = 1 . When trading with a more financially developed partner (b), higher gains are created in comparison to the symmetric case (a), since the curve on (a) is below the one on (b) for any trade cost.
Economies 10 00266 g003
Figure 4. Welfare gains from trade increase monotonically with the number of large firms N > 0 . When trade is with a less financially constrained partner (b), welfare gains are always higher in comparison to the symmetric case (a). Additionally, notice that a decrease in the trade cost τ boosts welfare more than facilitating competition (increase in N).
Economies 10 00266 g004
Figure 5. Trade creates higher welfare gains for more financially constrained economies and, hence, could partly substitute for financial development. This result is even more pronounced when trade occurs with a less-constrained partner (b), in comparison to the symmetric case (a). Additionally, notice that globalization (reduction of τ ) creates a larger increase in gains, compared to financial development (reduction of the δ ’s).
Economies 10 00266 g005
Figure 6. Welfare gains from trade with a more developed partner are different in the presence of explicitly modeled large firms ( N = 2 ), than in their absence ( N = 0 ). Hence, gains from trade are systematically miscalculated in standard purely monopolistically competitive models that dismiss the ability of large firms to influence market aggregates.
Economies 10 00266 g006
Publisher’s Note: MDPI stays neutral with regard to jurisdictional claims in published maps and institutional affiliations.

