1. Introduction
On 4 November 2016, the Paris Climate Agreement came into force with formal approval from 191 countries and was adopted by 197 countries. This agreement includes the promise to support the financial movements toward a sustainable economy with efficient resources and fewer carbon emissions. A sustainable economy cannot be achieved without sustainable finance, which considers environmental, social, and governance (ESG) factors in the funding process and decision-making. The environmental factor aims to mitigate and adapt the climate change’s outcomes on the environment, such as preventing pollution and preserving humanity and living beings. The social factor includes investing in human capital, enhancing human rights, and guaranteeing justice for all. The governance factor refers to the structure of the management, the relations between employees, and the fair compensation for all parties.
Banks play a vital role in being the leading financial performers in any economy and are considered a mirror of all other sectors. They provide secure bank accounts and large amounts of capital to different businesses and organisations. Banks are vital in any country as they are considered a virtual channel through which total investments increase. The genuine progress of the banking sector’s actions enhances economic activities and growth. This progress happens through encouraging saving and mobilising public savings, then a massive amount of cash flows to fund the expansion of different industries. Accordingly, when the banking sector performs well, the whole economy, in turn, will succeed. Although banks are solid and well-capitalised financial organisations, they are not protected from the effects of social and climate changes.
Moreover, banks are vulnerable to variations in creditors and depositors’ demands and risk losing assets because of weather events. Therefore, banks started adopting sustainability concepts in their operations to prepare themselves for both expected and unexpected changes. These concepts contain mechanisms that track climate hazards and plans that promote community engagement. As the world witnessed in 2020 in the COVID-19 era, fundamental challenges in both global and domestic economies forced all firms and banks to reconsider their business strategies and roles in their societies. The Saudi government and SAMA played a critical role in minimising the results of this pandemic on the banking sector and all other sectors.
Saudi banks’ sustainability programs were recognised as essential tools for supporting economic recovery. Hence, Saudi sustainable banks with high ESG scores were robust during the COVID-19 period. The ESG outline guides the investment decisions to consider the effect of these decisions not only on the expected returns but also the impact of these decisions on the environment, social, and governance issues. Even though the ESG rating systems and the ESG-focused stock indexes of Saudi Arabia have become popular, banks can be the leader of ESG principles by focusing more on stakeholder desires and applying these principles as priorities.
As mentioned in the KPMG report from 2021, the investment company “Kamco” stated that the GCC’s banking sector profits recorded a 40 per cent surge to hit $35 billion in 2021, but the gains remained below the prepandemic levels of $37 billion in 2019. Finally, S&P Global Ratings stated that the Saudi Arabian banking system appeared to be the strongest among the GCC banking sectors in the current environment and that Saudi banks are better-placed thanks to more robust profitability.
In examining the impact of ESG factors on firms, several researchers have used many statistical models, such as regression and EGARCH models. Yet, scholars infrequently build prediction models using machine learning techniques for structuring a robust system to predict Saudi sustainable banks. Finally, these advanced prediction models become very important because of the ability to determine the best parameters that can be used for the future forecast (
Assous (
2022) and
Al-Najjar (
2022a)). In
Assous (
2022), the researcher examined Saudi banks’ efficiency using feature selection and different machine learning models. Furthermore,
Al-Najjar (
2022a) applied artificial neural networks to investigate the comovement between the Saudi stock market and emerging and international stock markets. Some scholars have used control variables for investigating the effect of ESG on volatility (
Broadstock et al. 2021;
Capelli et al. 2021;
Eratalay and Cortés Ángel 2022). In addition, researchers have applied different definitions of volatility. In
Eratalay and Cortés Ángel (
2022), the researchers applied systematic risk to measure the volatility, while in
Capelli et al. (
2021), they focused on forecasting the volatility by integrating financial risk with environmental, social, and governance risk. Furthermore, ESG calculations vary from paper to paper, as a few researchers have concentrated on the overall scores, while others have focused on each score individually (
Engelhardt et al. 2021;
Hoepner et al. 2019;
Merckoll and Kvarberg 2021).
This study brings the following contributions to fill the gap from previous studies. First, the current research emphasises testing the impact of ESG scores of Saudi banks on stock return volatility. Second, the independent variables of ESG scores are Saudi banks’ E, S, and G scores. Moreover, the main control variables are ROA, ROE, and EPS for Saudi banks from 2012 to 2020. Third, the author uses a regression analysis, the GLE algorithm, and a neural network model to construct prediction models for Saudi banks’ stock return volatility and then specify the greatest significant input variables for predicting volatility. Fourth, in this study, fundamental research investigated the impact of ESG factors on many financial markets, sectors, and institutions. The regression analysis shows that year and E scores significantly positively affect Saudi banks’ stock return volatility. However, the S score and ROA significantly negatively impact the volatility.
GLE algorithm and neural network models are run to enhance the findings of the regression model. The GLE model results show that the rank of the significant factors is as follows: S score, ROA, E score, then G score. However, the neural network findings rank the factors from most to least as ROA, ROE, and EPS, then, the E score, S score, and G score factors all have the same minor importance in predicting the stock return volatility. This paper has seven sections; in the second section, the literature review is discussed. In the third section, the data and methodology are described. The fourth section discusses the analysis of the data. In section five, the conclusions of the investigation are addressed. Lastly, in
Section 6 and
Section 7, theoretical and practical implications and the limitations and future studies are explained, respectively.
2. Literature Review
Sustainable finance is the financing used to enhance economic growth by decreasing the pressure on three factors, i.e., environment, society, and governance. Moreover, it includes transparency of any risks related to the ESG factors, which could affect any economy’s financial scheme and governance practices.
Yang et al. (
2022) overall findings confirmed that environment-friendly energy, green financing, and economic growth were significant indications of a cumulative measure of sustainable actions.
2.1. ESG Scores and COVID-19
To achieve sustainability objectives, the governments guide private investment toward climate-robust and resource-efficient investments. These investments are crucial for accelerating the economy’s recovery from COVID-19. Both
Broadstock et al. (
2021) and
Danisman (
2022) examined the effect of ESG on stock return as a response to the global health pandemic. The findings showed that firms with higher ESG were more robust to COVID-19’s impacts compared to firms with lower ESG firms and that a higher ESG lowered financial risk during the crisis. Moreover, findings from
Albuquerque et al. (
2021) and
Wang et al. (
2021) revealed that higher ESG firms achieved more returns and faced less volatility than lower ESG firms during the COVID-19 period. Furthermore,
Eratalay and Cortés Ángel (
2022) examined the effect of ESG on reducing the firm’s systematic risk. Using fixed-effect and OLS methods, the findings presented that firms with high ESG scores were exposed to less frequent risk than firms with low ESG scores. They found that in the COVID-19 period, only the S score and G score significantly impacted systematic risk. In addition,
Öcal and Kamil’s (
2021) study showed that firms in broad-based indices were more affected by shocks compared to firms in Germany ESG-X, France ESG-X, and SRI-KEHATI.
Chen et al. (
2022) applied ESG factors to US airline companies in the COVID-19 era. They found that companies with better ESG scores could push their return volatility into the equilibrium situation faster than other companies with worse ESG scores. Likewise,
Singh et al. (
2021) investigated the impact of the global health pandemic on the Bombay stock exchange’s ESG index volatility using the EGARCH model. The findings exhibited that daily return and volatility have increased through the pandemic. Finally,
Yoo et al. (
2021) investigated the impact of ESG factors on stock returns and volatility through the pandemic. The results showed that an increase in ESG factors in general and E score in particular led to more returns and less volatility, especially for the nonenergy sector.
2.2. ESG Scores and Return Volatility
Many scholars investigated the effect of ESG scores on both stock return and the volatility of different institutes without considering the pandemic. Bermejo
Climent et al. (
2021) examined the impact of ESG disclosure on European corporate equity performance. Their findings showed that the volatility of return varied over time because of ESG disclosure, explaining that having unclear ratings reduced the reflection of these disclosures into corporate financials.
Moreover,
Capelli et al. (
2021) explored the reasons behind the difference between the ex-ante financial risk and ex-post volatility of financial assets and whether the risk calculations based on ESG factors could reduce this difference. They revealed that the deviation of ESG factors in the same country, sector, and year was a risk pillar that would help forecast the volatility of these assets. According to the analysis of financial risk for oil and gas firms,
Shakil’s (
2021) findings presented an adverse effect of ESG scores on total risk.
Several scholars examined the impact of either overall ESG performance or each ESG factor separately, namely the E, S, and G scores.
Merckoll and Kvarberg (
2021) analysed the effect of ESG performance on price volatility for 2010–2019 in the Nordic countries. According to their findings, the overall ESG and E scores adversely impacted the stock price volatility, but both the G and S scores did not show any effect on the volatility.
Bonaparte’s (
2021) study constructed an ESG investors’ sentiment index (ESG-ISX) that reflected four key components: governance, sustainability, environment, and ESG google search sentiment. He found that the rise of ESG-ISX increased the agreement among investors, which had a consequence on the stock market volatility.
Ouchen (
2022) found that the ESG portfolio was less turbulent than the “S&P 500” market benchmark portfolio.
Furthermore,
Górka and Kuziak (
2022) explored the dependency between ESG indices and the conventional indices’ volatilities using the GARCH models family and tail dependence coefficients. Moreover,
Reber et al. (
2021) showed that the ESG disclosure reduced idiosyncratic volatility and downside the tail risk, and that higher ESG scores decreased volatility and risk. The same outcomes were proved by
Engelhardt et al. (
2021), who found that European firms with solid ESG scores were accompanied by greater abnormal returns and less stock volatility. In addition,
Korinth and Lueg’s (
2022) findings suggested that the level of sustainability was the main factor determining the strength of ESG’s impact on the risk.
Ilhan et al. (
2019) applied a comparison study between conventional and ESG portfolios; the results found that firms with low ESG profiles reflected in high carbon emissions faced more risk.
Moreover,
Jain et al. (
2019) found that the ESG portfolio “U.S. large-cap ESG index” gave the most significant return compared to all benchmarks with an acceptable level of risk for a sample period of 5 years. However,
Anson et al. (
2020) found that sustainable investing shaped a negative alpha compared to other nonsustainable investing. Furthermore, they specified a sustainable beta factor that could screen the firms and assets managers as green or nongreen.
Based on 573 worldwide companies from 2005 to 2018,
Hoepner et al. (
2019) presented a solid practical proof that high ESG factors decreased the downside risk, especially when addressing the E score.
Garel and Petit-Romec (
2021) indicated that firms with environmental issues experienced better stock returns. Both
Engelhardt et al. (
2021) and
Korinth and Lueg (
2022) found that the S score was the primary driver of their results. However, findings from both
Bermejo Climent et al. (
2021) and
Aevoae et al. (
2022) highlighted that the G score had the most potent effect on European corporate equity performance, and
Aevoae et al. (
2022) added that it was a tool for reducing bank interconnectedness and maintaining financial stability.
2.3. ESG in Saudi Firms and Banks
Banks are the primary source of financing for all types of institutes; employing these funds correctly shapes the economy’s future. The sustainability of banks is a long-term plan that states that banking and investment procedures can gain profit by focusing on social and environmental responsibility. Banks must consider the associations between profit, social fairness, and environmental accountability. An ESG outline helps make suitable investment decisions that impact the environment, social, and governance issues besides the expected returns.
Few scholars have been interested in investigating the effect of ESG scores on the GCC in general and Saudi Arabia firms’ performance in particular (
Alam et al. 2021;
Alazzani et al. 2021;
Al-Hiyari and Kolsi 2021;
Arayssi et al. 2019;
Bamahros et al. 2022;
Umar 2021;
Vinodkumar and Alarifi 2020). In
Alam et al. (
2021), the authors examined ESG scores’ influence on banks’ technical efficiency in four GCC countries (including Saudi Arabia). They revealed that the overall ESG score positively affected bank efficiency, while the E score positively affected efficiency. However, their findings showed a positive impact on S scores only on conventional banks with no significant effect on G scores. In the same line,
Buallay (
2018) explored the effect of ESG scores of Islamic banks—listed in the Organization of Islamic Corporation Member’s Stock Exchange—on their financial performance. The results also showed mixed results, as the E score positively affected the performance while the S and G scores negatively affected the performance of the Islamic banks.
Umar (
2021) explored the impact of ESG scores on the financial performance of Islamic and conventional banks in the GCC region. The finding revealed that Islamic banks had an inferior ESG performance to their traditional counterparts and that ESG negatively impacted service sectors such as banks. Likewise,
Vinodkumar and Alarifi (
2020) investigated the ESG score for all shares listed on Tadawul. The results revealed the current sustainability landscape of KSA businesses and gave hints to managing their financial market for better investment decisions. Interestingly the findings of
El Khoury et al. (
2021) presented different significant patterns of the ESG effect on accounting performance, using a sample of various institutions in the MENAT region.
A study from
Hasan et al. (
2022) showed that the impact of the E score of Gulf banks was not significant on the market performance, while there was a negative influence on their accounting performance. Moreover,
Al-Jalahma et al. (
2020) investigated a sample of GCC banks to explore the impact of ESG scores on the banks’ performance. The results exhibited that these mentioned scores negatively affected the banks’ performance.
As seen from the several research works discussed above, the influence of ESG overall scores on the results of the companies, stock return, and volatility is still questionable as the studies showed mixed results regarding the impact of each of the ESG factors on the firms’ outcomes, stock return, and volatility. In this study, we study the effect of ESG factors and other control variables on the stock return volatility of Saudi banks.
3. Research Methodology
In this section, the author discusses the following points: data collection, data analysis, volatility prediction models and performance metrics.
3.1. Data Collection
In this paper, the researcher studied the effect of ESG indicators on the stock return volatility of Saudi banks from 2012 to 2020, using company-specific factors as control variables. The sample had the following banks: National Commercial Bank, Saudi British Banks, Saudi Investment Bank, ALinma bank, Banque Saudi Fransi, Riyad Bank, AL Rajhi Bank, Arab National Bank, Bank Al Bilad, Bank Al Jazira, and Saudi American bank. The ESG indicators were the E score, S score, and G score. The control variables for Saudi banks were ROA, ROE, growth rate, market return, closing price, and EPS. The data sources were the banks’ financial reports, Tadawul, SAMA, and the Bloomberg dataset. In this study, the volatility of banks’ stock returns was the dependent variable; the volatility proxy was the standard deviation of Saudi banks’ stock returns. The proxies of the leading independent variables and the dependent variable were as follows:
The environmental factor is the first pillar of ESG; in this factor, companies/banks should focus on corporate climate policies and compliance with environmental regulations (i.e., greenhouse gas emissions, toxic waste management), the treatment of animals, and the use of clean energy. This can also help assess the environmental risks that companies may encounter and the way these companies are handling such types of hazards. The author used the E score index published in the Bloomberg dataset in this study.
The social factor is the second pillar of ESG; in this factor, the company/bank looks at the company’s relationships with stakeholders. The banks should make all the stakeholders follow their ESG values, give part of their profits to the community, and enhance the employees’ volunteer tasks. Moreover, banks should provide healthy and safe workplace conditions (i.e., protect against sexual misconduct and pay fair wages) and not take any unethical advantage of their customers. The author used the S score index published in the Bloomberg dataset in this study.
In the governance factor, the firm applies accurate and transparent accounting procedures, tracks the integrity and variety when choosing its executive management, and is responsible to both stockholders and stakeholders. In this factor, the investors need the banks to submit guarantees that no conflict of interest may arise while choosing their senior and executive management and that no political contributions are used to get any special treatment or engage in illegal behaviour. The author used the G score index published in the Bloomberg dataset in this study.
Different methods can measure volatility; a well-known method is the standard deviation, which is the squared root of the variance. The standard deviation is a statistical measure that calculates the variation of the returns around the average stock return for a period. Thus, volatility is the annualised standard deviation that can be reported daily, weekly, monthly, or annually. Volatile stocks are riskier, and their prices are less predictable compared to less volatile stocks. The author applied the standard deviation of stock returns for Saudi banks as a volatility proxy.
3.2. Data Analysis
In the data analysis section, the linear regression model (stepwise method) was run to determine the factors of stock return volatility. The analysis used the control variables, ESG scores, and volatility for the period from 2012 to 2020 for 11 Saudi banks. According to the results, the E, S, and G scores were 6.35, 15.7, and 53.1, respectively.
As shown in
Table 1, the author applied Pearson’s correlation to specify the correlation between the dependent and independent variables. The dataset showed that stock return volatility was a dependent variable with ESG scores and control variables ROA, ROE, growth rate, market return, closing price, and EPS as independent variables. The results showed that volatility had an insignificant positive relationship with the G score and a significant positive relationship with year. However, the correlation matrix presented a significant negative association with the S score, E score, ROA, and volatility. Finally, the rest of the variables had an insignificant relationship with volatility.
Moreover, as shown in
Table 1 above, many independent variables had significant correlations with other independent variables, indicating a multicollinearity problem. The variable inflation factor (VIF) test was applied to solve this problem. The acceptance rule was that when the VIF for any variable was less than 10, the multicollinearity was low, and we kept that variable. Lastly, a linear regression model with standard multicollinear variables was built, then its results were compared with both the GLE algorithm and neural network models, as shown in the coming sections
3.3. Volatility Prediction Models
The next step was to build prediction models to calculate the predictors; this step came after running the linear regression to understand the linearity between independent variables (mainly ESG scores) and the dependent variable (volatility) (
Al-Najjar et al. 2022;
Al-Najjar and Al-Rousan 2020;
Assous et al. 2020). The prediction models were considered after an extensive study of previous work in the field to extract the most important prediction models in developing financial indicators. (
Al-Najjar 2022a;
Assous 2022;
Assous and Al-Najjar 2021). However, most researchers focused on regression analysis rather than prediction models in investigating the effect of ESG factors on different financial indicators. For brevity, only the highest accurate models were considered to develop the methodology for this research. The initial screening showed that GLE algorithms and neural networks were the most accurate models compared to other models.
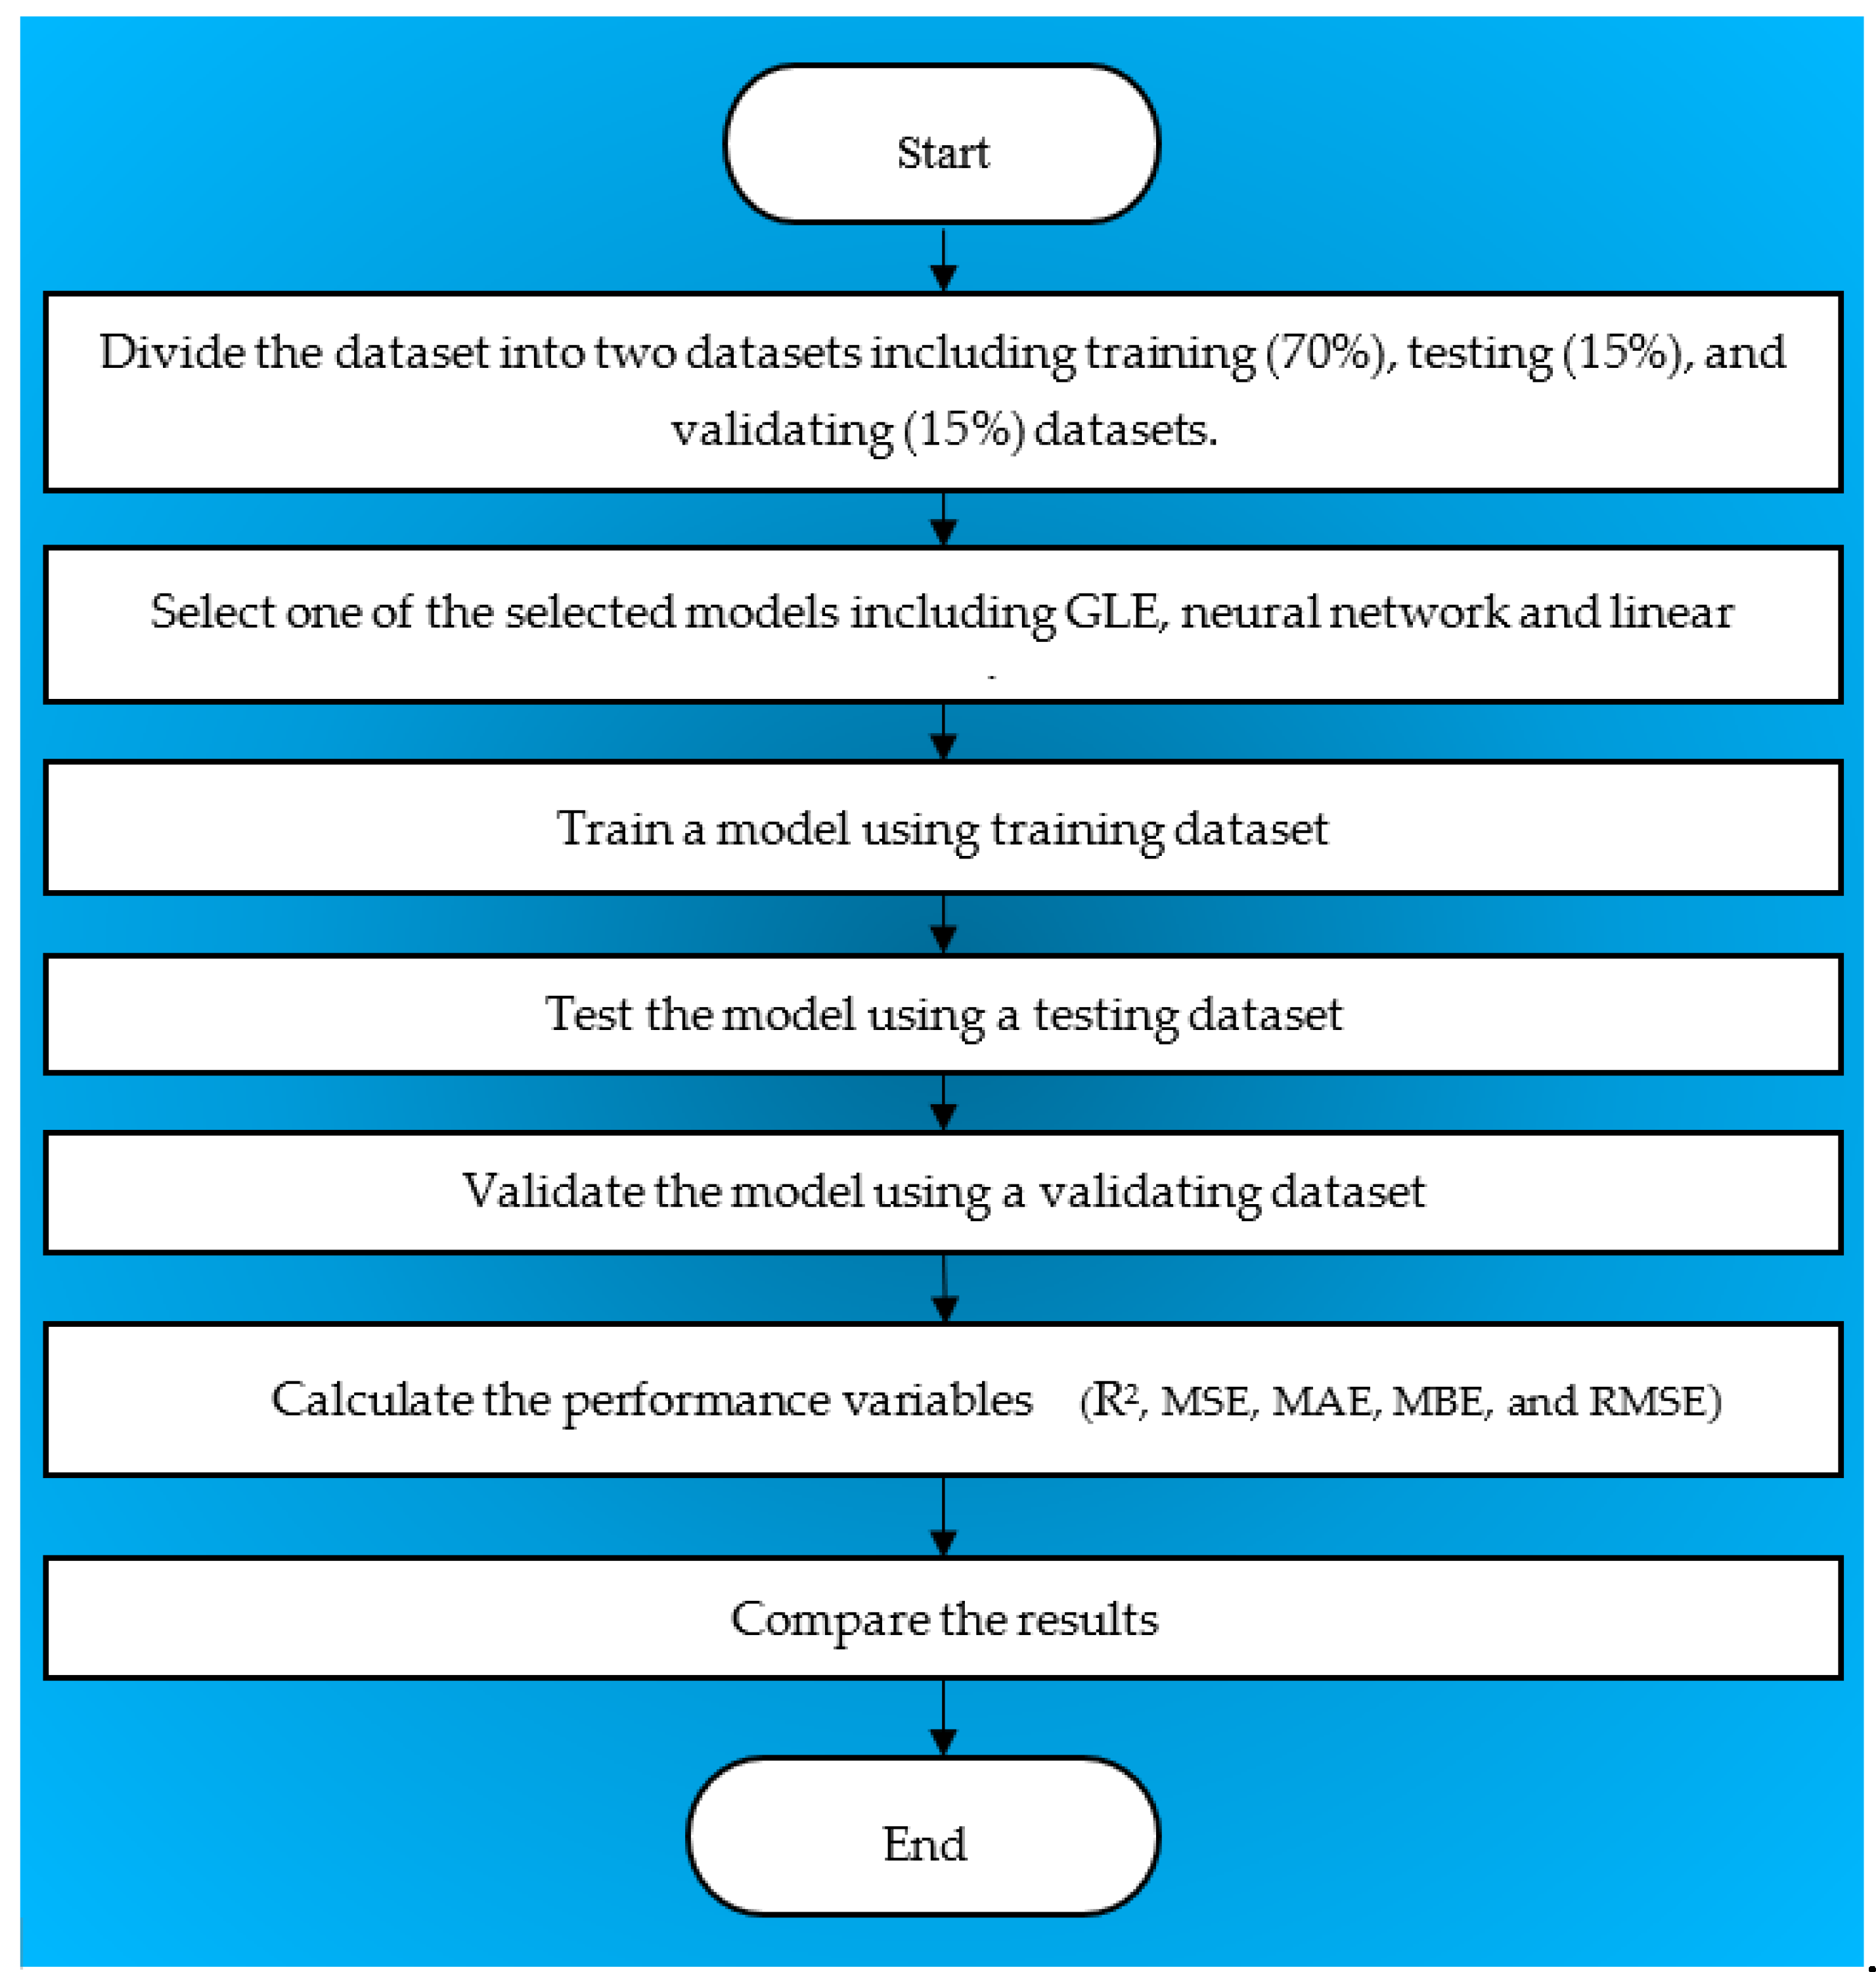
The two prediction models were GLE and neural networks. In the prediction models, the author divided the data into training, testing, and validating datasets (
AL-Najjar 2022b). The analysis started by training the data, testing, then validating them. The validation step aimed to increase the neural network model prediction’s ability for the upcoming cases and enhance the biases of the trained prediction models. Finally, the last step was sorting the input variables regarding their importance.
Figure 1 below presents the flowchart of the methodology in this study.
3.3.1. GLE Algorithm Prediction Model
Generalised linear models have been used as analytical tools for several datasets as they cover more than the commonly used statistical models (i.e., linear regression for normally distributed data, logistic, and log models) to apply several applicable statistical models through its very general model formulation. The GLE model is designed to build independent assumptions for massive and distributed data, even if the dependent variable has non-normal distribution. The GLE model identifies the dependent variable that is linearly related to the independent variables and covariates via a specified link function. As shown in
Table 2 below, specific parameters were applied to improve the ability of the GLE prediction model.
3.3.2. Neural Network Prediction Model
The neural network architecture is presented in
Figure 2; a neural network was built to enhance the investigation of stock return volatility of Saudi banks. The basic neural network model contains input, hidden, and output layers. The independent variables are forwarded to the first layer, and the dependent variable is sent to the output layer. Afterwards, the neural network uses a hidden layer to create a relationship between input and output variables.
The inputs considered when building the prediction models were the ESG indicators—the E score, S score, and G score—and the control variables, which were the ROA, ROE, growth rate, market return, closing price, and EPS.
3.4. Performance Metrics
The author used
and four error functions to evaluate the prediction models’ performance. The error functions were the MAE, MBE, MSE, and RMSE. (
Al-Najjar et al. 2021)
where
is the predicted TASI value,
is the real TASI value,
is the mean of TASI values.
M is the number of samples, while
i is the index in the dataset.
4. Analysis and Results Discussion
To determine the drivers of volatility, a linear regression analysis and two prediction models (i.e., GLE algorithm and neural network) were applied.
4.1. Results of Regression Analysis of Volatility
The author performed a linear regression analysis to specify the key factors that significantly affected return volatility.
Table 3 and
Table 4 present that the best significant model according to a stepwise analysis is model no. 4 with an adjusted R
2 and std. error equal to 48.2% and 3.655, respectively.
Table 5 above shows that the year, S score, E score, and ROA were the significant variables that affected the volatility of stock return in Saudi banks. Both year and E scores significantly positively affected Saudi banks’ stock return volatility. However, the S score and ROA significantly negatively impacted the volatility. As demonstrated in
Table 6 above, having a positive effect of the factor year on the volatility indicates that as time passes, the stock return may vary for banks, resulting in a high volatility for these returns. As with the positive effect on the E score, it is known that banks are the financial institutes with the most prominent capital to lend other parties to apply different projects with many effects on several aspects, one of which being the environmental aspect. In this aspect, the bankers should work hard to double-check that the lent money is directed to environment-friendly projects which align with climate policies, excellent energy use, and the actions of mitigating waste and pollution. This action helps borrowers and bankers evaluate and minimise their environmental risks. Moreover, the practices of each bank for enhancing the environmental practices cost extra money that may lead to additional expenses and less profit. Our results showed a surprising positive significant effect of the E score on worsening the volatility. This effect was consistent with that of
Merckoll and Kvarberg (
2021) and
Yoo et al. (
2021), who found that the E score was the best factor that reduced volatility, and
Hoepner et al. (
2019), who demonstrated that the E score was essential for building a volatility model. Furthermore,
Alam et al. (
2021) and
Buallay (
2018) exhibited a positive effect of the E score on banks’ efficiency and performance, respectively. However, this result contradicted that of
Eratalay and Cortés Ángel (
2022), who proved that the E score was an insignificant factor in Volatility.
In addition, the results showed a negative effect of the S score on volatility. The social factor focuses on the relationship between the banks and their stakeholders. As the banks should donate some of their profits to support the community and enhance employees to do volunteer work. Moreover, inside the bank, there should be a clear code of conduct and good working conditions. These ethical practices enhance banks’ social responsibilities, which increase the banks’ trust. Accordingly, investors show more interest in investing in these socially responsible institutes. This result of the negative effect of the S score on volatility is consistent with
Eratalay and Cortés Ángel (
2022),
Engelhardt et al. (
2021), and
Korinth and Lueg’s (
2022) findings that proved the significant effect of the S score on volatility.
Buallay (
2018) demonstrated an adverse impact on the performance of Islamic banks. While this result contradicts those of
Alam et al. (
2021), who found a positive influence of the S score on the efficiency of commercial banks,
Merckoll and Kvarberg (
2021) proved the S score had no significant impact on volatility.
Furthermore, the profitability of the banks, which reflects in the ROA, had a negative effect on the stock returns’ volatility. As banks are sustainable and more profitable, the investors are more confident in this investment, and higher stock returns are expected. As the earnings of the bank and the return on the stock increase, the investors face less risk, and the volatility of this stock decreases. It is important to mention that, according to our result, there is no proof of the significant impact of the G score on stock return volatility in Saudi banks. This result aligns with that of
Alam et al. (
2021) and
Merckoll and Kvarberg (
2021), with no significant effect of the G score on volatility. However,
Eratalay and Cortés Ángel (
2022),
Bermejo Climent et al. (
2021), and
Aevoae et al. (
2022) found that the G score was the primary driver of volatility. Moreover,
Buallay’s (
2018) findings showed a negative effect of the G score on the performance of Islamic banks.
Finally, as exhibited in the results and analysis above, there was a mix of effects of the influence of the ESG factors on the volatility of stock returns. Hence, the E, S, and G scores showed positive, negative, and no effect on the volatility, respectively. This mixed result of the ESG factors is consistent with several research studies (
Alam et al. 2021;
Buallay 2018;
Eratalay and Cortés Ángel 2022;
Merckoll and Kvarberg 2021). This mixed result leads to more analysis in the following sections to build prediction models (i.e., GLE algorithm and neural network models) and specify the most critical factors for predicting the stock return volatility of Saudi banks.
4.2. Results of Volatility Prediction Models
Two prediction models were used to predict the volatility and independent variables as input variables. The collected results for both models are shown in
Table 6. The training dataset showed different performance metrics using GLE and neural network models. The neural network results on the training dataset were 0.9997, 0.017, 0.098, 0.005, and 0.129 for R
2, MSE, MAE, MBE, and RMSE, respectively, whereas the GLE findings were 0.9616, 2.073, 1.192, 0.000, and 1.440 for R
2, MSE, MAE, MBE, and RMSE, respectively. The neural network results on the training dataset showed a better performance than GLE in all the tested parameters. To improve the performance of the prediction models, a validation phase was used by feeding a validation dataset to both models. The validation results of the neural network and GLE models showed similar performance for the validation dataset in prediction rate, where the error functions showed that the GLE model was more stable than the neural network. Moreover, this phase showed that the weighting functions for both models improved. A test dataset was used for both models to find the best model for future prediction. The test results showed that the neural network could predict future data with R
2, MSE, MAE, MBE, and RMSE equal to 0.9670, 6.225, 2.261, −1.813, and 2.495, respectively.
To interpret the performance of the GLE algorithm and neural network models for predicting the volatility for the three datasets, both natural and predicted values were plotted as presented in
Figure 3 below. The findings exhibited that the neural network model followed the direction of the real values compared to the GLE algorithm model. The three datasets confirmed that the neural network model was more accurate for predicting the stock return volatility than the GLE algorithm model. Moreover, the error function of the neural network model predictor was more reliable and robust than that of the GLE algorithm model.
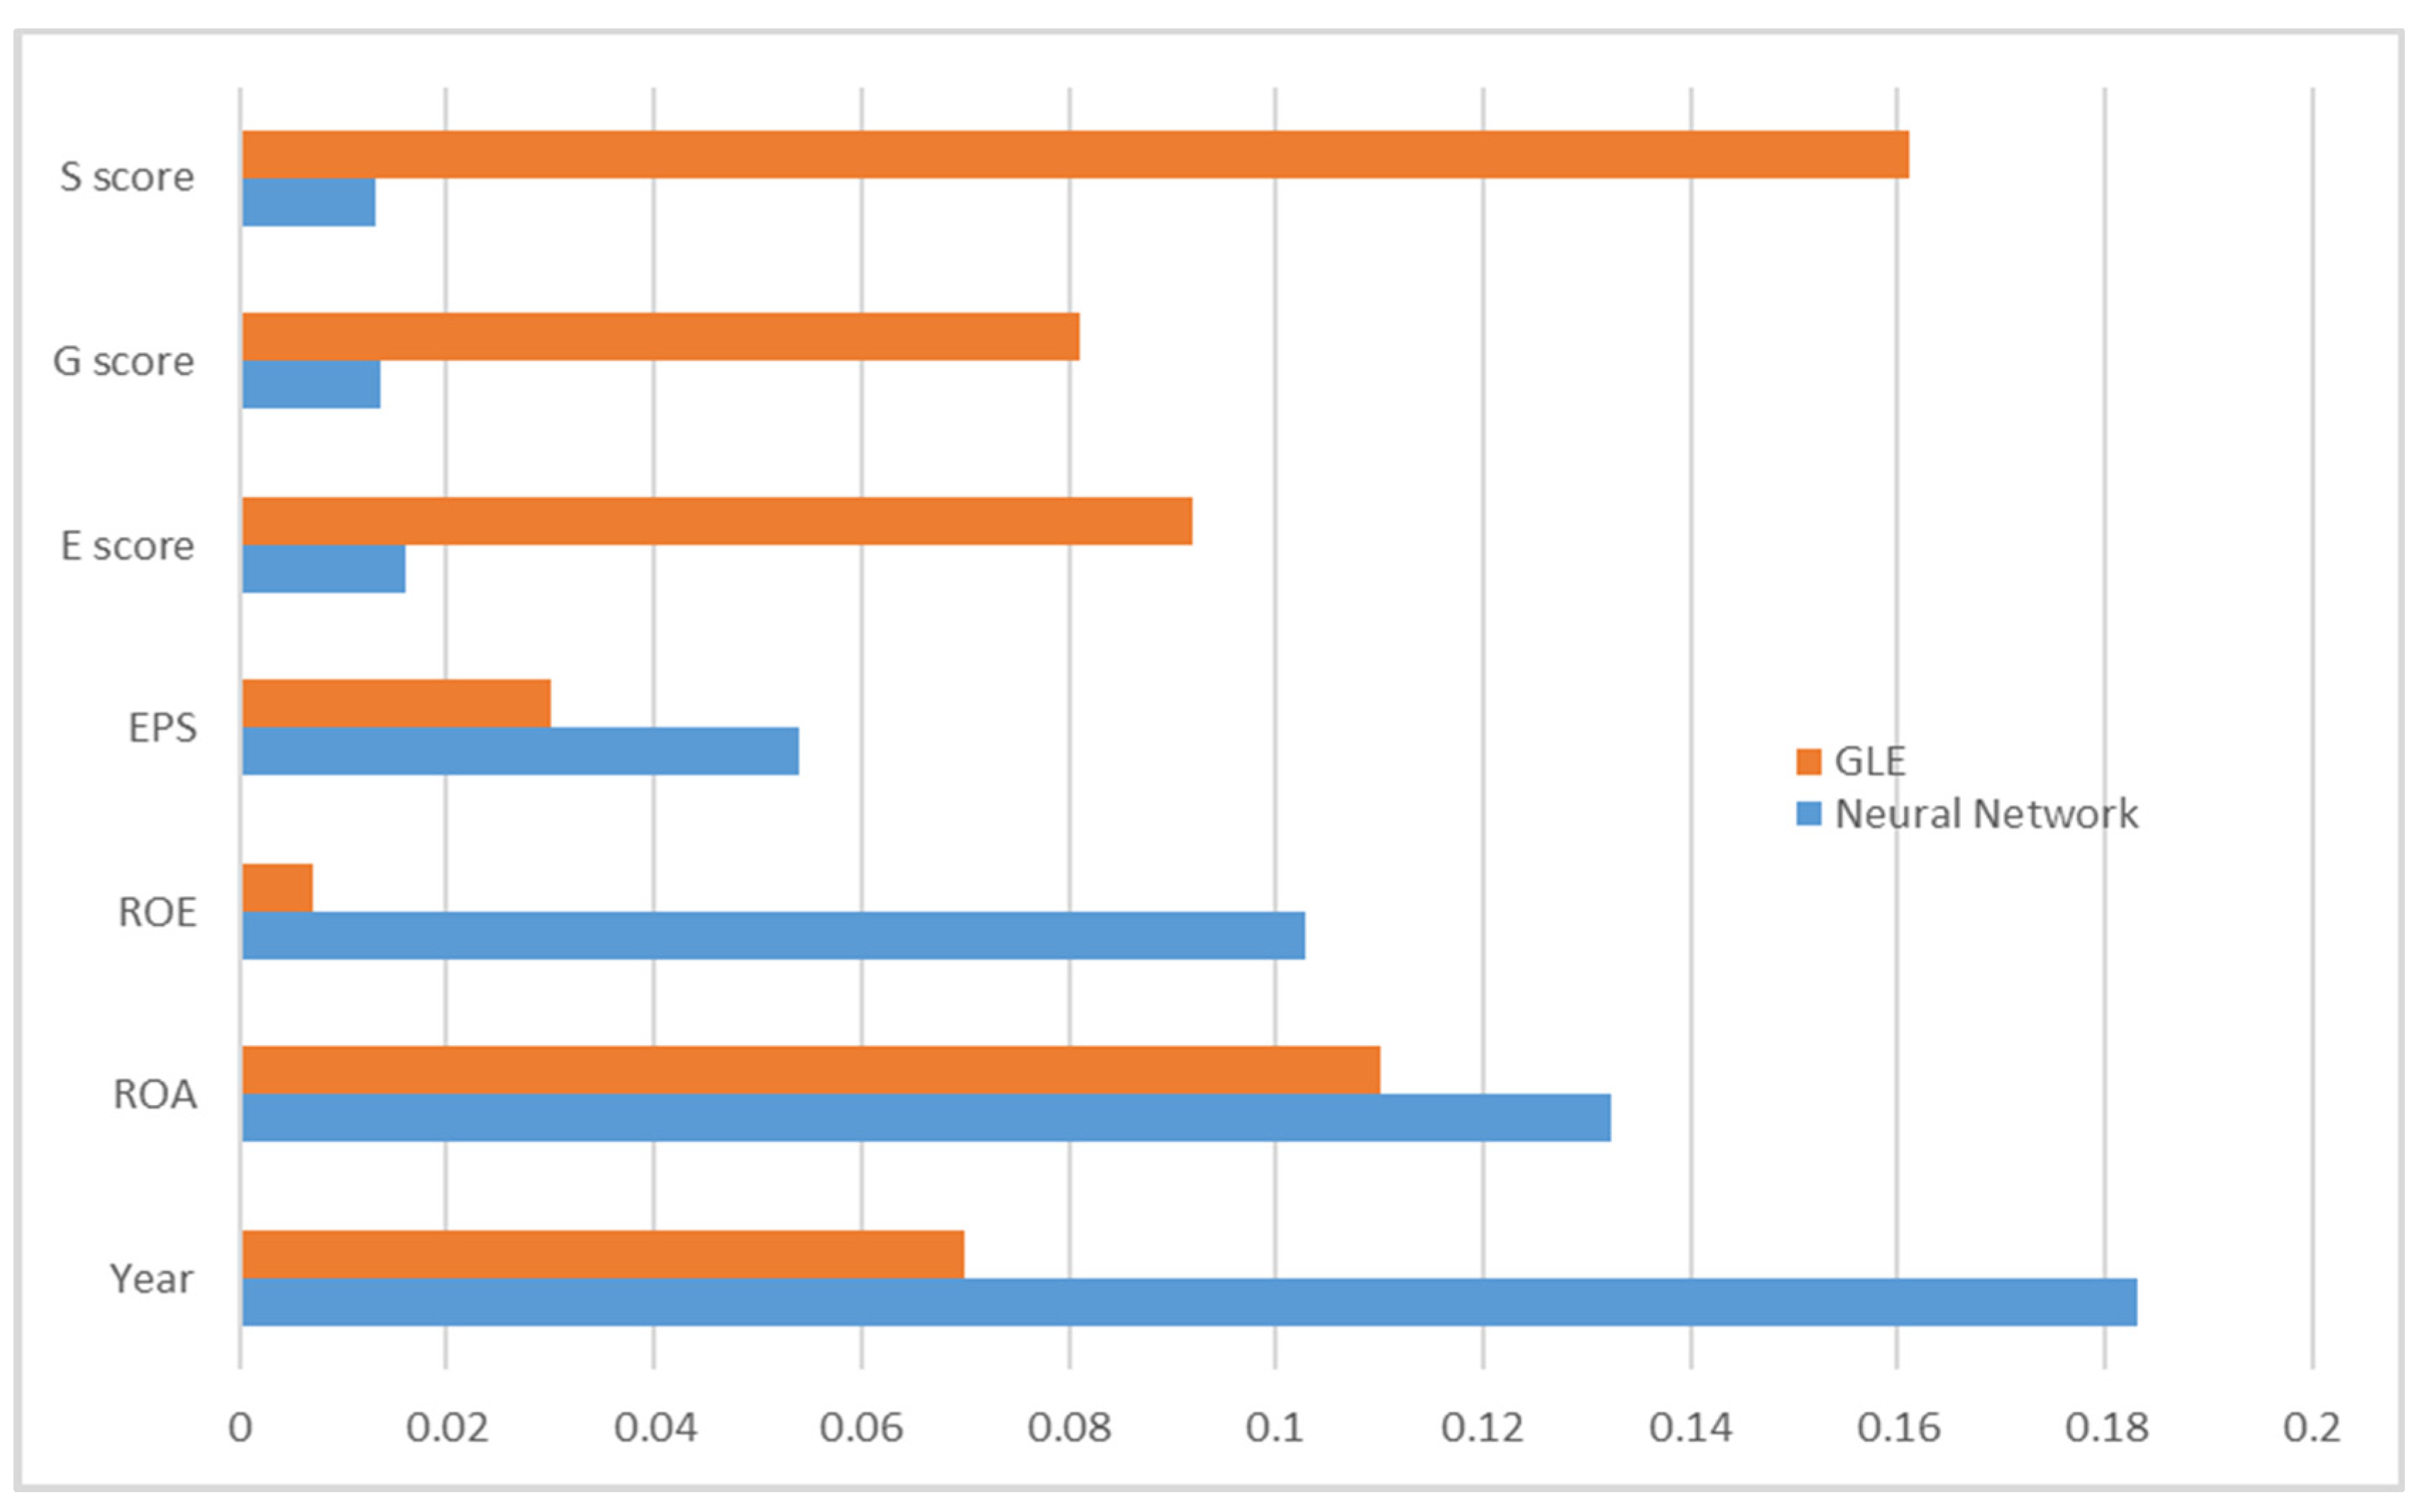
In
Figure 4 below, the importance analysis for the prediction models is presented. This analysis aimed to determine the main input variables in the prediction process. The findings of the GLE algorithm and neural network models showed that the year and EPS variables were the vital variables in the stock return volatility prediction process, as the GLE algorithm model findings revealed. Furthermore, the ROE had the lowest importance level according to the GLE algorithm model. The rest of the variables were sorted according to their importance from most to least: S score, ROA, E score, and G score. In contrast, the results of the neural network model indicated that the year and the growth rate variables were among the variables with the highest importance in the volatility prediction. The rest of the variables were sorted according to their importance from most to least: ROA, ROE, EPS, then the E score, S score, and G score factors all had similar minor importance in predicting the stock return volatility.
The findings of the input importance analysis for linear regression models and prediction models (i.e., GLE algorithms and neural network) indicated that the S score had the highest importance level in the volatility prediction. The Saudi economy is an oil-dependent economy with one of the most vital banking sectors in the GCC and MENA region. It is essential to put under the spotlight that Saudi Arabia, for years, took decisive actions and transparent steps to have socially responsible institutes, banks, and people. The social factor plays a crucial role in Saudi banks in many aspects as these banks attempt to manage their activities with integrity and hold themselves accountable to stakeholders. Saudi banks make financial decisions considering that profit is not the priority in investing and lending activities. Instead, the projects should focus on safety, and any investment or lending services should not destroy the environment. Moreover, the Saudi banks apply different social practices such as reducing waste, operating more resource-efficient, using more ethical labour practices, and donating to charitable causes to make society better for all. Furthermore, Saudi banks are always requested to enhance the cooperation between university students and banks in special training programs to minimise the gap between theoretical knowledge and practical experience.
5. Conclusions
This paper examined the effects of ESG factors on stock return volatility for the period from 2012 to 2020 using linear regression, GLE algorithm and neural network models. This paper used the ESG factors (E score, S score, and G score) and control variables (ROA, ROE, EPS, and year) as independent variables. The analysis was conducted by building a stepwise regression, GLE algorithm, and neural network models. The regression model had stock return volatility as the dependent variable, while the independent variables were ESG and control variables. The findings exhibited that the R2 for the stock return volatility model was 48.2%, with a standard error of 3.655.
According to the analysis of the regression model, both year and E scores had a significant positive effect on Saudi banks’ stock return volatility. However, the S score and ROA significantly negatively impacted the volatility. The results further indicated that the prediction models were more efficient in analysing the volatility and building an accurate prediction model using all independent variables. The results of the GLE algorithms model showed that both year and EPS variables were among the variables with the highest importance in the volatility prediction. Moreover, the ROE variable was not one of the critical variables in the prediction process. The rest of the variables were classified according to their importance from most to least: S score, ROA, E score, and G score.
In comparison, the neural network results indicated that year and growth rate variables were among the variables with the highest importance in predicting volatility. The rest of the variables were sorted according to their importance from most to least: ROA, ROE, EPS, then the E score, S score, and G score factors all had similar minor importance in predicting the stock return volatility. Linear regression and prediction models (i.e., GLE algorithms and neural network) indicated that the S score was the most important factor in the stock return volatility prediction. The findings were practically and theoretically accurate. The social element is essential in the Saudi banking sector as these banks attempt to manage their activities with integrity and hold themselves accountable to stakeholders. Moreover, the Saudi central bank puts clear guidelines and frames for the preferable practices for Saudi banks that will benefit society and are now applied by the Saudi banks. Examples of social factors are reducing waste, operating more resource-efficiently, using more ethical labour practices, and donating to charitable causes to make society better for all.
Although the regulatory bodies are responsible for building clear frames and solid regulations for the concept of social responsibility, this concept is a type of self-regulation that will result in a positive impact on the whole of society. Moreover, social responsibility is one of the vital perceptions that banks should consider, as having socially responsible banks will improve the country’s welfare and lifestyle. Finally, the Saudi government, regulatory bodies, and the Saudi banking sector are implementing good corrective actions in many aspects. They are taking clear and decisive steps toward achieving the targeted outcomes of Vision 2030.
6. Theoretical and Practical Implications
This study is theoretically and practically robust. This study aimed to investigate the impact of ESG factors and control variables on stock return volatility and build prediction models (i.e., GLE algorithm and neural network models) for the main influences to predict volatility.
Stock return volatility is a critical financial indicator linked directly and interactively with many other hands. Thus, when one indicator of ESG factors or other economic factors changes sharply, the outcomes will either worsen or improve. In this study, the author submitted further proof that the stock market return volatility reflected powerfully on the fluctuations of one of the financial drivers (i.e., ESG factors, ROA, and ROE).
Moreover, regulatory bodies can take advantage of the findings by focusing more on setting more regulations and guidelines that will enhance the practices of sustainable banks. In addition, they should encourage the banks to be environmentally and socially responsible in their society. More regulations should follow up with the borrowers and ensure their projects are environmentally and socially friendly to the community.
Furthermore, Banks’ management can benefit from our results in that banks should enhance the use of renewable energy sources, put a clear code of conduct that provide equality and fairness among employees, and seek to lower greenhouse gas emissions. Moreover, regarding the governance factor, the bank’s management can increase employee awareness by providing workshops and training courses.
These days, there are increasing numbers of investors willing to invest in stocks for a reason other than the success of the stock or the excess return. Investors will feel more confident in investing with companies that put the environment and sustainability factors as a priority. More disclosure and details are needed from banks regarding their ESG practices; the availability of this information will help investors evaluate and then compare different investments.
Finally, investors can benefit from our results since volatility as a deviation of stock return leads to a higher return. Therefore, expert and professional shareholders can take advantage of this fact by choosing a suitable time to buy/sell the stocks to gain abnormal returns with sufficient liquidity. Accordingly, stockholders, bankers, and clients assume banks should consider environmental, societal, and governance factors to minimise the effect of climate change.
7. Limitations and Further Studies
Limitations exist. The number of Saudi banks has been increasing daily, but few are currently working. The data on ESG factors were unavailable for a long period, and some data were missing during the available period. Moreover, there was a lack of previous research studies investigating the impact of Saudi ESG factors on banks’ stock return volatility. However, future research is essential to improve the findings. Forthcoming studies can employ other bank drivers to investigate the impact of the ESG factors on the banking sector’s return and volatility. More research on the effects of ESG on other sectors in Saudi Arabia and the GCC is necessary. Furthermore, a further analysis can apply prediction models—other than the two used in this paper—to examine the prediction ability of these models in predicting the stock return volatility. Further research can build a unique ESG index for Saudi firms that considers specific macroeconomic indicators (i.e., poverty rate, GDP per capita, climate change index, etc.).


