Article

Agricultural Development’s Influence on Rural Poverty Alleviation in the North Buton Regency, Indonesia—The Mediating Role of Farmer Performance

Faculty of Economics and Business, Universitas Halu Oleo, Kendari 93232, Indonesia
Economies 2022, 10(10), 240; https://doi.org/10.3390/economies10100240
Submission received: 30 April 2022 / Revised: 8 September 2022 / Accepted: 13 September 2022 / Published: 27 September 2022

Abstract

:
Low productivity and farmer business competitiveness are central issues for agricultural development and rural poverty alleviation. This study aimed to determine the influence of agricultural development on rural poverty alleviation. Data were obtained from farmers’ groups in the North Buton Regency in 2019 using questionnaires and analyzed using AMOS. The results showed that agricultural development improves farm business performance and influences rural poverty alleviation. Farm business performance leads to rural poverty alleviation. The influence of agricultural development on rural poverty alleviation was magnified when supported by improved farm enterprise performance. Therefore, agricultural development is the flagship program for poverty alleviation of rural farmers in the North Buton Regency.

1. Introduction

Poverty alleviation and income distribution disparity are fundamental problems and a primary goal of development policy (Asian Development Bank (ADB) 2012; Bappenas 2014; United Nations 2011). This is because poverty reduces the community’s quality of life and the productivity of human resources (Alkire 2007; Barro and Lee 2013). The conditions create a chain of cause and influence known as the poverty cycle (Gao et al. 2020). This cycle may continue because low-income people cannot access education, health, and adequate food (Ajayi et al. 2011; (Asian Development Bank (ADB) 2012); United Nations 2011).
Government agencies have implemented poverty reduction initiatives, but poverty in the North Buton Regency still exists. This is because the policies have not been influential enough to reduce poverty. Murdiansyah (2014) claimed that poverty reduction might be influenced by reliance on macroeconomic growth, charity, inattentiveness to the indicators, poverty characteristics, and a lack of sustainability in implementing policy centralization and uniformity.
The Statistics Central Bureau stated that the population of the North Buton Regency in 2019 was 62,197 people, of which 14.26% were poor. This causes the regency to have the highest percentage of poor people in Southeast Sulawesi Province. The statistical data showed that poverty is an acute problem. This necessitates a faster and more appropriate approach to poverty alleviation in the regency. One of the poverty reduction program strategies is rural agricultural development. Most poor people live in rural areas, with their income coming mainly from the agricultural sector and other traditional economic activities (Bappeda Buton Utara 2019).
The North Buton Regency has 6 districts, 59 villages, 8 sub-districts, and 3 transmigration settlement units. A total of 62,088 people mostly work as subsistence farmers in the food crops, plantations, and traditional fishing sub-sectors. Potential resources for non-irrigated rice fields, gardens, and fields are 2332 ha, 15,279 ha, and 14,894 ha, respectively, while 10,321 ha are uncultivated (Bappeda Buton Utara 2019). Moreover, the agricultural land is fertile, and the work ethic of farmers is high. Based on data related to the potential of agricultural resources and most of the population living as farmers, agricultural development is necessary to increase its production and farmers’ income, as well as lift the population out of poverty.
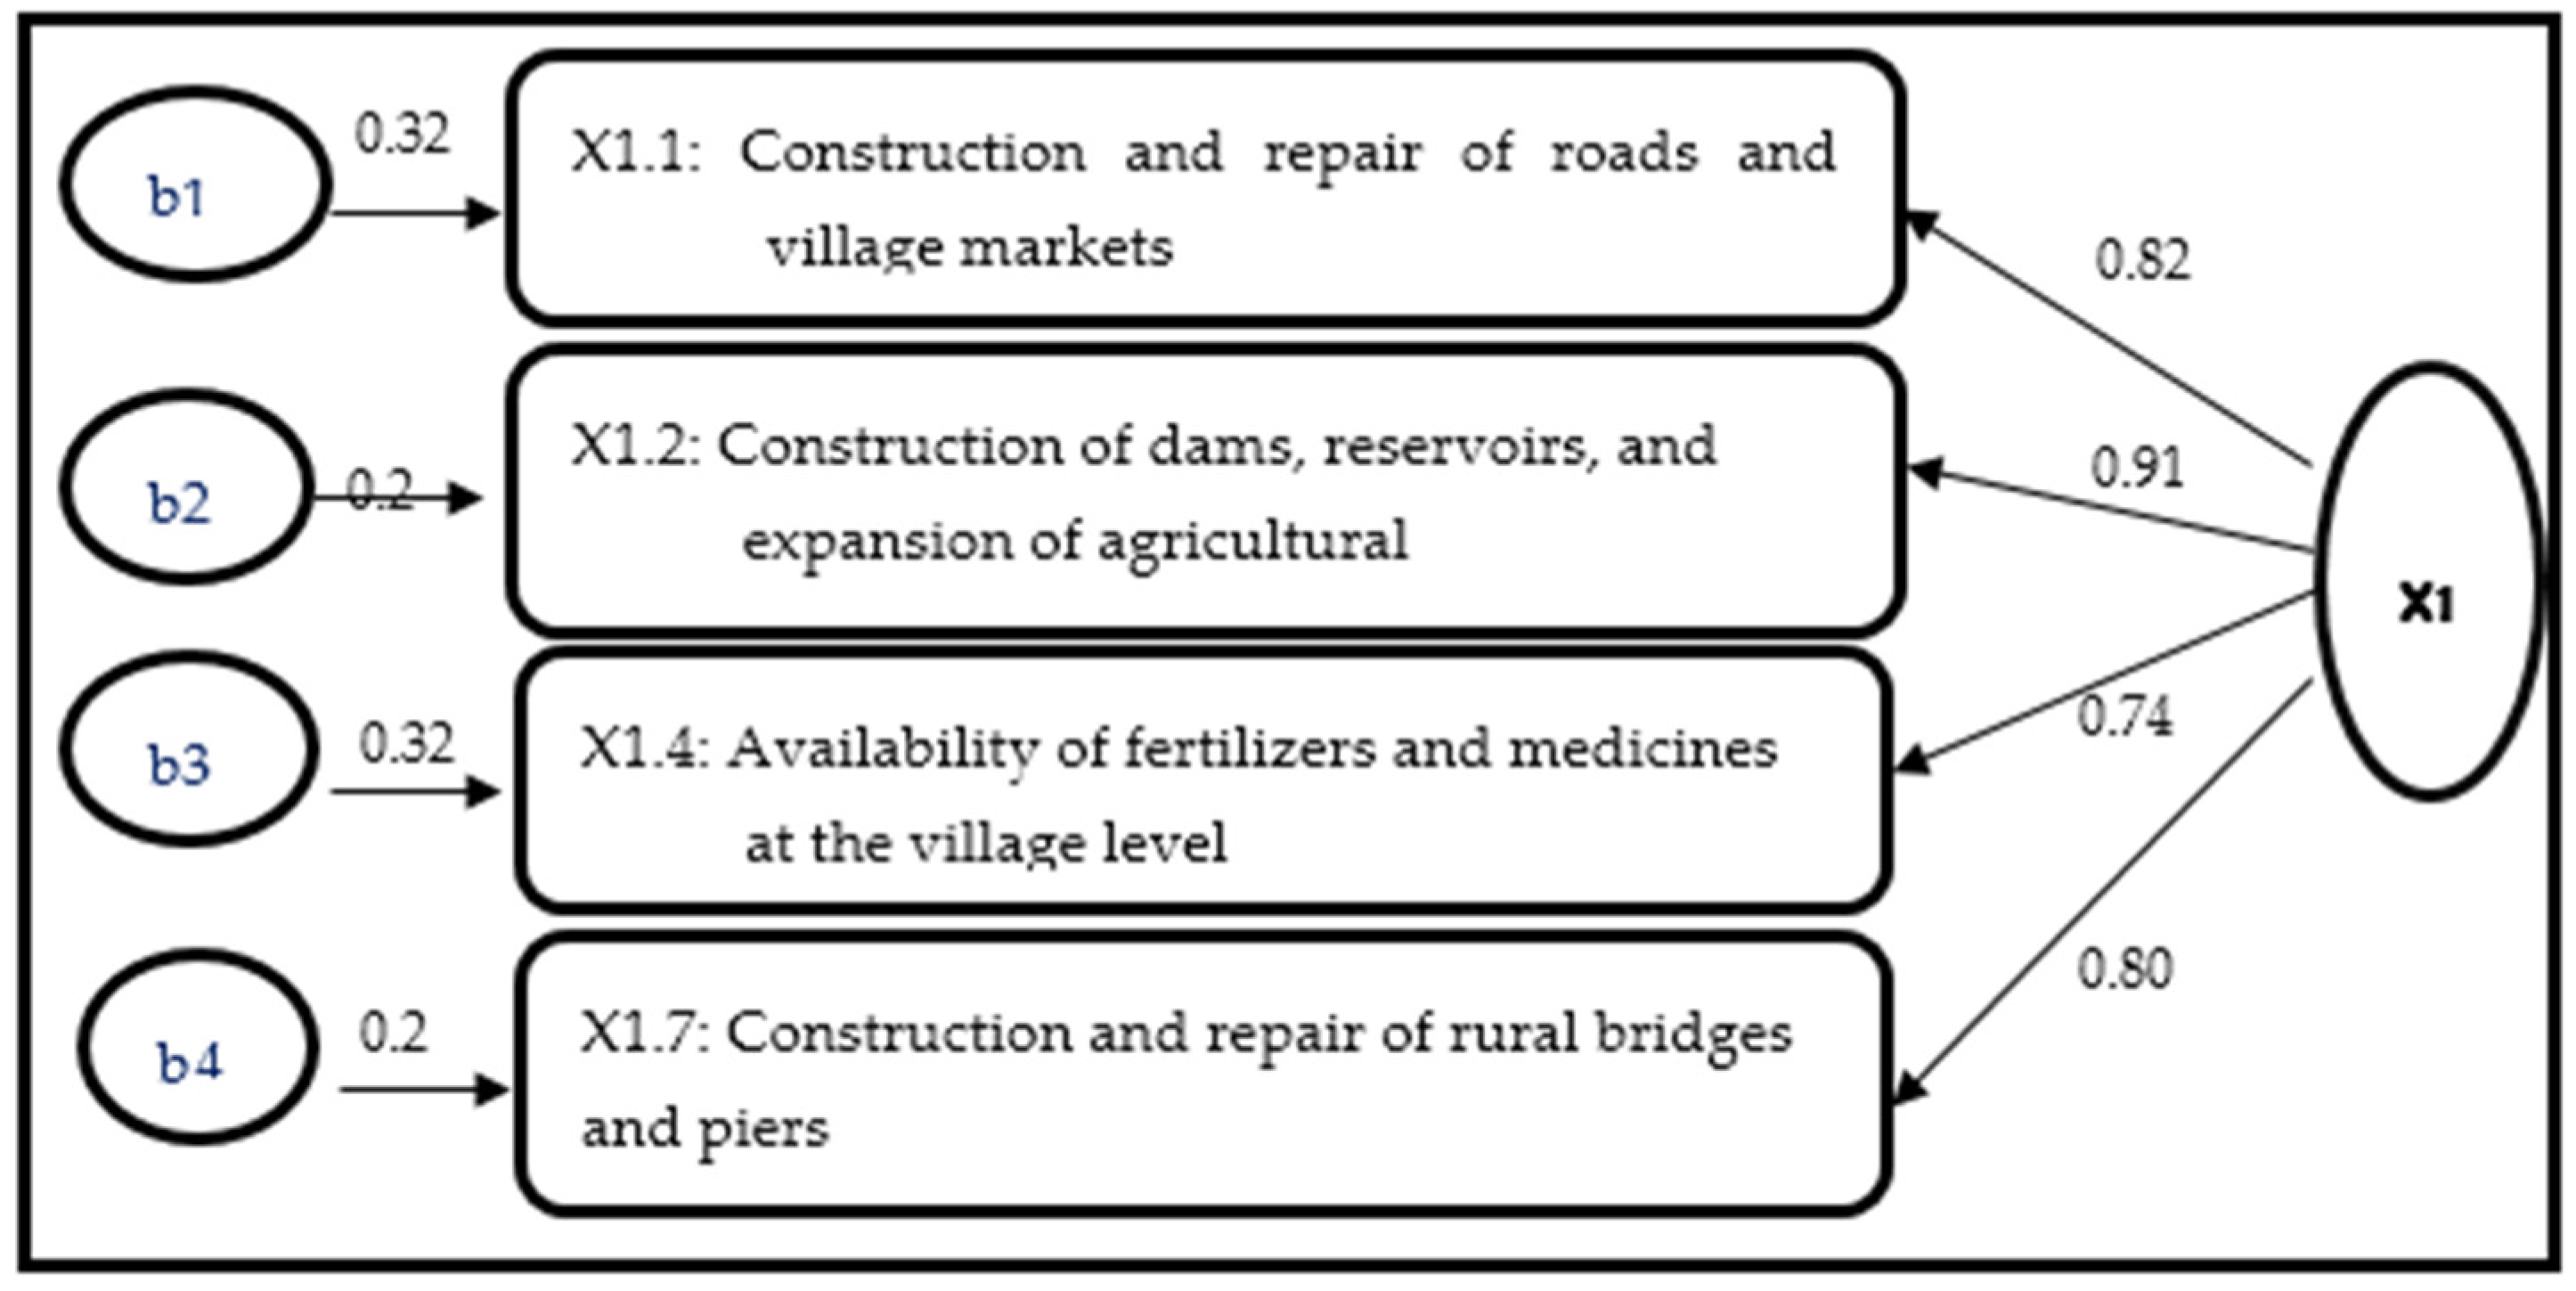
The infrastructure development of roads, bridges, docks, and village markets is insufficient. Farmers cannot increase production, which is limited to the sub-district area. Furthermore, external economic forces are not included, the community’s economy is limited to production, and the technology used is traditional. The system for implementing business activities is traditional subsistence, because farmers lack farming skills. Therefore, the production, quality, and selling prices reduce the farmers’ income and increase poverty.
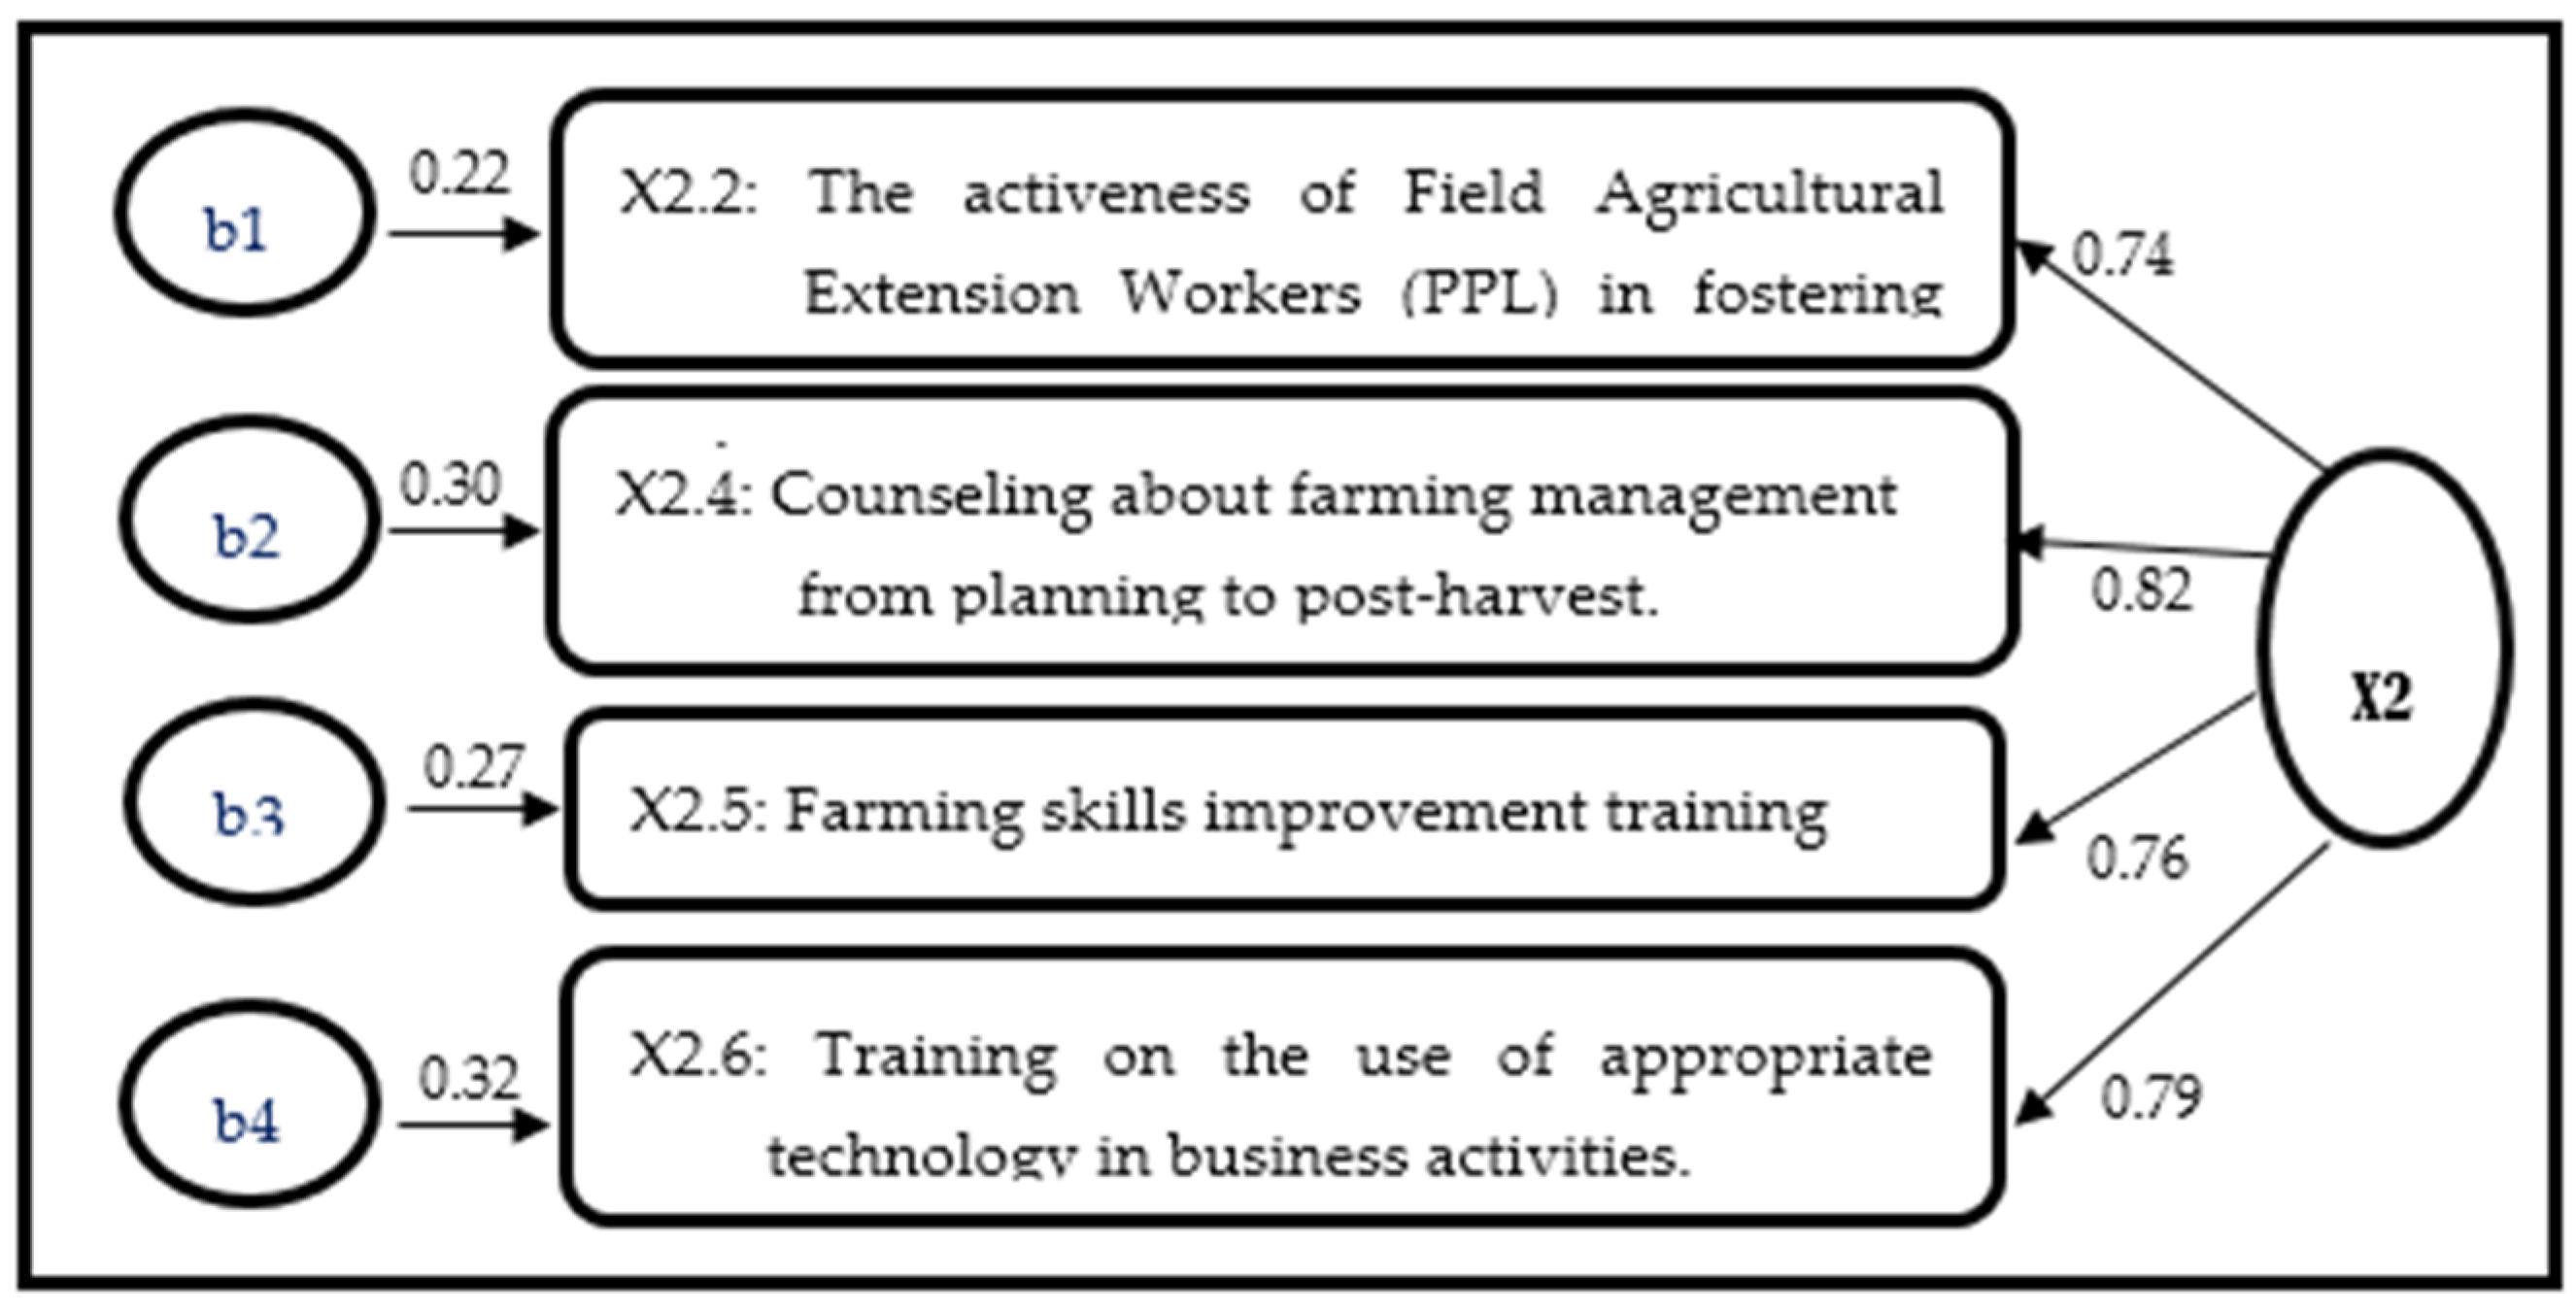
Infrastructure facilitates the marketing of agricultural production, fertilizers, and medicines to increase farm productivity. It also facilitates the accessibility of field agricultural extension workers (PPL) in fostering and training farmers to improve their farming skills, increasing their production and work ethic. Moreover, infrastructure facilitates the farm laborers’ accessibility, enabling farmers to obtain labor from land processing to post-harvest to increase agricultural productivity in rural areas. It also enhances the marketing of agricultural production at high selling prices and the low cost of transporting its products to the marketing center. This increases farmers’ income and economic growth in rural areas.
Robbins and Coulter (2016) stated that strengthening farmer resources increases ability, promotes willingness, and makes farmers independent in improving their farming performance. According to Sedarmayanti (
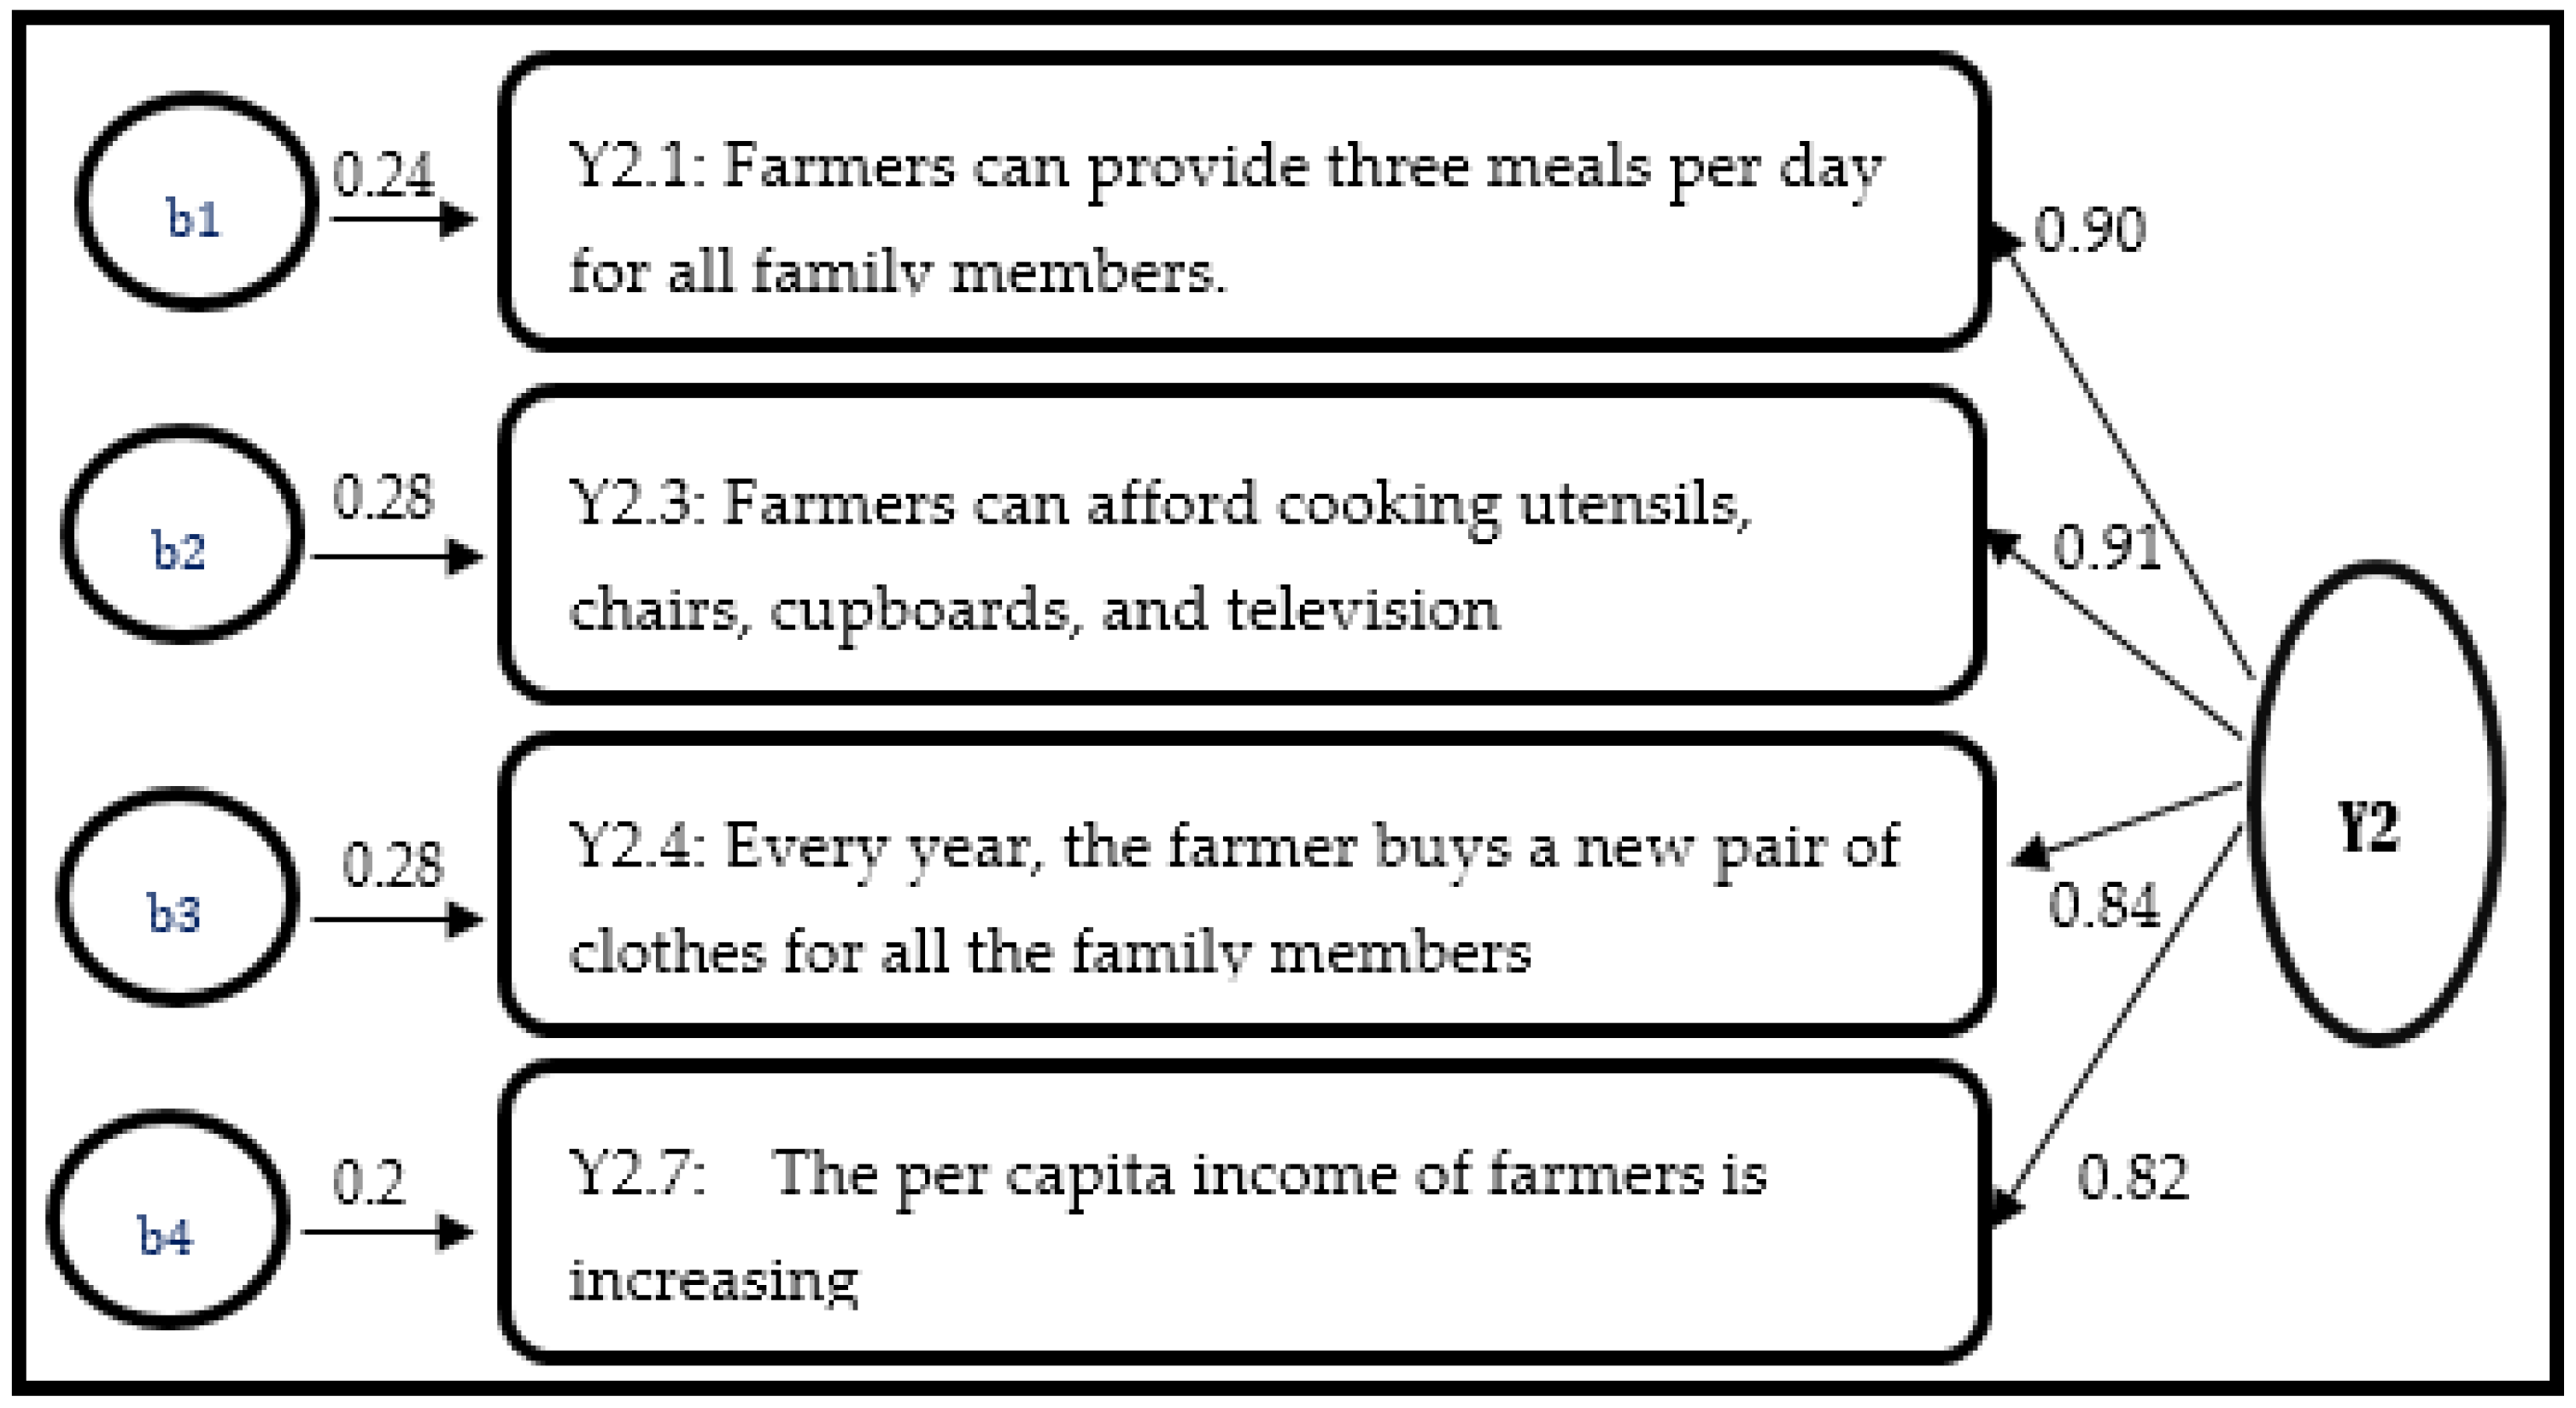
2017), farmer empowerment improves the ability to carry out farming business, developing its infrastructure facilities and easy access to knowledge, technology, and information; strengthening farmer institutions; and increasing production. As a result, it increases farmers’ income and tackles poverty in rural areas.
Hasan et al. (2017) showed that agricultural land in the rural area of the North Buton Regency is fertile, with indicators that without fertilization, it could produce a high production. Farmers have a high work ethic, indicating that they work about 8–10 h daily on the farm. The production, quality, and selling price of agricultural production are low, reducing farmers’ income and increasing poverty. This contradicts the economic theory, which states that when the land for farming is fertile and the farmers’ work ethic is high, agricultural productivity and farmers’ income increase (Todaro and Smith 2015).
Karimuna et al. (2009) showed that agricultural productivity growth in rural areas in the North Buton Regency has a large role for conventional input factors. For instance, land, labor, and livestock, which optimize conventional input factors, increase rural farmers’ income. Modern input factors, such as machinery, advanced chemical technology, and genetics, increase agricultural productivity insignificantly. This finding contradicts Rozelle and Swinnen (2004), who stated that the development of innovation and modern technology increases agricultural productivity and farmers’ income. Furthermore, agricultural technology promotes the improvement of welfare and alleviates the poverty of the rural population.
Soraya (2018) showed that rural farmers in the North Buton Regency have actual and potential resources related to ownership of an institutional relationship network, friendship, and mutual sympathy. They also have relations forming a social work group, such as cooperation in the agricultural sector and a high farmer work ethic. However, the social capital built from community culture has not impacted agricultural productivity and rural farmers’ income. This contradicts the sociological theory of agriculture that social and cultural aspects have economic value that could be institutionalized based on mutual knowledge and recognition. It is the ability to work together to face problems and achieve group goals that results in increasing agricultural productivity and the rural farmers’ income (Coleman 1998; Syahra 2003).
The vital role of agricultural development in the North Buton Regency was shown by its 29.64% contribution to the Gross Domestic Product (GDP) in 2019. The agricultural sector employed 42.52% of labor in the same year. These facts are in line with Edward and Sumner (2015), who stated that agricultural development creates opportunities, boosts income generation, and alleviates rural poverty. Therefore, this study aimed to determine:
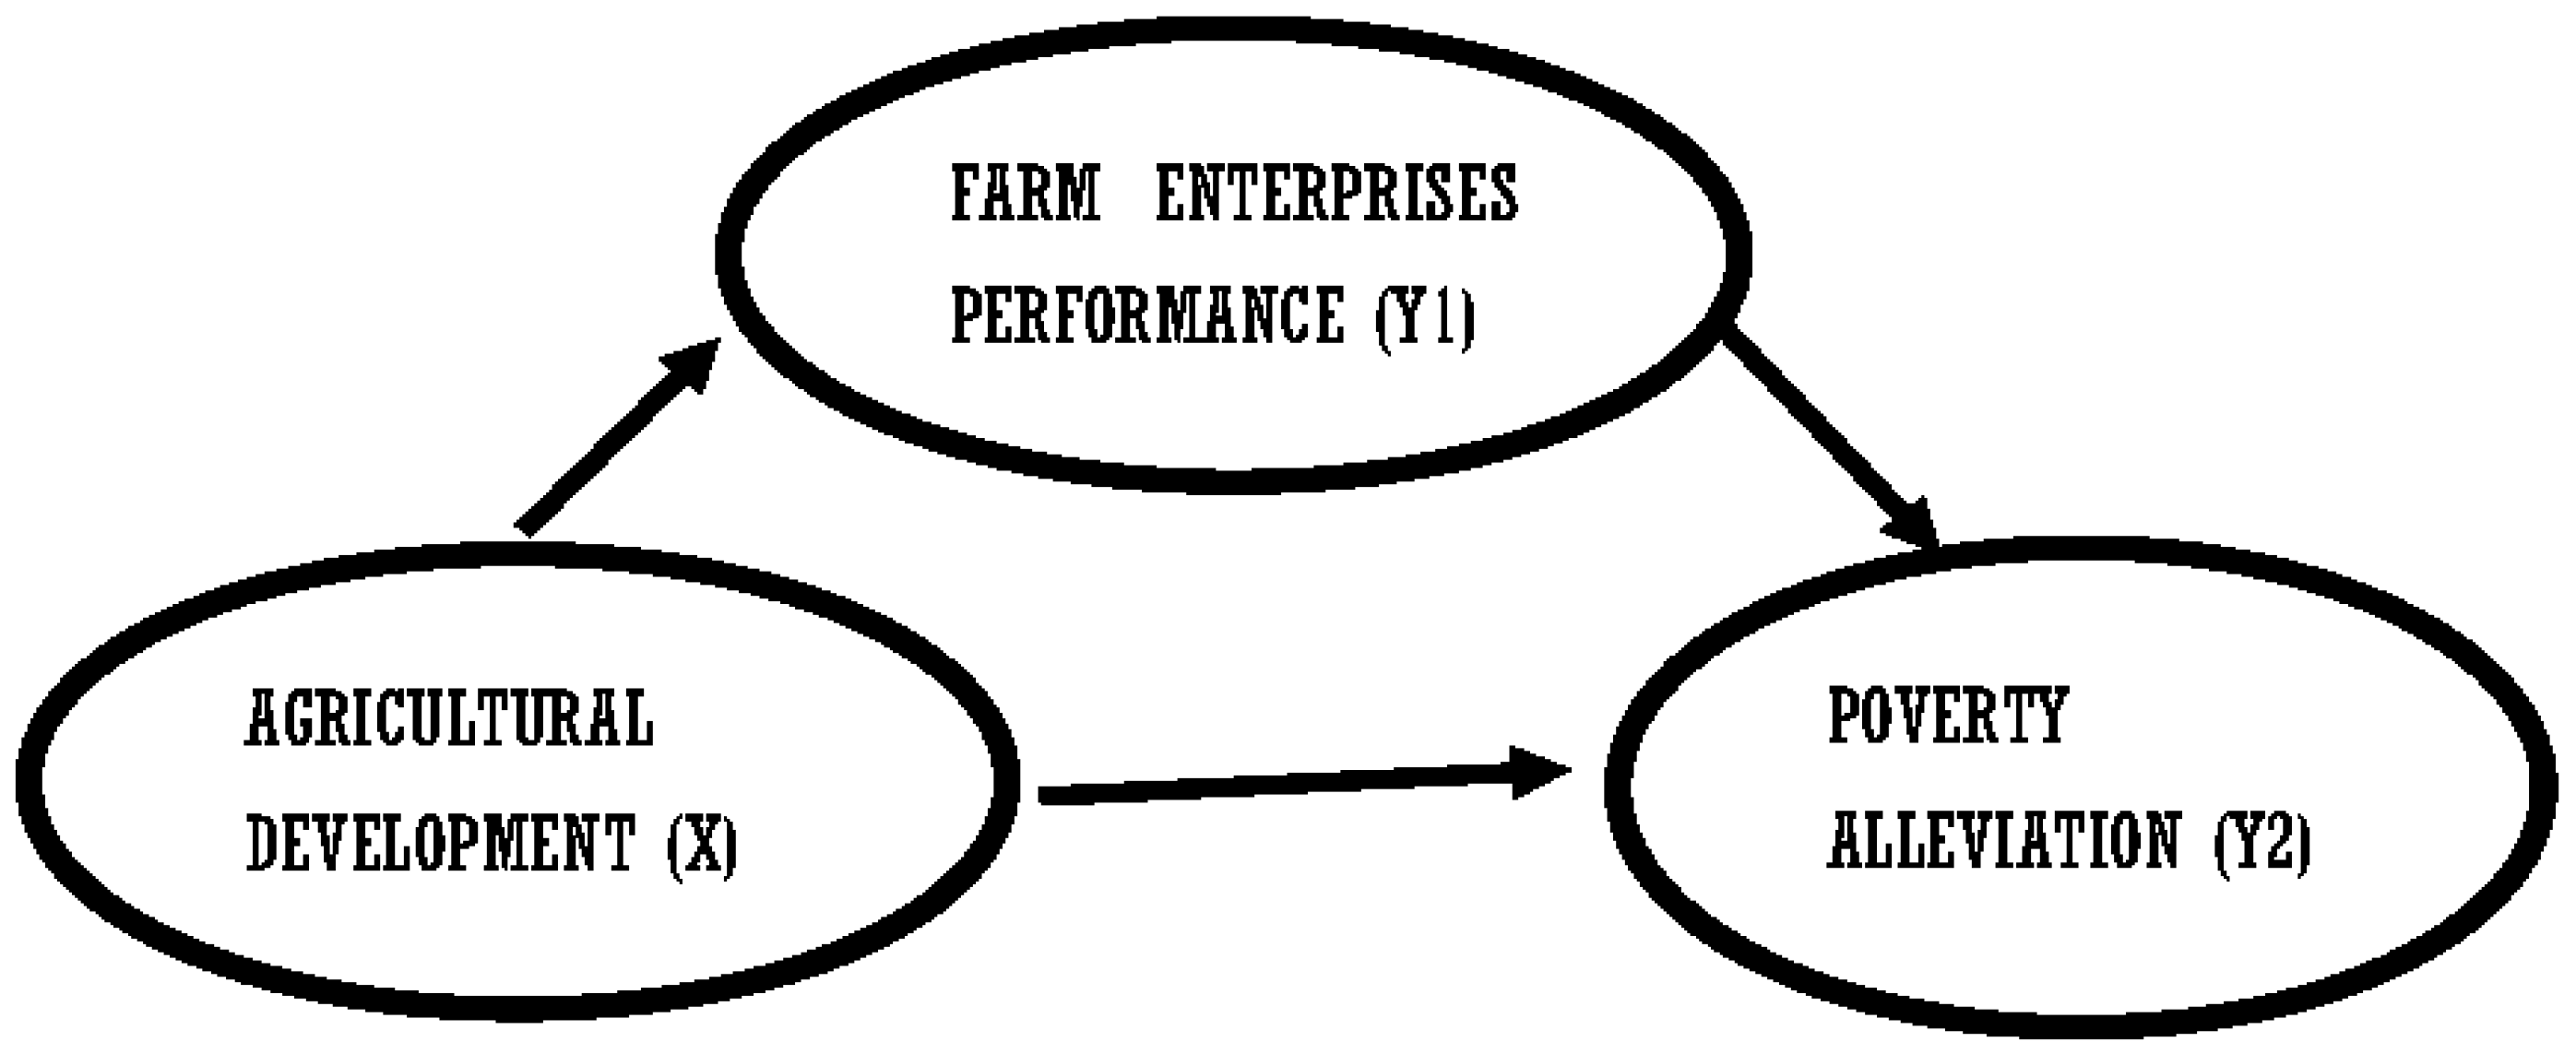
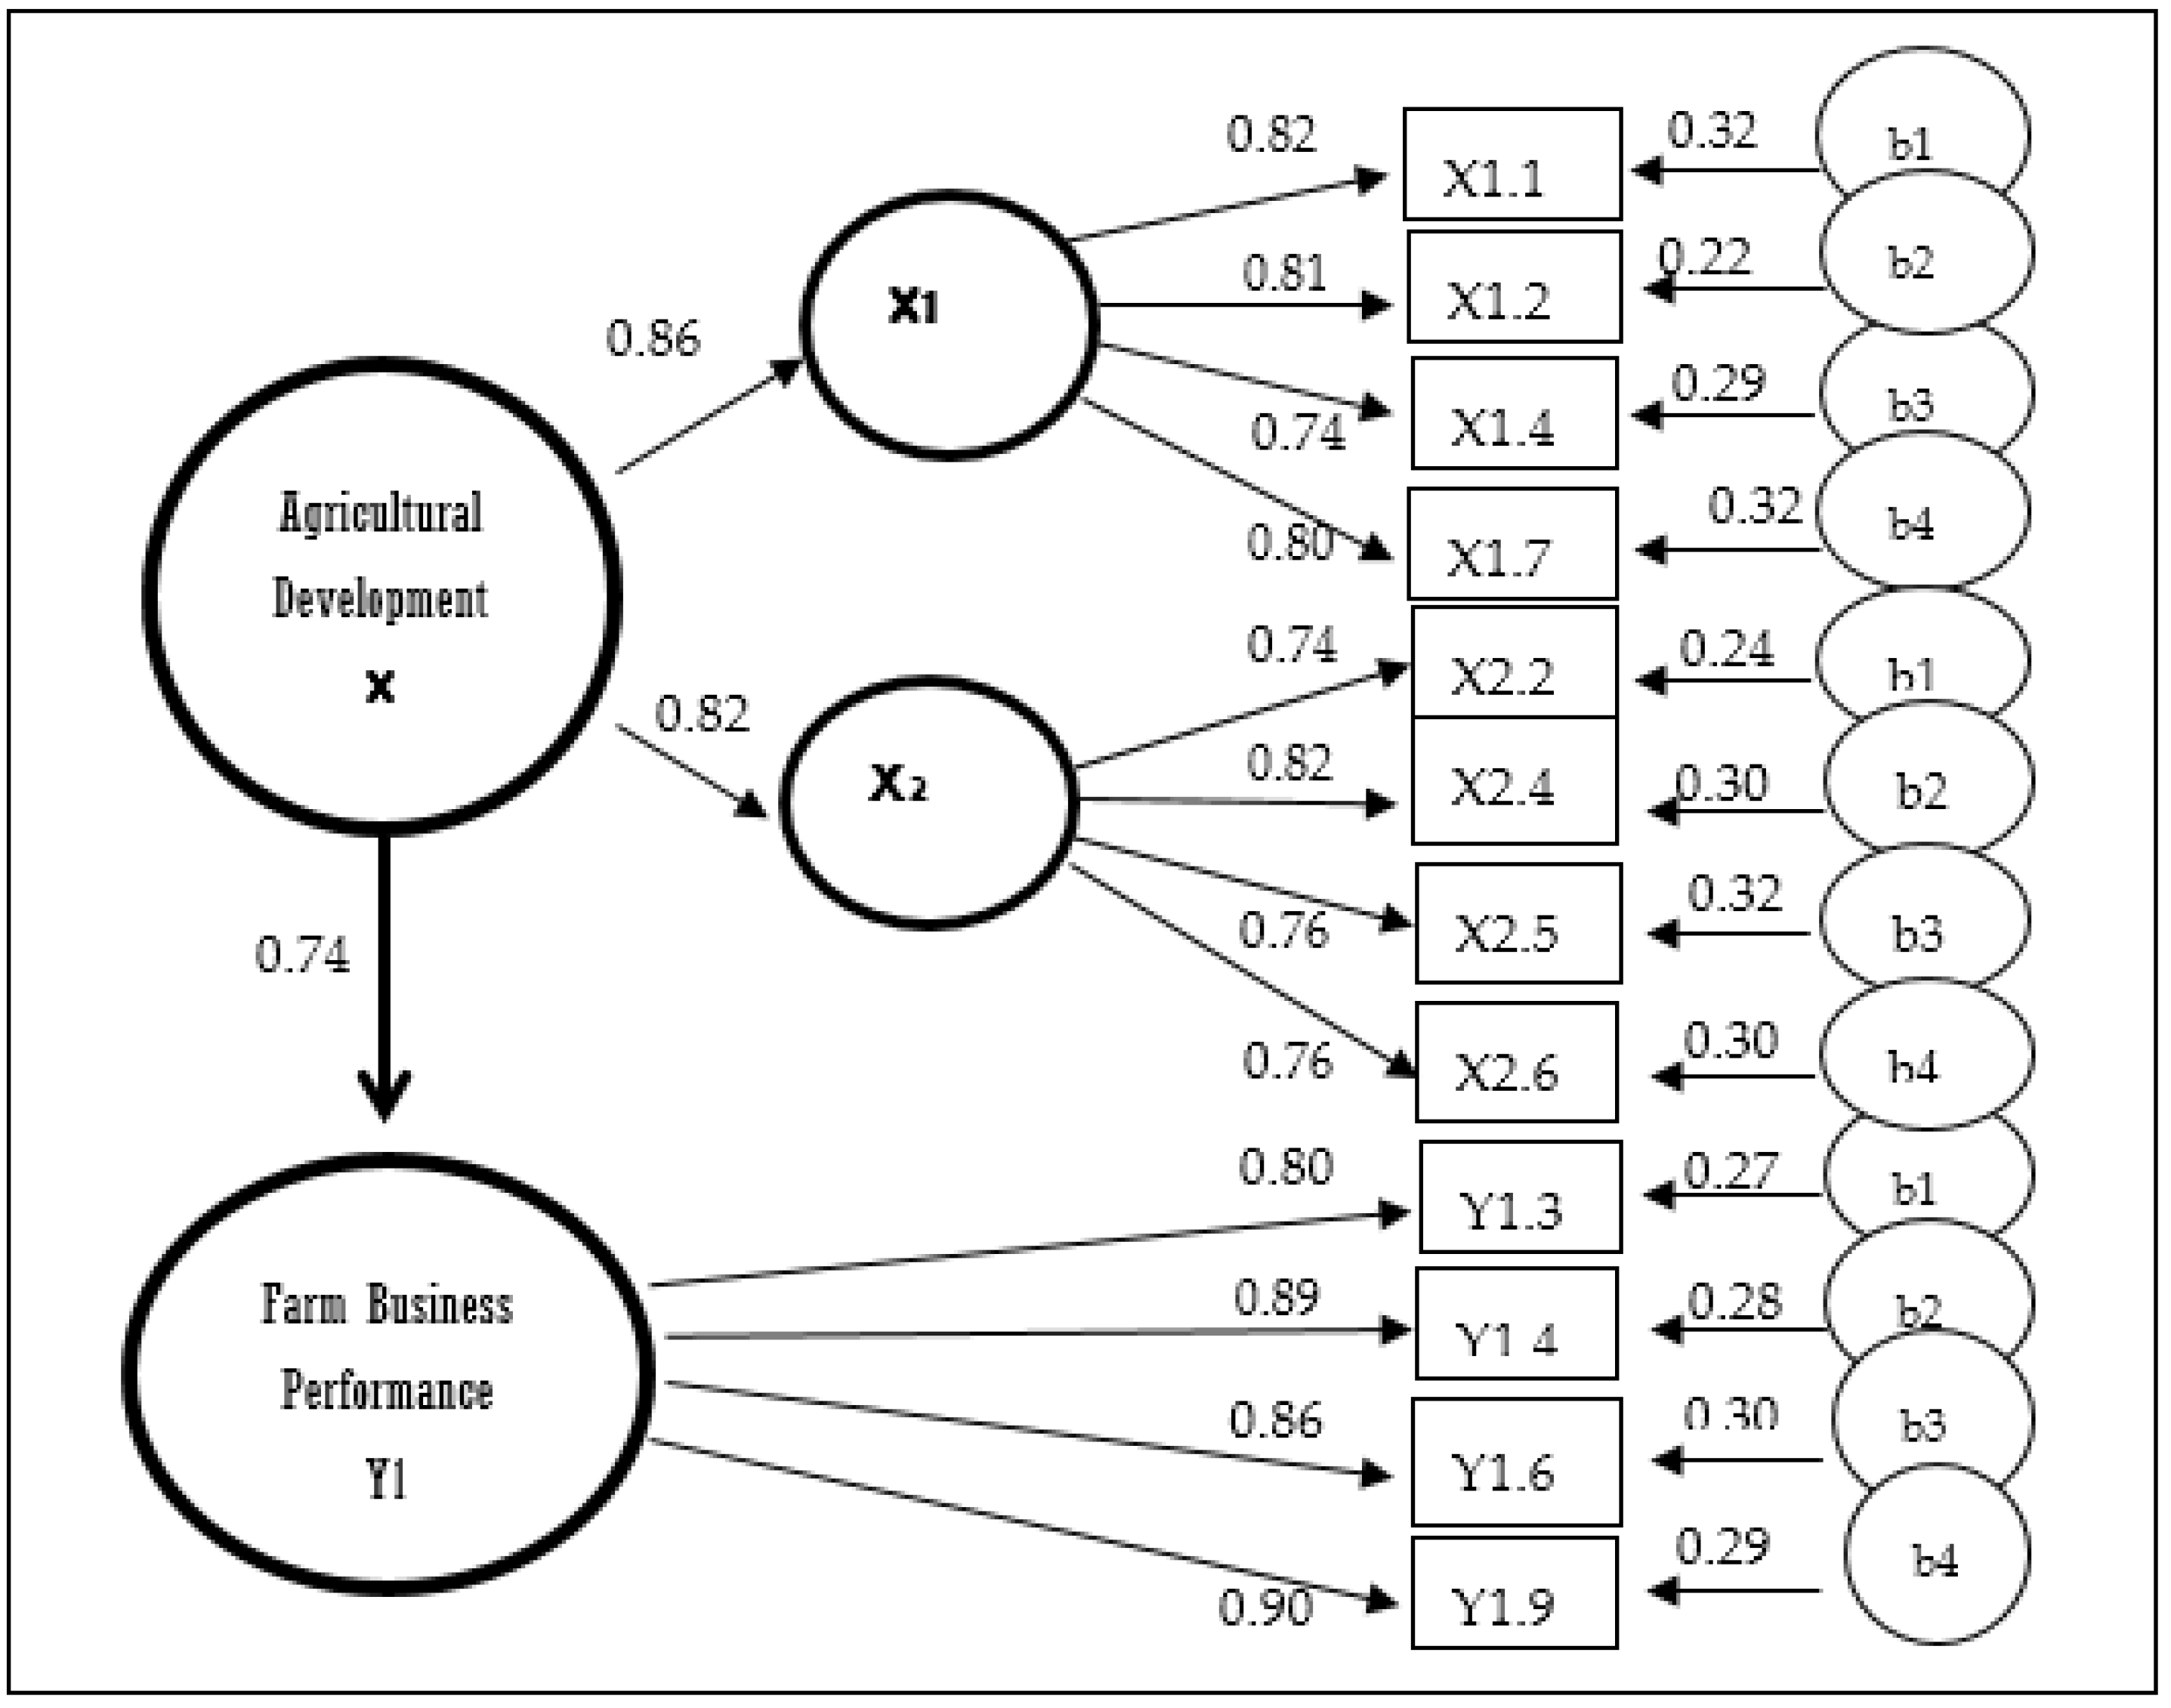
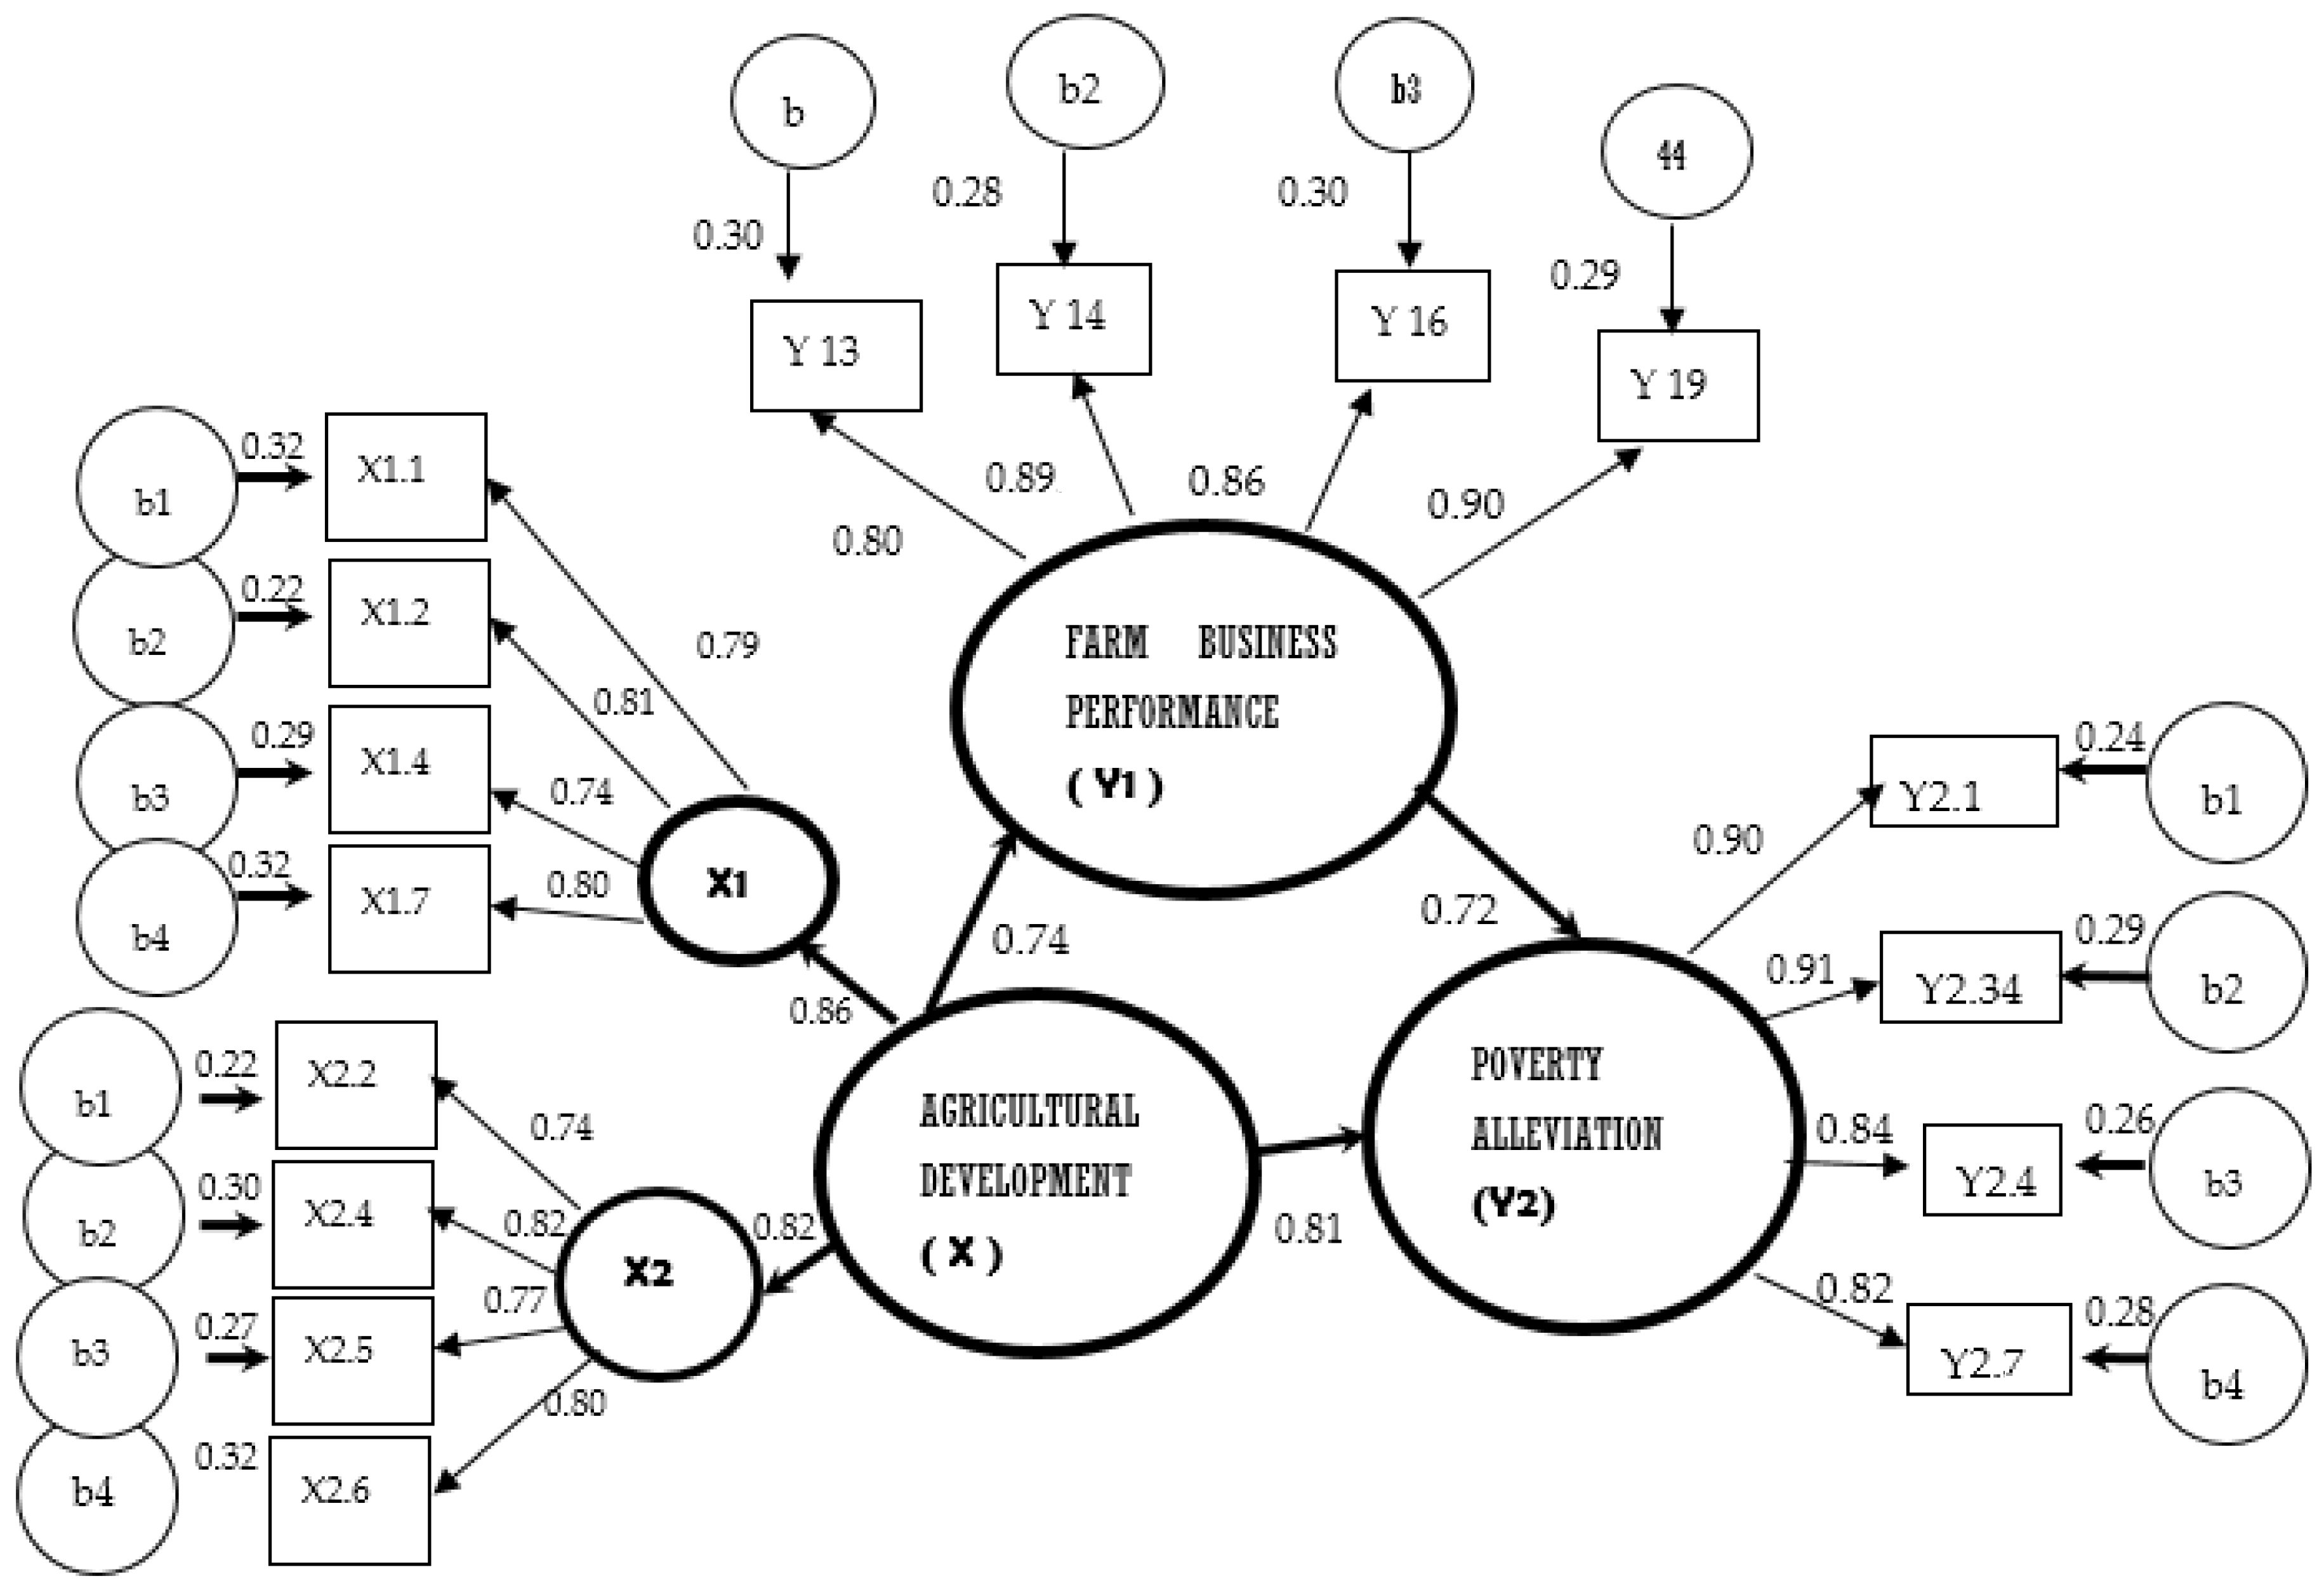
  • The influence of agricultural development on improving farming performance in the North Buton Regency,
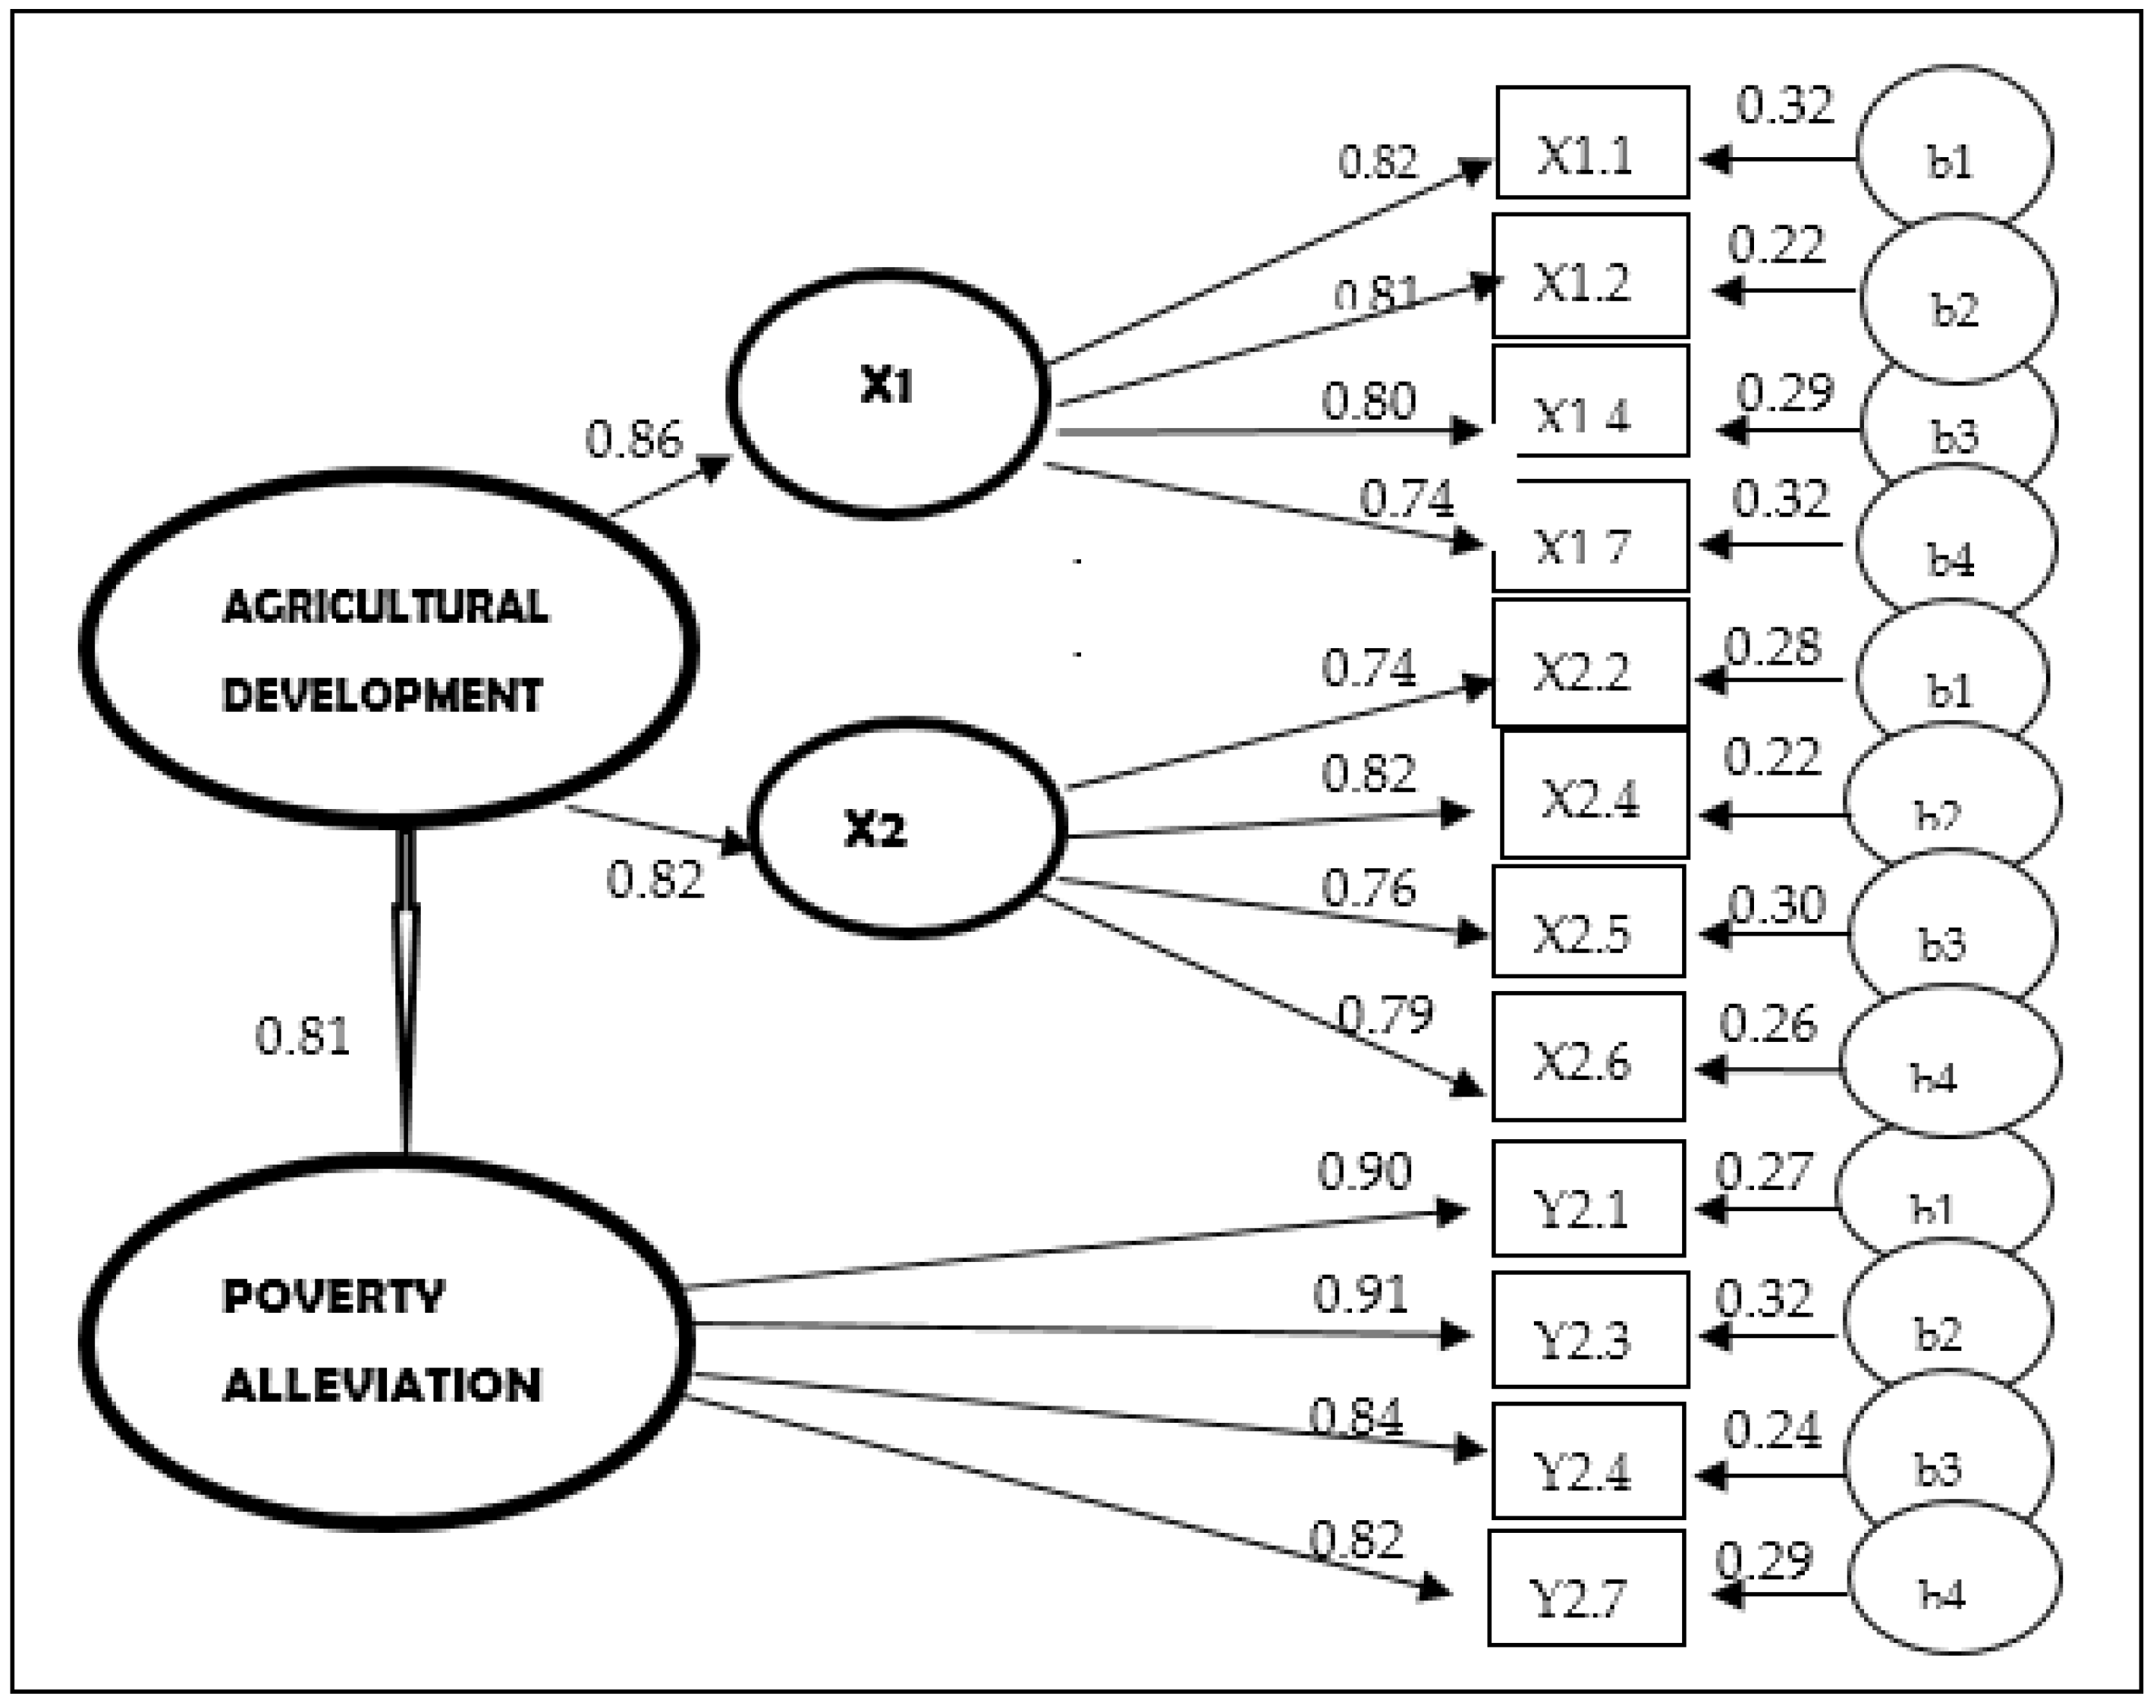
  • The influence of agricultural development on rural poverty alleviation in the North Buton Regency, and
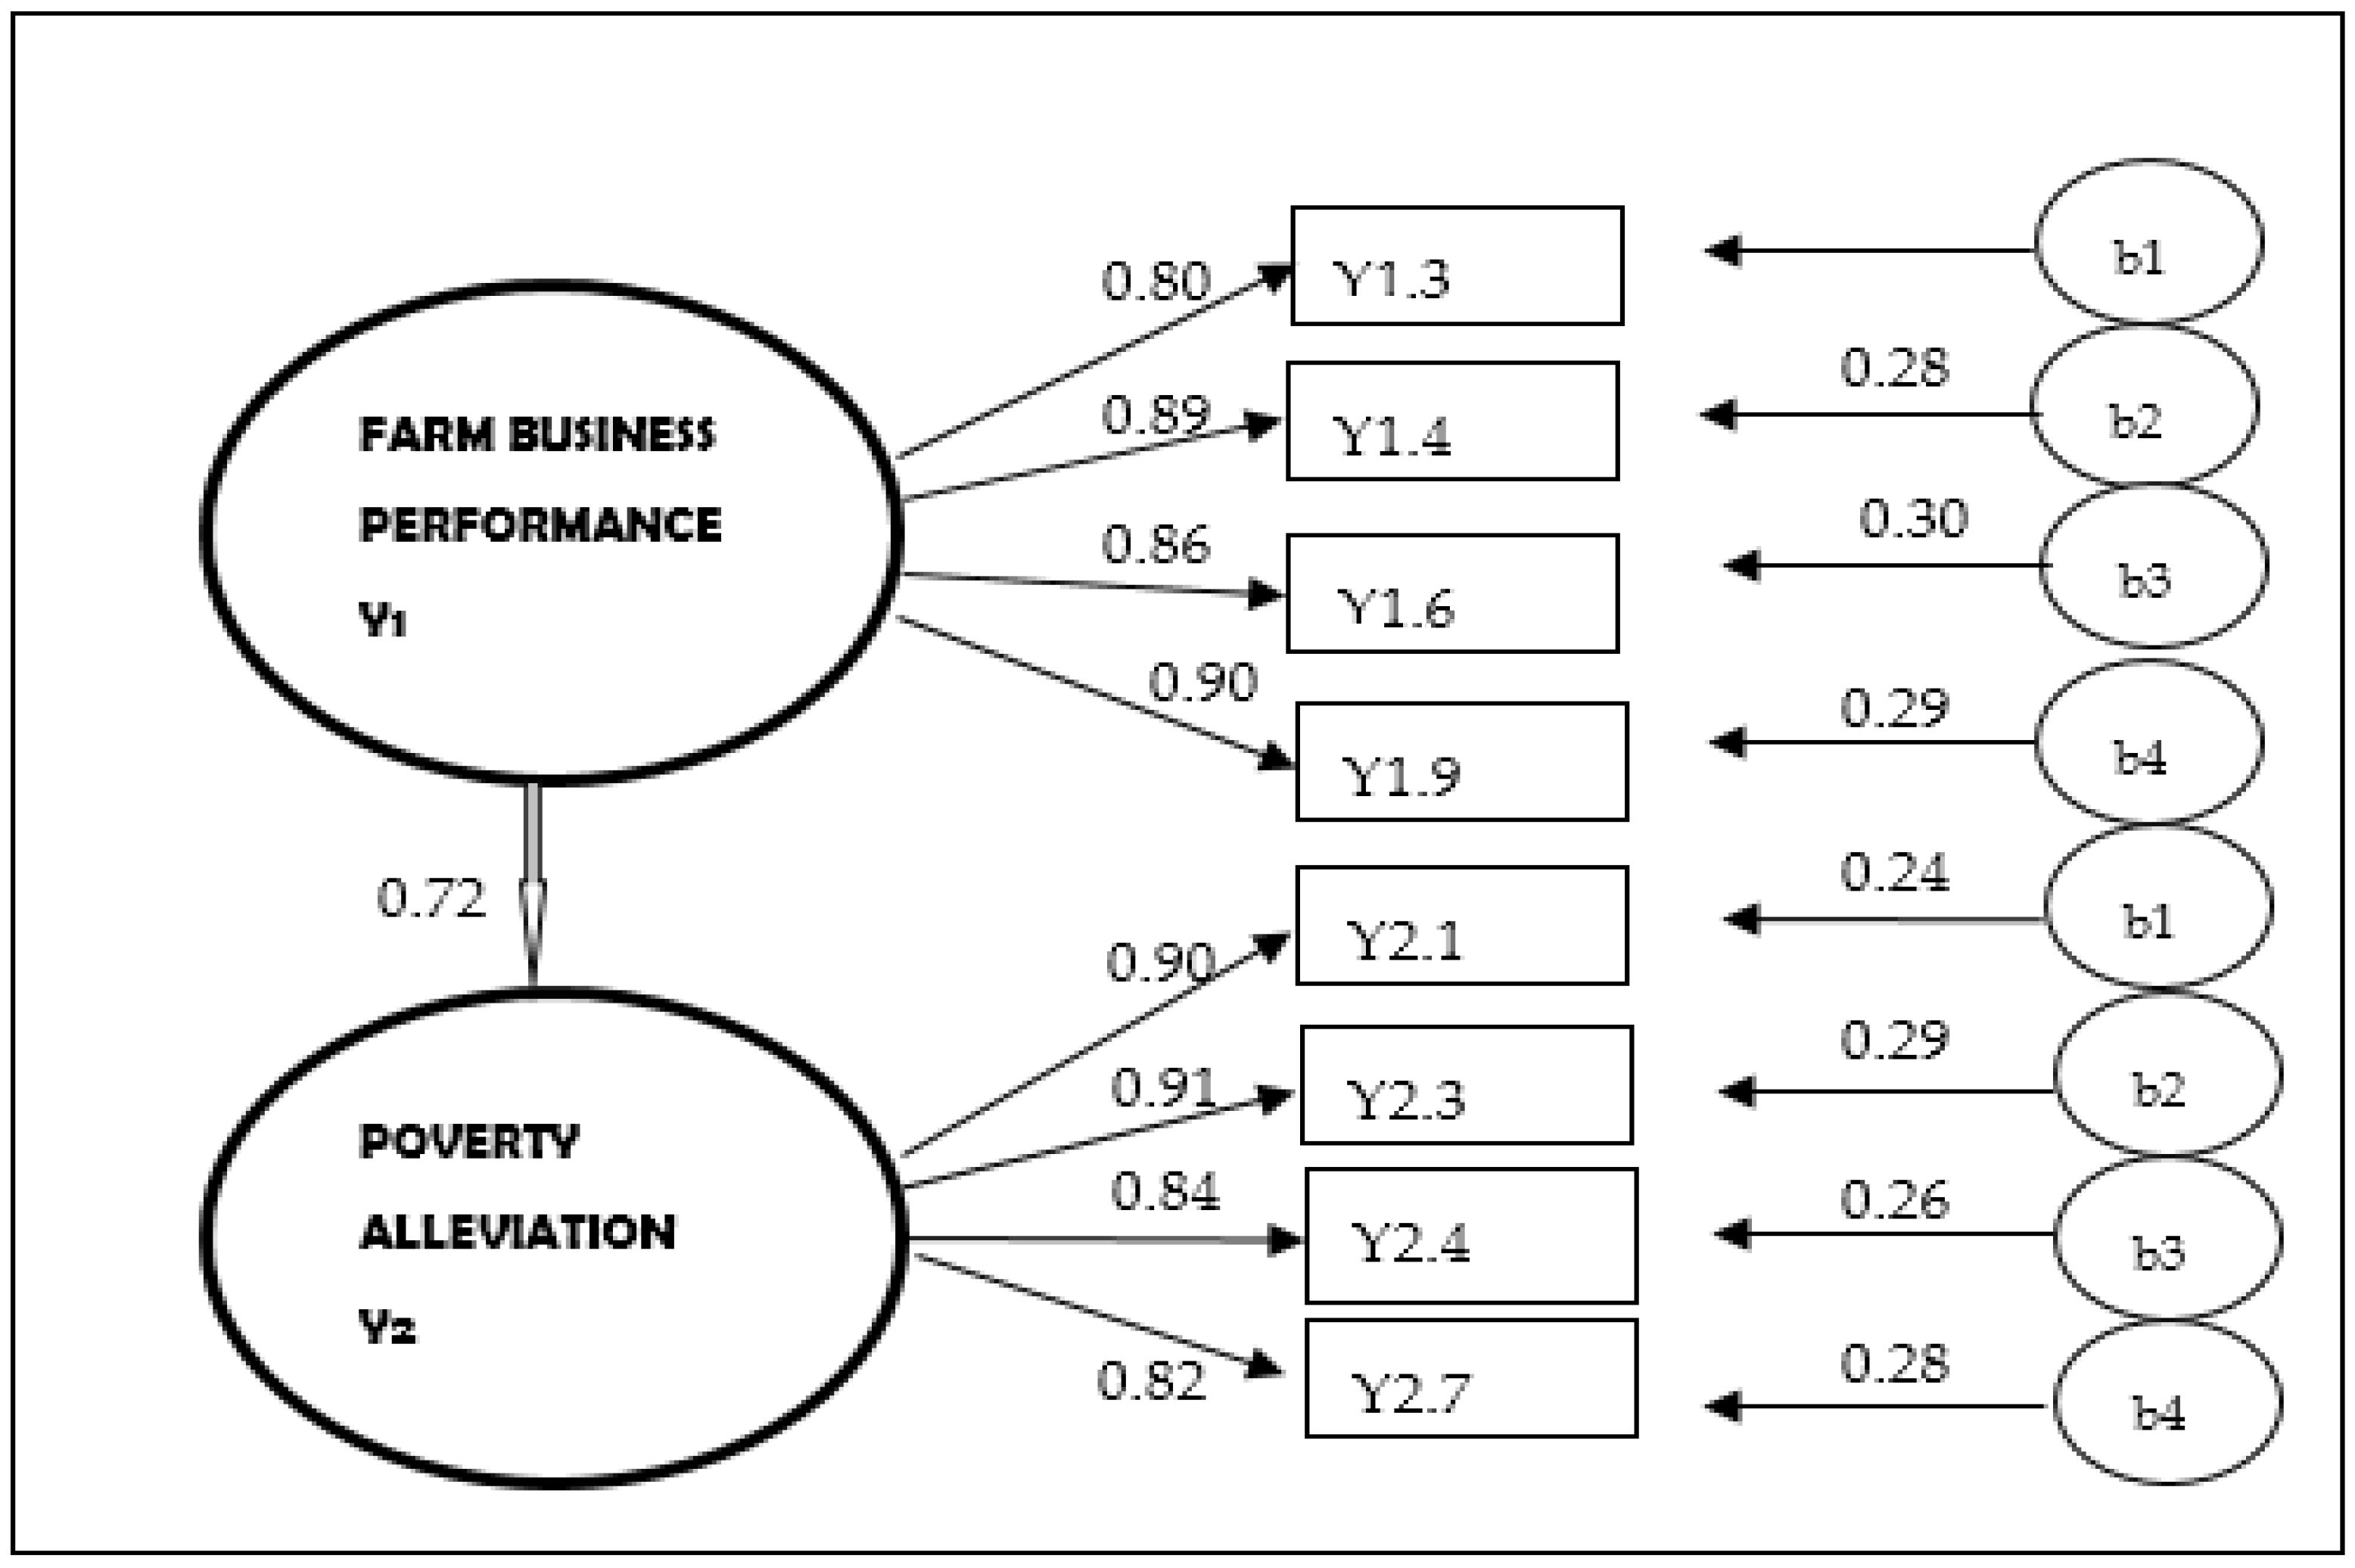
  • How the increase of farming performance alleviates rural poverty in the North Buton Regency.
Many studies were conducted on agricultural development in Indonesia (Christiansen et al. 2011), but none linked farm enterprises’ performance to agricultural development for poverty alleviation. Therefore, this study contributes significantly to literature in this field. The variables of agricultural development, farm business performance, and poverty alleviation were measured using a subjective approach (Cummins 2000).

2. Methodology

2.1. Population and Sample

The study population comprised 78 people from all villages in the North Buton Regency. A total of 10 villages were selected randomly as samples distributed across six sub-districts. This size was based on Byrne (2010), stating that the typical sample size in SEM studies is 12% of the total population. This study randomly took 10 farmers of each village, resulting in 100 respondents.

2.2. Variables

4.
Exogenous or independent variables were agricultural development (X), development of rural agricultural infrastructure facilities (X1), and farmers’ human resource development (X2), linked to farm enterprises’ performance (Y1) and poverty alleviation (Y2).
5.
Endogenous variables included farm business performance (Y1) and poverty alleviation (Y2), influenced by agricultural development (X).
6.
The moderate variable of farm enterprises’ performance (Y1) mediates the influence of agricultural development (X) on rural poverty alleviation (Y2) in the North Buton Regency.

2.3. Data Analysis

Data were analyzed using Structural Equation Modeling (SEM), selected as the model of this multivariate study (Creswell 2009). SEM consists of one exogenous variable of agricultural development and two endogenous variables of farm enterprises’ performance and poverty alleviation. The relationship between variables is shown in Figure 1. The data were analyzed by descriptive and inferential statistics with the following estimating model:
The analysis model of this study refers to Byrne (2010) as follows:
7.
The measurement model analysis shows the validity and reliability of each indicator in measuring the variables (Ferdinand 2014)
8.
The Confirmatory Factor Analysis (CFA) tests whether indicators measure variables based on the loading factor value. Agus and Sagir (2001) stated that a loading factor value (ƛ) ≥ 0.2 is valid in measuring variables.
9.
The SEM model indicators measurement refers to the criteria of Santoso (2011), as shown in Table 1:

2.4. Procedure of the SEM Analysis

The analysis was conducted using the following steps (Byrne 2010; Hair et al. 2017) in Table 2.

3. Results

3.1. Formation of the Indicators Variable

3.1.1. Agricultural Development

Agricultural development is influenced by the development of the rural agricultural infrastructure facilities (X1) and rural farmers’ resources (X2) variables (Asian Development Bank (ADB) 2012; Monchuk 2014; United Nations 2011; Koutsampelas and Polycarpou 2013). Therefore, the construct formation of each variable is as follows:

Rural Agricultural Infrastructure Facilities Development

The development of rural agricultural infrastructure facilities showed four constructs with a high loading factor that improve farm business performance. Therefore, it impacts the poverty alleviation of rural farmers, as shown in Figure 2.
The results in Figure 2 show that constructing roads, dams, reservoirs, bridges, and piers and expanding agricultural land and the availability of fertilizers and medicines in rural areas increase agricultural production. This was indicated by the regression coefficients of 0.82, 0.81, 0.74, and 0.80. The first positive effect was enhanced agricultural production facilities and infrastructure, enabling farmers to increase their farming land productivity. The second impact was improved accessibility of agricultural field instructors (PPL) in providing counseling to improve farmers’ farming skills and work ethics and increase their farming business production. The third effect was increased accessibility of laborers, enabling farmers to carry out farming activities easily, from land processing to post-harvest.

Rural Farmer Resource Development

The rural farmer resource development variable with the highest loading factor was used in the final measurement model. The loading factor value varied from 0.74 to 0.82. The rural farmer resources variable’s development improved farm business performance, affecting poverty alleviation. Figure 3 shows the final measurement of the rural farmer resource development construct.
The results in Figure 3 show that agricultural extension workers foster and train farmers and improve farm management. They contribute to improving farming skills and increasing agricultural production in the North Buton Regency, as shown by the positive regression coefficients of 0.74, 0.82, 0.76, and 0.79. The production also increases due to agricultural intensification and extensification programs supported by rural infrastructure development. This increases farmers’ accessibility to capital and information resources, increasing production at reasonable prices at the farmer-level. The result is improved farm business performance and farmers’ income.

3.1.2. Improved Farm Business Performance

The modified analysis showed that increased farm business performance was included in the four indicators with the highest loading factors of Y1.3, Y1.4, Y1.6, and Y1.9. Therefore, the observable construct with the most significant loading factor was used in the last measurement. The analysis for rural agricultural infrastructure facilities and rural farmer resource development showed the path model for improving farm business performance, as presented in Figure 4.
Figure 5 shows that rural infrastructure and farmer resource development increase farm performance in the North Buton Regency. This was shown by the increased quality of farm production and the market share of agricultural production, with regression coefficients of 0.80 and 0.89, respectively. Furthermore, the effect was shown by increased farmer groups and farming skills, as well as the price of agricultural production, with regression coefficients of 0.86 and 0.90, respectively. Therefore, agricultural development through infrastructure and farmer resource development significantly improves farm business performance. This was indicated by increased production, farmers’ income, and rural poverty alleviation.

3.1.3. Poverty Alleviation

The construct fit test for all indicators showed that the path coefficient significantly exceeded the recommended regression weight of 0.50 (Hair et al. 2017). The four indicators represented the overall variation of the poverty alleviation variable. Therefore, the poverty alleviation construct could be valid (Hair et al. 2017). The variable analysis for each construct that affects rural poverty alleviation is seen in the path coefficients in Figure 5:
Figure 5. Final Indicators of Rural Poverty Alleviation.
Economies 10 00240 g005
The results showed that improving farming performance alleviates rural poverty. The variable indicator showed that farmers provide three meals daily for all members with a regression coefficient of 0.90. They buy cooking utensils, chairs, cupboards, and televisions with a regression coefficient of 0.90 and 0.91. Every year, farmers buy one new pair of clothes for all family members, indicating that the income is also increasing, as shown by the regression coefficient of 0.82. Furthermore, infrastructural development reduces transportation costs for agricultural production and increases farmers’ accessibility to capital resources and production inputs. The development also facilitates the accessibility of extension workers (PPL), increasing production. There is an additional investment, increasing market demand and farmers’ income and alleviating poverty for the rural population of the North Buton Regency.

3.2. Structural Modelling

3.2.1. The Influence of Agricultural Development on Improving Farm Business Performance

Agricultural development by improving rural agricultural infrastructure facilities and farmers’ resources significantly improves farm business performance, with a path coefficient of 0.94. Figure 6 shows how rural farm business performance is affected by agricultural development through rural agricultural infrastructure facilities (X1) and rural farmer resource development (X2).
Previous studies found that agricultural infrastructure development and farmers’ human resources improve farming performance (Clark 2005). This study also found that the agricultural development constructs improve farm business performance with a path coefficient of 0.74. Statistical values relating to goodness-of-fit are given in Table 3.
Many studies pointed to the crucial role of human resources quality in alleviating poverty. They showed the influence of investment in rural farm infrastructure facilities on reducing rural poverty (Clark and Alkire 2008).

3.2.2. The Influence of Agricultural Development on Poverty Alleviation

Agricultural development positively alleviates rural poverty, with a path coefficient of 0.76. Figure 7 shows the influence of agricultural development on rural poverty alleviation.
From Figure 7, the agricultural development variable significantly affected rural poverty alleviation in the North Buton Regency, with a path coefficient of 0.76. The fit index in Table 4 shows that all fit indices were good, meaning that the dimensions of the development of agricultural infrastructure facilities and farmers’ human resource development alleviate poverty.
The findings show that enhancing the quality of human resources highly determines poverty reduction. A positive extension to farmers using modern farming reduces poverty levels (Cervantes-Godoy and Dewbre 2010). Moreover, studies suggested that increasing investment in rural agricultural infrastructure reduces rural poverty (Clark and Alkire 2008). The construction of village roads and agricultural production facilities significantly impact farm business productivity and the selling price of farm goods.

3.2.3. The Influence of Improved Farm Business Performance on Poverty Alleviation

Improving infrastructure facilities in rural areas lowers the transportation cost of agricultural produce to marketing hubs. Agricultural production facilities obtained at low prices and the increasingly effective agricultural extension raise the production and quality of agricultural production. They also increase the selling price of rural farm business production, this improves agricultural business performance and increases the per capita income of rural farmers, reducing poverty. The structural model of the relationship between the latent variables: farm business performance (Y1) and poverty elevation (Y2) with the manifest variable is shown in Figure 8.
Figure 5 shows the influence of improved farm business performance on rural poverty alleviation in the North Buton Regency, with a path coefficient value of 0.81. The fit index in Table 5 shows that all fit indices were good, meaning that improving the farm business performance alleviates rural poverty.
Increasing productivity through agricultural intensification and extensification supported by infrastructure development facilitates farmers’ accessibility, fertilizer and medicine marketing, and reasonable prices. Additionally, increasing farmer resources to improve farming skills and work ethic increases agricultural production and the farmers’ income and alleviates poverty.
Alkire (2007) stated that poverty is likened to a dead knot and tangled thread with no end. For instance, poverty caused by low agricultural productivity has implications for the low farmers’ income. It causes a lack of consumption costs, malnutrition, vulnerability to diseases, low education level, labor productivity, and capital investment. This circle would continue to rotate and last until the poverty chain is removed. One factor determining breaking the rural poverty chain is the government’s intervention through agricultural infrastructure development policies. The policies could help increase agricultural productivity and the farmers’ incomes and eradicate poverty.

3.3. Final Structural Model Formation

The structural model of agricultural development against poverty alleviation by improving farm business performance consisted of two exogenous, two endogenous, and 16 observed variables. Exogenous variables were the construction of agricultural infrastructure facilities and farmers’ human resources development. Rural farmers’ human resources impact farm business performance, affecting poverty alleviation. The structural relationship between the three latent variables: farm business performance (Y1), agricultural development (X) and poverty elevation (Y2) with their manifest variables is shown in Figure 9.
The goodness-of-fit indices for the structural model showed a GFI value of 0.87 and an AGFI value of 0.83. The RMSEA value was 0.09, higher than the recommended limit value of 0.08, and the SRMR value of 0.03 showed a good fit. Agricultural development through infrastructure and farmer resource development significantly and positively influences farm business performance. This was indicated by increased agricultural production, farmers’ income, and reduced rural poverty in the North Buton Regency. Table 6 shows the goodness-of-fit index of structural models.

4. Hypothesis Test

4.1. Direct Test

Based on the hypothesis test in the SEM model, agricultural development influences rural poverty alleviation by improving farm business performance. Table 7 summarizes the hypothesis test of the direct influence between variables.

4.2. Mediating Influence of Farm Business Performance (Indirect Influence)

Agricultural development’s influence on rural poverty alleviation in the North Buton Regency through the mediation of farm business performance was analyzed using the path coefficient difference approach (Solimun 2012).
The mediating variable on farm business performance was identified by comparing the influence of agricultural development on rural poverty alleviation without a mediating variable to the one involving a mediating variable (Hair et al. 2017).
The results in Figure 10 show the influence of agricultural development on rural poverty alleviation:
  • The direct influence of agricultural development (X) on rural poverty alleviation was (Y2) = c = 0.81
  • The indirect influence of agricultural development (X) on rural poverty alleviation was (Y2) = a × b = 0.74 × 0.72 = 0.53.
  • The total influence of agricultural development (X) on rural poverty alleviation was (Y2) = d = c + a × b = 0.81 + 0.53 = 1.34
The influence of agricultural development on rural poverty alleviation is more significant when supported by improved farm business performance. This was indicated by the difference in the path coefficient, where the direct influence of agricultural development on poverty alleviation was 0.52. When the influence was made through improved farm business performance, the path coefficient rose to 0.95 or 95%. Therefore, this result shows that agricultural development significantly influences poverty alleviation mediated by improved farm business performance in the North Buton Regency.

5. Conclusions and Recommendations

5.1. Conclusions

Agricultural development mediated by the construction of rural infrastructure facilities and the development of farmers’ resources improves farm business performance. The development mediated by agricultural infrastructure facilities and rural farmers’ resources affects rural poverty alleviation. Furthermore, improving the agricultural business performance significantly influences rural poverty alleviation in the North Buton Regency. This means that agricultural development directly and indirectly influences rural poverty alleviation.

5.2. Recomendation

Improved farm business performance could indicate agricultural development. Therefore, a policy plan should be established that positions agriculture as a superior sector in economic growth and as a critical tool for alleviating rural poverty in the North Buton Regency. A rural poverty alleviation strategy could be stimulated by constructing infrastructure, such as roads, bridges and piers, village markets, dams, and convexes. This should continue with rural farmers’ resource development by activating field agricultural extension workers (PPL), improving agricultural business skills starting from business planning to post-harvest, and training farmers on agricultural processing. The purpose is to increase agricultural business performance and alleviate rural poverty. The rural residents’ social capital could be a source of strength and valuable resources in agricultural development for poverty alleviation. Furthermore, the trust between community components facilitates communication and rural agricultural development planning. The social networking of farmers by agricultural organizations and individual networks supports the movement of collectivity actions for agricultural development and rural poor people empowerment. Similarly, norms and institutions are rural areas’ policies and value systems that control and maintain rural agricultural development. Since social capital could leverage agricultural performance, it should be sustained, favoring the rural areas’ agricultural development and poverty alleviation in the regency.

Funding

My research received no external funding.

Institutional Review Board Statement

Not applicable.

Informed Consent Statement

Not applicable.

Data Availability Statement

Not applicable.

Acknowledgments

I extend my appreciation to the two reviewers for improving this article.

Conflicts of Interest

The author declares no conflict of interest.

References

  1. Agus, Arawati, and Ridzuan Mohd Sagir. 2001. The structural relationships between total quality management, competitive advantage and bottom line financial performance: An empirical study of Malaysian manufacturing companies. Total Quality Management 12: 1018–24. [Google Scholar] [CrossRef]
  2. Ajayi, Oluyede Clifford, Frank Place, Festus Kehinde Akinnifesi, and Gudeta Weldsesemayat Sileshi. 2011. Agricultural success from rica: The case of fertilizer tree systems in southern Africa (Malawi, Tanzania, Mozambique, Zambia and Zimbabwe). International Journal of Agricultural Sustainability 9: 129–136. [Google Scholar] [CrossRef]
  3. Alkire, Sabina. 2007. Choosing Dimensions: The Capability Approach and Multidimensional Poverty. CPRC Working Paper 88: 1–28. Available online: https://papers.ssrn.com/sol3/papers.cfm?abstract_id=1646411 (accessed on 21 September 2021). [CrossRef]
  4. Asian Development Bank (ADB). 2012. Key Indicators for Asia and the Pacific 2012. Manila: ADB. [Google Scholar]
  5. Bappeda Buton Utara. 2019. Laporan tahunan bupati Buton Utara; Kulinsusu: Bappeda Buton Utara.
  6. Bappenas. 2014. Rencana Pembangunan Jangka Menengah Nasional (RPJMN) 2019–2024, Agenda Pembangunan Bidang; Jakarta: Bappenas.
  7. Barro, Robert J., and Jong-Wha Lee. 2013. A new data set of educational attainment in the world, 1950–2010. Journal of Development Economics 104: 184–98. [Google Scholar] [CrossRef]
  8. Byrne, Barbara M. 2010. Structural Equation Modeling with AMOS: Basic Concept, Application, and Programming, 2nd ed. New York: Routledge, Taylor & Francis Group, LLC. [Google Scholar]
  9. Cervantes-Godoy, Dalila, and Joe Dewbre. 2010. Economic Importance of Agriculture for Poverty Reduction. OECD Food, Agriculture and Fisheries Papers 23: 1–23. [Google Scholar]
  10. Christiansen, Demery Luc, Lionel Demery, and Jesper Kuhl. 2011. The (evolving) role of agriculture in poverty reduction—An empirical perspective. Journal of development Economics 96: 239–54. [Google Scholar] [CrossRef]
  11. Clark, J. R. A. 2005. The ‘new associationalism’ in agriculture: Agro-food diversification and multifunctional production logics. Journal of Economic Geography 5: 475–98. [Google Scholar] [CrossRef]
  12. Clark, David Alexander, and Sabina Alkire. 2008. Weights as Value Judgments: An Assessment of Expert Opinion and Participatory Approaches. In OPHI Workshop on Weighting in Multidimensional Poverty Measures, Queen Elizabeth House (Department for International Development). Oxford: University of Oxford. [Google Scholar]
  13. Coleman, Jame S. 1998. Social capital in the creation of human capital. The American Journal of Sociology 94: 95–125. [Google Scholar] [CrossRef]
  14. Creswell, John W. 2009. Research Design: Qualitative, Quantitative, and Mixed Methods Approaches. London: Sage Publication. [Google Scholar]
  15. Cummins, Robert A. 2000. Objective and subjective quality of life: An interactive model. Social Indicators Research 52: 55–72. [Google Scholar] [CrossRef]
  16. Edward, Peter, and Andy Sumner. 2015. The impact of the PPP revision on poverty in Indonesia, 1990–2012. New York: Mimeo. [Google Scholar]
  17. Ferdinand, Augusty. 2014. Metode Penelitian Manajemen, Edisi 5. Semarang: Seri Pustaka. [Google Scholar]
  18. Gao, Jiamin, Hongwei Hu, and Lan Yao. 2020. The role of social engagement in the association of self-reported hearing loss and health-related quality of life. BMC Geriatrics 20: 182. [Google Scholar] [CrossRef] [PubMed]
  19. Hair, Josep F., G. Tomas M. Hult, Christian M. Ringle, and Marko Sarstedt. 2017. A Primer on Partial Least Squares Structural Equation Modeling (PLS-SEM). Thousand Oaks: Sage Publications Inc. [Google Scholar]
  20. Hasan, Aedy, Yohanes Boni, Syamsul Anan, and La Ode Samsul Barani. 2017. Analisis Potensi Komoditi Unggulan Pertanian Tanaman Pangan Dalam Meningkatkan Pendapatan Penduduk Kabupaten Buton Utara; Kulinsusu: Bappeda Buton Utara.
  21. Karimuna, La, Yohanes Boni, Syamsul Anan, and Anas Nikoyan. 2009. Analisis Produktifitas Lahan Usaha Tani Kabupten Buton Utara; Kulinsusu: Bappeda Buton Utara.
  22. Koutsampelas, Christos, and Alexandros Polycarpou. 2013. The distributional consequences of the cypriot crisis. Cyprus Economic Policy Review 7: 47–61. [Google Scholar]
  23. Monchuk, Victoria. 2014. Reducing Poverty and Investing in People: The New Role of Safety Nets in Africa. Washington, DC: International Bank for Reconstruction and Development. [Google Scholar]
  24. Murdiansyah, Isnan. 2014. Evaluasi Program Pengentansan Kemiskinan Berbasis Pemberdayaan Masyarakat (Studi Kasus Pada Program Gerdu Taskin di Malang). Jurnal WIGA 4: 71–92. Available online: https://media.neliti.com/media/publications/36627-ID-evaluasi-program-pengentasan-kemiskinan-berbasis-pemberdayaan-masyarakat-studi-k.pdf (accessed on 21 September 2021).
  25. Robbins, Stephen P., and Mary Coulter. 2016. Management, 13th ed. London: Pearson Education. [Google Scholar]
  26. Rozelle, Scott, and Johan F. M. Swinnen. 2004. Success and failure of reform insights from the transition of agriculture. Journal of Economic Literature 42: 404–56. [Google Scholar] [CrossRef] [Green Version]
  27. Santoso, Singgih. 2011. Structural Equation Modeling (Konsep Dan Aplikasi Dengan AMOS 18). Jakarta: PT Elex Media Komputindo. [Google Scholar]
  28. Sedarmayanti. 2017. Perencanaan dan Pengembangan Sumberdaya Manusia Untuk Meningkatkan Kompetensi, Kinerja, Dan Produktivitas Kerja. Bandung: PT Refika Aditama. [Google Scholar]
  29. Solimun. 2012. Pemodelan Persamaan Struktural Generalized Structured Component Analysis (GSCA). Malang: Universitas Brawijaya. [Google Scholar]
  30. Soraya, Rahmat Sewa. 2018. Pengaruh Sosiologi Penduduk Perdesaan Dalam Pembangunan Pertanian Kabupaten Buton Utara; Kulinsusu: Bappeda Buton Utara.
  31. Syahra, Rushdy. 2003. Modal sosial: Konsep dan aplikasi. Jurnal Masyarakat dan Budaya 5: 1–22. [Google Scholar]
  32. Todaro, Michael P., and Stephen C. Smith. 2015. Economic Development, 12th ed. Boston: Addison-Wesley. [Google Scholar]
  33. United Nations. 2011. The Millennium Development Goals Report 2011. New York: United Nations. [Google Scholar]
Figure 1. Relationship between Variables.
Economies 10 00240 g001
Figure 2. Final Indicators for the Development of Rural Infrastructure Facilities.
Economies 10 00240 g002
Figure 3. The Final Indicator of the Rural Farmer Resource Development.
Economies 10 00240 g003
Figure 4. Final Indicators of Improved Farm Business Performance.
Economies 10 00240 g004
Figure 6. Structural Model for the Influence of Agricultural Development on Improving Farming Business Performance.
Economies 10 00240 g006
Figure 7. The Influence of Agricultural Development on Rural Poverty Alleviation.
Economies 10 00240 g007
Figure 8. Structural Model for the Influence of Improved Farm Business Performance on Rural Poverty Alleviation. Source: Processed data.
Economies 10 00240 g008
Figure 9. The Final Structural Model for how Agricultural Development Influences Rural Poverty Alleviation through Improved Farm Business Performance.
Economies 10 00240 g009
Figure 10. Mediating Variable Test.
Economies 10 00240 g010
Table 1. Goodness-of-Fit Index.
No.Goodness-of-Fit IndexCut of Value
1.Degree of Freedom (Df)Positive
2.Chi-SquareExpected to be small
3.Probability (P)>0.05
4.CMIN/DF≤3.00
5.The goodness of Fit Index (GFI)Close to 1
6.Adjusted Goodness of Fit Index (AGFI)Close to 1
7.Root Mean Residual (RMR)Close to 0
8.Normed Fit Index (NFI)Close to 1
9.Comparative Fit Index (CFI)Close to 1
10.Tucker–Lewis Index (TLI)Close to 1
11.ParsimonyRatio (PRATIO)Between 0 and 1
12.Root Mean Square Error of Approximation (RMSEA)>0.08
Table 2. Steps of the Measurement Model Analysis.
Step 1Identify individual construct
Step 2Develop and specify the model of measurement
Step 3Test the measurement model (measurement model analysis)
Step 4Check the validity of the model; valid or invalid
Step 5Test the structural model
Step 6Set the ultimate structural model
Table 3. Goodness-of-Fit Agricultural Development on Farm Business Performance.
Measures of Goodness-of-FitResultLimit ValueFit?Fit Level
Chi-squareχ222.54
ProbabilityP0.019≥0.01Good
Normed chi squareχ2/df2.06<3.0Good
The goodness of Fit IndexGFI0.96≥0.90Good
Adjusted Goodness of Fit IndexAGFI0.92≥0.90Good
Tucker–Lewis IndexTLI0.98≥0.95Good
Comparative Fit IndexCFI0.99≥0.95Good
Standardized Root Mean Square ResidualSRMR0.02≤0.05Good
Root Mean Square Error ApproximationRMSEA0.07≤0.08Good
Source: Processed data.
Table 4. Goodness-of-Fit of the Influence of Agricultural Development on Poverty Alleviation.
Measures of Goodness-of-FitResultsLimit ValueFit?Fit Level
Chi-squareχ217.12
ProbabilityP0.019≥0.01Good
Normed chi squareχ2/df2.48<3.0Good
The goodness of Fit IndexGFI0.95≥0.90Good
Adjusted Goodness of Fit IndexAGFI0.91≥0.90Good
Tucker–Lewis IndexTLI0.97≥0.95Good
Comparative Fit IndexCFI0.98≥0.95Good
Standardized Root Mean Square ResidualSRMR0.03≤0.05Good
Root Mean Square Error ApproximationRMSEA0.08≤0.08Good
Source: Analysis results.
Table 5. Goodness-of-fit of Farm Business Performance and Poverty Alleviation.
Measures of Goodness-of-FitResultsLimit ValueFit?Fit Level
Chi-squareχ222.67
ProbabilityP0.019≥0.01Good
Normed chi-squareχ2/df2.30≤3.0Good
The goodness of Fit IndexGFI0.96≥0.90Good
Adjusted Goodness of Fit IndexAGFI0.92≥0.90Good
Tucker–Lewis IndexTLI0.97≥0.95Good
Comparative Fit IndexCFI0.98≥0.95Good
Standardized Root Mean Square ResidualSRMR0.03≤0.05Good
Root Mean Square Error ApproximationRMSEA0.07≤0.08Good
Source: Processed data.
Table 6. Final goodness-of-fit for the agricultural development’s influence on poverty alleviation through improved farm business performance.
Measures of Goodness-of-FitResultLimit ValueGood Fit?Fit Level
Chi-squareχ2108.03
ProbabilityP0.022≥0.01Good
Normed chi-squareχ2/df2.671<3.0Good
The goodness of Fit IndexGFI0.95≥0.90Good
Adjusted Goodness of Fit IndexAGFI0.95≥0.90Good
Tucker–Lewis IndexTLI0.96≥0.95Good
Comparative Fit IndexCFI0.96≥0.95Good
Standardized Root Mean Square ResidualSRMR0.03≤0.05Good
Root Mean Square Error ApproximationRMSEA0.06≤0.08Good
Table 7. Data Analysis Results.
PathPath CoefficientProb.StatusDescription
Agricultural Development → Farm Business Performance0.740.019SigAccepted
Agricultural Development → Poverty Alleviation0.810.011SigAccepted
Farm Business Performance → Poverty Alleviation0.720.019SigAccepted
Publisher’s Note: MDPI stays neutral with regard to jurisdictional claims in published maps and institutional affiliations.

