Article

Maximizing Output Power in Oscillating Water Column Wave Power Plants: An Optimization Based MPPT Algorithm

Department of Electrical Engineering, Motilal Nehru National Institute of Technology, Allahabad-211004, India
*
Author to whom correspondence should be addressed.
Technologies 2018, 6(1), 15; https://doi.org/10.3390/technologies6010015
Submission received: 8 December 2017 / Revised: 13 January 2018 / Accepted: 21 January 2018 / Published: 24 January 2018

Abstract

:
This paper proposes an optimization based maximum power point tracking (MPPT) algorithm for selection of appropriate external rotor resistances of wound rotor induction generator (WRIG). The generator coupled with a Wells turbine is used in oscillating water column (OWC) wave power plants. The Wells turbine suffers with stalling behaviour that reduces the average output power significantly. Hence, the objective is to prevent aerodynamic stalling of the Wells turbine and hence maximizing the output power simultaneously. But inappropriate selection of rotor resistance leads to excessive power loss. Therefore, two approaches have been applied: (i) the rotor resistance values are selected manually by trial and error method or non-optimized approach (ii) a performance index has been derived and minimized using particle swarm optimization technique to obtain the optimized values of rotor resistance. Simulation results have been performed for turbine efficiency, output power and power loss in external rotor resistance. Finally, the proposed control approach is illustrated for two particular cases of regular and irregular waves.

1. Introduction

Our oceans covering two thirds of the earth’s surface have enormous amount of energy stored in several forms such as waves, tides, salinity, etc. The theoretically estimated ocean wave energy across all over the globe is around 2 TW [1,2]. In the past few decades, many technologies have evolved to obtain electricity from wave energy. These are generally classified into three parts: (i) Oscillating water column (OWC); (ii) Overtopping devices; and (iii) Oscillating body [3]. Out of these, the OWC wave energy conversion is widely accepted. Some of the methods for generating electrical energy from wave energy are discussed in [4,5,6,7].
Ocean waves have wide range of uncertainties which in turn create distorted electrical output. Hence, the role of control system becomes essential to achieve desired responses of wave energy conversion systems. A recent detailed survey of control methods for wave energy converters is given in [8]. In the context of OWC based Wells turbine generator system, the control objectives can be broadly classified as: (i) Air flow control; (ii) Rotational speed control; (iii) Maximization of output power. Excess of air flow rate causes stalling losses to Wells turbine which decreases the output power significantly. This can be prevented by implementing air valves with OWC that allows the Wells turbine to work with its maximum efficiency without any stalling behaviour. The use of valves also facilitates the generation of desired amount of power by changing the valve position correspondingly. Two types of air valves, by pass valve and throttle valve, can be used and the detailed study of the same is given in [9,10]. If the Wells turbine drives a variable speed electrical generator then it allows more flexibility through rotational speed control which can be accomplished by varying the electromagnetic torque of generator through power conditioning. Turbine speed, when implemented using rotational speed control, is allowed to vary in line with highly varying and uncertain sea conditions [11,12].
In [13], the OWC equipped with a Wells turbine and a slip ring induction generator (SRIG) was studied. The rotor side of the SRIG was connected with external rotor resistances so as to change the rotor slip according to variations in the chamber pressure. This study was mainly concerned for improving the OWC plant performance at Trivandrum, India [14,15]. The Wells turbine stalling problem was addressed where it was desired to limit the turbine flow coefficient under certain threshold value by regulating the rotor speed. The two resistance switching and continuous resistance switching control methods were proposed for rotational speed control. The control block was based on a look-up-table (LUT) with input as the chamber pressure and output as the external rotor resistance. The advanced versions of [13] could be found in [16,17,18] which were based on different power electronic converter control arrangements. The work carried out in [13] was also applied to solve the control issues of OWC plant of Mutriku harbour, Basque Country, Spain [19]. The external rotor resistance switching strategies were proposed in [20,21,22,23]. In these studies, the main focus was to avoid the Wells turbine stalling behaviour. Studies in [20,21,22] were quite similar to [13] in terms modelling and control strategy whereas [23] proposed rotational speed control using neural network (NN). The NN approach was applied to train the LUT which was based on the chamber pressure and external rotor resistance as the input and output data respectively.
The external rotor resistance switching strategies proposed in the recent past were used for maximum power point tracking (MPPT) and for preventing Wells turbine stalling behaviour. The external rotor resistance switching strategies [13,20,21,22,23] were based on LUT prepared manually or with NN approach which does not provide the optimum results. Hence, there is a need of some optimization techniques to achieve the best outcome with optimised LUT based maximization of output power of OWC.
The present study proposes the maximization of output power of Wells turbine-generator based OWC wave power plant. Inappropriate selection of rotor resistance value leads to undue loss of power across it. Hence, the external rotor resistances have been picked using manual or trial and error or non-optimization approach initially and later using optimization approach. For optimization approach, a performance index has been formulated to calculate the optimized values of rotor resistances under different amplitudes and frequencies of the ocean waves. The performance index is minimized using particle swarm optimization (PSO) which in turn gives the optimum values of rotor resistances. The simulation studies have been performed with regular waves to achieve the maximized output power without any stalling losses at the turbine and minimized power losses across external rotor resistance. Finally, the proposed optimization approach has been validated under regular and irregular sea waves.
The rest of the paper is divided into the following sections: Section 2 explains the modelling of Wells turbine-generator system of OWC. Problem formulation is discussed in Section 3. The method to obtain maximized average power is given in Section 4. Numerical simulations and their outcomes are discussed in Section 5. Section 6 provides the concluding remarks. The references are listed in the end of the paper.

2. Modelling of OWC Wave Power Plant

The oscillating water column is classified as shoreline method for converting ocean wave energy (Figure 1). As shown in the figure, the OWC chamber is a four-walled tank opened at the bottom to receive the oscillations of water level due to sea waves travelling towards coastal line. The OWC chamber is partly underwater and partly filled with air in the upper portion. At the top of the water column, a Wells turbine is mounted that drives the wound rotor induction generator (WRIG) connected to it through a gearbox. The chamber air is compressed and decompressed based on rise and fall in sea water level. Hence, the airflow caused by oscillatory motion of water is also oscillatory or bidirectional in nature but irrespective of it the Wells turbine is designed in such a way that its rotation is always unidirectional.

2.1. Mathematical Background of Ocean Waves

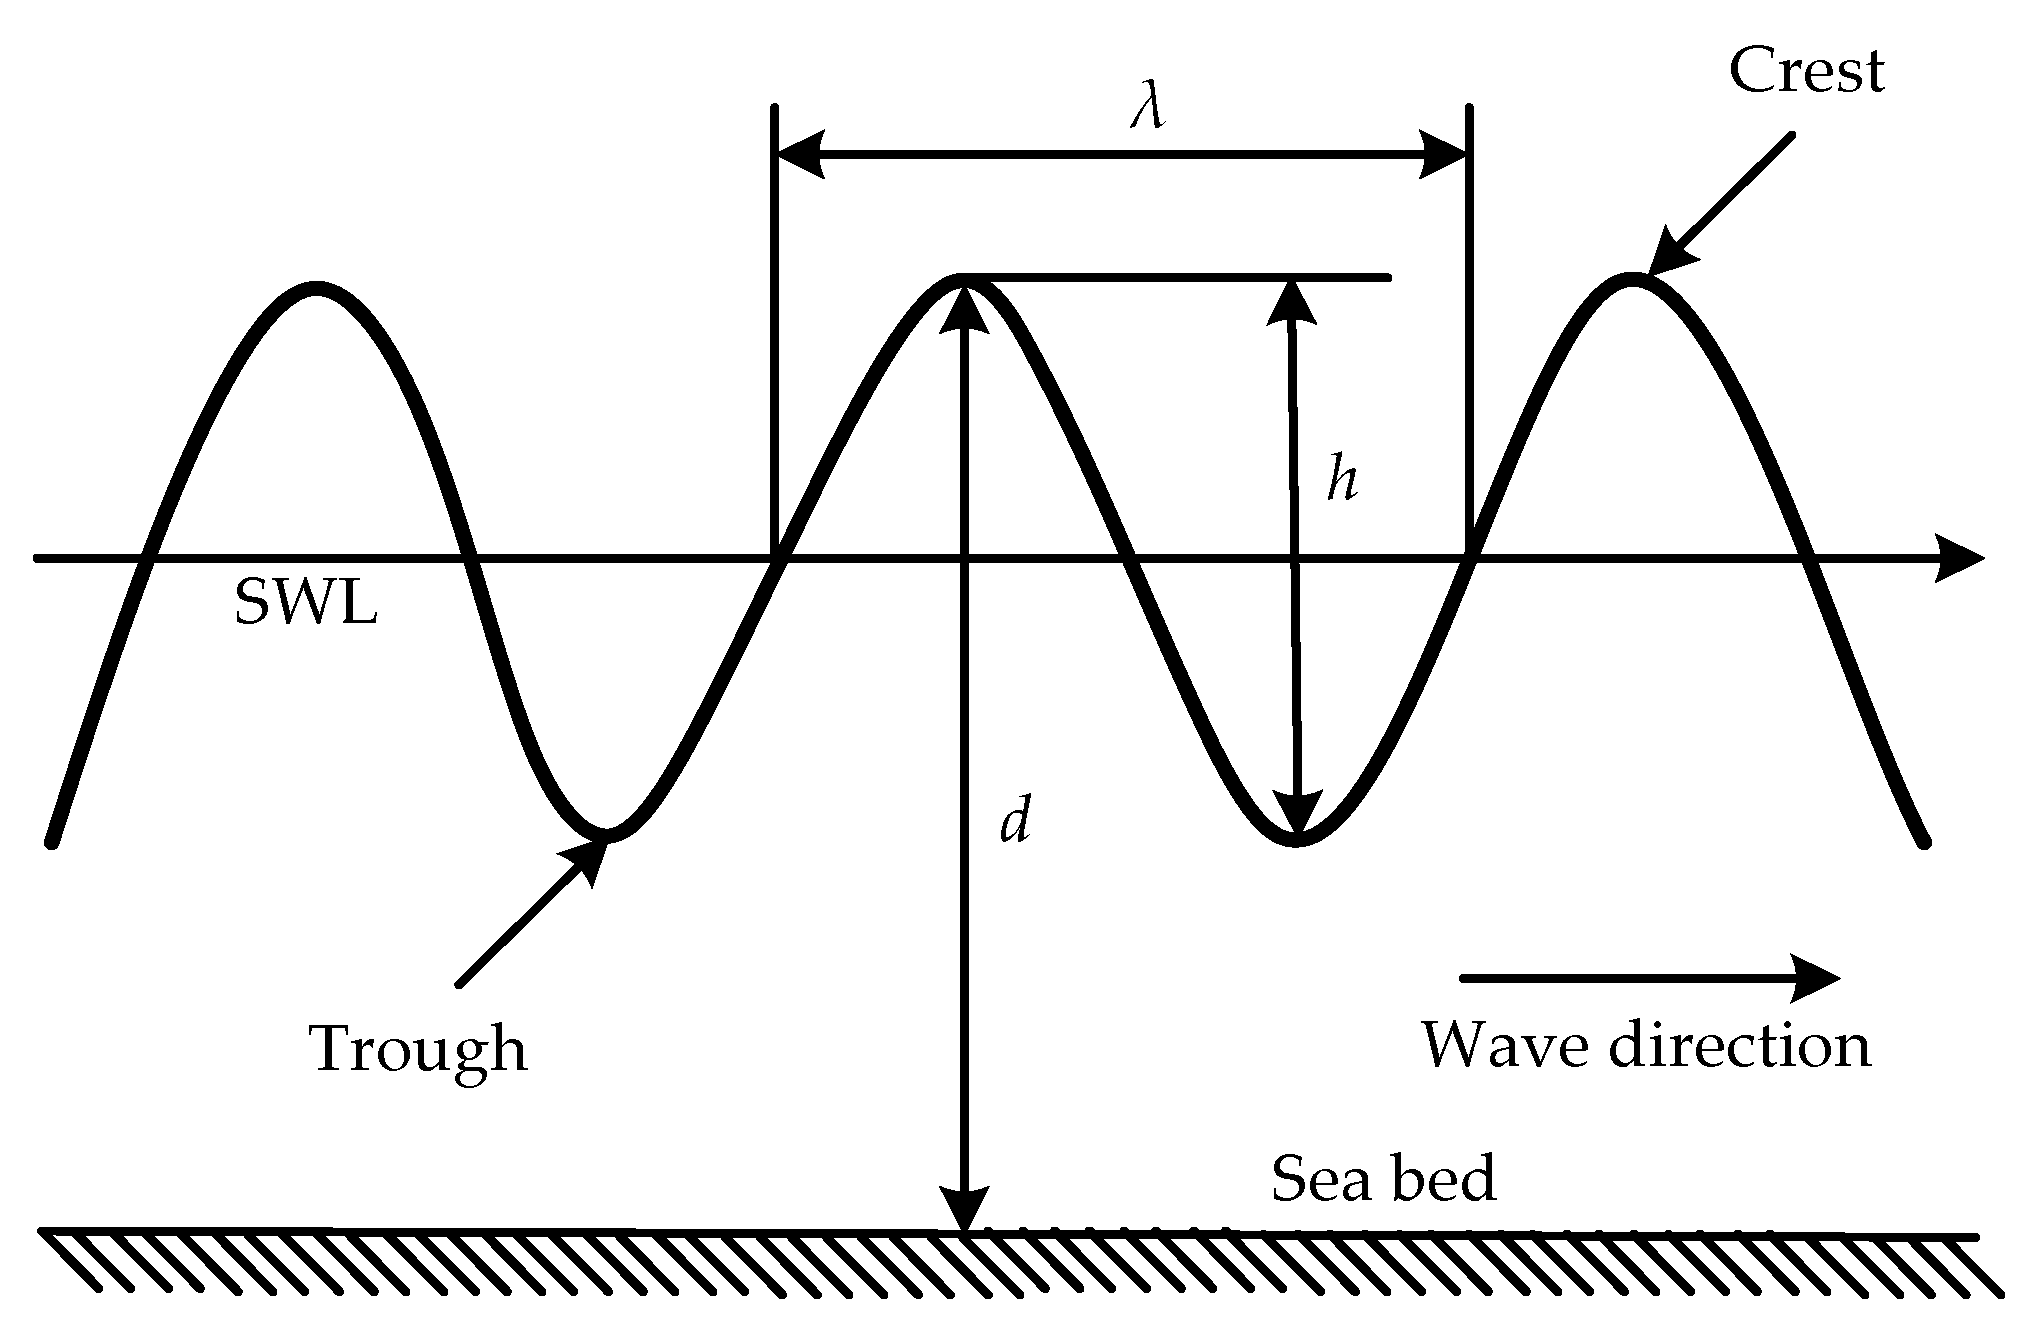
Ocean waves are generated by wind or storm striking to the sea surface very far from seashore or by locally generated winds. This wind strike creates swells of water that reach towards coastal line in the form of waves. Many water wave theories have been proposed to study the characteristics of ocean waves [24,25]. As shown in Figure 2, the upper peak of wave is called crest while the lower peak as trough. The wave height (h) is the distance from crest to trough. The wavelength (λ) is the length between two consecutive troughs or crests whereas the sea depth (d) is the distance from sea bottom to still water level (SWL).
The wave energy is generally defined as wave power per meter of the sea wave front [24]. Hence, the wave front power is expressed as:
P w a v e f r o n t = ρ w g h 2 λ 16 T [ 1 + 4 π d / λ s i n h ( 4 π d / λ ) ] ( W / m )
where, ρw is water density (Kg/m3), g is the constant of gravitation (9.81 m/s2), T is the time period of one wave cycle (s).
The input power available at the duct of the turbine is dependent on the flow rate of air same as the wind power. The input power is given by:
P i n = ( d P + ρ v x 2 / 2 ) v x a t
where, Pin is the input power available for the turbine (W); dP is the differential pressure at the duct of turbine (Pa); ρ is the density of air (Kg/m3); vx is the air speed (m/s); at is the cross-sectional area of duct (m2).

2.2. Wells Turbine

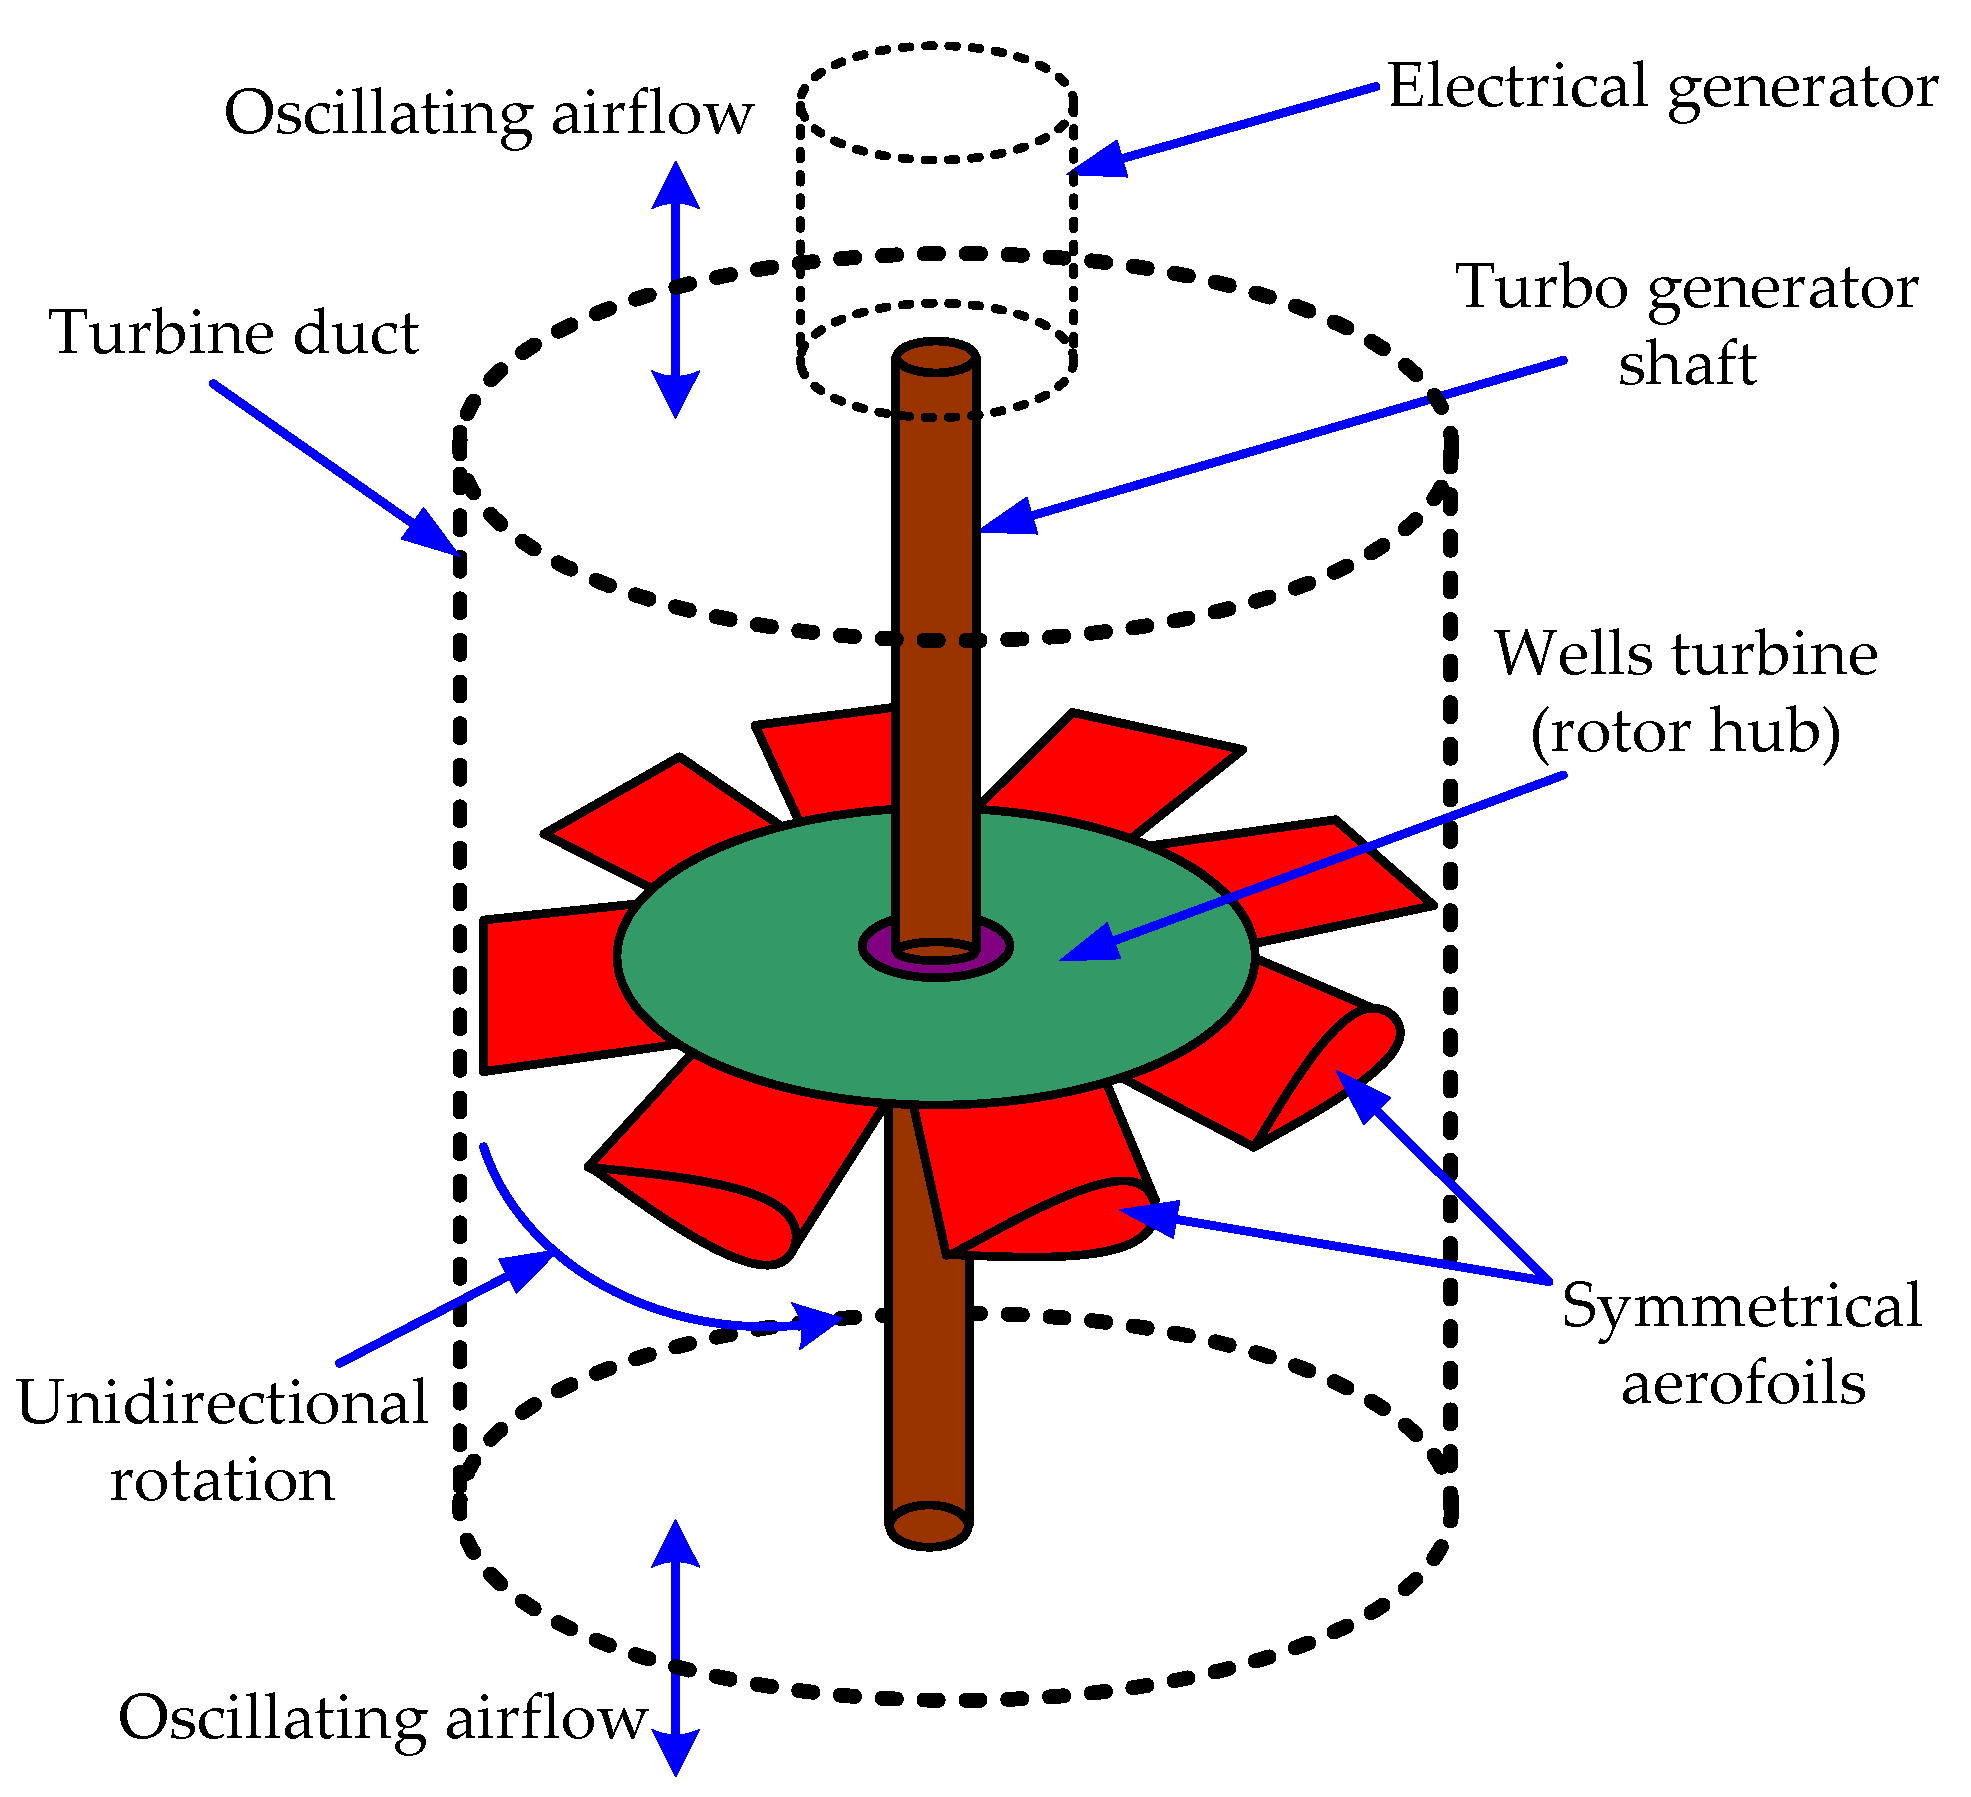
The Wells turbine has the input as air flow inside the OWC chamber that creates oscillatory pressure drop across the turbine rotor as shown in Figure 3. The wells turbine is designed in such a way that it converts bidirectional air flow into unidirectional rotatory motion which drives the generator [26,27,28,29].
The mathematical equations of the Wells turbine are [26]:
C a = ( d P a t ) / ( k t [ v x 2 + ( r ω t ) 2 ] )
C t = T t / ( k t r [ v x 2 + ( r ω t ) 2 ] )
T t = d P ( C t / C a ) r a t
P t = T t ω t
ϕ = v x / ( r ω t )
q = v x a t
η t = ( T t ω t ) / ( d P q ) = C t / ( C a ϕ )
k t = ρ b l n t / 2
where, Ca is turbine power coefficient, Ct is turbine torque coefficient, Tt is turbine torque (N-m), Pt is turbine power, q is air-flow rate (m3/s), φ is turbine flow coefficient, ωt is turbine speed (rad/s) ηt is turbine efficiency, r is mean radius (m), l is length of blade chord, b is the height of blade, nt is number of turbine blades, kt is a constant (kg/m).
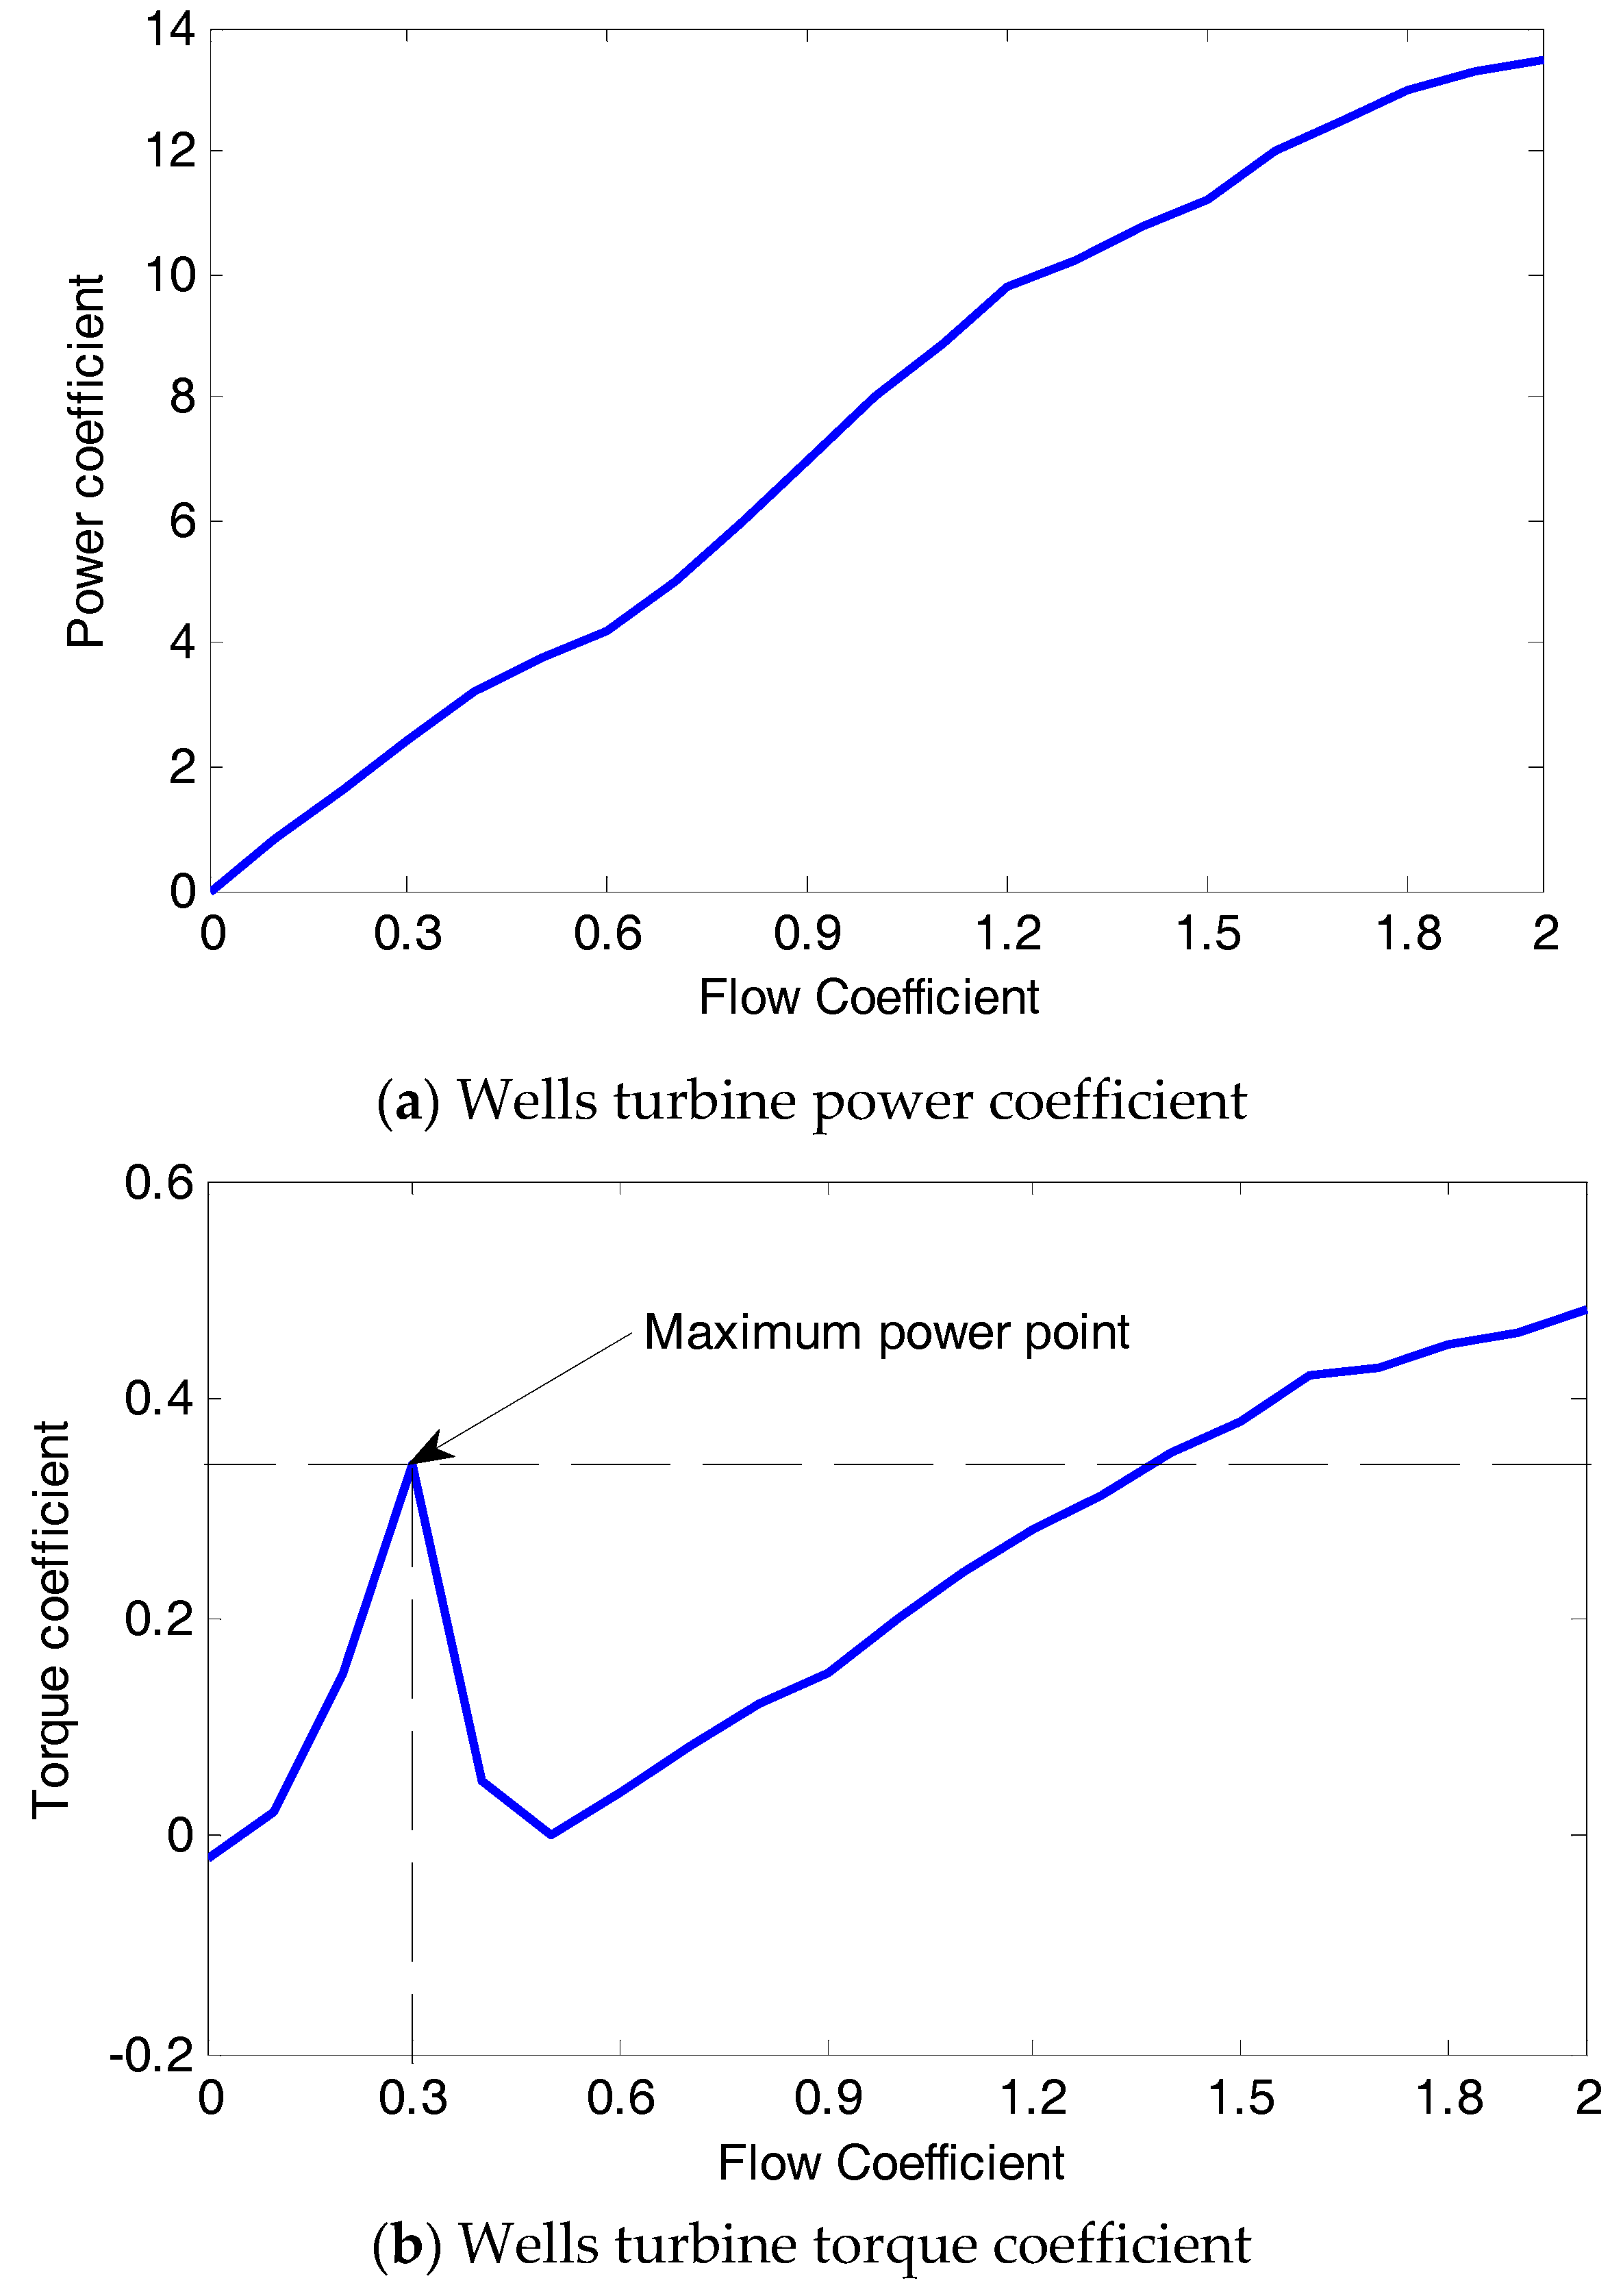
Equation (9) suggests that Wells turbine efficiency depends on the values of coefficients of flow, power and torque. The variation in coefficients of power and torque against the coefficient of flow for a typical Wells turbine is shown in Figure 4. The flow coefficient is directly proportional to air flow velocity as given in Equation (7). So, as air flow velocity is increased, the flow coefficient is also increased, which results into higher torque coefficient (Ct). However, this increase is limited to critical flow coefficient value of 0.3 as can be seen in Figure 4b. Thereafter, due to stalling phenomenon, the turbine efficiency drops significantly. The analysis on efficiency of Wells turbine is discussed in the next section.

2.3. Wound Rotor Induction Generator Equations

The d-q equivalent generator model has been considered in this paper [27,30]. The mathematical equations of the stator and rotor voltages are:
d d t ψ d s = R s L r K ψ d s + ω e ψ q s + R s L m K ψ d r + V d s
d d t ψ q s = ω e ψ d s R s L r K ψ q s + R s L m K ψ q r + V q s
d d t ψ d r = R r L m K ψ d s R r L s K ψ d r ( ω r ω e ) ψ q r + V d r
d d t ψ q r = R r L m K ψ q s + ( ω r ω e ) ψ d r R r L s K ψ q r + V q r
The expressions for the electro-magnetic torque (Te) and the output power (Pg) are:
T e = M ( ψ q s ψ d r ψ d s ψ q r )
P g = T e ω r
The relationship between currents and flux linkages are given by:
ψ q s = L s i q s + L m i q r ; ψ d s = L s i d s + L m i d r ψ q r = L r i q r + L m i q s ; ψ d r = L r i d r + L m i d s L s = L l s + L m ; L r = L l r + L m }
where, M = 3 2 ( p 2 ) ( L m K ) ; K = L s L r L m 2 ; R s , R r : Stator and rotor resistance ( Ω ); L s , L r : Total stator and rotor inductance (H); L l s , L l r : Stator and rotor leakage inductance (H); L m : Magnetizing inductance (H); v q s , v q r : q-axis stator and rotor voltage (V); v d s , v d r : d-axis stator and rotor voltage (V); i q s , i q r : q-axis stator and rotor current (A); i d s , i d r : d-axis stator and rotor current (A); ψ q s , ψ q r : q-axis stator and rotor flux (Wb); ψ d s , ψ d r : d-axis stator and rotor flux (Wb); ω e , ω r : Stator power supply frequency and rotational speed (rad/s); p: Number of poles; T e : Electro-magnetic torque (N-m).
The Wells turbine generator system coupling is given by:
J ( ω r / t ) = g b T t T e
where, J is moment of inertia of the coupled system (kg m2), gb is gear-box ratio and gb = ωt/ωr.

3. Problem Formulation

3.1. Turbine Performance without Control

If the amplitude of pressure oscillations is increased due to incident waves of high amplitude, the value of flow coefficient exceeds the limit of 0.3. This in turn results into stalling behavior in Wells turbine, reducing the average turbine torque. This stalling behavior limits the overall performance of Wells turbine-SRIG system in terms of its turbine efficiency and generator output power.
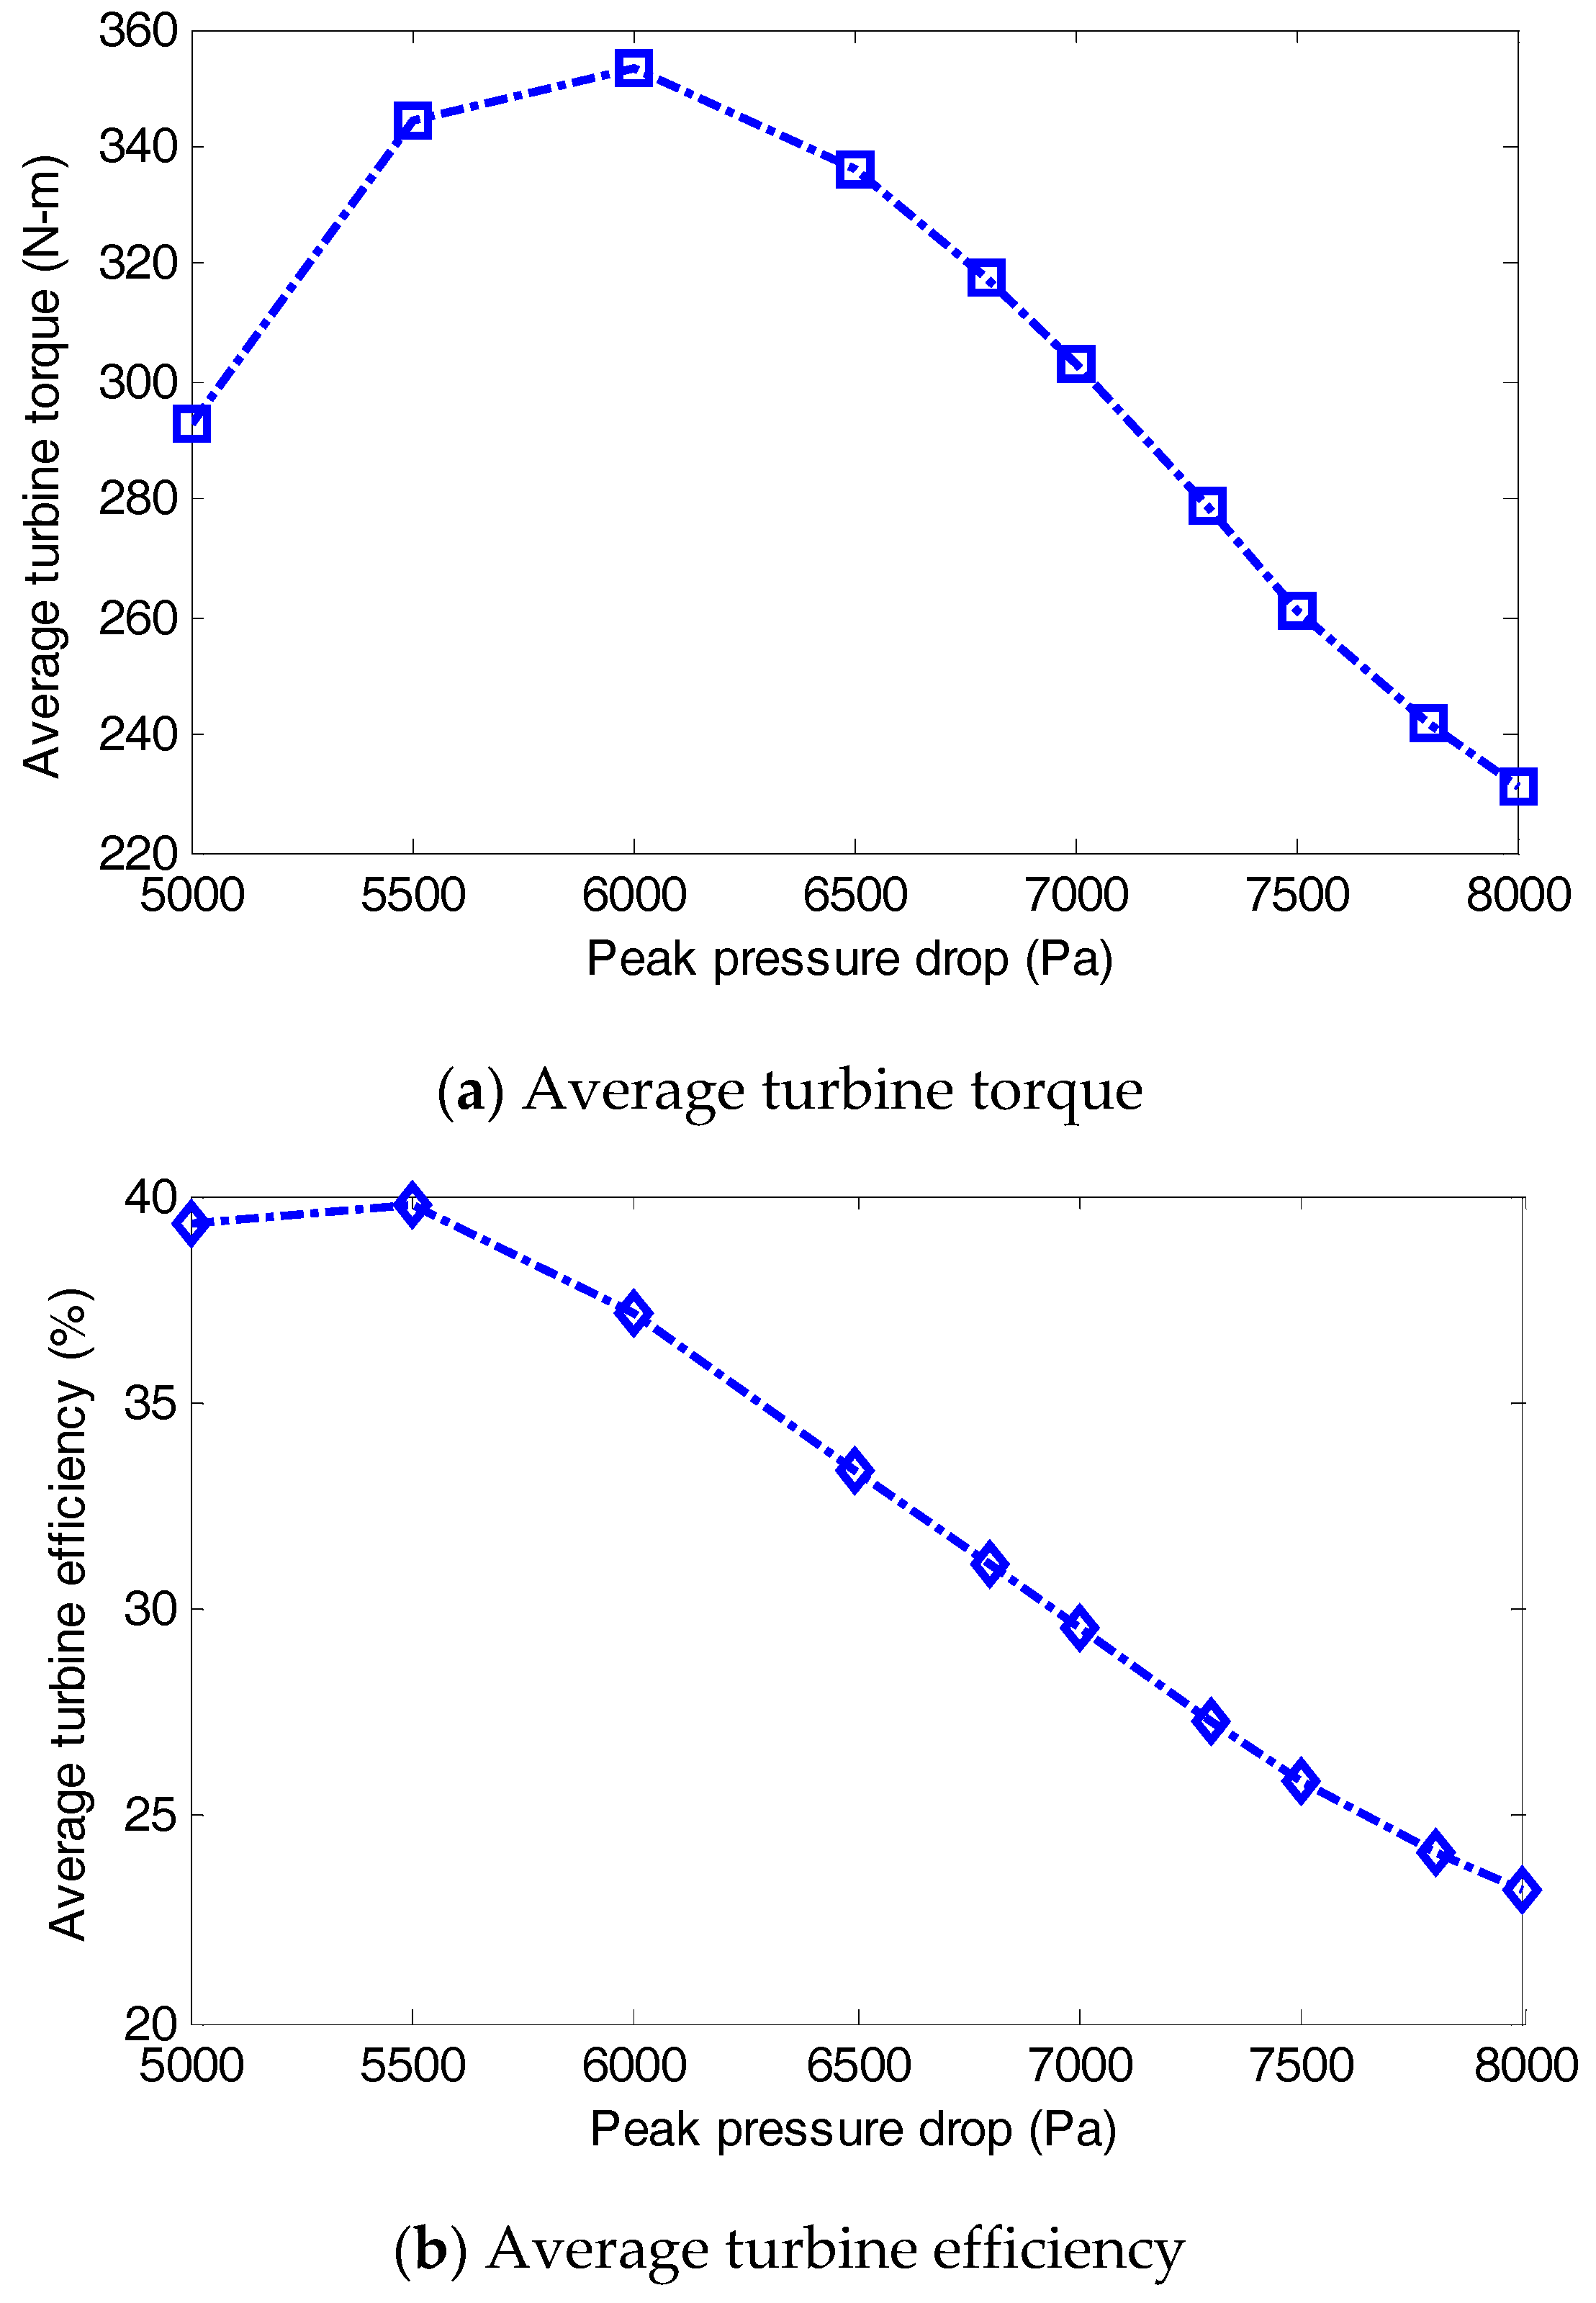
For uncontrolled case, variations in average turbine torque ( T t ¯ ) for various pressure amplitudes can be seen in Figure 5a. As observed, average torque increases in low pressure regime but for higher pressure range, it rolls down due to stalling of turbine. The mean efficiency [29] of the turbine ( η ¯ t ) can be written as:
η ¯ t = ( 1 T 0 T ( T t ω r ) d t ) / ( 1 T 0 T ( d P Q x ) d t )
Figure 5b shows the variation in average efficiency of the Wells turbine with respect to changes in pressure amplitude. It is clear that the turbine efficiency falls from 40% to 23% as pressure varies from 5000 Pa to 8000 Pa because of the stalling of turbine. Thus, regardless of higher pressure values, average output power remains low. This necessitates the implementation of an efficient control strategy so as to achieve the maximized output power and also to avoid the Wells turbine stalling.

3.2. Why Appropriate Rotor Resistance?

The addition of rotor resistance controls the rotational speed of the WRIG but also incurs losses. The expression for power loss across externally connected rotor resistances can be given as:
P L = 3 I r 2 R e x t
where, Ir is the rotor current, Rext is external rotor resistance.
For a particular pressure drop condition (i.e., dP = |7000 sin (0.314t)| Pa) inside OWC, the variation in generated power (Pg) and power loss (PL) across Rext versus Rext is shown in Figure 6. Initially, there is increase in Pg and PL with the increase in Rext but after certain value of Rext, the Pg starts decreasing whereas PL keeps on increasing.
Therefore, for maximizing Pg and minimizing PL simultaneously, the maximum value of flow coefficient (i.e., ϕmax) must be kept just below 0.3 (say 0.29). This can be done by increasing Rext but the Rext cannot be selected randomly; otherwise the system performance would degrade in terms of additional power losses and minimized output power.

4. Maximization of Average Output Power

The proposed control scheme is shown in Figure 1. Based on different pressure drops, the rotor resistance is chosen in such a way that flow coefficient remains below 0.3. To achieve this objective, following strategies are applied in discussion: (1) the rotor resistances are selected manually in such a way that the ϕmax remains in the range 0.28 ≤ ϕmax ≤ 0.3. This approach is also called non-optimized approach. (2) The rotor resistances are optimized for a given peak reference ϕref close to 0.3. Hence, for second approach, a performance index has been formulated next.

4.1. Performance Index

Under field oriented control decoupling, the stator flux expression can be written as ψds = ψs and ψqs = 0. Therefore, from Equation (11):
0 = R s L r K ψ s + R s L m K ψ d r + V d s
As stator is connected to grid, the stator resistance can be neglected. Thus, Vds ≈ 0 and the expression for ψdr can be written as:
ψ d r = L r L m ψ s   a n d   ψ ˙ d r = 0
Now, in Equation (13), replacing Rr by (Rr + Rext) and putting Vdr = 0 gives:
0 = ( R r + R e x t ) L m K ψ s ( R r + R e x t ) L s K ψ d r ( ω r ω e ) ψ q r
( R r + R e x t ) L m K ψ s ( R r + R e x t ) L s K L r L m ψ s = ( ω r ω e ) ψ q r
( R r + R e x t ) K ψ s ( L m 2 L s L r L m ) = ( ω r ω e ) ψ q r
( R r + R e x t ) K ψ s ( K L m ) = ( ω r ω e ) ψ q r
ω r = ( ω e ( R r + R e x t ) ψ s L m ψ q r )
From Equations (7)–(27), the expression for flow coefficient can be written as:
ϕ = v x ( r g b ω r ) 1
ϕ = v x [ r g b ( ω e ( R r + R e x t ) ψ s L m ψ q r ) ] 1
ϕ max = ( v x [ r g b ( ω e ( R r + R e x t ) ψ s L m ψ q r ) ] 1 ) max
Equation (30) indicates that the flow coefficient can be modified according to rotor resistance. The value of external resistance added to rotor circuit of generator regulates the rotational speed of turbine and thus its output power (Equation (16)). The turbine speed is adjusted to avoid stalling phenomenon and keep flow coefficient at its desired value corresponding to maximum torque coefficient. Thus, to select the optimum values of rotor resistances for desired value of flow coefficient, the performance index (PI) can be defined as:
P I = ( ϕ r e f ϕ max ) 2
where, φref is reference peak of flow coefficient and φmax is the maximum value of flow coefficient for a particular rotor resistance corresponding to maximum average output power.

4.2. Particle Swarm Optimization

The performance index given in Equation (31) has been minimized using PSO [31,32] a population-based optimization technique. The PSO has been chosen for optimization purpose in this work due to its wider acceptance and popularity among research community as compared to other kinds of algorithms. Some recent application of PSO in renewable energy can be found in [33,34]. The following steps are involved in PSO algorithm:
Step 1: Initialization of particles with random position and velocity vectors. Evaluation of the fitness values of each the particles.
Step 2: Updating the individual best positions (pbest) and global best positions (gbest) according to best or minimum fitness values.
Step 3: Updating the velocity and position of particles in each iteration given as:
v i d k + 1 = w × v i d k + c 1 × r a n d ( ) × ( p b e s t , i d x i d k ) + c 2 × r a n d ( ) × ( g b e s t , i d x i d k )
x i d k + 1 = x i d k + v i d k + 1 , i = 1 , 2 , 3 , , n ; d = 1 , 2 , 3 , , m
where, k is pointer of iterations, v i k is velocity of i-th particle at k-th iteration, w is the inertia weight factor = wmax − [(wmaxwmin)/kmax] × k, wmax and wmin are the maximum and minimum values of w respectively, kmax is the total number of iterations, c1 and c2 are the cognitive and social acceleration factors, rand () represents the uniformly distributed random numbers in the range (0, 1), x i k is position of i-th particle at k-th iteration, d is the search space dimension.
The step 2 and step 3 are to be repeated until the last iteration or error criteria is obtained.

5. Simulation Results and Discussion

The Wells turbine, generator and PSO parameters for performing simulations are given in Table 1. As the focus of the proposed work is to keep the flow coefficient within its critical value and to avoid the turbine stalling condition, the peak amplitude of chamber pressure becomes the most important factor. With increase in peak of pressure amplitude, the flow coefficient breaches its critical value and the Wells turbine leads to stalling. Therefore, the variation of chamber pressure, where the information of peak pressure value is significant, can be represented by a sinusoidal waveform. In order to ensure the closeness of the sinusoidal chamber pressure to the realistic pressure pattern and evaluate the performance with MPPT algorithm, the numerical simulation is conducted over a wide range of sinusoidal pressure drops (5000 Pa to 8000 Pa) with given frequency of sea wave. The analysis of uncontrolled system in terms of turbine flow coefficient, average torque and efficiency is given Table 2. It is observed that with increase in pressure amplitude, the flow coefficient is increasing whereas average turbine efficiency and output power is decreasing.
Next, the rotor resistance values are selected manually using trial and error method as given in Table 3. The first two columns of the Table 3 are also treated as LUT for implementing MPPT algorithm. With manual LUT approach the turbine flow coefficient is not bounded completely within ϕ ≤ 0.3. Therefore the Wells turbine stalling problem remains unresolved. Though the turbine efficiency and output power has enhanced as compared to uncontrolled system but there is more possibility of enhancing these parameters with optimised LUT.
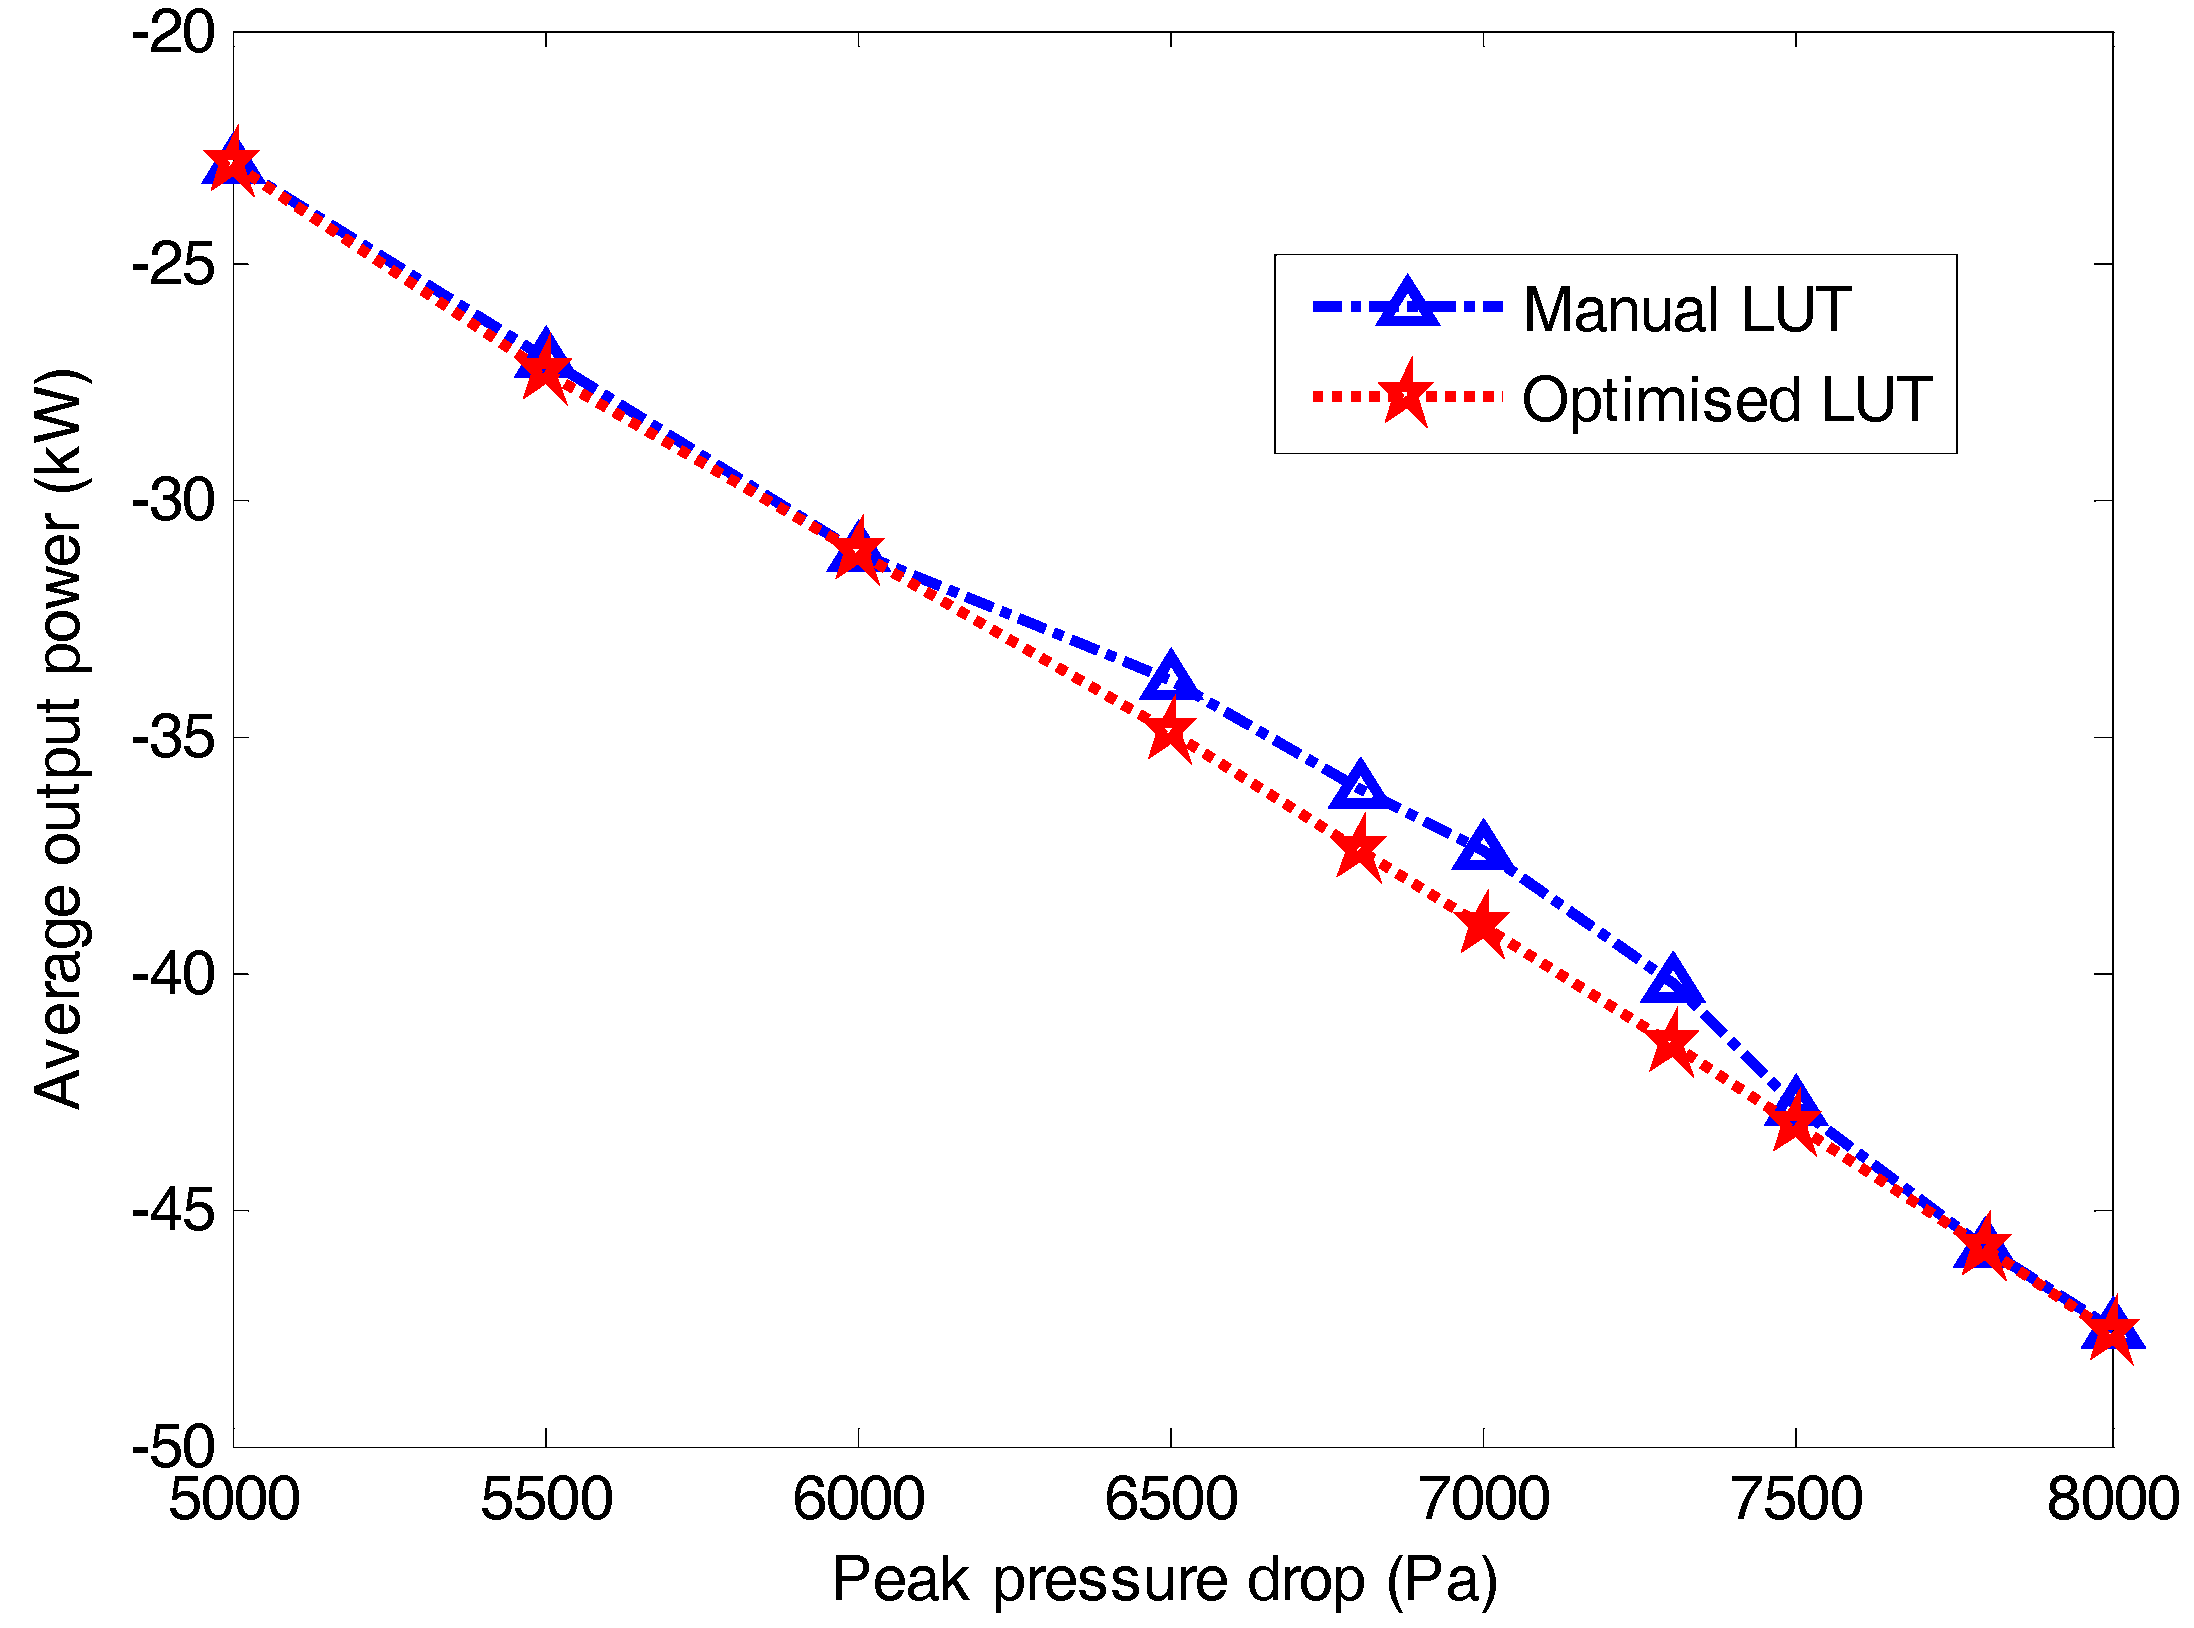
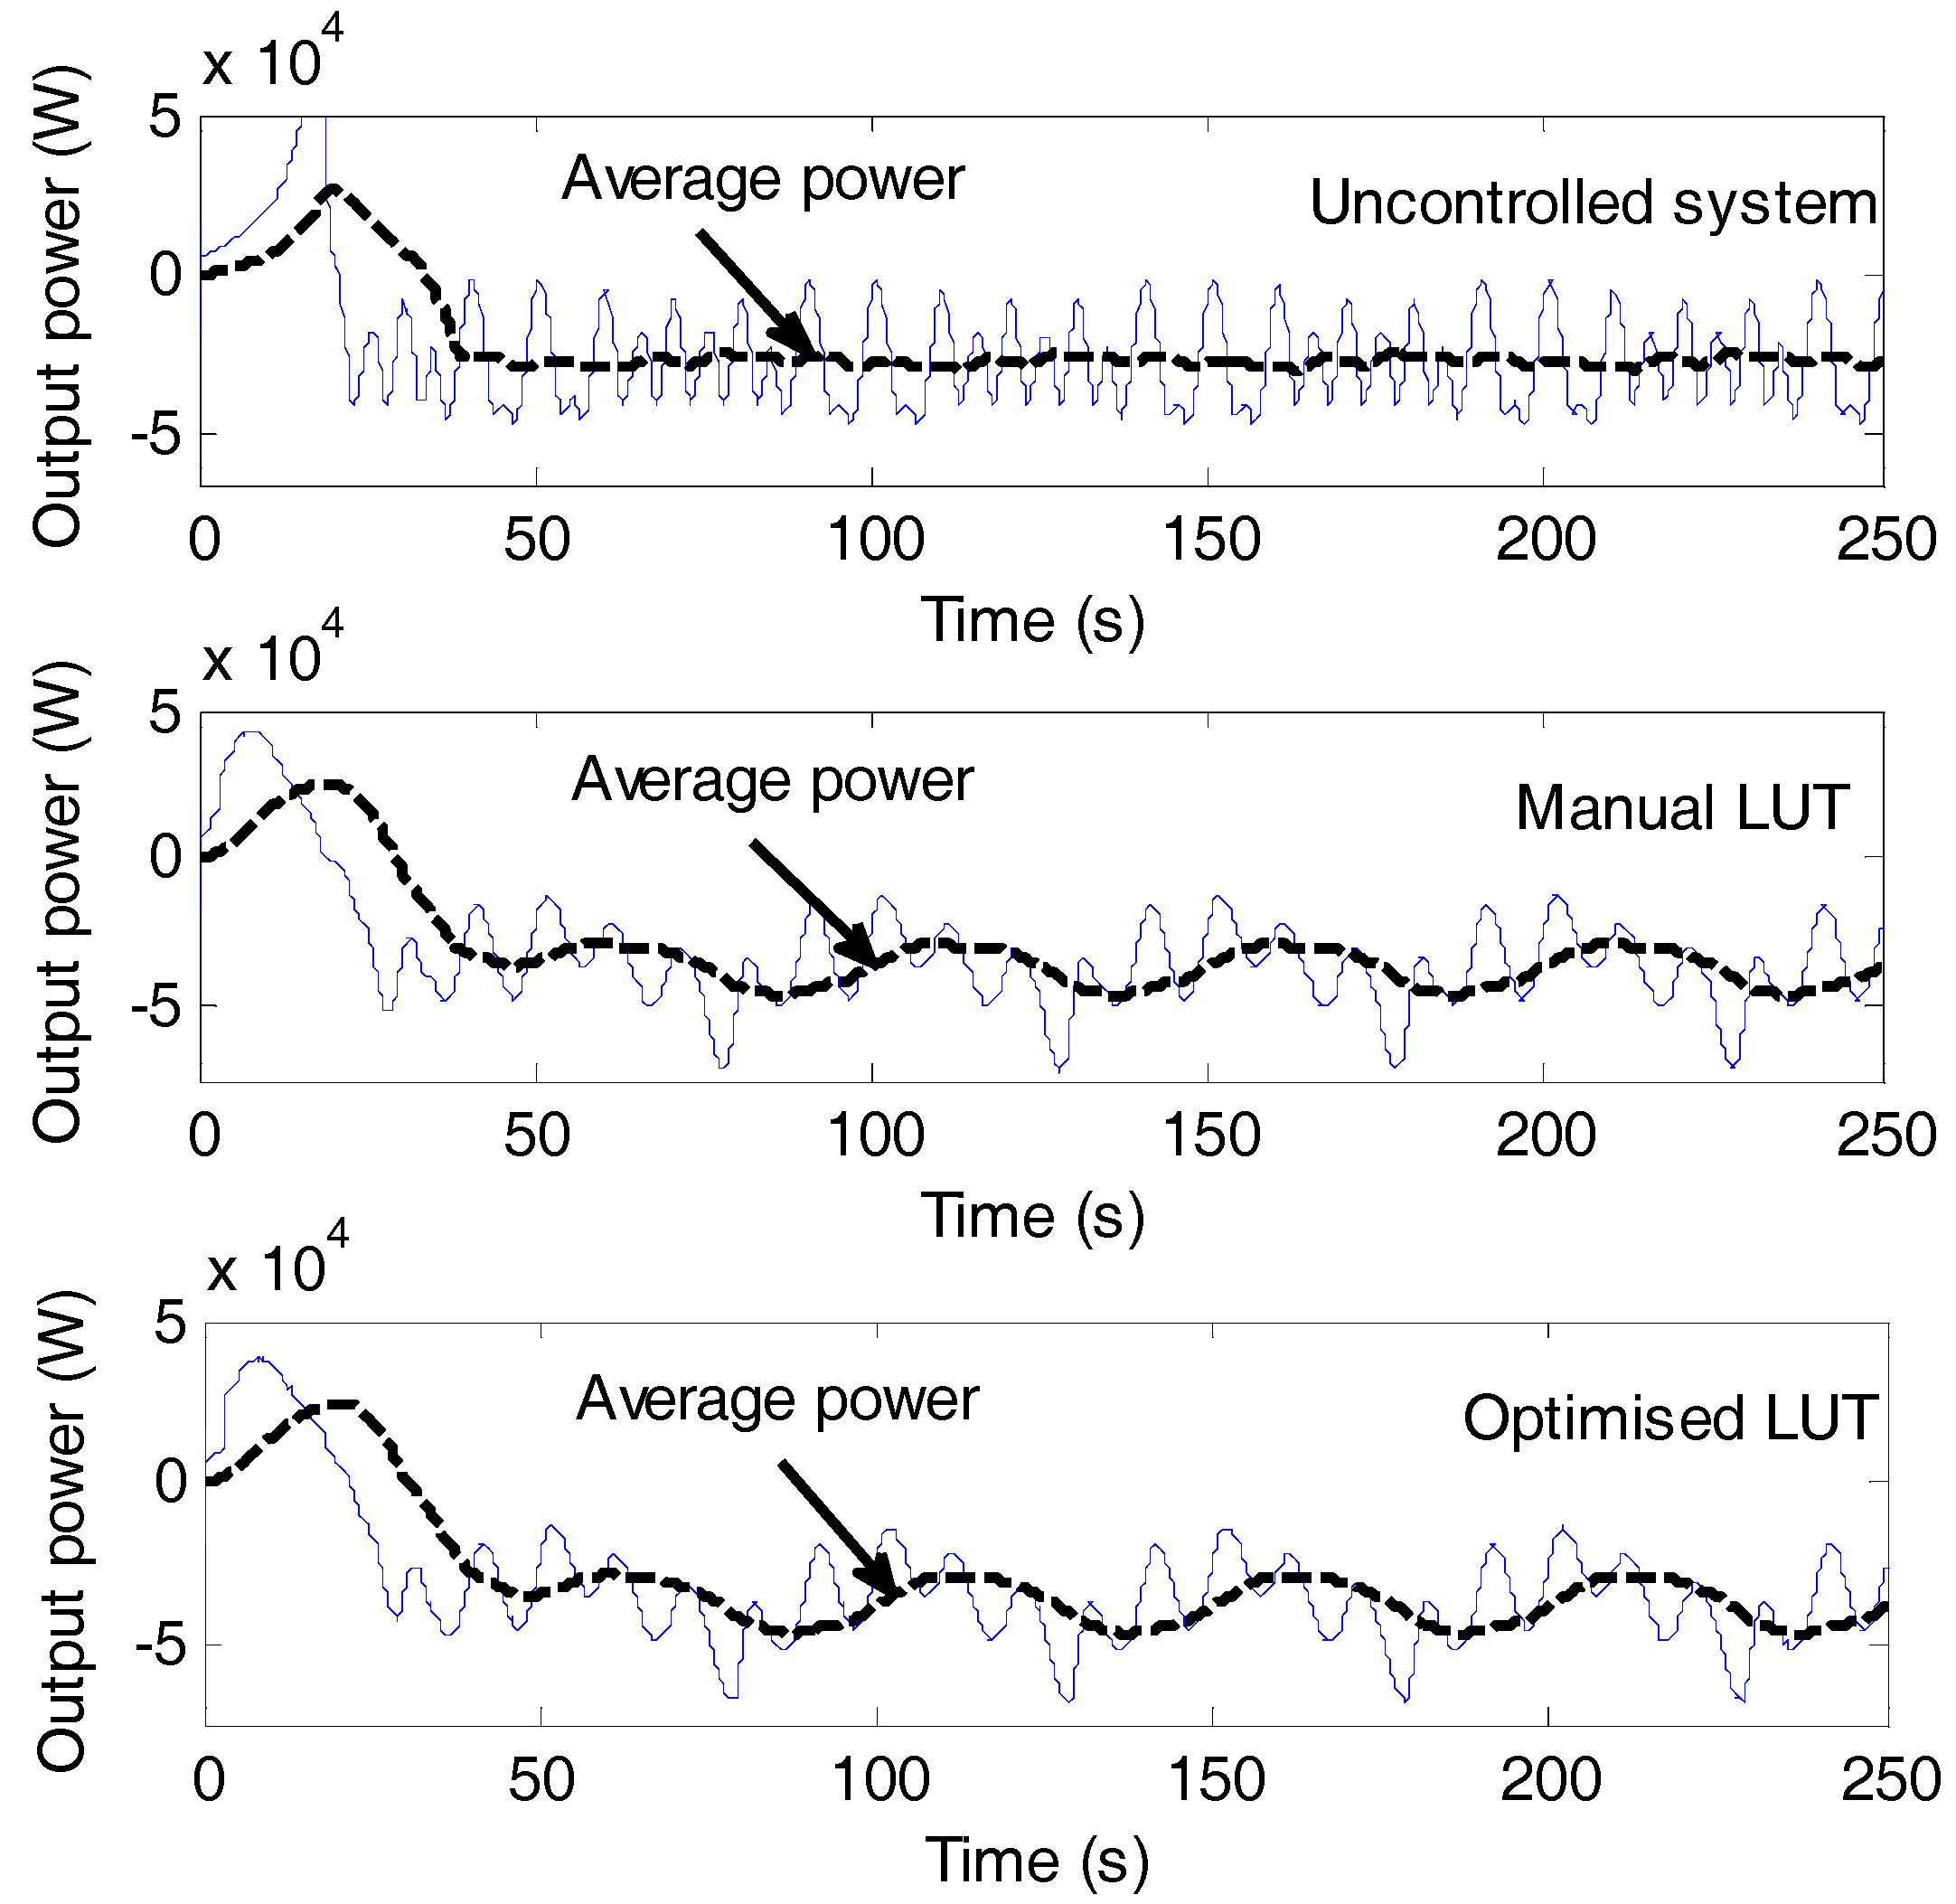
Now, the effectiveness of the proposed MPPT algorithm with optimised LUT for maximizing the turbine efficiency and electrical output power is studied. Simulation results are given in Table 4 wherein the flow coefficient is completely bounded within ϕ ≤ 0.3 and the turbine efficiency and output power has enhanced to more higher values than it was with manual LUT. A comparative analysis of output power for manual and optimised LUT is also shown in Figure 7. The overall power extraction for dP = |7000 sin (0.314t)| Pa is provided in Table 5 wherein the power loss across Rext is also taken into account. In this situation as well the optimised LUT approach provides better results than the uncontrolled and manual LUT.
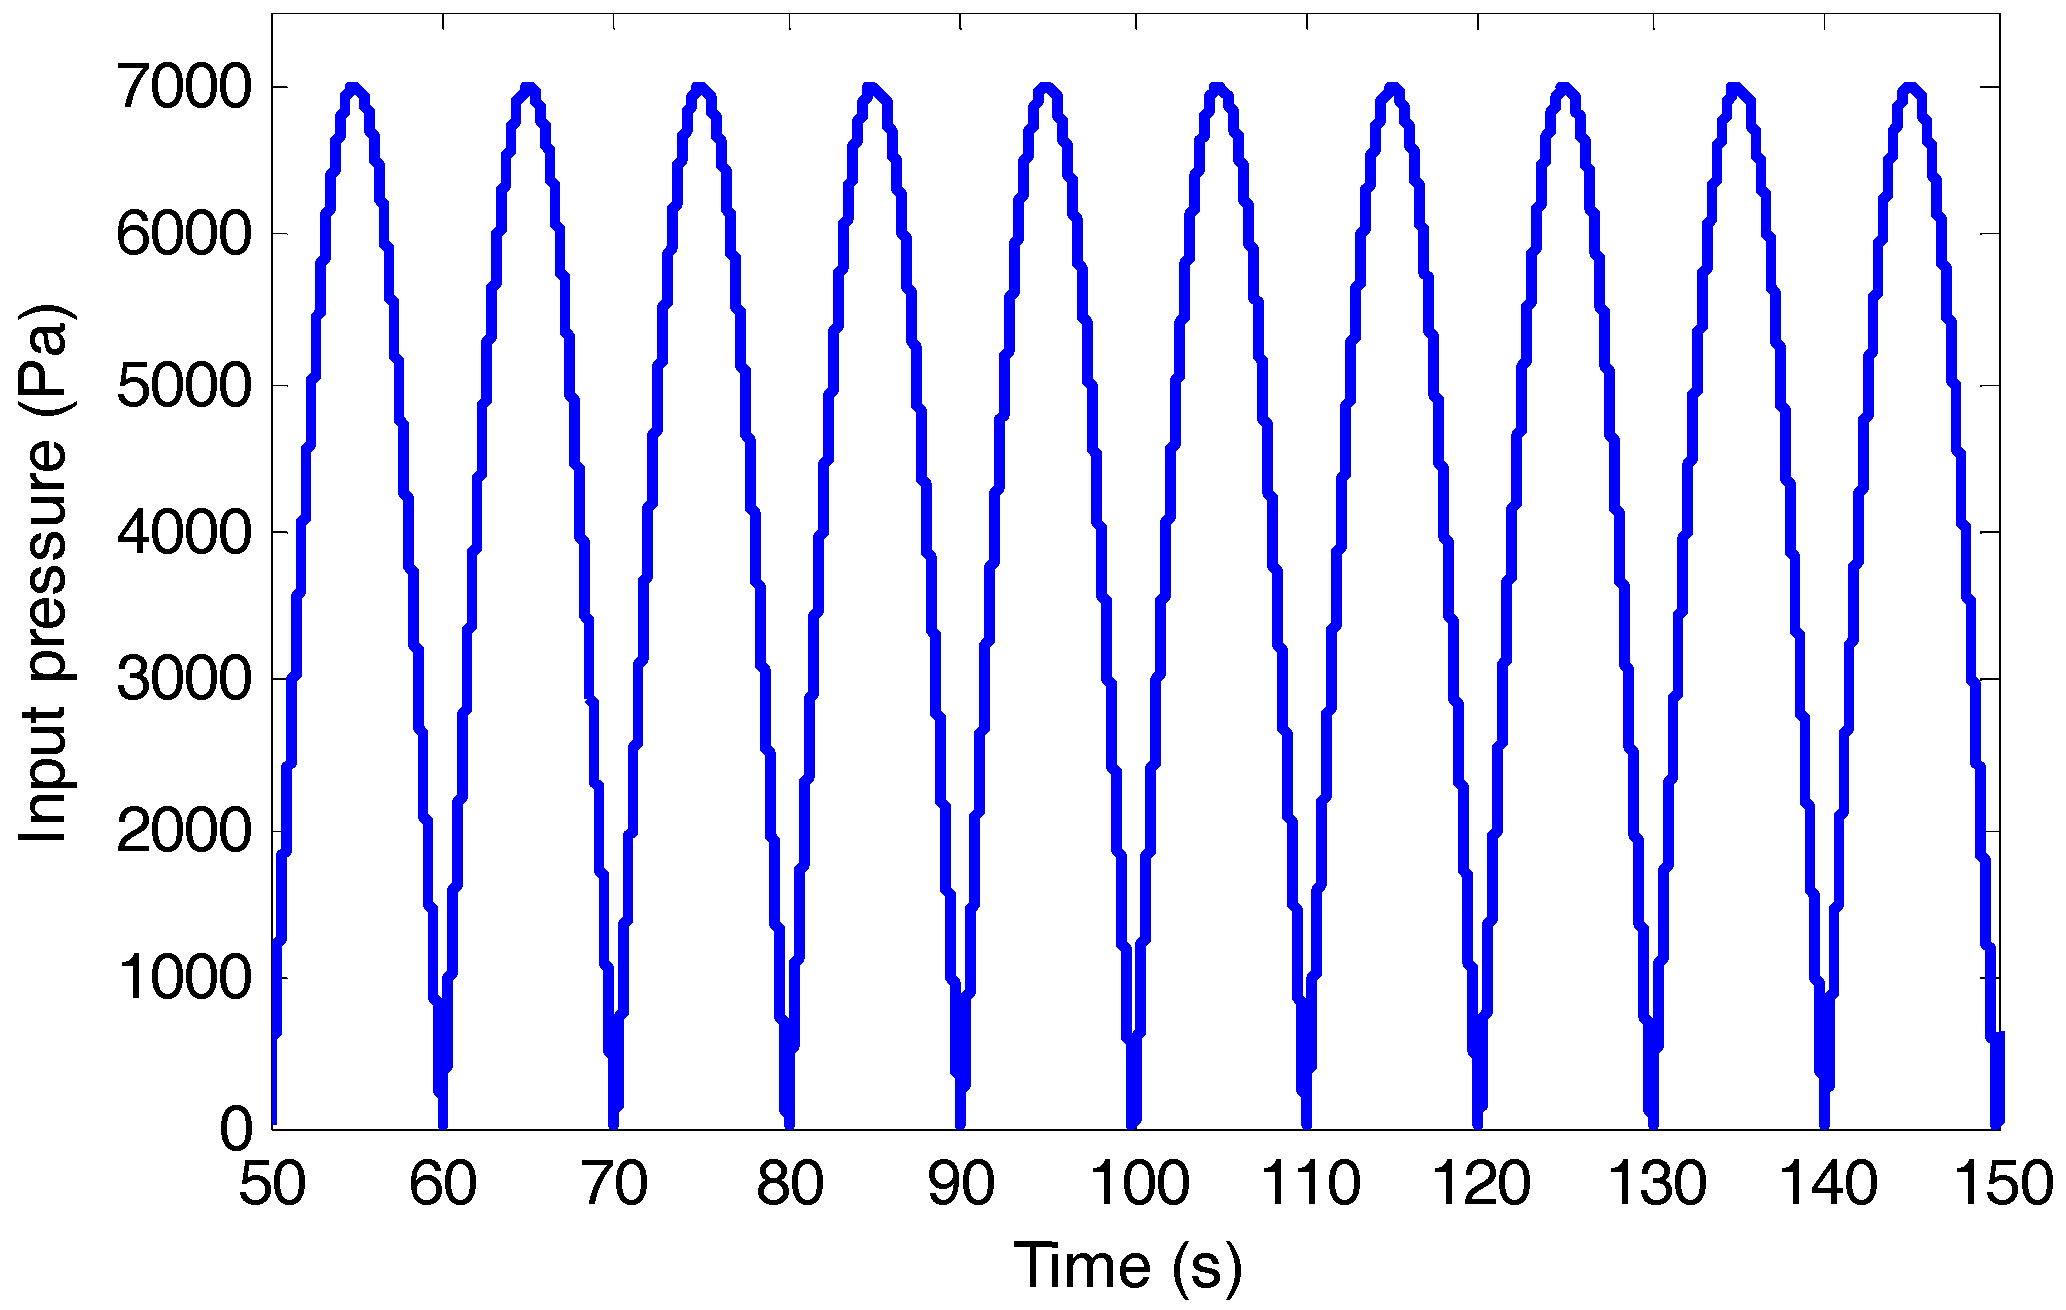
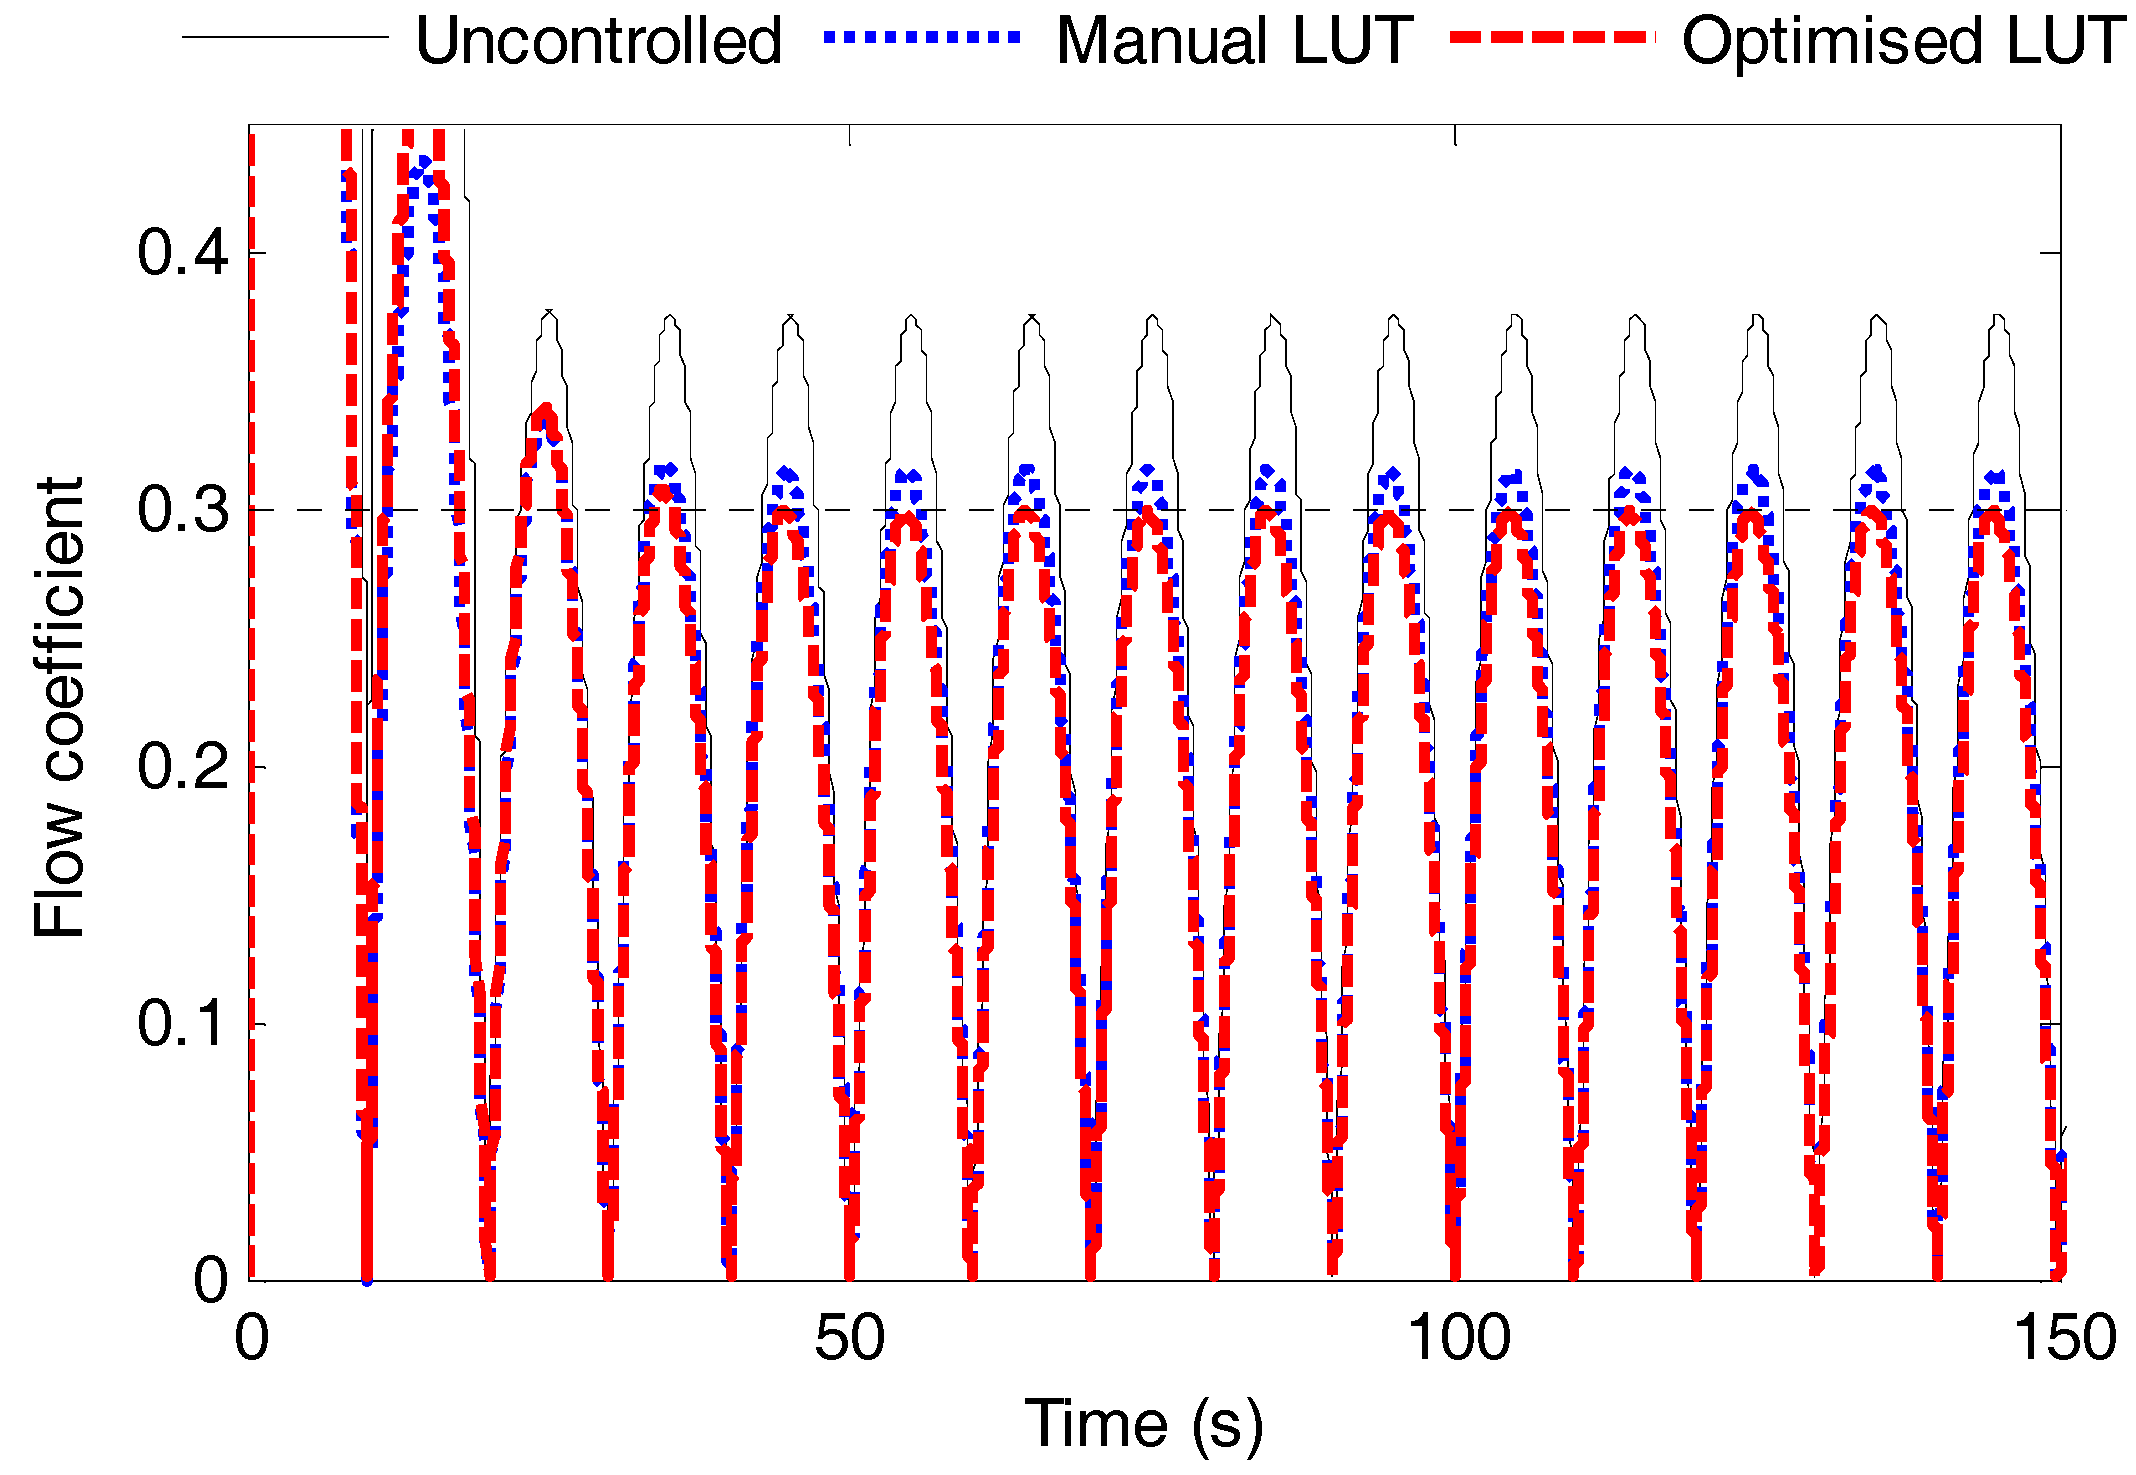
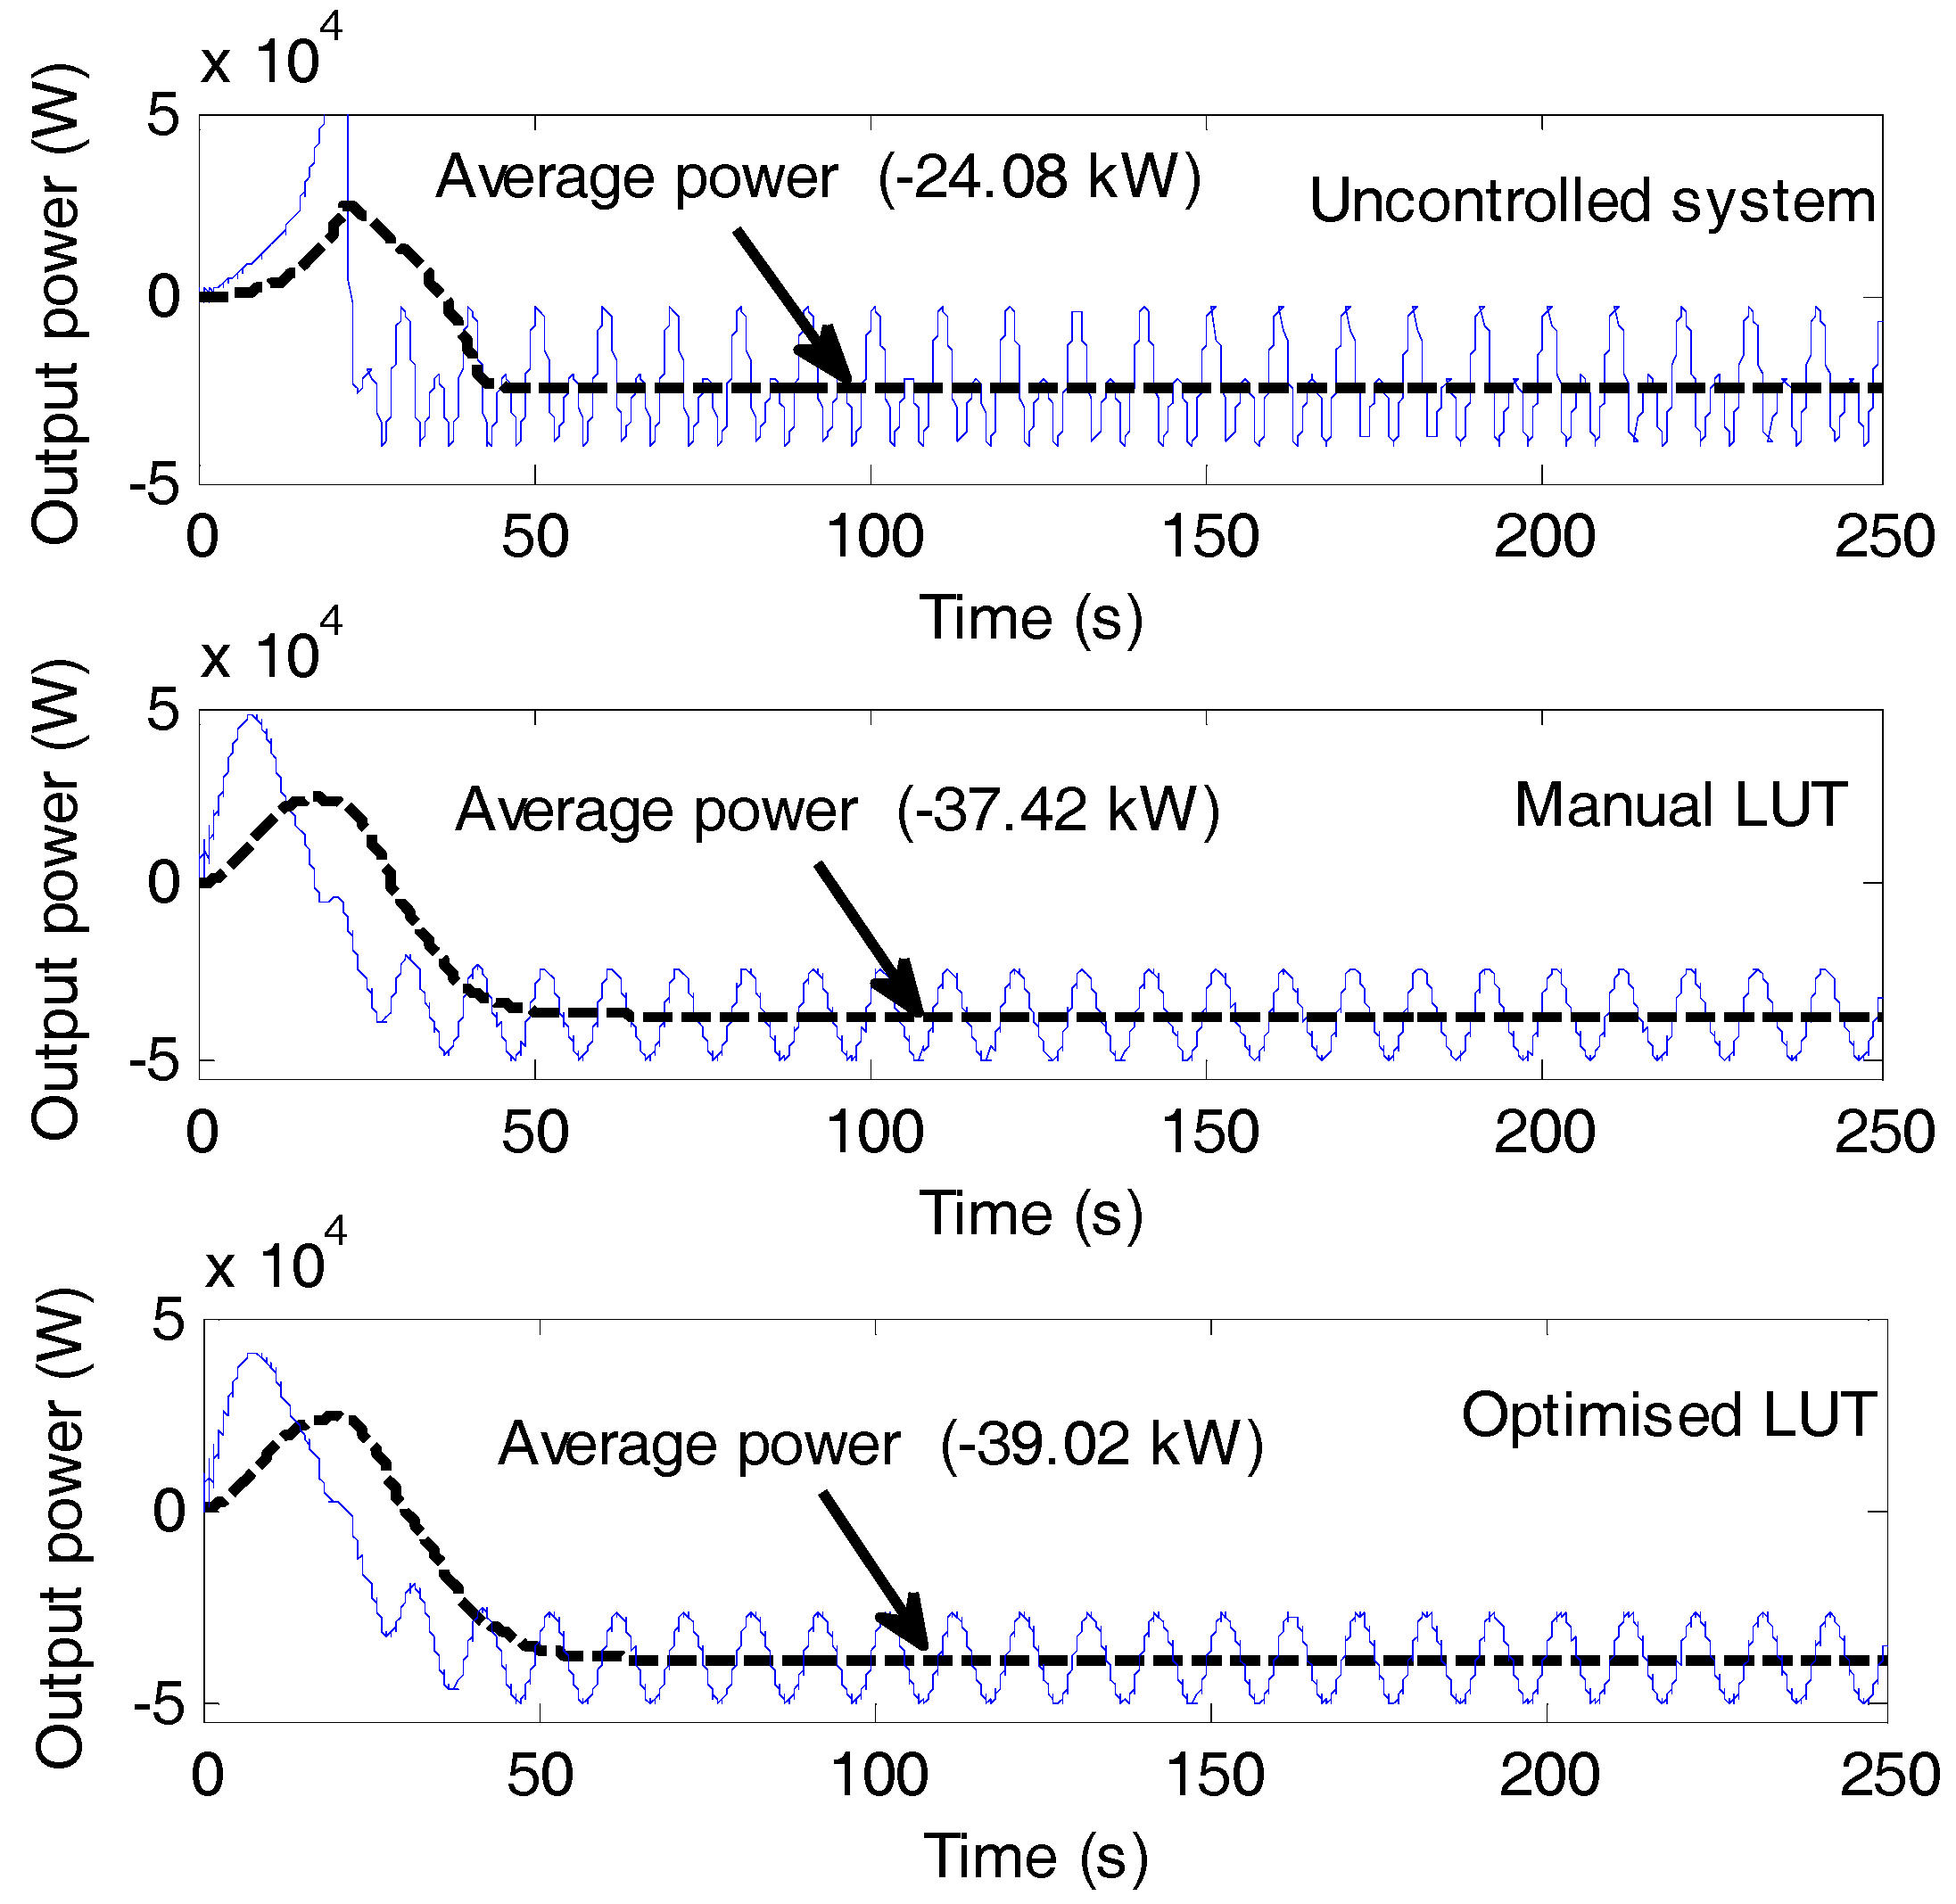
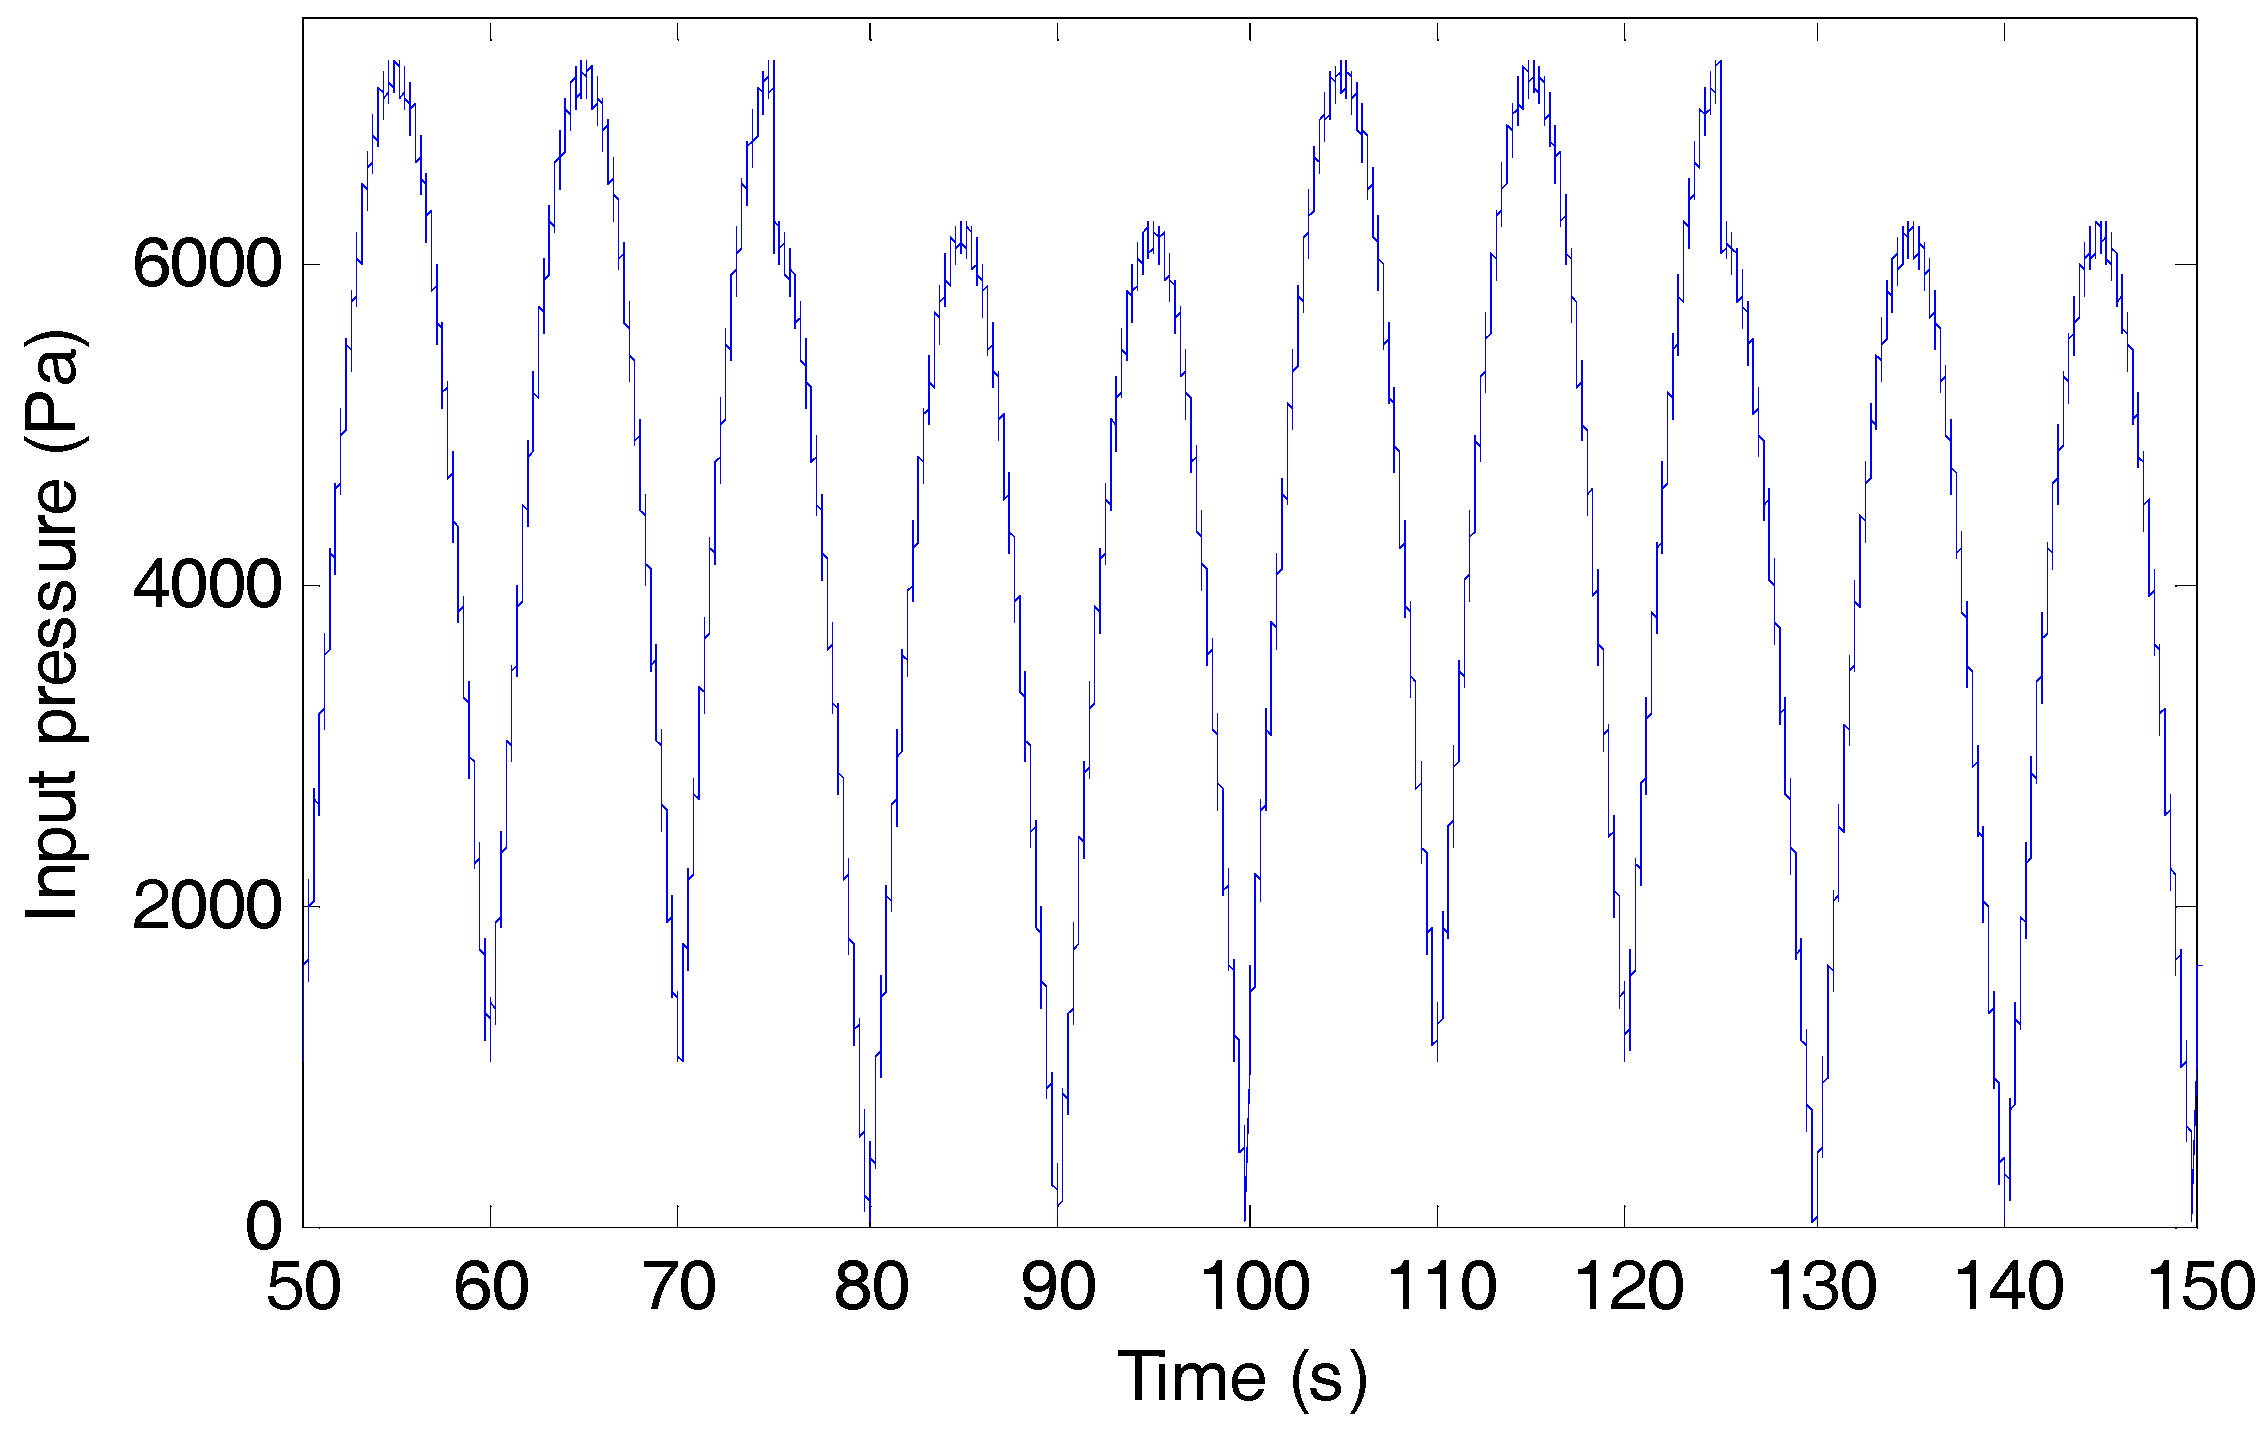
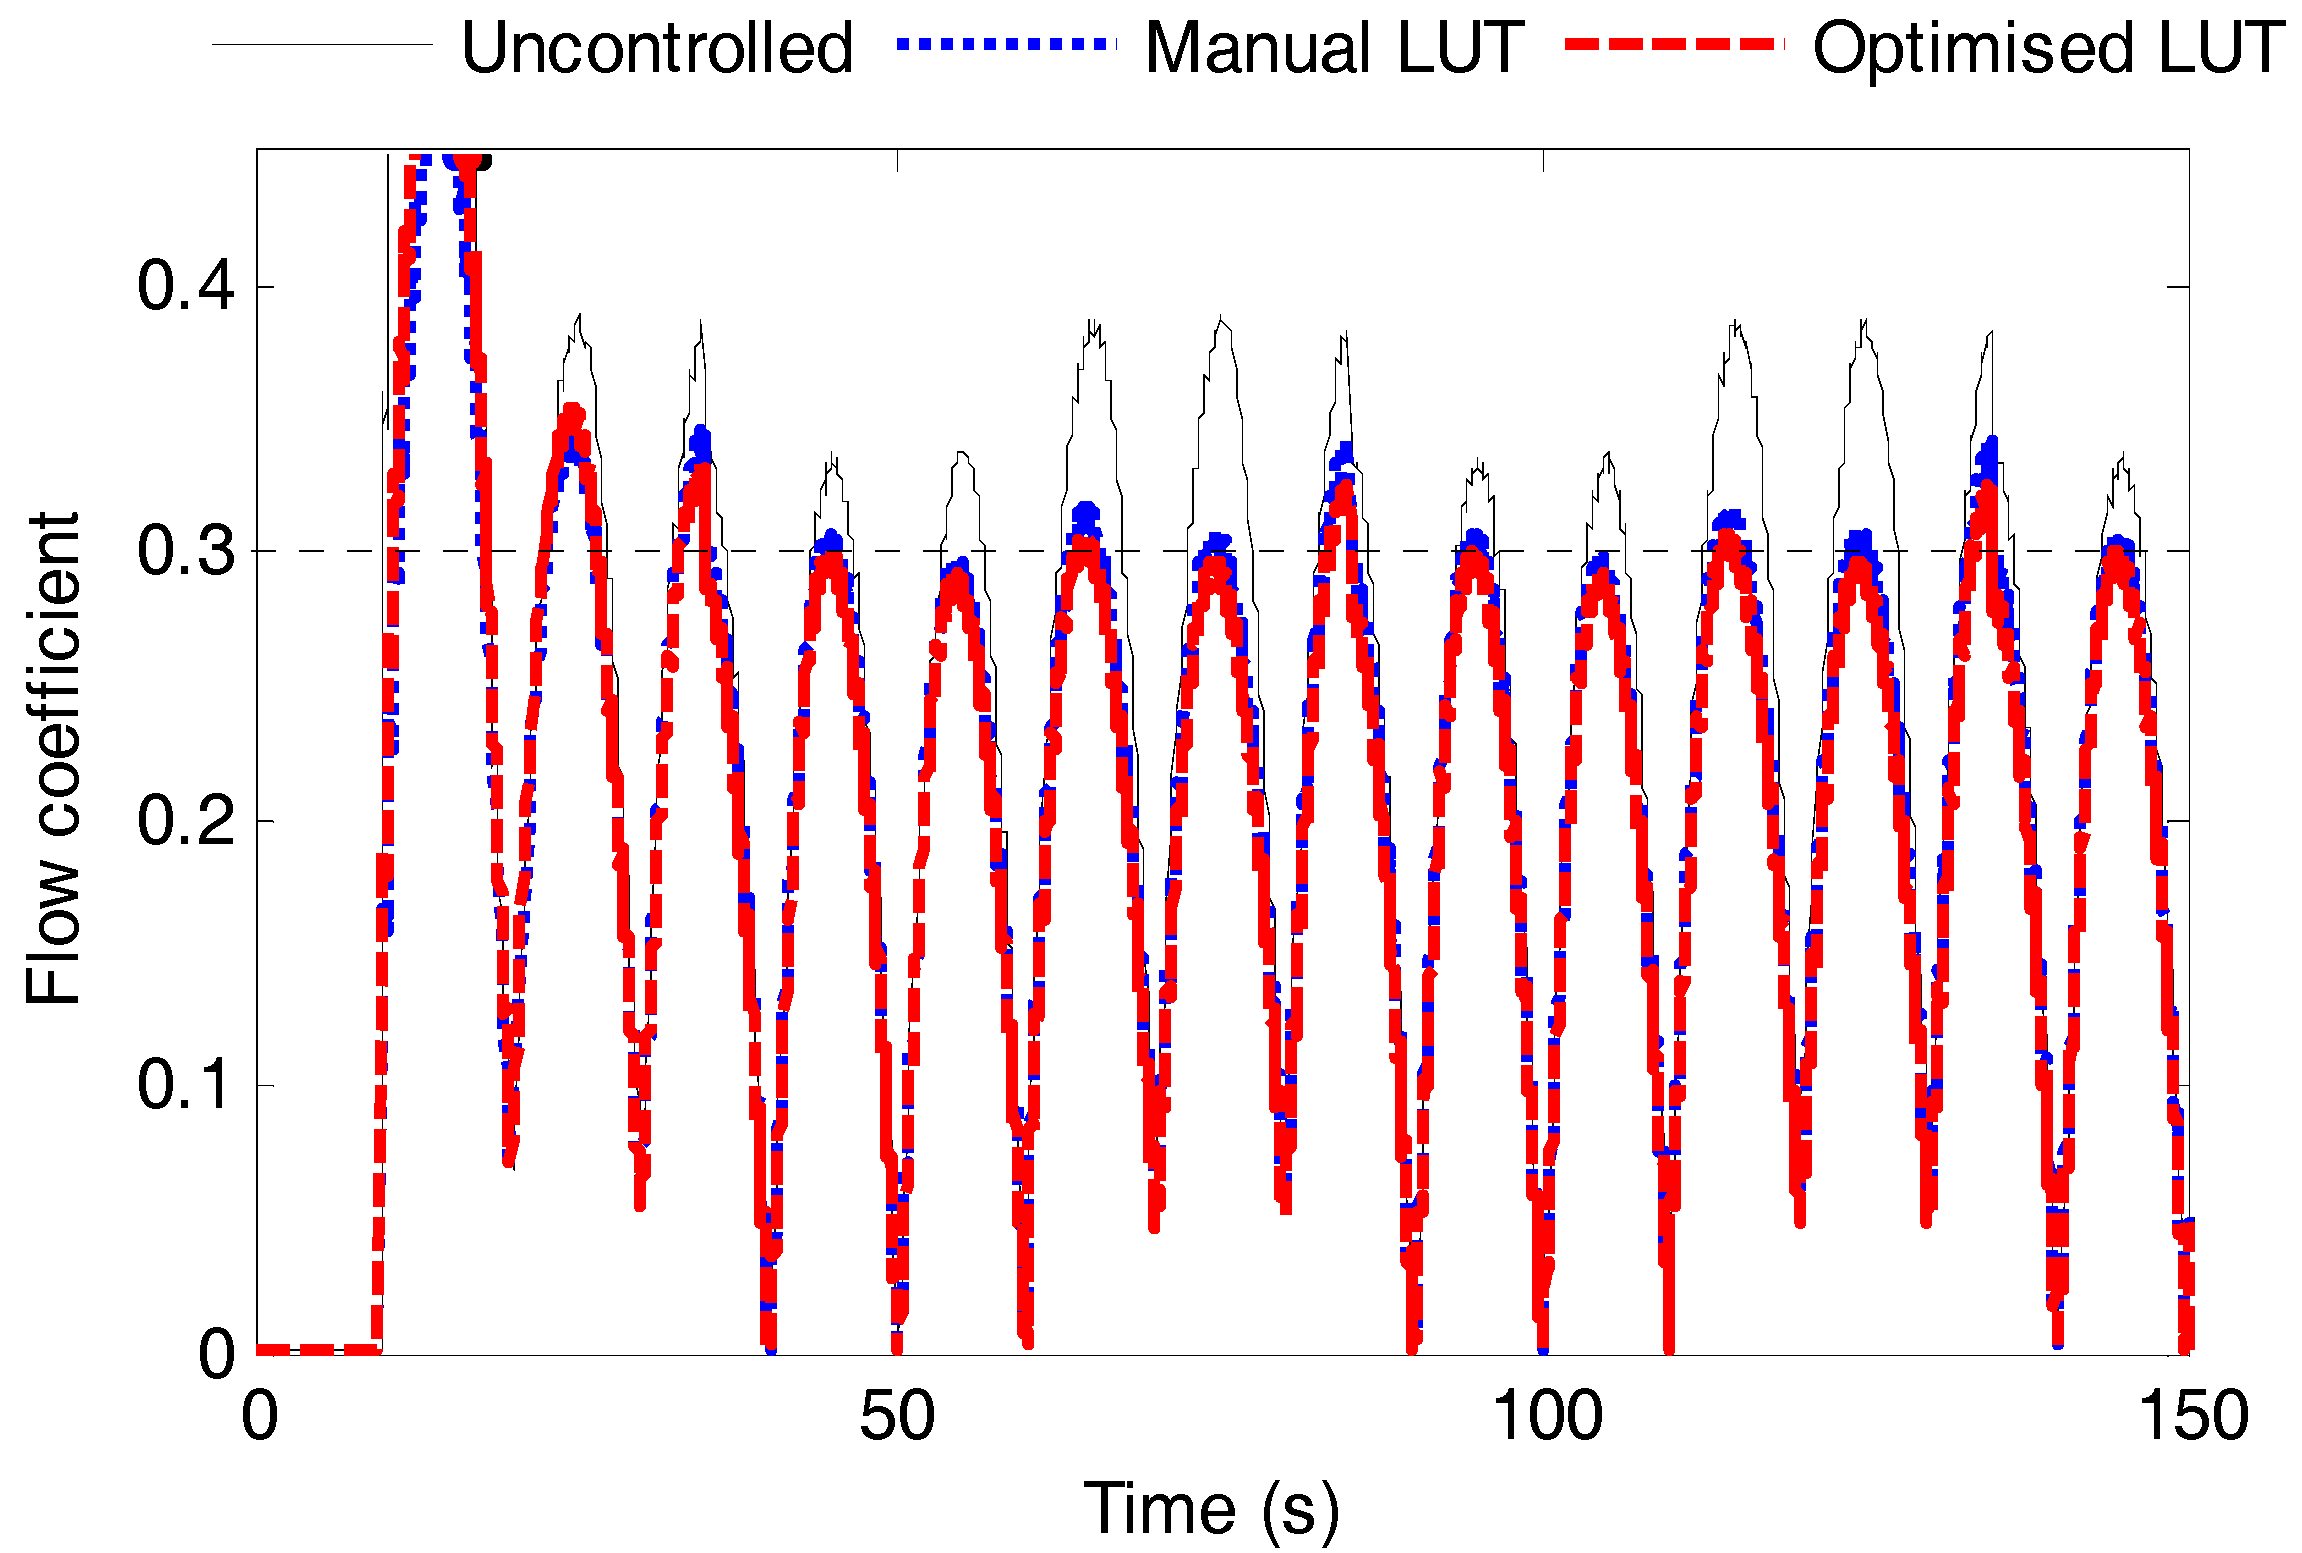
Further, two case studies of regular waves and irregular sea wave conditions have been examined. For a regular wave, the variations in pressure drop inside the OWC is shown in Figure 8, represented by dP = |7000 sin (0.314t)| Pa and the corresponding flow coefficient obtained for stalling phenomenon, manual LUT and optimised LUT based MPPT algorithm is shown in Figure 9. The variation in output and average power is illustrated in Figure 10. The output power obtained is 37.42 kW and 39.02 kW for manual LUT and optimised LUT based MPPT algorithm respectively.
The main challenge of the proposed control is to test the impact of real sea waves on the plant performance. Therefore, an irregular pressure waveform as shown in Figure 11 has been considered for validation of proposed MPPT algorithm. The corresponding variation in flow coefficient is shown in Figure 12. It can be observed that ϕmax remains below 0.3 for optimised LUT whereas it exceeds for uncontrolled case and manual LUT. The output power for stalling phenomenon (without control), manual LUT and optimised LUT based MPPT algorithm is depicted in Figure 13. The output power waveform has been enhanced with optimised LUT as compared to uncontrolled system and manual LUT.

6. Conclusions

The MPPT algorithm works effectively for maximising output power of OWC plant under regular and irregular sea wave conditions. It was established that the Wells turbine suffers with stalling problem for lower rotor resistance whereas the power loss increases for higher values of rotor resistance. Therefore, the appropriate selection of rotor resistances was important to avoid stalling as well as to reduce the power loss. Hence, the rotor resistances were optimised using PSO by maintaining the flow coefficient close to threshold value (i.e., 0.2995). An LUT was prepared based on these optimised values with differential pressure as input and rotor resistance as output. The optimised LUT was compared to uncontrolled and manual LUT. The average turbine efficiency and average output power were maximized with optimised LUT. The optimised LUT performs better than manual LUT based MPPT algorithm in terms of turbine efficiency, output power and power loss across externally connected rotor resistances.

Author Contributions

All the authors of the paper were involved in deciding the topic of research. The simulation models were mainly designed by Sunil Kumar Mishra. These models were studied and approved by both Shubhi Purwar and Nand Kishor. The simulation results were analysed thoroughly by all the authors of the paper. Sunil Kumar Mishra wrote the paper that was revised by both Shubhi Purwar and Nand Kishor.

Conflicts of Interest

The authors declare no conflict of interest.

References

  1. Rodrigues, L. Wave power conversion systems for electrical energy production. In Proceedings of the International Conference on Renew Energies and Power Quality (ICREPQ’08), Salamanca, Spain, 21–23 May 2008. [Google Scholar]
  2. Drew, B.; Plummer, A.R.; Sahinkaya, M.N. A review of wave energy converter technology. Proc. Inst. Mech. E Part A J. Power Energy 2009, 223, 887–902. [Google Scholar] [CrossRef]
  3. Brekken, T.; Batten, B.; Amon, E. From blue to green. IEEE Control Syst. Mag. 2011, 31, 18–24. [Google Scholar] [CrossRef]
  4. Polinder, H.; Mecrow, B.C.; Jack, A.G.; Dickinson, P.G.; Mueller, M.A. Conventional and TFPM linear generators for direct-drive wave energy conversion. IEEE Trans. Energy Convers. 2005, 20, 260–267. [Google Scholar] [CrossRef]
  5. Das, B.; Pal, B.C. Voltage control performance of AWS connected for grid operation. IEEE Trans. Energy Convers. 2006, 21, 353–361. [Google Scholar] [CrossRef]
  6. Ceballos, S.; Rea, J.; Robles, E.; Lopez, I.; Pou, J. O’Sullivan, D. Control strategies for combining local energy storage with Wells turbine oscillating water column devices. Renew. Energy 2015, 83, 1097–1109. [Google Scholar] [CrossRef]
  7. O’Sullivan, D.L.; Lewis, A.W. Generator selection and comparative performance in offshore oscillating water column ocean wave energy converters. IEEE Trans. Energy Convers. 2011, 26, 603–614. [Google Scholar] [CrossRef]
  8. Hong, Y.; Waters, R.; Boström, C.; Eriksson, M.; Engström, J.; Leijon, M. Review on electrical control strategies for wave energy converting systems. Renew. Sustain. Energy Rev. 2014, 31, 329–342. [Google Scholar] [CrossRef]
  9. Falcáo, A.F.O.; Justino, P.A.P. OWC wave energy devices with air flow control. Ocean Eng. 1999, 26, 1275–1295. [Google Scholar] [CrossRef]
  10. Falcáo, A.F.O.; Vieira, L.C.; Justino, P.A.P.; Andre, J.M.C.S. By-pass air-valve control of an OWC wave power plant. J. Offshore Mech. Arct. Eng. 2003, 125, 205–210. [Google Scholar] [CrossRef]
  11. Justino, P.A.P.; Falcão, A.F.O. Rotational speed control of an OWC wave power plant. J. Offshore Mech. Arct. Eng. 1999, 121, 65–70. [Google Scholar] [CrossRef]
  12. Falcão, A.F.O. Control of an oscillating-water-column wave power plant for maximum energy production. Appl. Ocean Res. 2002, 24, 73–82. [Google Scholar] [CrossRef]
  13. Jayashankar, V.; Karthikeyan, B.; Manivannan, K.; Venkatraman, N.; Rangaprasad, S. Maximizing power output from a wave energy plant. In Proceedings of the 2000 IEEE Power Engineering Society Winter Meeting, Singapore, 23–27 January 2000; pp. 1796–1801. [Google Scholar]
  14. Ravindran, M.; Koola, P.M. Energy from sea waves-the Indian wave energy program. Curr. Sci. 1991, 60, 676–680. [Google Scholar]
  15. Mala, K.; Badrinath, S.N.; Chidanand, S.; Kailash, G.; Jayashankar, V. Analysis of power modules in the Indian wave energy plant. In Proceedings of the 2009 Annual IEEE India Conference, Gujarat, India, 18–20 December 2009; pp. 95–98. [Google Scholar]
  16. Rao, S.S.; Murthy, B.K. Control of induction generator in a Wells Turbine based wave energy system. In Proceedings of the 2005 International Conference on Power Electronics and Drives Systems, Kuala Lumpur, Malaysia, 28 November–1 December 2005; pp. 1590–1594. [Google Scholar]
  17. Muthukumar, S.; Desai, R.; Jayashankar, V.; Santhakumar, S.; Setoguchi, T. Design of a stand-alone wave energy plant. In Proceedings of the Fifteenth International Offshore and Polar Engineering Conference, Seoul, Korea, 19–24 June 2005; pp. 497–502. [Google Scholar]
  18. Murthy, B.K.; Rao, S.S. Rotor side control of Wells turbine driven variable speed constant frequency induction generator. Electr. Power Compon. Syst. 2005, 33, 587–596. [Google Scholar] [CrossRef]
  19. Torre-Enciso, Y.; Ortubia, I.; Aguileta, L.I.L.; Marques, J. Mutriku wave power plant: From the thinking out to the reality. In Proceedings of the 8th European Wave and Tidal Energy Conference, Uppsala, Sweden, 7–10 September 2009; pp. 319–329. [Google Scholar]
  20. Amundarain, M.; Alberdi, M.; Garrido, A.; Garrido, I. Control of the stalling behaviour in wave power generation plants. In Proceedings of the 2009 Compatibility and Power Electronics, Badajoz, Spain, 20–22 May 2009; pp. 117–122. [Google Scholar]
  21. Alberdi, M.; Amundarain, M.; Maseda, F.J.; Barambones, O. Stalling behaviour improvement by appropriately choosing the rotor resistance value in wave power generation plants. In Proceedings of the 2009 International Conference on Clean Electrical Power, Capri, Italy, 9–11 June 2009; pp. 64–67. [Google Scholar]
  22. Amundarain, M.; Alberdi, M.; Garrido, I.; Garrido, A. Wells turbine control in wave power generation plants. In Proceedings of the 2009 IEEE International Electric Machines and Drives Conference, Miami, FL, USA, 3–6 May 2009; pp. 177–182. [Google Scholar]
  23. Amundarain, M.; Alberdi, M.; Garrido, A.J.; Garrido, I. Neural control of the Wells turbine-generator module. In Proceedings of the 48h IEEE Conference on Decision and Control (CDC) Held Jointly with 2009 28th Chinese Control Conference, Shanghai, China, 15–18 December 2009; pp. 7315–7320. [Google Scholar]
  24. Young, I.R. Wind Generated Ocean Waves; Elsevier: Oxford, UK, 1999. [Google Scholar]
  25. Brooke, J. Wave Energy Conversion; Elsevier: Oxford, UK, 2003. [Google Scholar]
  26. Mishra, S.K.; Purwar, S.; Kishor, N. An optimal and non-linear speed control of oscillating water column wave energy plant with wells turbine and DFIG. Int. J. Renew. Energy Res. 2016, 6, 995–1006. [Google Scholar]
  27. Amundarain, M.; Alberdi, M.; Garrido, A.J.; Garrido, I.; Maseda, J. Wave energy plants: Control strategies for avoiding the stalling behaviour in the Wells turbine. Renew. Energy 2010, 35, 2639–2648. [Google Scholar] [CrossRef]
  28. Amundarain, M.; Alberdi, M.; Garrido, A.J.; Garrido, I. Control strategies for OWC wave power plants. In Proceedings of the 2010 American Control Conference, Baltimore, MD, USA, 30 June–2 July 2010. [Google Scholar]
  29. Setoguchi, T.; Santhakumar, S.; Takao, M.; Kim, T.H.; Kaneko, K. A modified Wells turbine for wave energy conversion. Renew. Energy 2003, 28, 79–91. [Google Scholar] [CrossRef]
  30. Wilamowski, B.M.; Irwin, J.D. Power Electronics and Motor Drives; CRC Press: Boca Raton, FL, USA, 2011. [Google Scholar]
  31. Clerc, M. Particle Swarm Optimization; ISTE Ltd.: London, UK, 2006. [Google Scholar]
  32. Laudani, A.; Fulginei, F.R.; Lozito, G.M.; Salvini, A. Swarm/flock optimization algorithms as continuous dynamic systems. Appl. Math. Comput. 2014, 243, 670–683. [Google Scholar] [CrossRef]
  33. Shilaja, C.; Ravi, K. Optimal power flow considering intermittent wind power using particle swarm optimization. Int. J. Renew. Energy Res. 2016, 6, 504–509. [Google Scholar]
  34. Rao, R.V.; Patel, V. Design optimization of shell and tube heat exchangers using swarm optimization algorithms. Proc. Inst. Mech. E. Part A J. Power Energy 2011, 225, 619–634. [Google Scholar] [CrossRef]
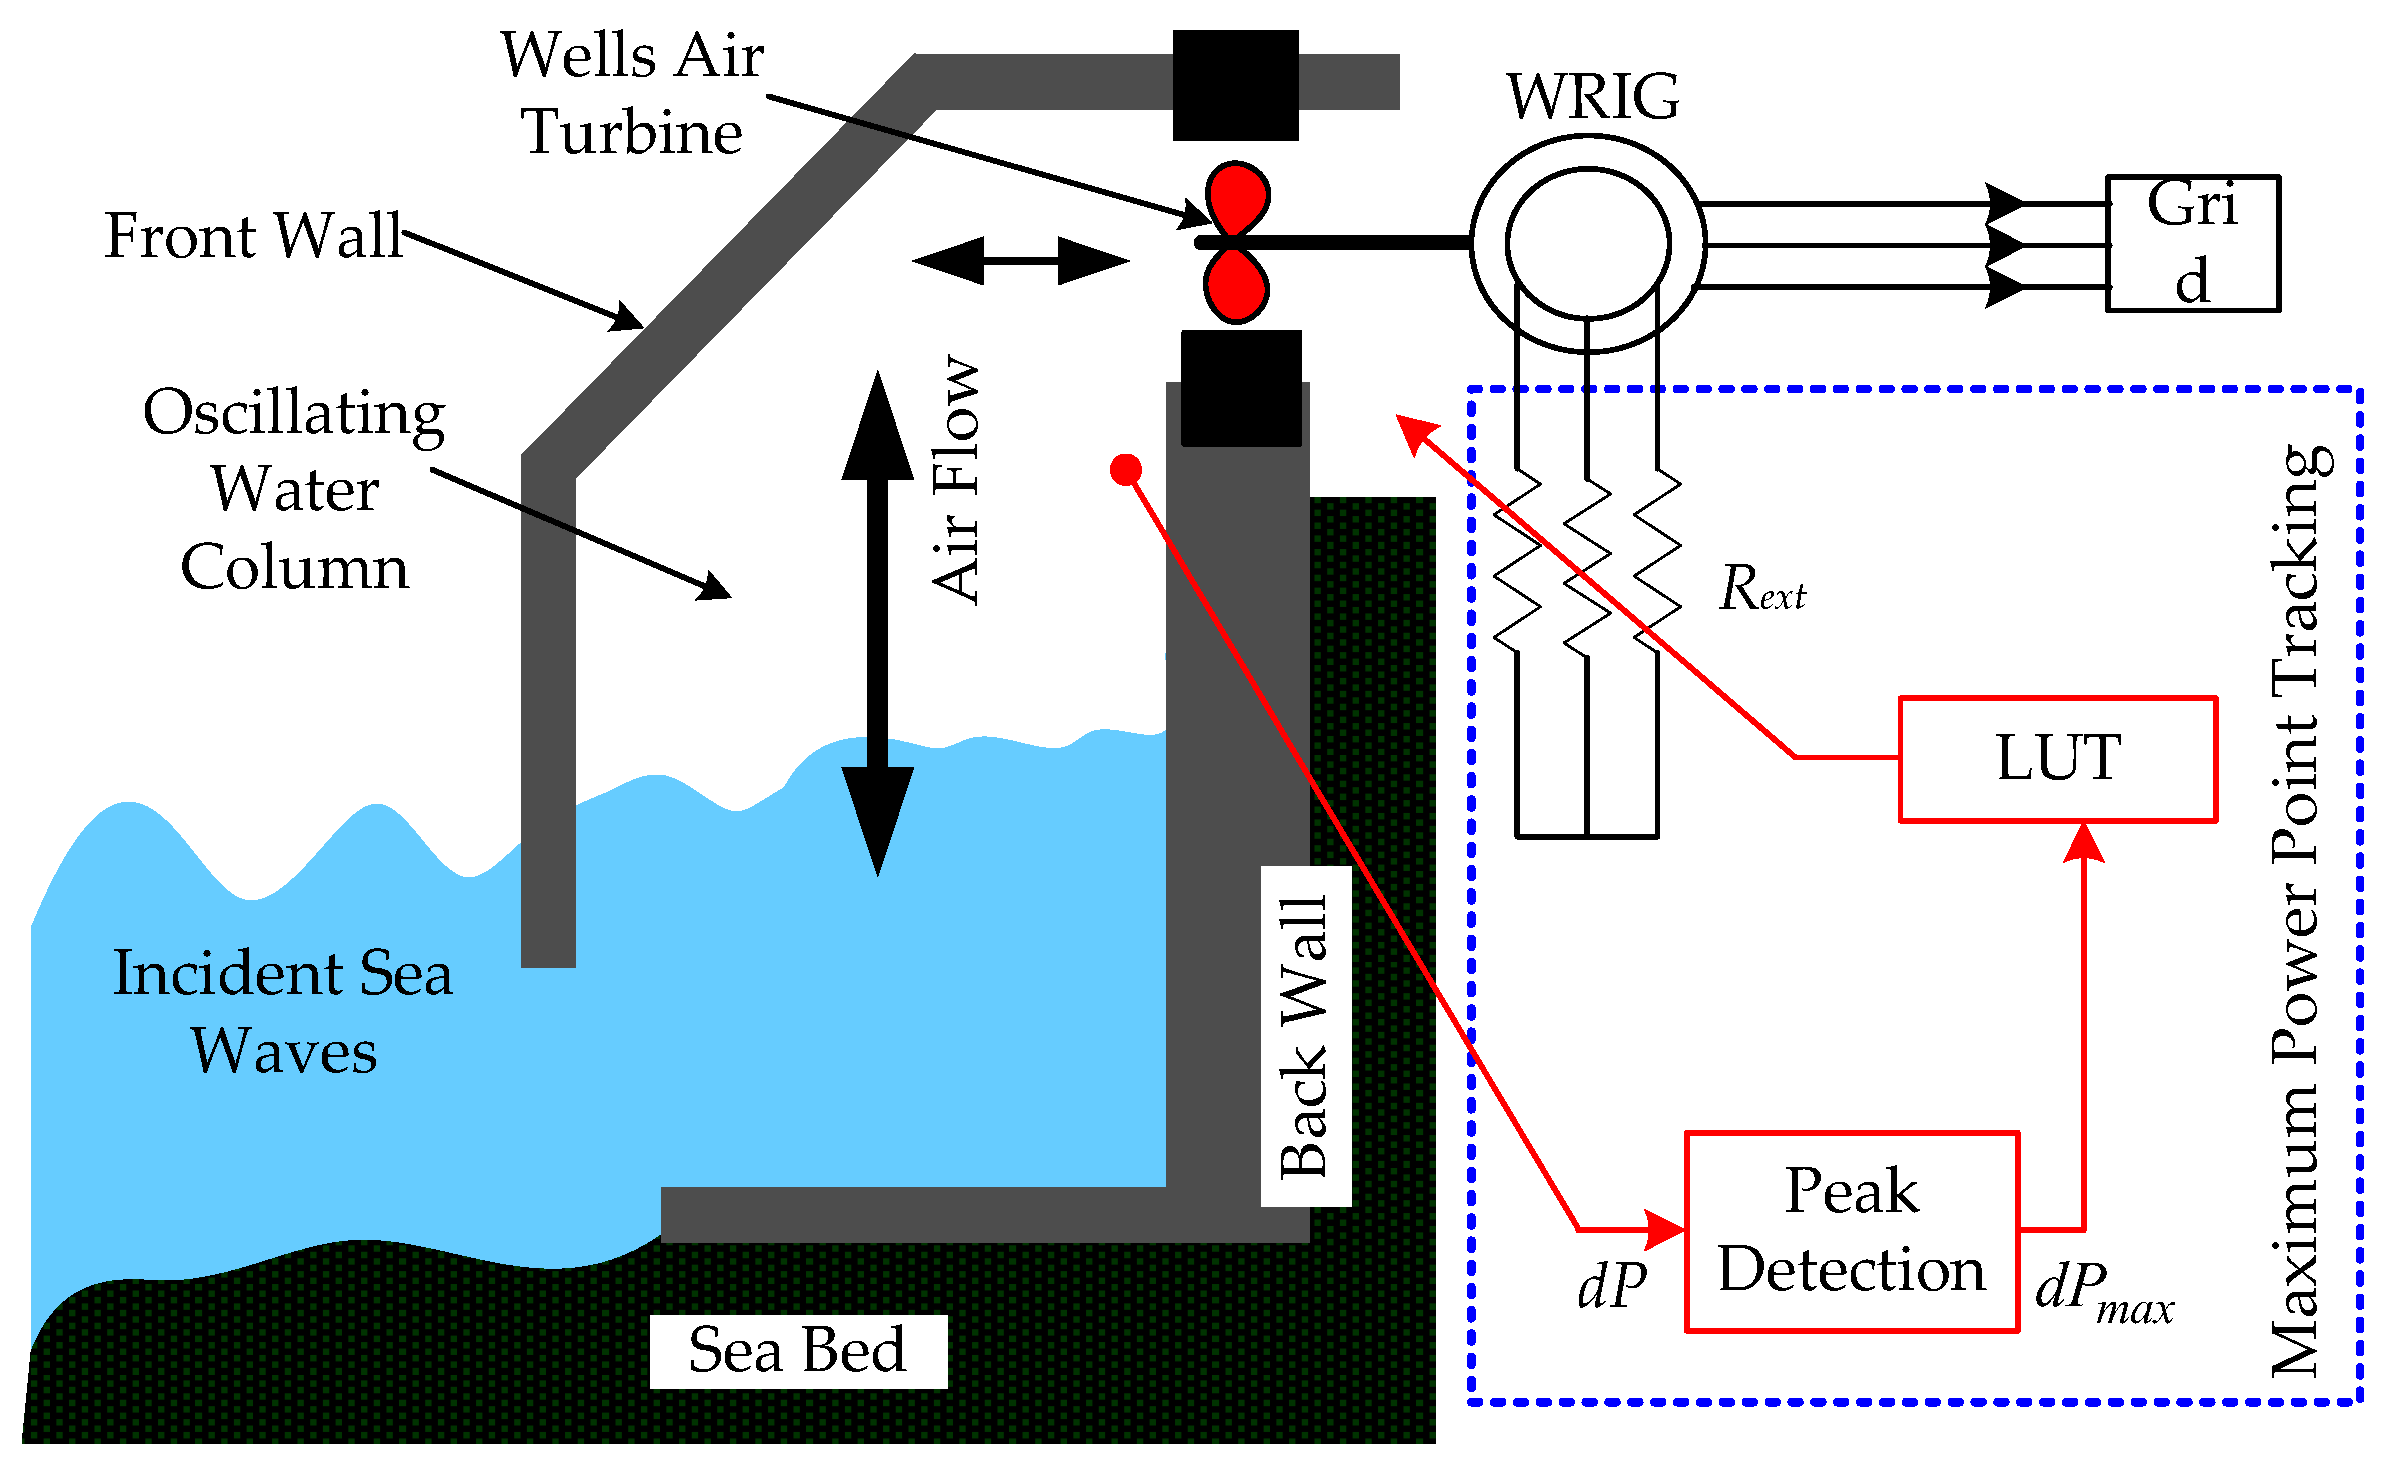
Figure 1. Schematic diagram of oscillating water column (OWC) plant.
Technologies 06 00015 g001
Figure 2. Ocean wave.
Technologies 06 00015 g002
Figure 3. Schematic representation of Wells turbine.
Technologies 06 00015 g003
Figure 4. Characteristics of Wells turbine [26].
Technologies 06 00015 g004
Figure 5. Wells turbine performance for Rext = 0 Ω.
Technologies 06 00015 g005
Figure 6. Pg and PL versus Rext for dP = |7000 sin (0.314t)| Pa.
Technologies 06 00015 g006
Figure 7. Comparison of average output power between manual and optimised LUT.
Technologies 06 00015 g007
Figure 8. Input pressure for dP = |7000 sin (0.314t)| Pa.
Technologies 06 00015 g008
Figure 9. Flow coefficient for MPPT algorithm under regular waves.
Technologies 06 00015 g009
Figure 10. Output power under regular waves.
Technologies 06 00015 g010
Figure 11. Input pressure waveform for irregular waves [27].
Technologies 06 00015 g011
Figure 12. Flow coefficient for MPPT algorithm under irregular waves.
Technologies 06 00015 g012
Figure 13. Electrical output power for MPPT algorithm under irregular waves.
Technologies 06 00015 g013
Table 1. Turbine, Generator and particle swarm optimization (PSO) parameters.
TurbineGeneratorPSO
n = 8p = 4n = 10
kt = 0.7079Rs = 0.0181m = 1
r = 0.7285Lls = 0.13kmax = 10
at = 1.1763Lm = 7.413c1 = 2
b = 0.4Rr = 0.0334c2 = 2
l = 0.38Llr = 0.16wmax = 0.9
gb = 1:2f = 50 Hzwmin = 0.1
J = 50Vs = 390 V, Prated = 55 kW
Table 2. Performance of uncontrolled system (Rext = 0).
dPmax (Pa)φ η ¯ t ( % ) P ¯ g ( kW )
50000–0.278939.39−22.87
55000–0.300639.98−27.27
60000–0.325437.56−28.29
65000–0.351133.77−26.82
68000–0.366531.40−25.29
70000–0.376729.83−24.08
73000–0.392127.53−22.02
75000–0.402626.08−20.57
78000–0.419624.38−19.01
80000–0.430523.39−18.15
Table 3. Performance of MPPT algorithm with manual look-up-table (LUT).
dPmax (Pa)Rext (Ω)φ η ¯ t ( % ) P ¯ g ( kW )
50000.000–0.278939.39−22.87
55000.100–0.291939.88−27.01
60000.200–0.302939.96−31.04
65000.300–0.313539.00−33.84
68000.400–0.314138.88−36.08
70000.450–0.315738.68−37.42
73000.550–0.313738.88−40.21
75000.650–0.307439.45−42.81
78000.750–0.303439.69−45.81
80000.850–0.298139.72−47.57
Table 4. Performance of MPPT algorithm with optimised LUT.
dPmax (Pa)Rext (Ω)Φ η ¯ t ( % ) P ¯ g ( kW )
50000.00–0.278939.39−22.87
55000.01860–0.299539.99−27.26
60000.24340–0.299539.99−31.06
65000.44200–0.299539.87−34.94
68000.54640–0.299539.83−37.36
70000.60410–0.299539.81−39.02
73000.68330–0.299539.78−41.54
75000.72910–0.299539.77−43.26
78000.79700–0.299539.76−45.87
80000.83210–0.299539.75−47.65
Table 5. Overall power extraction for dP = |7000 sin (0.314t)| Pa.
Rext (Ω)|Pg| (kW)|PL| (kW)Overall Power Extraction = |Pg| − |PL| (kW)
0.00 (uncontrolled)23.690.0023.69
0.45 (manual)37.423.3634.06
0.6041 (optimised)39.024.5234.50