Article

Modulation of the Intensity of the Spectral Components of Polychromatic Light within Certain Regions in Space by Passive Methods by Strategically Using Material Optical Properties and Texture

by
Adriana Lira-Oliver
Laboratory of Sustainable Buildings, School of Architecture, Universidad Nacional Autónoma de México (UNAM), Ciudad Universitaria, Ciudad de Mexico 04510, Mexico
Technologies 2018, 6(1), 11; https://doi.org/10.3390/technologies6010011
Submission received: 22 November 2017 / Revised: 27 December 2017 / Accepted: 12 January 2018 / Published: 16 January 2018

Abstract

:
Recent research indicates that not only blue and green monochromatic light stimulates our circadian system, but polychromatic light as well. Recent work also suggests that the human circadian system also changes its spectral sensitivity with different light levels and spectrum. Usually, indoor architectural spaces are dynamic in light color and quantity, and to a certain extent, the architect is able to modulate these light characteristics to benefit not only of the visual system but the circadian system as well. The purpose of this work was to redirect the three main spectral components (RGB) of indirect light towards different directions and in different quantities as an approach to an understanding of how the spectral composition of an indoor light environment can be modulated by passive methods. In the present work, reflections of blue-enriched polychromatic light off different surface materials with different optical properties and textures were simulated. Spectral radiance values were measured at a specific point in space in order to evaluate how the three main spectral components of the reflected light changed in quantity.

1. Introduction

Much work has been done on indoor luminous environments and on the application of electromagnetic radiation for different benefits. Light, defined as electromagnetic radiation to which the human retina is sensitive [1], has been studied as part of architectural environments to provide visual comfort and to improve human mood and alertness [2,3,4,5,6,7]. Today, there is an effort to differentiate “visual lighting levels” from “biological lighting levels” [8], and a need to understand human physiological and behavioral responses to electromagnetic radiation [9,10,11,12], because light entering the eye does not only serve vision, but also our circadian system [13,14,15]. Light affects our circadian timing [16,17,18,19,20], alertness [21,22], core body temperature [22], heart rate [22,23,24], cortisol production [25], and objective alertness [26,27,28]. The melatonin level in blood (or saliva, or urine) has been the primary measure of the status of our “master biological clock” regulated by the circadian system [29,30]. Brainard and Thapan have found that short wavelength light is the most effective in suppressing melatonin due to melanopsin in intrinsically photosensitive ganglion cells (ipRGCs). Melanopsin appears to be the primary circadian photopigment and is mostly sensitive to blue light [31,32].
Recent work suggests that the human circadian system changes its spectral sensitivity with different light levels [1] because it appears that besides the ipRGCs, cones participate in circadian phototransduction [33,34]. Cones and ipRGCs are mostly sensitive to different light wavelengths and, therefore, participation of both cells implies that light with different spectral composition is able to induce a circadian response to different extents. Because of these findings, research on light spectral power distribution and eye spectral sensitivity have become increasingly important. It has been determined that quantity, spectrum, and distribution of light entering the eye [35] are important for the stimulation of the circadian system.
In relation to light spectrum, melatonin suppression by light is maximally sensitive to short wavelengths of visible monochromatic light between 440 nm and 500 nm [31,32], but insensitive to light peaking at 630 nm [27,36]. Therefore, monochromatic blue and green light are the most effective in suppressing melatonin [26,37]. On the other hand, research suggests that measures of alertness increase with long-wavelength light during night-time [36] and during daytime hours [27].
Studies also on polychromatic light have been done in order to understand its non-visual effects [38,39,40]. Some studies suggest that polychromatic light may be as effective as blue monochromatic light at eliciting a circadian response [41,42,43]. Other studies showed that blue-enriched polychromatic light can be more effective at suppressing nocturnal melatonin than monochromatic blue light photon matched for melanopsin stimulation [41]. In addition, it has been proven that bright polychromatic light during daytime increases alertness and cognitive performance [44,45] and enhances mood and vitality in healthy office workers during winter time in the northern hemisphere [46]. Moreover, some experts have concluded that polychromatic light of any spectral content can produce a circadian response with enough irradiance [37], but only light sources dominated by short-wavelength energy will be able to add to the intrinsic response by the ipRGCs [47].
In relation to light quantity, some studies suggest that light spectrum is not as significant in determining circadian phase shifting as quantity of light pulses at the eye [43]. In general, higher levels of light are needed to induce circadian phase shifts and suppress melatonin than to stimulate the visual system [47,48]. Moreover, melatonin is not suppressed at very low (scotopic) light levels in humans [13,14,49,50,51,52,53], because the ipRGCs have lower sensitivity to light than cones and appear to be specialized to simply encode ambient light intensity [29]. Therefore, a higher light intensity is needed to produce a circadian response. Apparently, the richer the light in blue spectral content—monochromatic or polychromatic—the less quantity needed for melatonin suppression [40,47].
Today, indoor spaces lighting should be designed not only to serve vision, but our circadian system as well. This broadens the purpose of lighting design from visual comfort provision to healthy lighting conditions. On the other hand, this fact adds complexity to lighting design, as it suggests that an indoor lighting environment should not provide the same light spectral and quantity characteristics throughout time (i.e., a day) or even throughout space as our biological behavioral needs change through time and space (i.e., from needing to be alert to needing to be relaxed).
Light (natural or artificial) within indoor spaces is mostly polychromatic. During the last century, lighting has been enhanced to provide comfortable visual conditions. Recently, lighting is being enhanced to provide healthy conditions, and most of the commercial alternatives for this purpose are lamps that deliver blue-enriched polychromatic light.
Today, one challenge is to study indirect lighting from a healthy point of view. Most of the studies related to circadian light focus on direct light or spectrally uniform light environments. However, within architectural indoor spaces, light reaching the eye is mostly indirect and usually, does not come directly from the light source. Main points of view of indoor spaces occupants are located towards surfaces that reflect light but do not generate light. Example of these surfaces are the finishes of walls, floors, desks, and tables. Usually, a person evades looking directly towards a light source in order to avoid glare. In addition, indoor spaces indirect light is a complex mixture of radiation and spectral distributions constantly changing and is the product of the interaction of daylight and/or artificial light with indoor surface materials.
Up to a certain point, the architect of a space determines the main view points of the occupant, and therefore, the main human eye direction towards a light environment or a specific space. In addition, the architect selects the material types to be implemented as indoor surface finishes and therefore, the material optical properties which will determine the type of interaction between light and matter. Choosing a light source with specific light spectral and quantity characteristics (to enhance vision, elucidate alertness, or enhance human performance) is no guarantee that those light characteristics will remain the same when reaching the eye, as these may have changed after the light coming from the light source has been reflected off the finishes of the walls, floors, and/or furniture within the space.
Surface optical properties have an important role on studies on color constancy [54], light collection [55], and light transportation [56], but not as much on indirect indoor light studies related to health due to the complexity of the light information. Surface material optical properties have been reported in several studies related to circadian light [27,38]. In these studies, polychromatic light is delivered indirectly to the eye by transmitting it diffusively through a white acrylic or reflecting it diffusively off-white surfaces in order to reach the eye with spectral and quantity characteristics very close to that from the original source [38]. However, the spectral reflectance of the material was not reported, and therefore the spectral power distribution (SPD) of the light reaching the eye was also not reported.
The main purpose of the present work is to study, as a first approach, how different parts of the spectrum of blue-enriched polychromatic light (coming from a fixed light source) can be increased or decreased in quantity at certain points in space by passive methods. The present work proposes to achieve this by redirecting and concentrating different spectral components of the blue-enriched polychromatic light towards different space regions by reflecting it off surfaces of different optical properties—such as spectral reflectance, specularity and roughness—and textures.

2. Materials and Methods
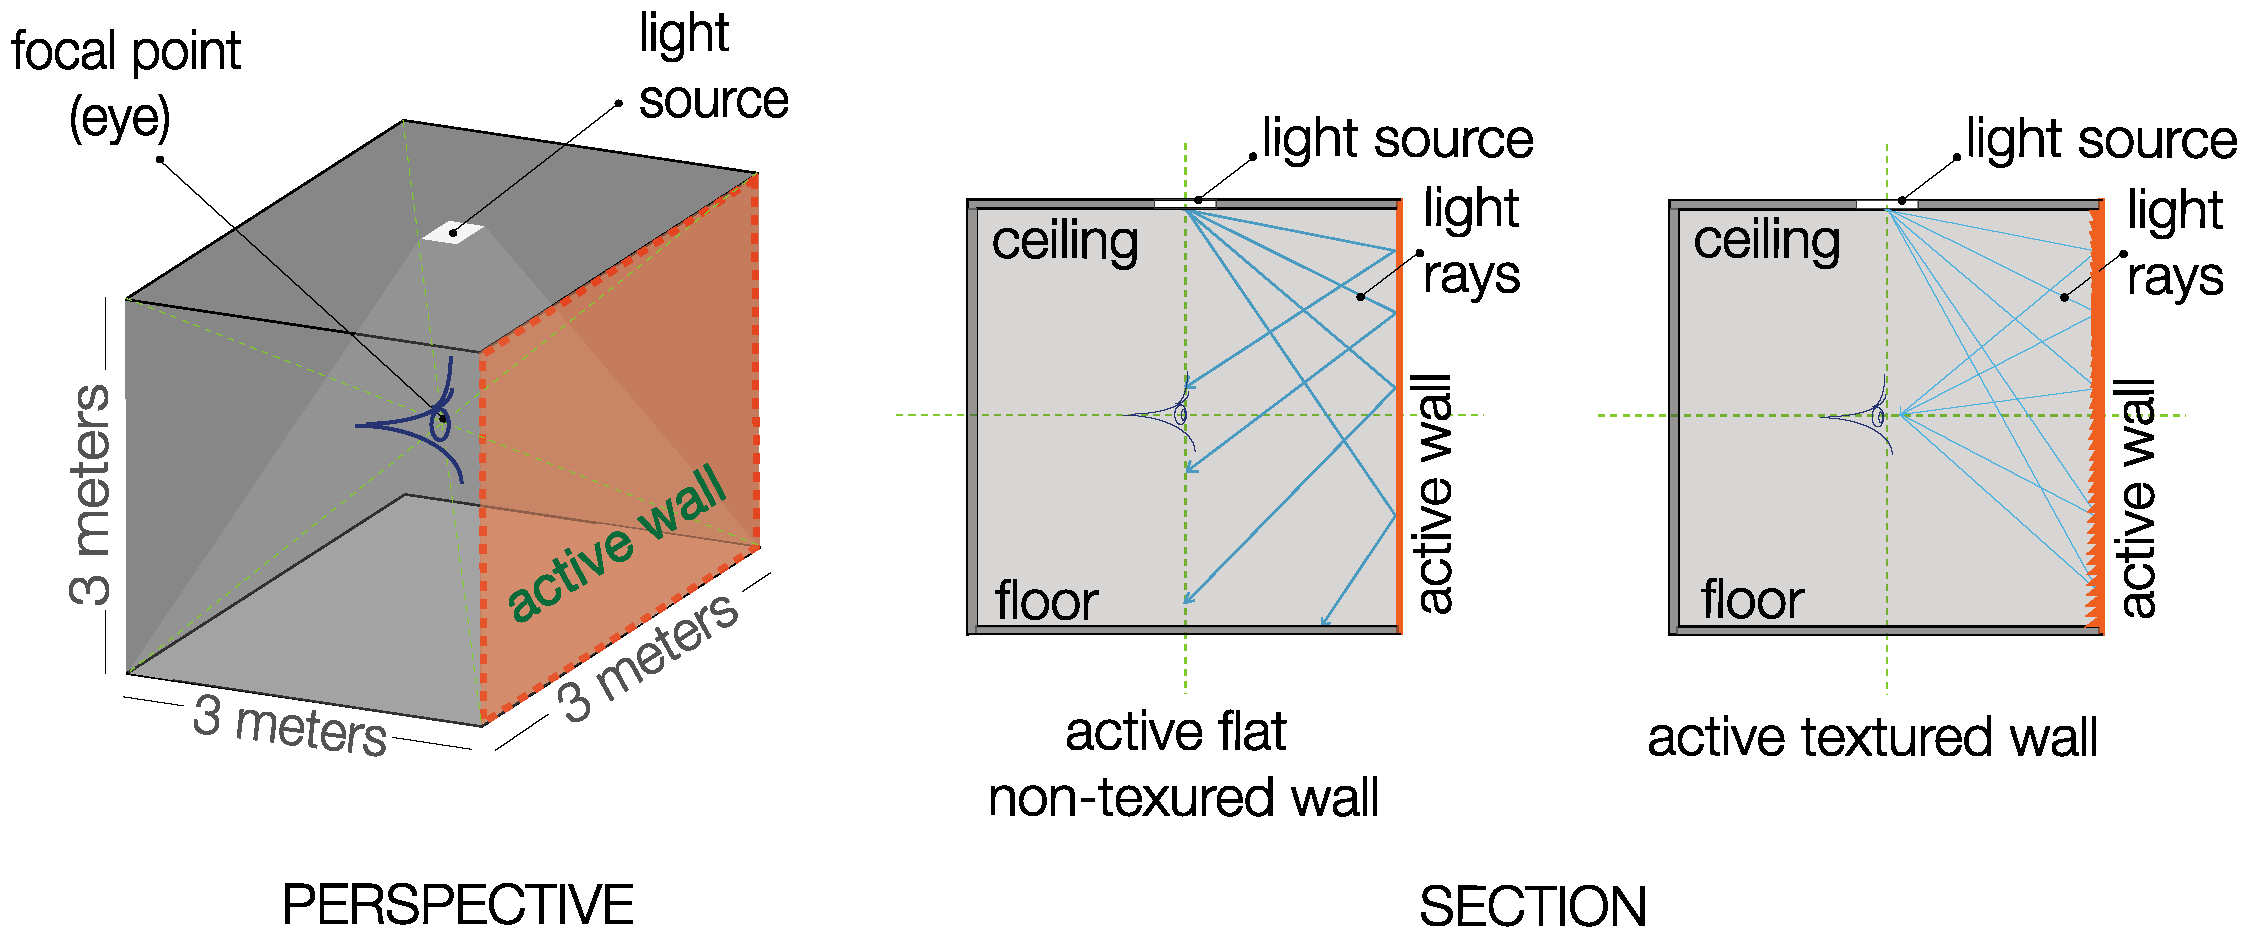
Interaction between light and different surfaces with different optical properties were simulated using the RADIANCE software version 5.1. Light quantity of different spectral components was measured at the geometrical center of a virtual room. These simulations were performed to assess how different light–matter interactions reflect polychromatic light with different spectral quantities at a certain point in space representing the eye.

2.1. Virtual Rooms

Two symmetrical 27 cubic meter rooms were 3D modeled (see Figure 1) with a blue-enriched polychromatic light source located in the middle of the ceiling. The light source was modeled to radiate light with an RGB (red, green, and blue) spectral contribution of R = 1000 W/sr/m2, G = 1000 W/sr/m2, and B = 1500 W/sr/m2. Each room was modeled with black, non-textured, flat ceiling, floor, and walls in order to avoid any alteration of the reflected from these surfaces. However, material type, color, specular and diffuse reflection, and texture were varied for only one wall, the active wall, for each studied case scenario. The first room presented a flat non-textured active wall that reflected and distributed the light towards a large region; the second room presented an active wall with a texture that reflected and concentrated the reflected light rays towards the geometrical center of the room. Spectral radiance values, in W/sr/m2 units, were obtained at the geometrical center (the focal point) which represented the position of the observer’s eye. The radiance values at the focal point of the room with a textured active wall were compared with those corresponding to the room with the non-textured active wall.

2.2. Material Types and Optical Properties

2.2.1. Spectral Reflectance

In this study, the variation of the intensity of the spectral components of light reflected off a metallic surface was compared with that of light reflected off a non-metallic opaque surface. For this purpose, RADIANCE software generic “metals” and “plastics” materials were modeled. RADIANCE materials are defined as having a diffuse and specular component, a color and a roughness factor. Most opaque non-metallic materials fall into a generic RADIANCE material named “plastic”, such as plastics themselves, painted surfaces, woods, textiles, non-metallic rock, and ceramics. In terms of its optical description, a generic RADIANCE “plastic” material presents a color associated with diffusely reflected radiation, but its specular component is not greatly affected by the spectral reflectance of the material. On the other hand, metallic materials fall into the generic RADIANCE material named “metal”, which has the same optical description as a generic RADIANCE “plastic” material, except that the specular component is greatly modified by the material color [57]. Therefore, highlights resulting from specular reflection acquire different color depending on whether the material is an opaque non-metallic material or a metallic material [58]. Highlights in opaque non-metallic materials present a much more similar spectral composition to the original light source spectral composition, while highlights in metallic materials present a spectral composition enriched by the spectral properties of the material [57,59]. Figure 2 shows a comparison between the colors of highlights present in non-metallic materials and metallic materials with exactly the same spectral reflectance.
For both material types, three spectral reflectances were applied in order to compare how different colors applied to both type materials changed the intensity of the spectral components of the reflected light. Material colors within the RADIANCE software are described as RGB balances. The three studied spectral reflectances, are the following: (1) a balanced reflectance giving the appearance of a white wall: R = 0.5, G = 0.5, B = 0.5 (see Figure 3a); (2) a high red reflectance value, and low blue reflectance value: R = 0.6, G = 0.3, B = 0.1, giving the appearance of a “reddish-yellowish” wall (see Figure 3b); and (3) a low red reflectance and high blue reflectance giving the appearance of a “cyan” wall: R = 0.1, G = 0.3, B = 0.6 (see Figure 3c).

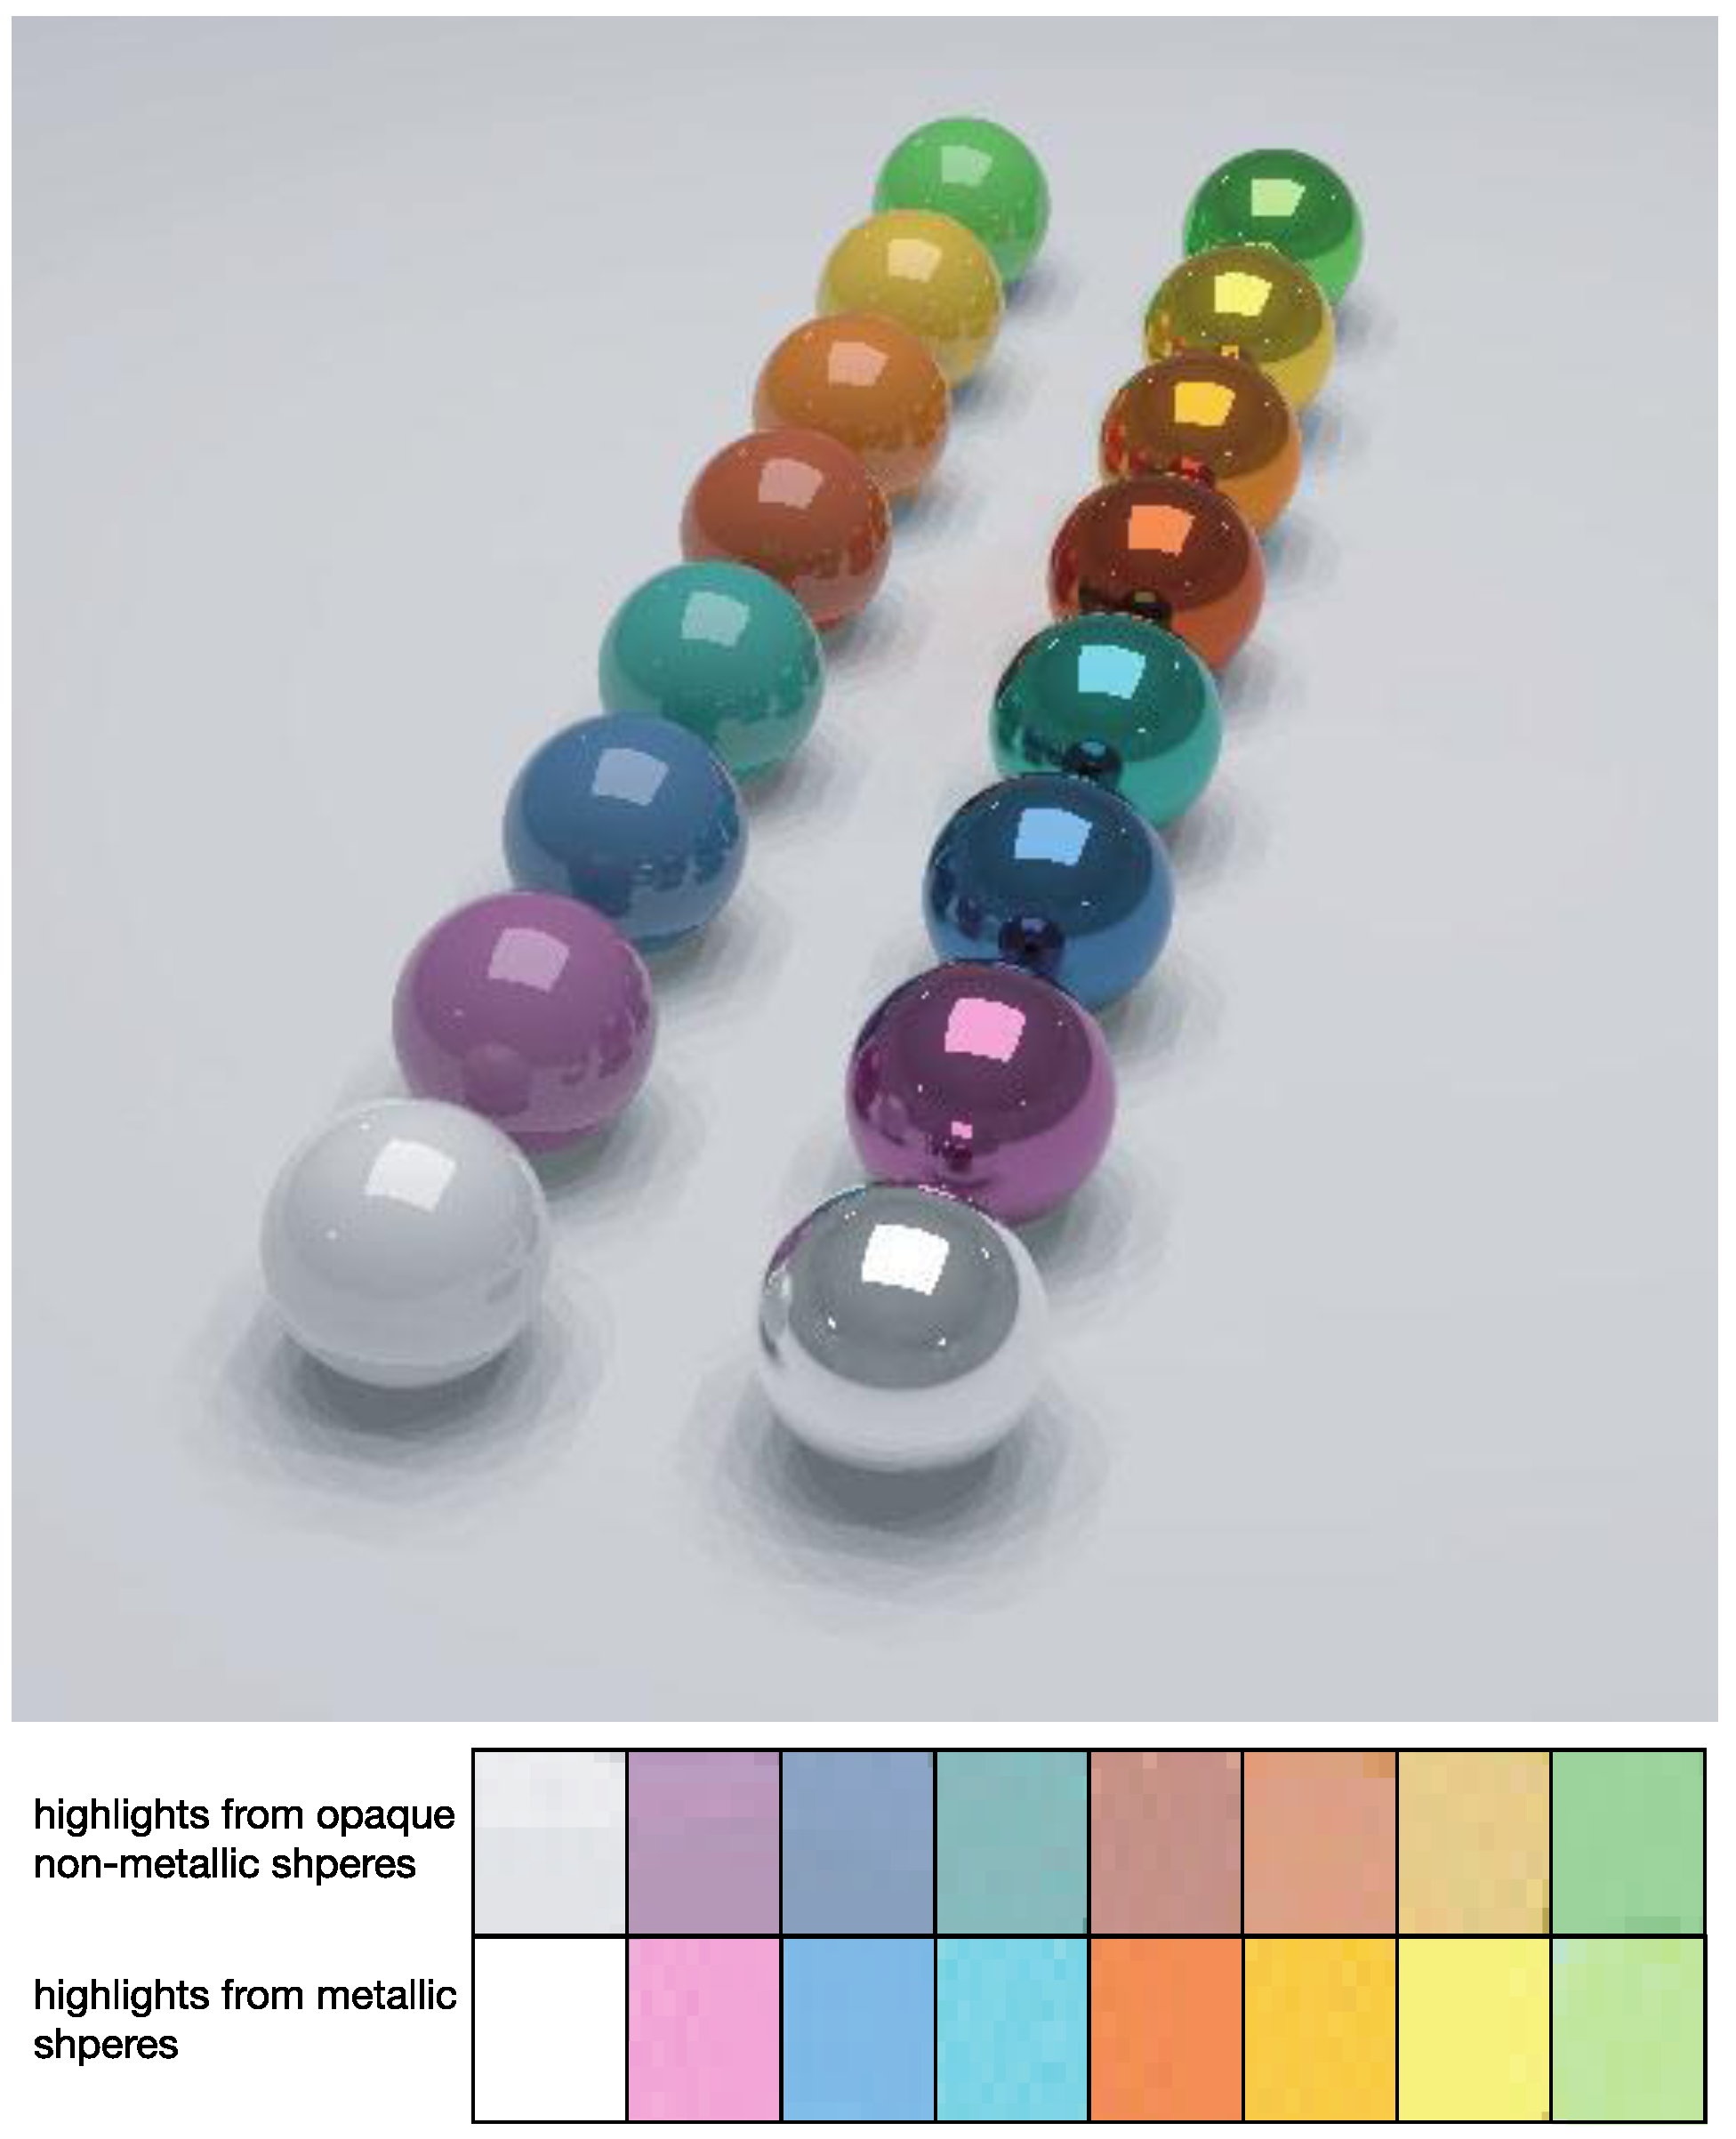
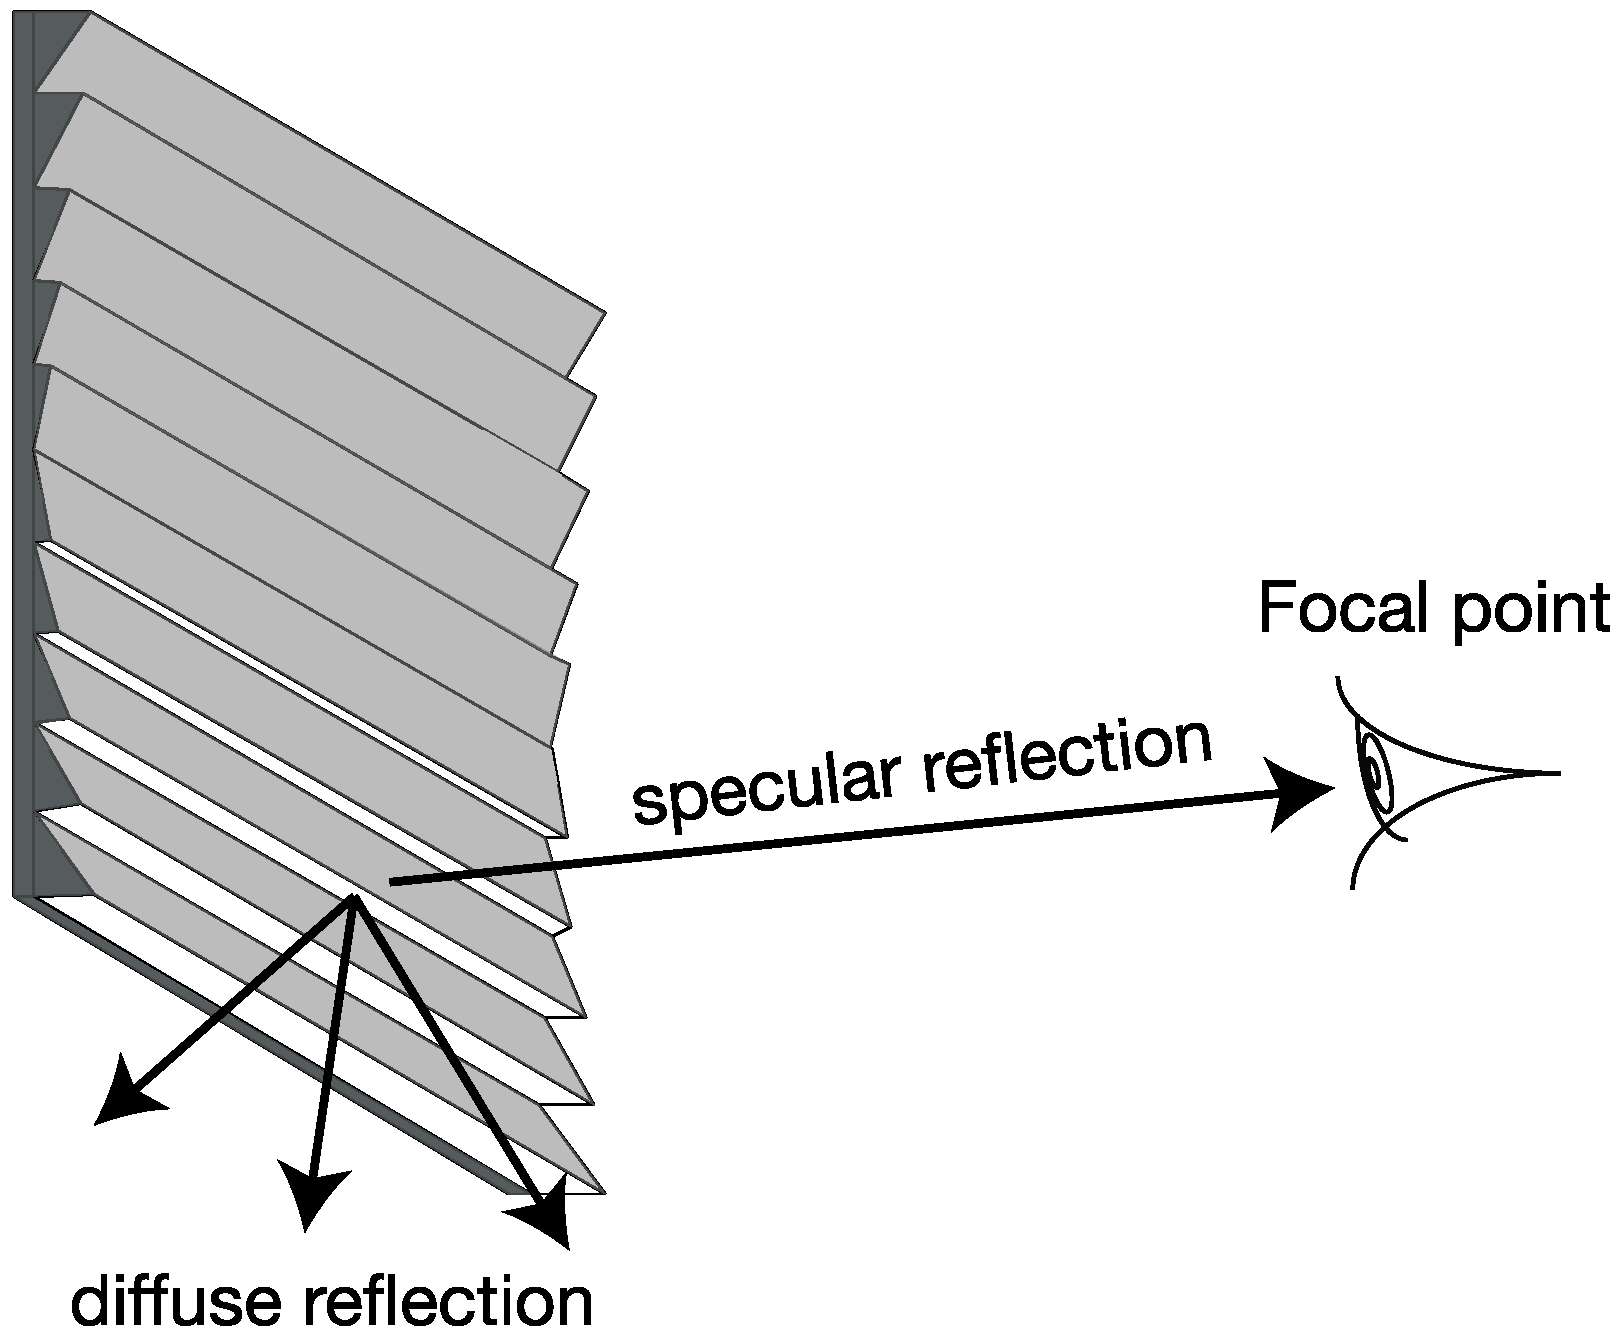
2.2.2. Specularity and Roughness

In addition to color, the influence of the combination of diffuse and specular reflection on the intensity of the spectral components of the reflected light was also analyzed. Specular and diffuse reflection is modulated with the RADIANCE “specularity” parameter. The root-mean-square (rms) surface slope is modulated with the “roughness” parameter. Within the RADIANCE software, the specular reflection degree can be set from 0 (with a completely diffuse reflection) to 1 (with a completely specular reflection). Roughness degree can be set from 0 (perfectly smooth) to 1 (very rough). Within the RADIANCE software, “specularity” values lower than 0.01 and greater than 0.09 are not realistic, and neither roughness values lower than 0.01 and greater than 0.2. Three “specularity” values were analyzed: a minimum value of 0.01, an intermediate value of 0.05, and a maximum value of 0.09. In addition, four roughness values were analyzed: a minimum value of 0.01, an intermediate value of 0.05, another intermediate value of 0.10, and a maximum value of 0.20.

2.2.3. Simulated Case Scenarios

A total of 72 case scenarios for the room with the non-textured active wall were simulated, and 72, for the room with the textured active wall room. For each material type, 3 spectral reflectances were simulated; for each spectral reflectance, 3 specularities were simulated; and for each specularity, 4 roughnesses were simulated as described in Table 1.

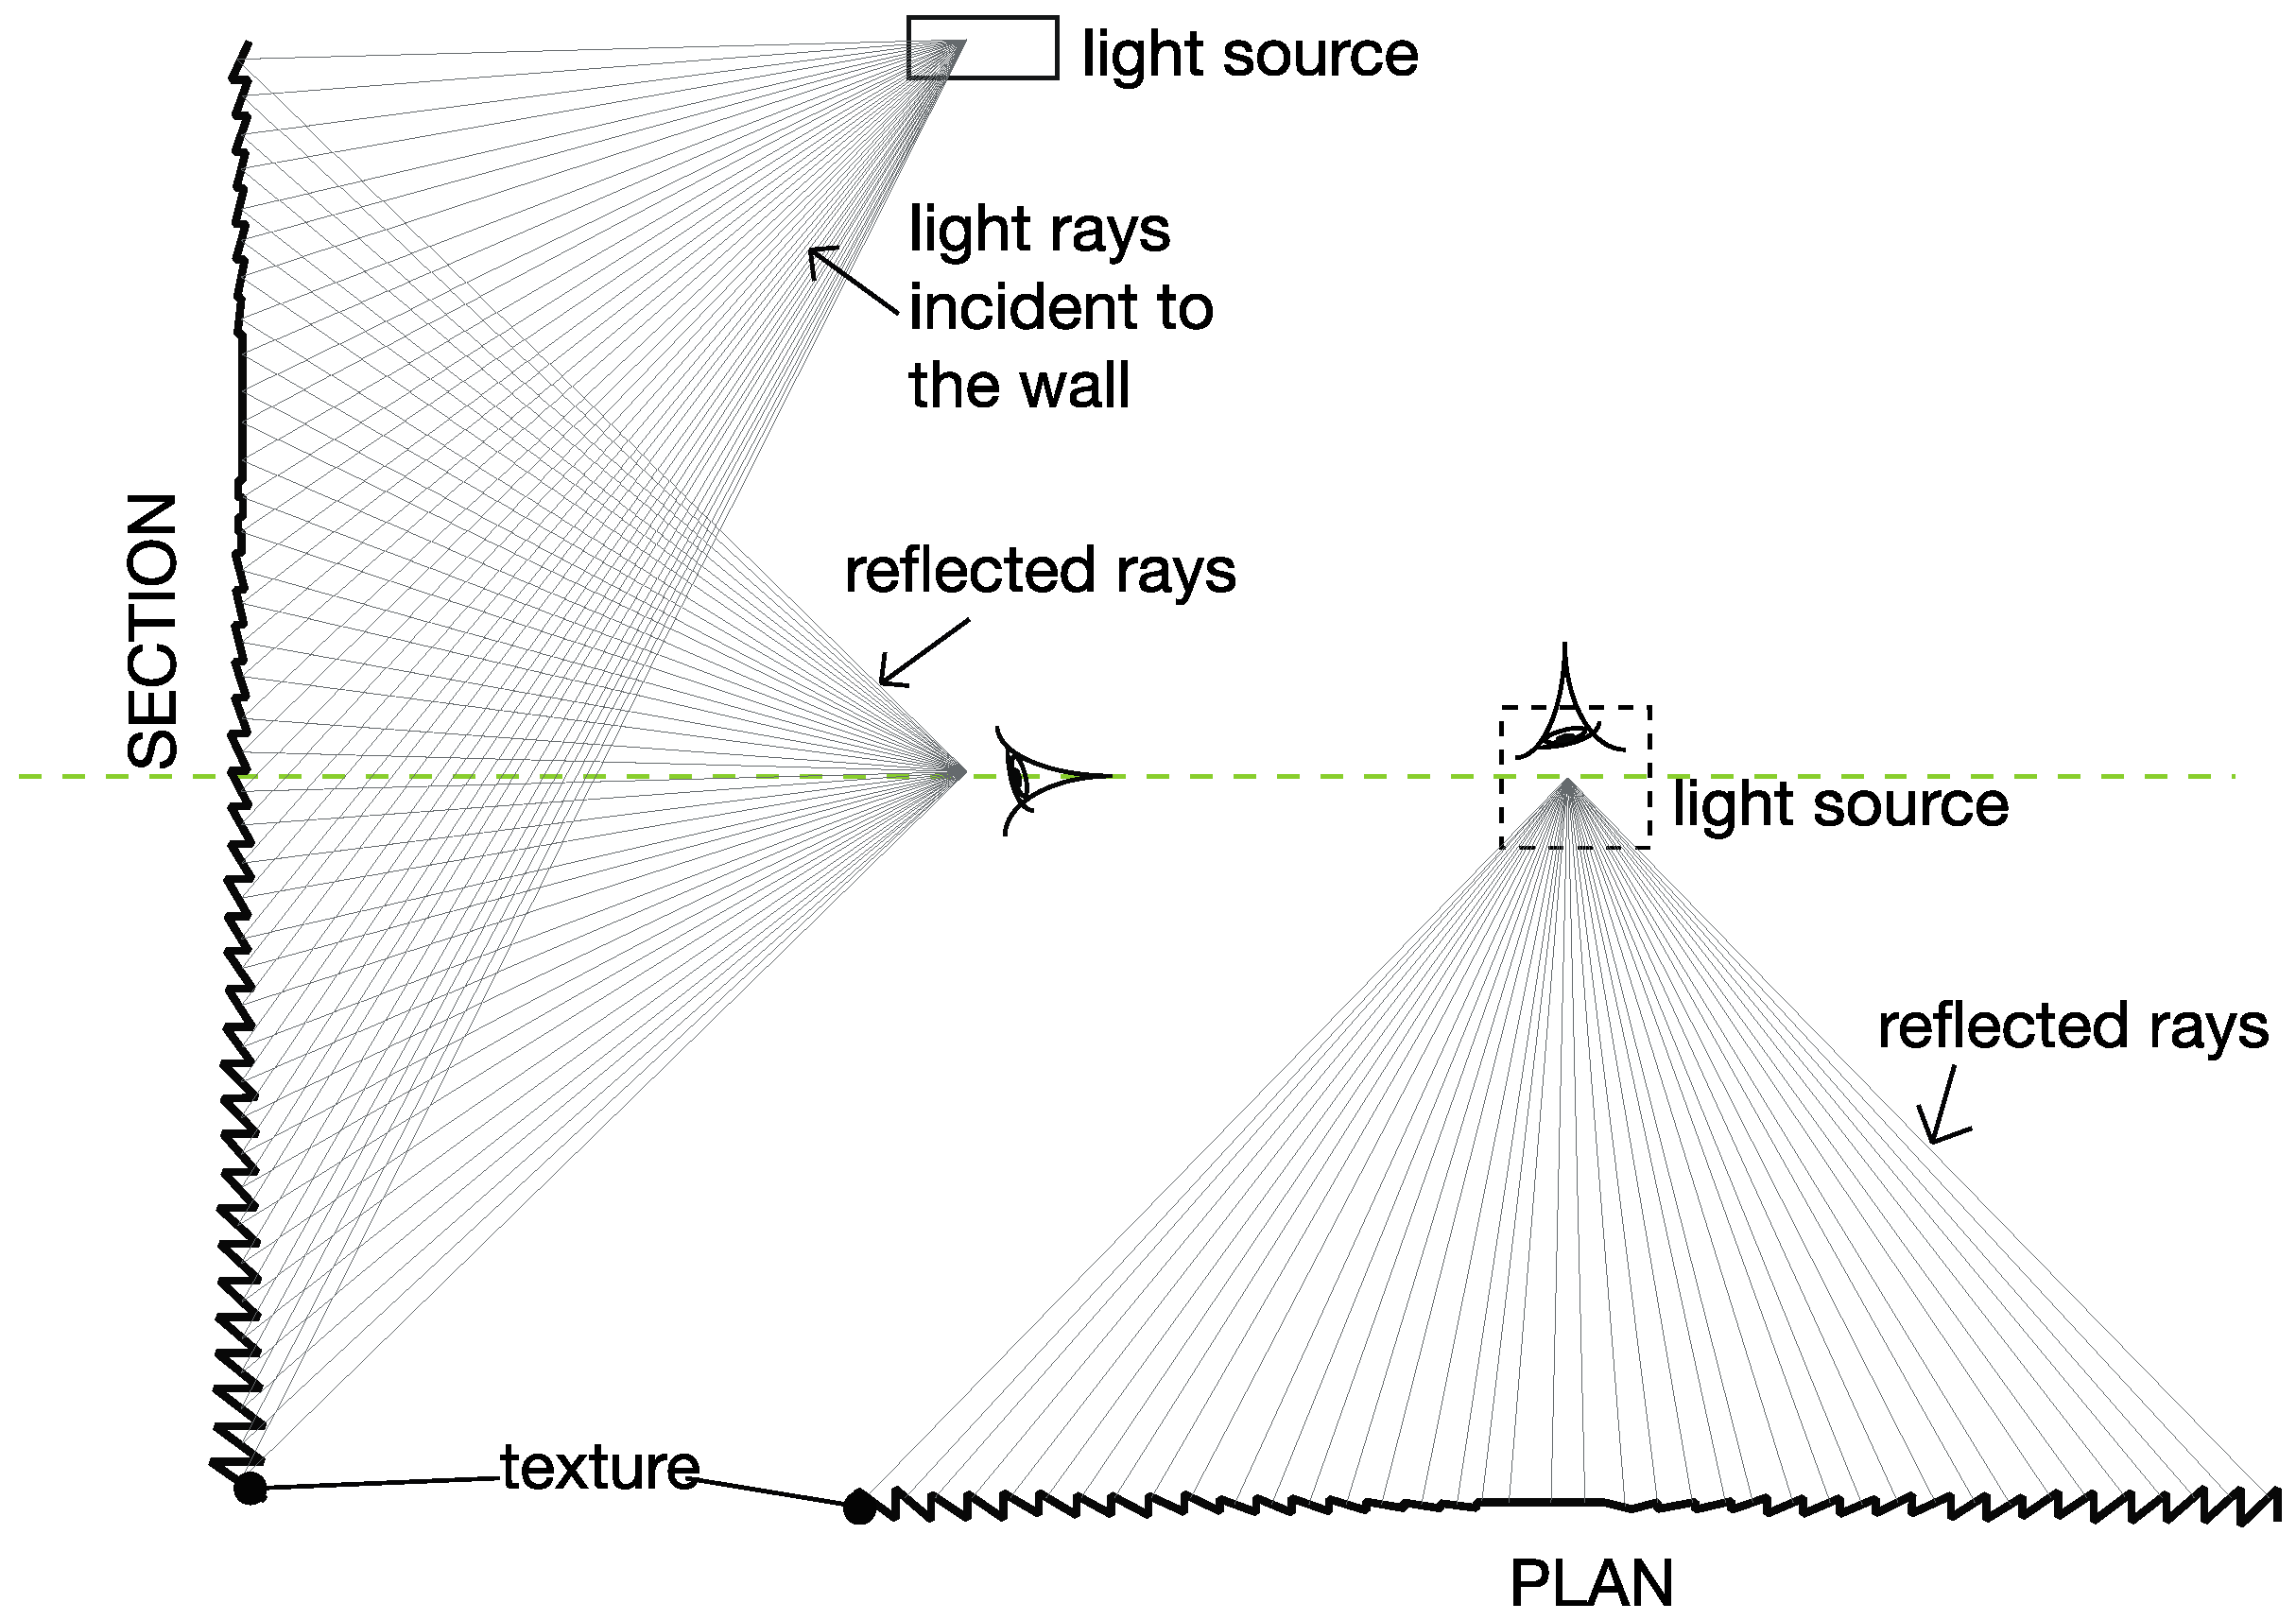
2.3. Active Wall Texture

The active wall texture (see Figure 4) was modeled using a mathematical algorithm that perturbed the wall surface normal to reflect and concentrate the rays of the light source towards the focal point (geometrical center of the room).
The next section describes the wall surface normal perturbation in terms of its parameter values.
The following variables were given:
  • A 1 ,   A 2 ,   A 3  Light source position in world coordinates
  • A 4 ,   A 5 ,   A 6  Focal point position in world coordinates
  • P x ,   P y ,   P z      Intersection point of ray with active wall in world coordinates
First, the three components of the unnormalized vector to the source was computed as follows:
s r c _ v x = A 1 P x
s r c _ v y = A 2 P y
s r c _ v z = A 3 P z
Then, the three components of the unnormalized vector to the focal point were computed as follows:
f p _ v x = A 4 P x
f p _ v y = A 5 P y
f p _ v z = A 6 P z
The three components of the normalized vector to the source were computed with the following equations:
s r c _ l e n = ( s r c _ v x ) 2 + ( s r c _ v y ) 2 + ( s r c _ v z ) 2
s r c _ n x = s r c _ v x s r c _ l e n
s r c _ n y = s r c _ v y s r c _ l e n
s r c _ n z = s r c _ v z s r c _ l e n
Next, the three components of the normalized vector to the focal point were computed as follows:
f p _ l e n = ( f p _ v x ) 2 + ( f p _ v y ) 2 + ( f p _ v z ) 2
f p _ n x = f p _ v x f p _ l e n
s r c _ n y = f p _ v y f p _ l e n
f p _ n z = f p _ v z f p _ l e n
The three components unnormalized bisecting vector between the focal point and the light source were computed as follows:
h _ v x = s r c _ n x + f p _ n x
h _ v y = s r c _ n y + f p _ n y
h _ v z = s r c _ n z + f p _ n z
The three components unnormalized bisecting vector between the focal point and the light source were computed as follows:
h _ l e n = ( h _ v x ) 2 + ( h _ v y ) 2 + ( h _ v z ) 2
h _ n x = h _ v x h _ l e n
h _ n y = h _ v y h _ l e n
h _ n z = h _ v z h _ l e n
The three components of the active wall normal perturbations were computed as follows:
d x = h _ n x N x
d y = h _ n y N y
d z = h _ n z N z
Finally, the visible areas of the texture of the active wall from the focal point were computed as follows:
s r c _ cos = N x ( s r c _ n x ) + N y ( s r c _ n y ) + N z ( s r c _ n z )
f p _ cos = N x ( f p _ n x ) + N y ( f p _ n y ) + N z ( f p _ n z )
v i s _ ratio = i f ( s r c _ c o s f p _ c o s ,   f p _ c o s s r c _ c o s ,   s r c _ c o s f p _ c o s )
The texture was composed of different sections that reflected the light specularly and diffusively. The sections that reflect the light specularly were the ones that redirected them towards the focal point; the sections that reflected the light diffusively redirected the reflected light rays away from the focal point (see Figure 5).

2.4. Spatial Distribution

The purpose of reflecting the light off a non-textured wall versus a textured wall was to evaluate how the three main primary spectral colors (red, green, and blue) of the reflected light can be redirected and distributed towards different directions and in different quantities in order to modulate the spectral composition within the room.

3. Results

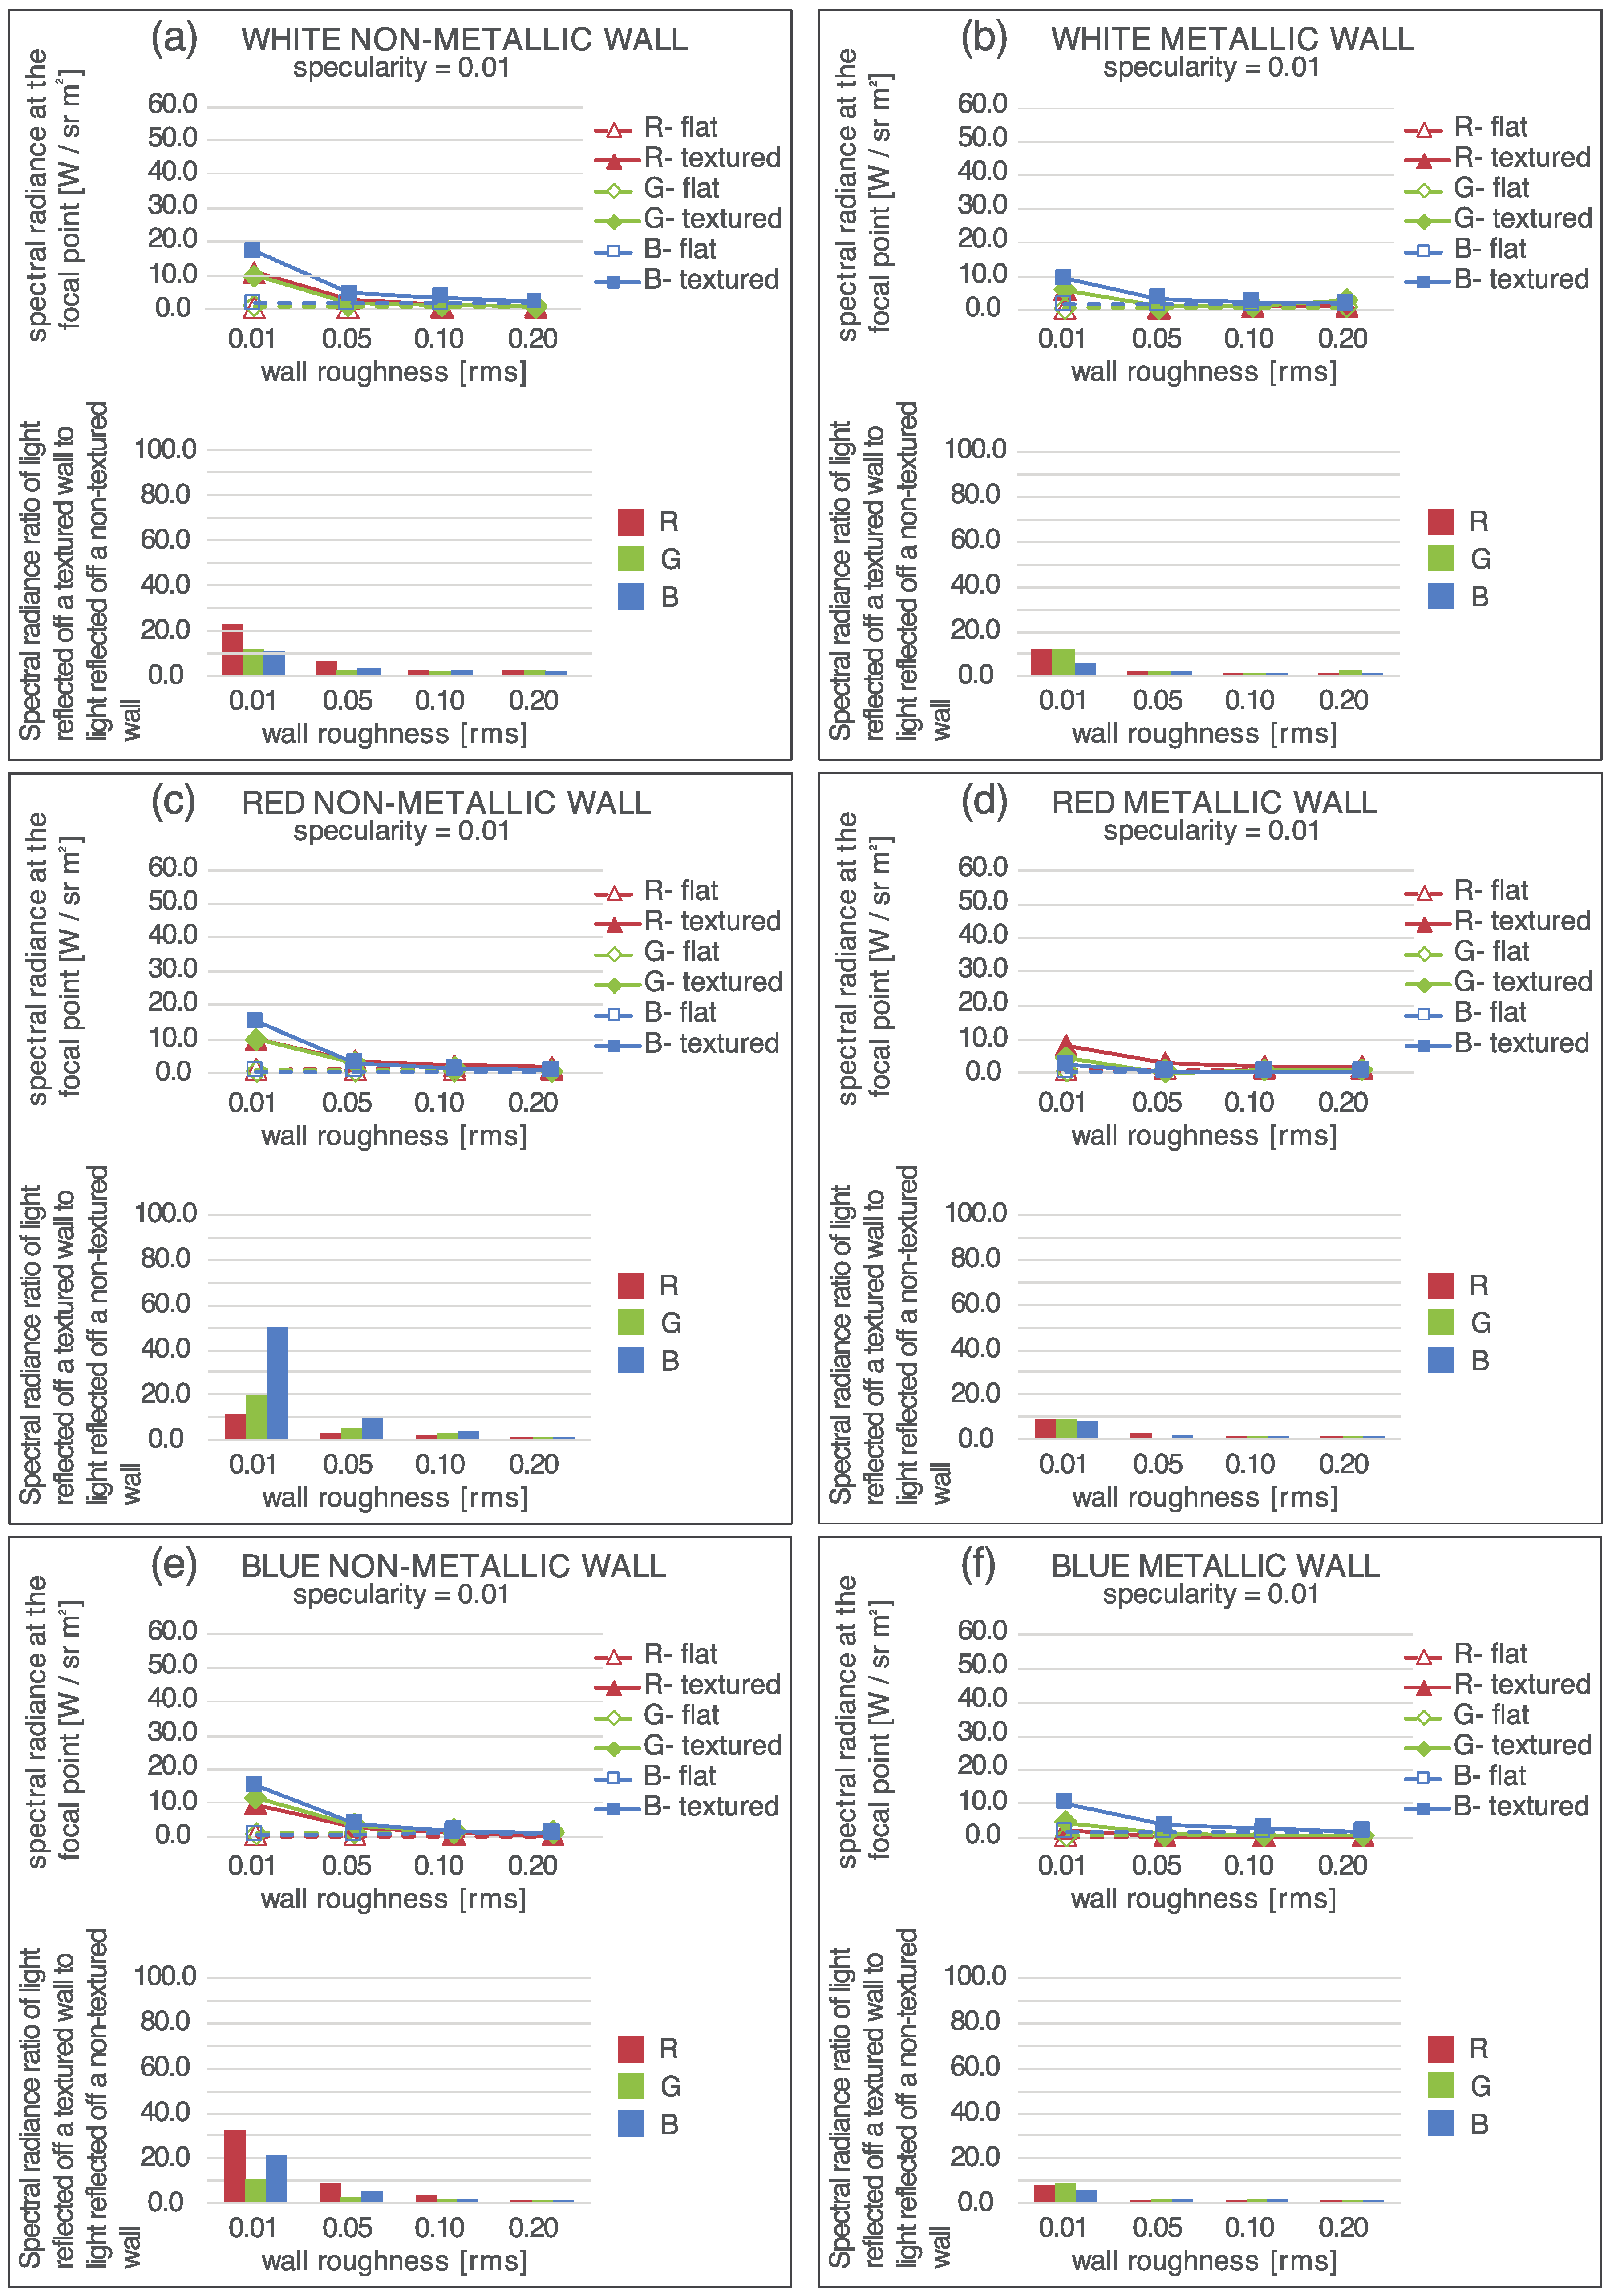
3.1. Spectral Radiance Values at the Focal Point

Figure 6, Figure 7 and Figure 8 show the obtained spectral radiance values and ratios for different specularities and roughnesses combinations. The spectral radiance values of blue-enriched light reflected off an active opaque non-metallic wall were compared with those corresponding to blue-enriched light reflected off an active metallic wall.
In relation to the reflected light red spectrum, highest radiance values at the focal point were reported in the following cases:
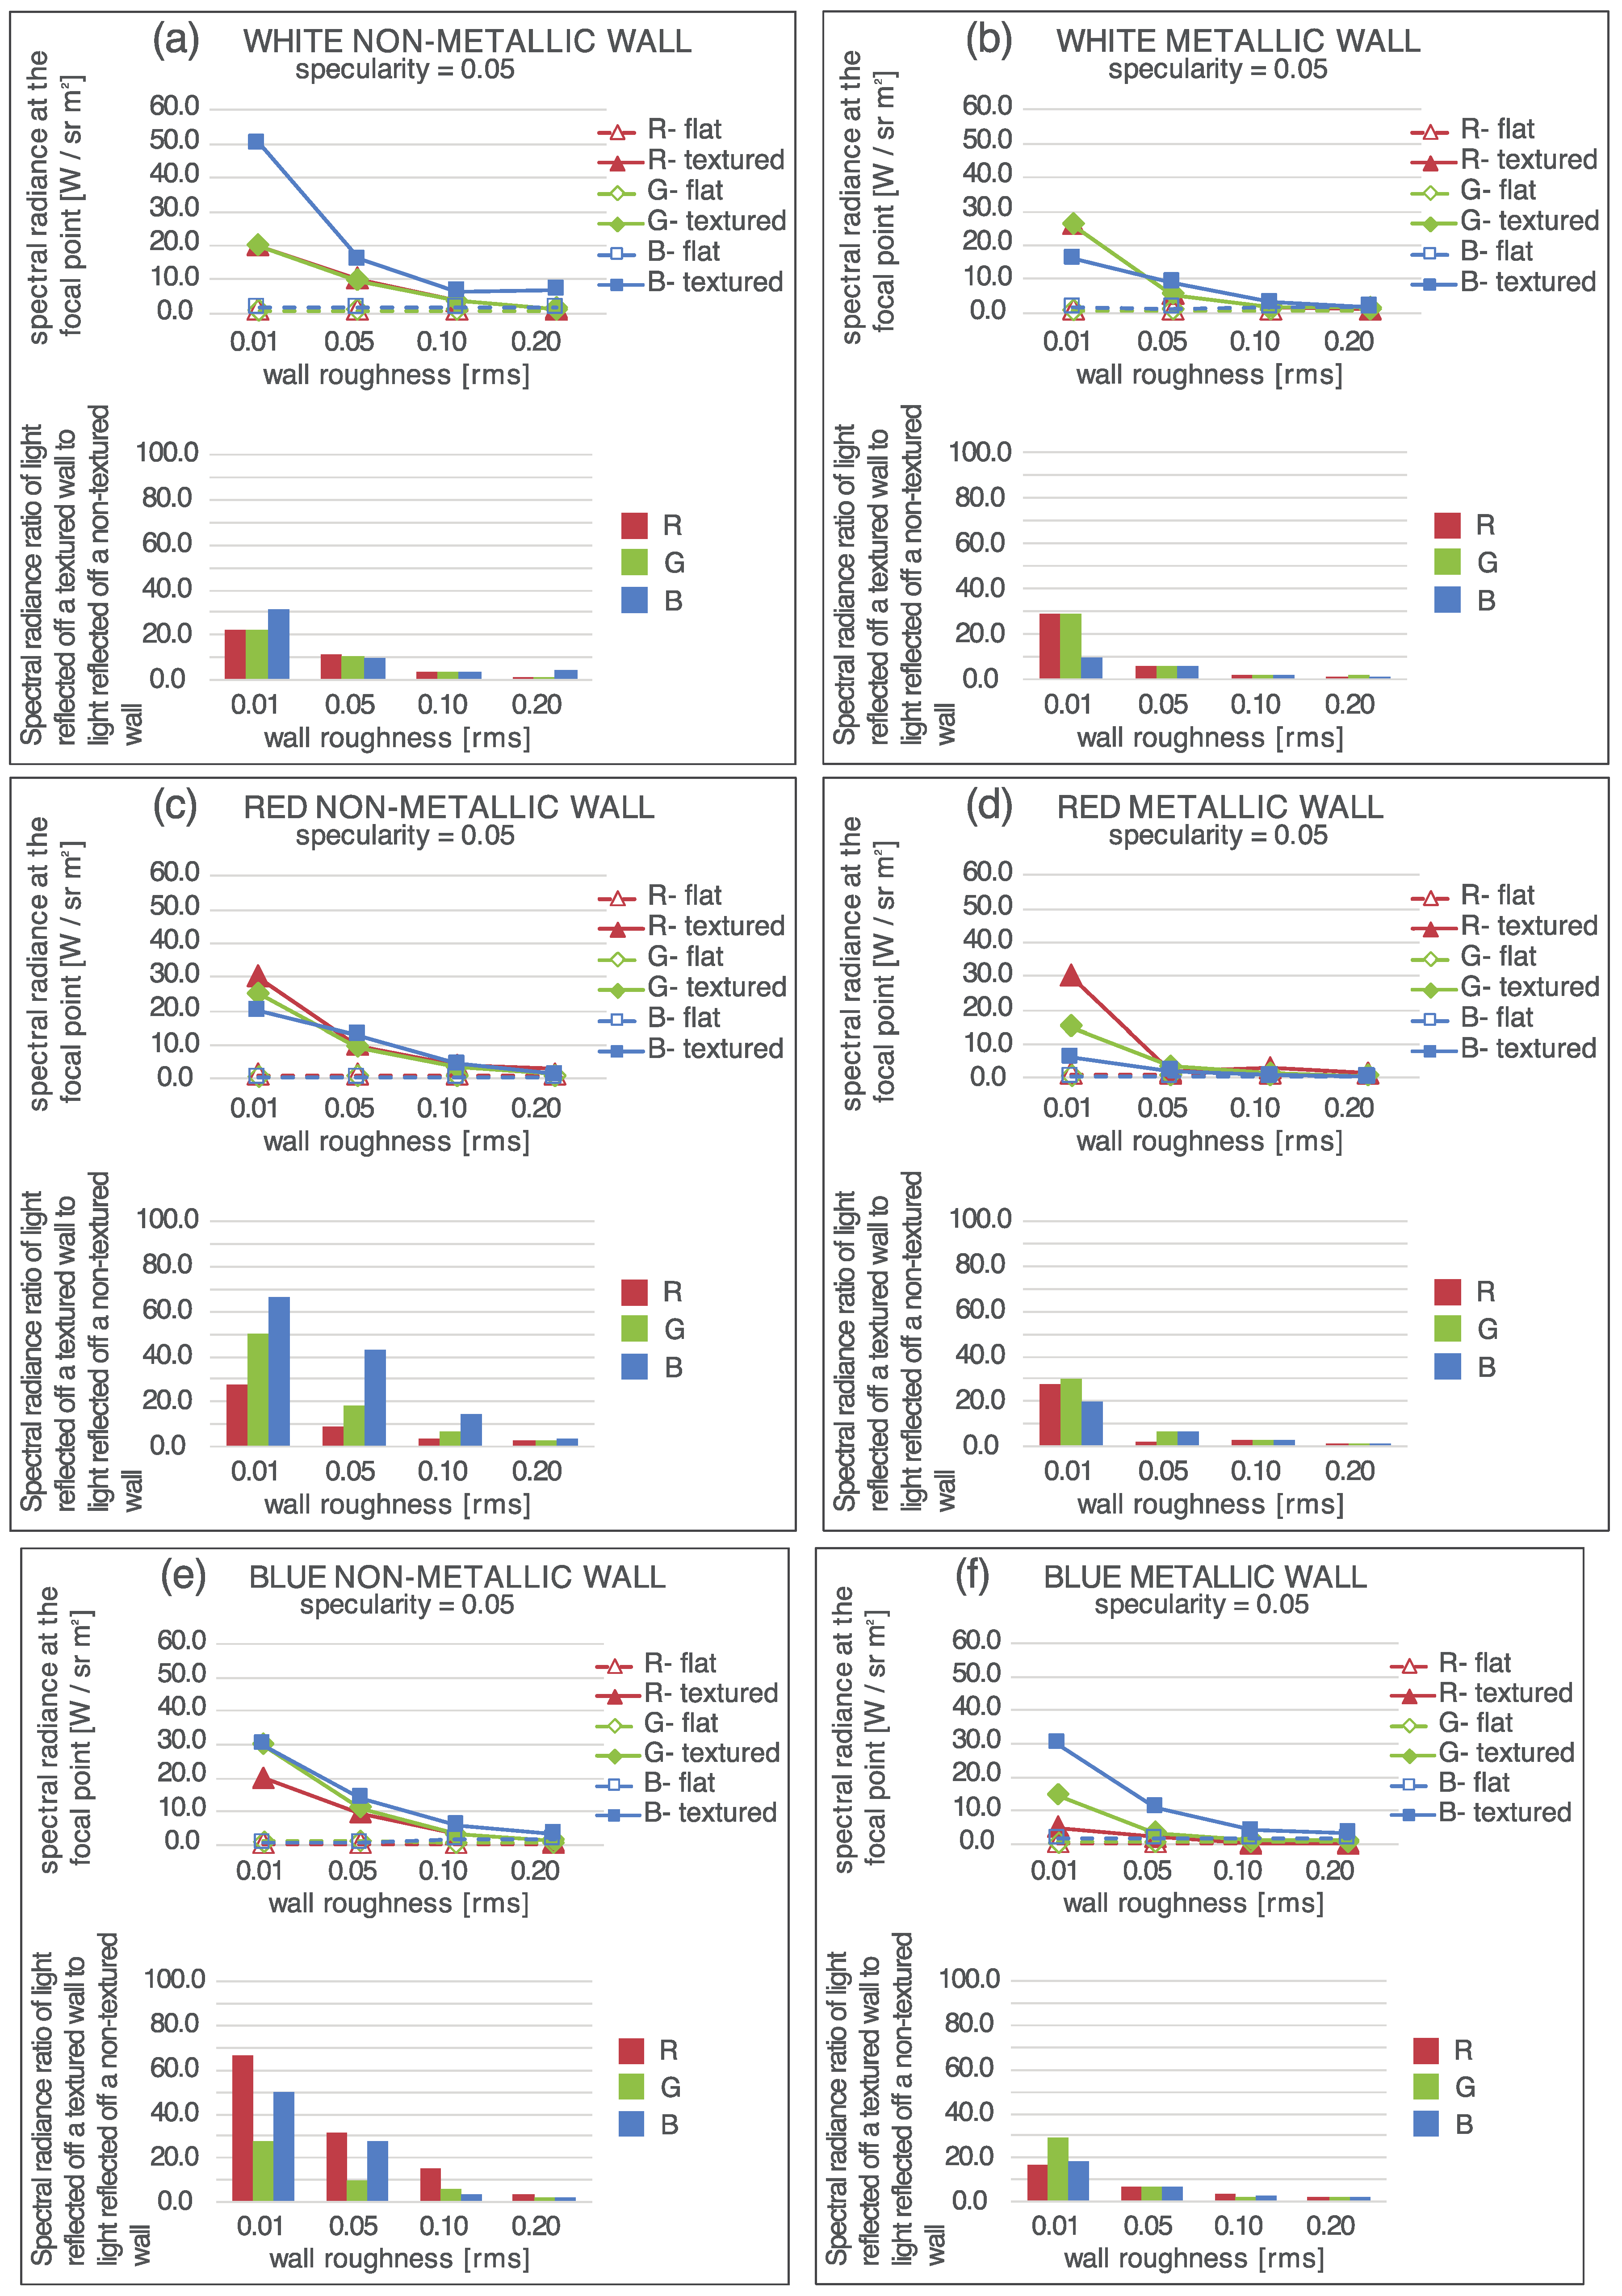
  • Figure 8a shows that the highest radiance value reached 50.00 W/sr/m2 when light was reflected off the white opaque non-metallic active textured wall with 0.09 specularity and 0.01 roughness conditions;
  • Figure 8d shows that the second highest radiance value reached 40.00 W/sr/m2 when light is reflected off the red metallic active textured wall with 0.09 specularity and 0.01 roughness conditions;
  • Figure 8c shows that the third highest radiance value reached 35.00 W/sr/m2 when light is reflected off the red opaque non-metallic active textured wall with 0.09 specularity and 0.01 roughness conditions.
In relation to the reflected light green spectrum, highest radiance values at the focal point were reported in the following cases:
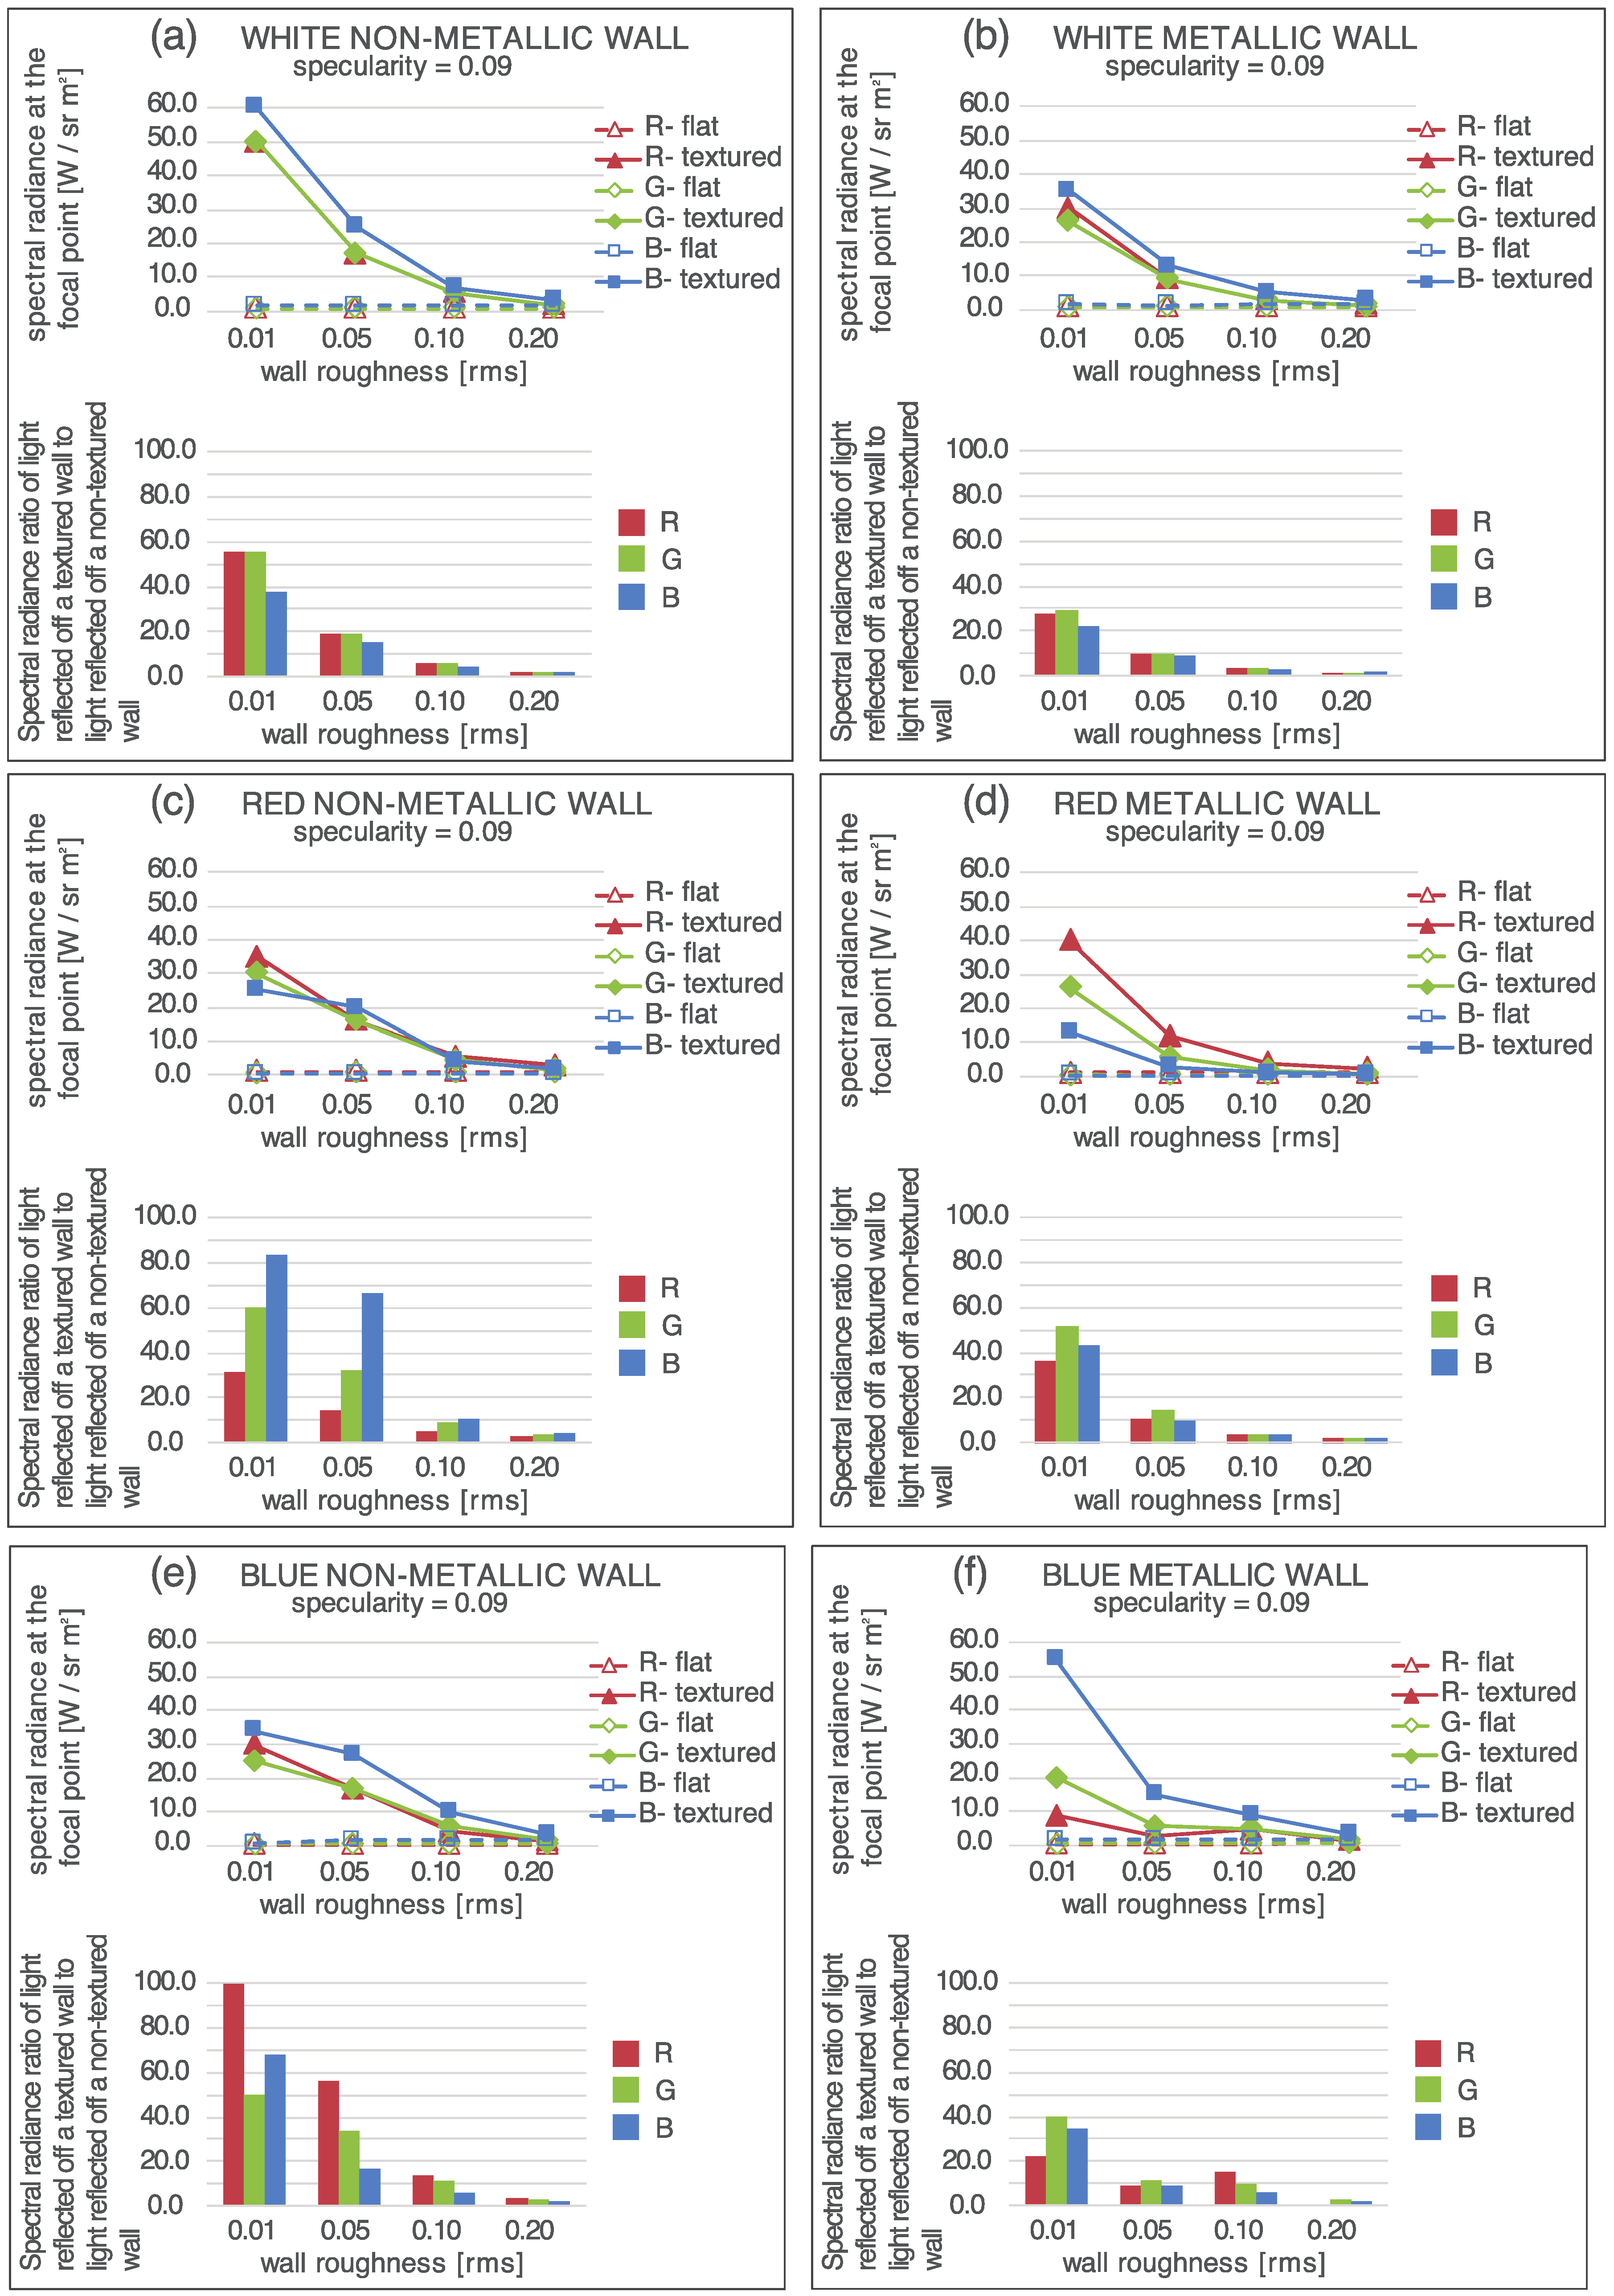
  • Figure 8a shows that the highest radiance value reached 50.00 W/sr/m2 when light is reflected off the white opaque non-metallic active textured wall with 0.09 specularity and 0.01 roughness conditions;
  • Figure 8c shows that the second highest radiance value reached 30.00 W/sr/m2 when light is reflected off the red opaque non-metallic active textured wall with 0.09 specularity and 0.01 roughness conditions;
  • Figure 8d shows that the third highest radiance value reached 26.00 W/sr/m2 when light is reflected off the red metallic active textured wall with 0.09 specularity and 0.01 roughness conditions.
In relation to the reflected light blue spectrum, highest radiance values at the focal point were reported in the following cases:
  • Figure 8a shows that the highest radiance value reached 60.00 W/sr/m2 when light is reflected off the white opaque non-metallic active textured wall with 0.09 specularity and 0.01 roughness conditions;
  • Figure 8f shows that the second highest radiance value reached 55.00 W/sr/m2 when light is reflected off the blue metallic active textured wall with 0.09 specularity and 0.01 roughness conditions;
  • Figure 8b shows that the third highest radiance value reached 35.00 W/sr/m2 when light is reflected off the white metallic active textured wall with 0.09 specularity and 0.01 roughness conditions.
Figure 6a–f, Figure 7a–f, and Figure 8a–f, show that the lowest spectral radiance values at the focal point were reported in all case scenarios where the non-textured active wall was implemented, disregarding specularity and roughness values. These spectral radiance values were the following: 0.30 W/sr/m2 for the red spectrum, 0.40 W/sr/m2 for the green spectrum, and 0.30 W/sr/m2 for the blue spectrum.
The highest spectral radiance values at the focal point were obtained on those case scenarios when the blue-enriched polychromatic light was reflected off the active walls with maximum specularity (0.90) and minimum roughness (0.01). In order to further analyze how the texture and material type of the active wall affected the spectral radiance of light at the focal point, the ratio of the spectral radiances of light reflected off the textured active wall to the blue radiance of the light reflected off a non-textured wall were calculated for those case scenarios with active walls with maximum specularity (0.90) and minimum roughness (0.01), and described in the next sections, and different material types.

3.2. Reflection off the Opaque Non-Metallic Active Wall

In this section, spectral radiance values at the focal point from blue-enriched polychromatic light reflected off an active opaque non-metallic wall with maximum specularity (0.09) and minimum roughness (0.01) are described.
Figure 8a shows that in the case of a white non-textured wall, light spectral composition is high in blue with a 1.60 W/sr/m2 radiance contribution, followed by green with a 0.90 W/sr/m2 radiance contribution, and red with also a 0.90 W/sr/m2 radiance contribution; the ratio of the blue radiance to green and red radiance is 1.77. When the texture is applied to the active wall, the spectral composition is still high in blue with a 60.00 W/sr/m2 radiance contribution, followed by green with a 50.00 W/sr/m2 radiance contribution, and red with a 50.00 W/sr/m2 radiance contribution; the ratio of the blue radiance to the green and the red radiance decreased to 1.20. Further, the ratio of the blue radiance of light reflected off the textured wall to the blue radiance of the light reflected off a non-textured wall is 37.50; for green and blue, is even higher, 55.60. Therefore, the green and red part of the spectrum were enhanced when texture was applied.
Figure 8c shows that in the case of a red-yellowish non-textured wall, the spectral radiance is high in red with a 1.10 W/sr/m2 radiance contribution, followed by green with a 0.50 W/sr/m2 radiance contribution, and blue with a 0.30 W/sr/m2 radiance contribution; the ratio of the red radiance to the green radiance is 2.20, and to the blue radiance is 3.66. When the texture is applied to the active wall, the spectral composition is still high in red with a 35.00 W/sr/m2 radiance contribution, followed by green with a 30.00 W/s/m2 radiance contribution, and then by blue with a 25.00 W/sr/m2 radiance contribution; the ratio of the red radiance to the green radiance decreased 1.16, and to the blue radiance to 1.40. Further, the ratio of the red radiance of light reflected off the textured wall to the red radiance of the light reflected off a non-textured wall is 31.80; for green is 60.00; and for blue is 83.30. Therefore, the blue part of the spectrum was more enhanced when texture was applied.
Figure 8e shows that in the case of a cyan non-textured wall, the spectral composition is high in blue with a 1.60 and W/sr/m2 radiance contribution, followed by green with a 0.50 W/s/m2 radiance contribution, and red with a 0.30 W/sr/m2 radiance contribution; the ratio of the blue radiance to the green radiance is 3.20, and to the red radiance is 5.33. When the texture is applied to the active wall, the spectral composition is still high in blue with a 34.00 W/sr/m2 radiance contribution, followed by red with a 30.00 W/sr/m2 radiance contribution, and then by green with a 25.00 W/sr/m2 radiance contribution; the ratio of the blue radiance to the red radiance decreased to 1.13 and to the green radiance to 1.36. Further, the ratio of the blue radiance of light reflected off the textured wall to the blue radiance of the light reflected off a non-textured wall is 21.30; for green is 50.00; and for red is even higher: 100.00. Therefore, the red part of the spectrum was more enhanced when texture was applied.

3.3. Reflection from a Metallic Wall

In this section, spectral radiance values at the focal point from blue-enriched polychromatic light reflected off an active metallic wall with maximum specularity (0.09) and minimum roughness (0.01) are described.
Figure 8b shows that in the case of a white non-textured wall, the spectral composition is high in blue with a 1.60 W/sr/m2 radiance contribution, followed by red with a 1.10 W/sr/m2 radiance contribution, and green with a 0.90 W/sr/m2 radiance contribution; the ratio of the blue radiance to the red radiance is 1.45 and to the green radiance is 1.77. When the texture is applied to the active wall, the spectral composition is still high in blue with a 35.00 W/sr/m2 radiance contribution, followed by red with a 30.00 W/sr/m2 radiance contribution, and green with a 26.00 W/sr/m2 radiance contribution; the ratio of the blue radiance to the red radiance decreased to 1.16, and to the green radiance to 1.35. Further, the ratio of the blue radiance of light reflected off the textured wall to the blue radiance of the light reflected off a non-textured wall is 21.90; for red is 27.30; and for green is even higher: 28.90. Therefore, the green part of the spectrum was more enhanced when texture was applied.
Figure 8d shows that in the case of a red-yellowish flat wall, spectral composition is high in red with 1.10 W/sr/m2 radiance contribution, followed by green with a 0.50 W/sr/m2 radiance contribution, and blue with a 0.30 W/s/m2 radiance contribution; the ratio of the red radiance to the green radiance is 2.20, and to the blue radiance is 3.66. When the texture is applied to the active wall, the spectral composition is still high in red with a 40.00 W/sr/m2 radiance contribution, followed by green with a 26.00 W/sr/m2 radiance contribution, and blue with a 13.00 W/sr/m2 radiance contribution; the ratio of the red radiance to the green radiance decreased to 1.54, and to the blue radiance to 3.08. Further, the ratio of the red radiance of light reflected off the textured wall to the red radiance of the light reflected off the non-textured wall is 36.40; for blue is 43.30; and for green is even higher: 52.00. The green part of the spectrum was more enhanced when texture was applied.
Figure 8f shows that in the case of a cyan non-textured wall, the spectral composition is high in blue with a 1.60 W/sr/m2 radiance contribution, followed by green with a 0.50 W/sr/m2 radiance contribution, and red with a 0.40 W/sr/m2 radiance contribution; the ratio of the blue radiance to the green radiance is 3.20, and to the red radiance is 4.00. When the texture is applied to the active wall, the spectral composition is still high in blue with a 55.00 W/sr/m2 radiance contribution, followed by green with a 20.00 W/sr/m2 radiance contribution, and then by red with an 8.80 W/sr/m2 radiance contribution; the ratio of the blue radiance to the green radiance decreased to 2.75, and to the red radiance increased to 6.25. Further, the ratio of the red radiance of light reflected off the textured wall to the red radiance of the light reflected off the non-textured wall is 22.00; for blue is 34.40; and for green is even higher: 40.00. The green part of the spectrum was more enhanced when texture was applied, even more then blue.
From these results it is deduced that the highest spectral radiance values at the focal point are reported in those case scenarios where texture was implemented to the active wall with maximum specularity (0.09) and minimum roughness (0.01), white reflectance, and with an opaque non-metallic material.

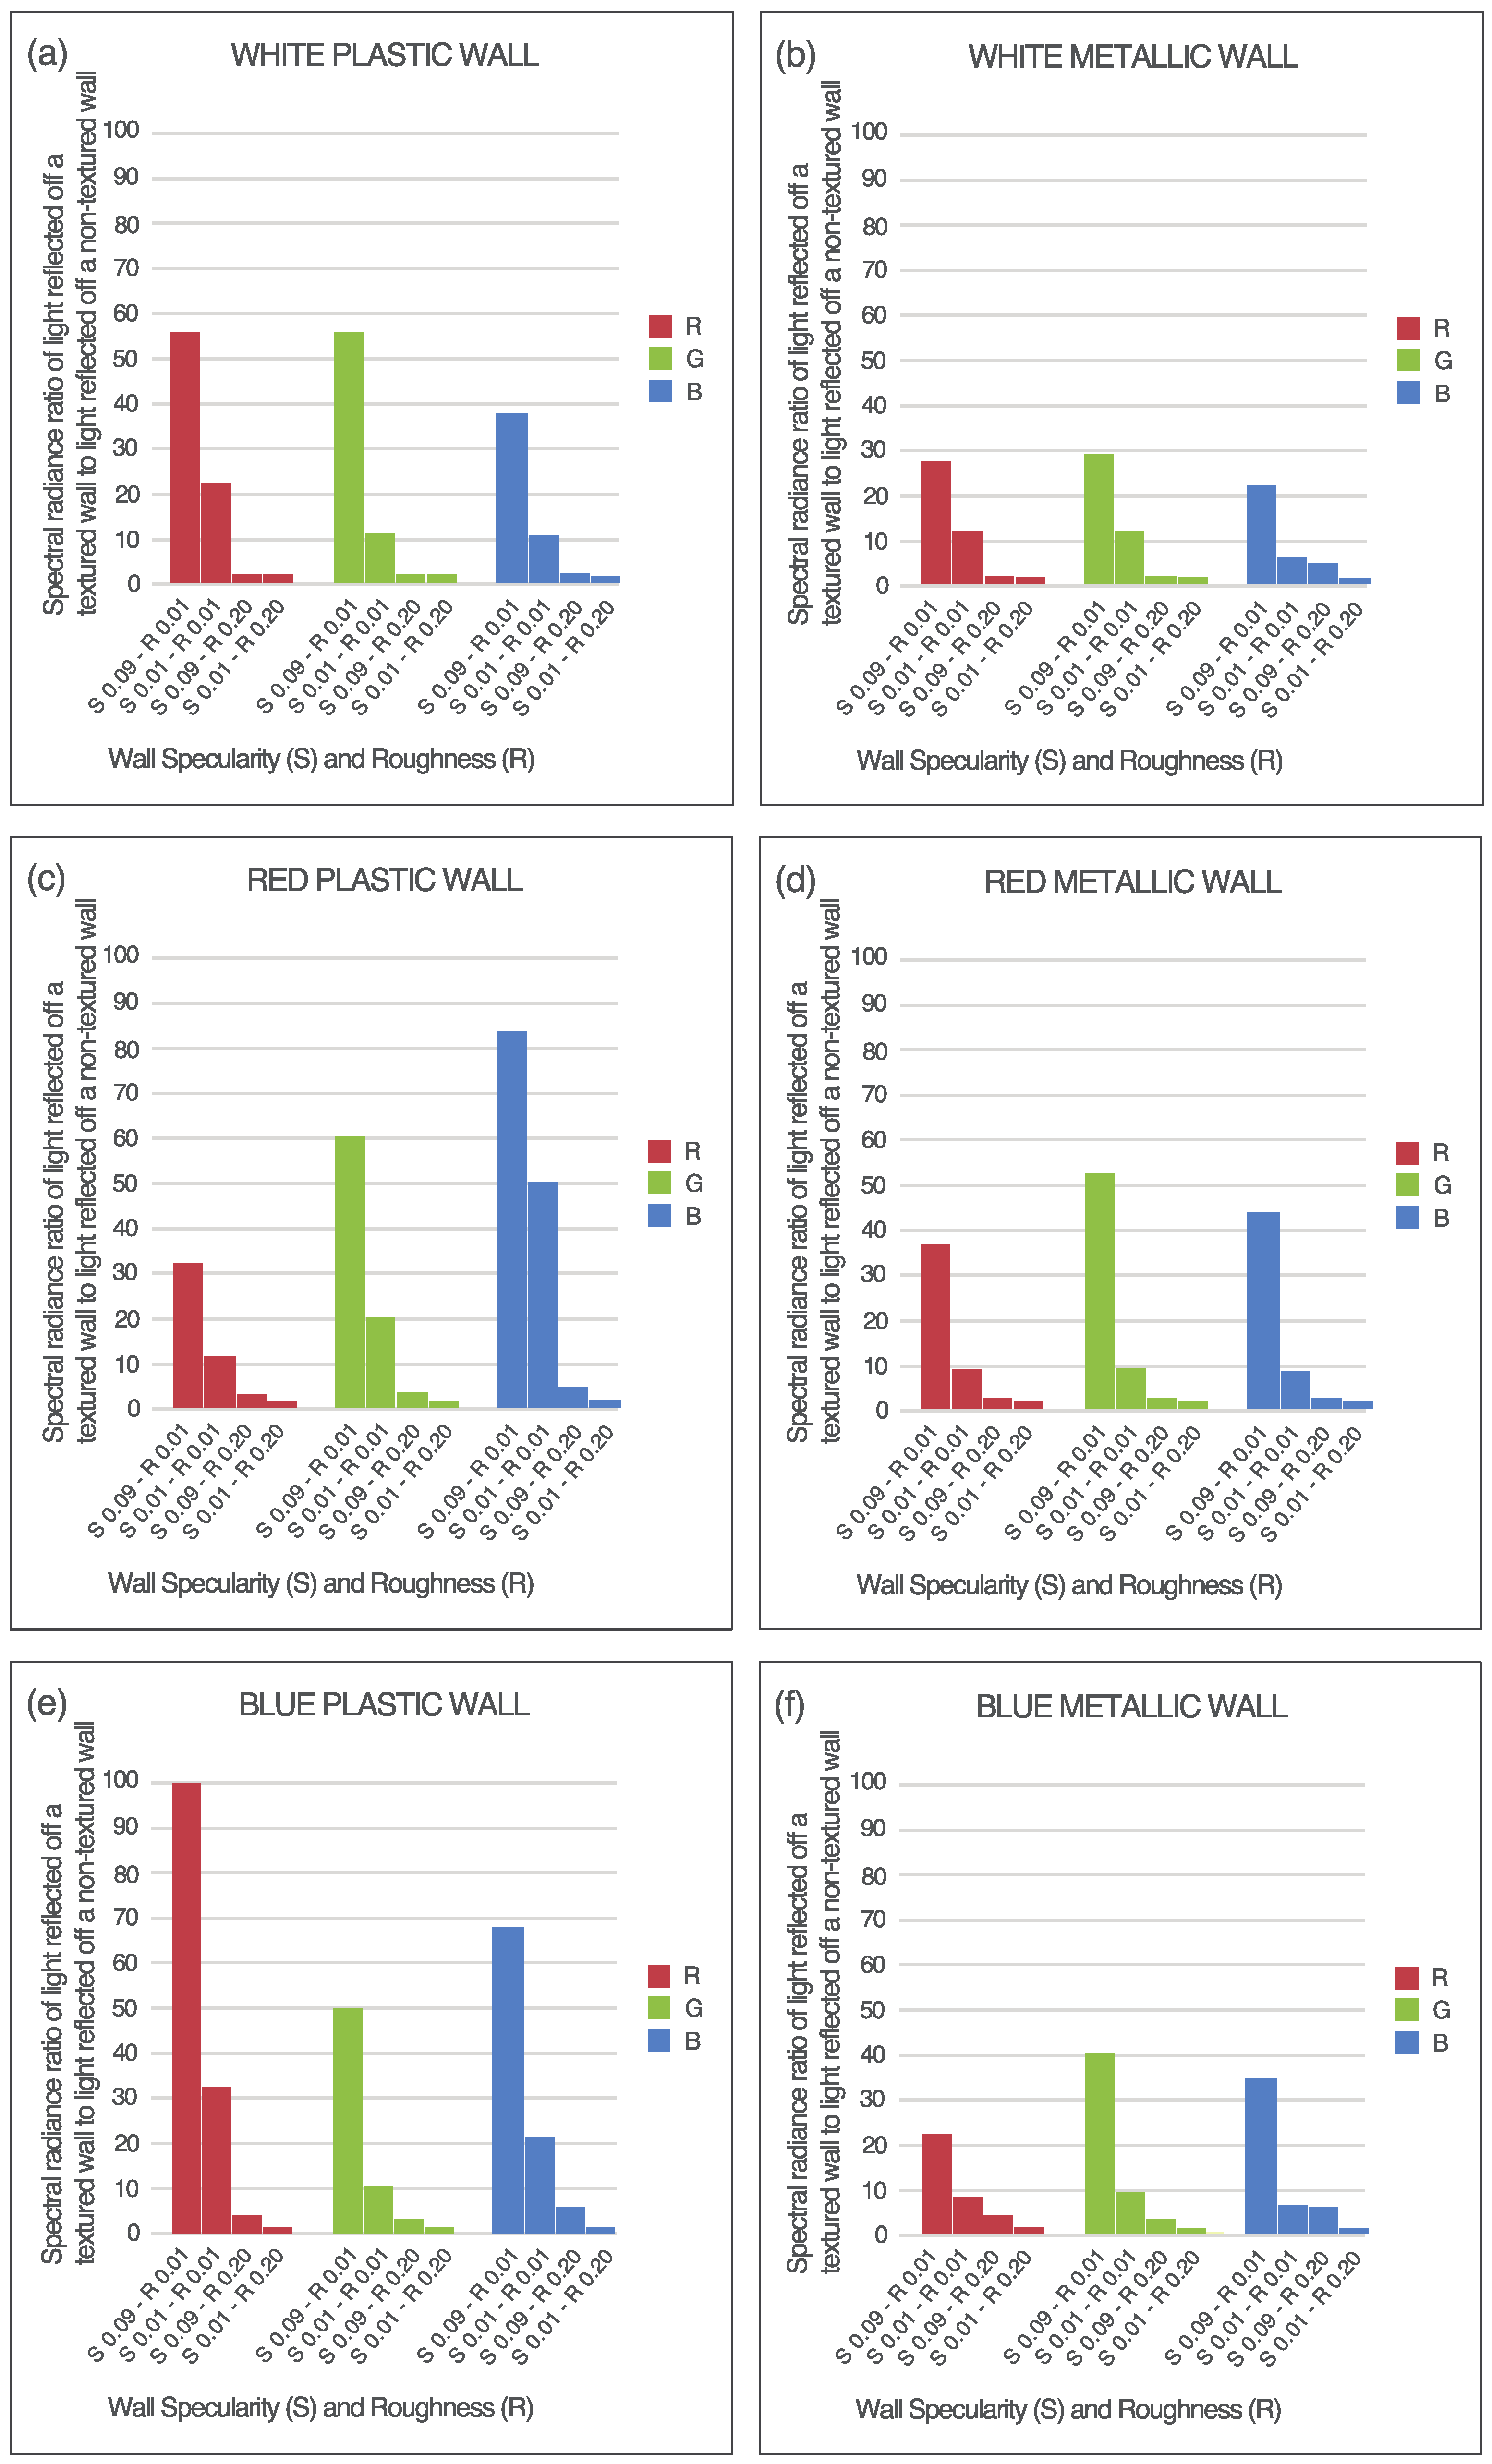
3.4. The Effect of the Material Type in Combination with Specularity–Roughness Properties on Spectral Radiances

The effect of the material type in combination with specularity–roughness properties on the spectral radiance of the reflected light at the focal point can be better comprehended by comparing the active textured wall with the active non-textured wall corresponding to those case scenarios with extreme specularity and roughness conditions as described in Figure 9a–f. The extreme conditions are the following: maximum specularity and minimum roughness, maximum specularity and maximum roughness, minimum specularity and maximum roughness, and minimum specularity and minimum roughness.
  • Figure 9e shows that the highest ratio of the red spectrum radiance of light reflected off the textured wall to the red spectrum radiance of the light reflected off the non-textured walls 100.00, and is reached when light is reflected off a cyan opaque non-metallic wall with 0.09 specularity and 0.01 roughness conditions;
  • Figure 9c shows that the highest ratio of the green spectrum radiance of light reflected off the textured wall to the green spectrum radiance of the light reflected off the non-textured wall is 60.00, and is reached when light is reflected off a red-yellowish opaque non-metallic wall with 0.09 specularity and 0.01 roughness conditions;
  • Figure 9c shows that the highest ratio of the blue spectrum radiance of light reflected off the textured wall to the blue spectrum radiance of the light reflected off the non-textured wall is 83.33, and is reached when light is reflected off a red-yellowish opaque non-metallic wall with 0.09 specularity and 0.01 roughness conditions;
  • Figure 9e shows that the lowest ratio of the red spectrum radiance of light reflected off the textured active wall to the red spectrum radiance of the light reflected off the non-textured wall is 1.33, and is reached when light is reflected off a cyan metallic wall with 0.09 specularity and 0.01 roughness conditions;
  • Figure 9e shows that the lowest ratio of the green spectrum radiance of light reflected off the textured wall to the green spectrum radiance of the light reflected off the non-textured wall is 1.20, and is reached when light is reflected off a cyan metallic wall with 0.09 specularity and 0.01 roughness conditions;
  • Figure 9e shows that the lowest ratio of the blue spectrum radiance of light reflected off the textured wall to the blue spectrum radiance of the light reflected off the non-textured wall is 1.25, and is reached when light is reflected off a cyan metallic wall with 0.09 specularity and 0.01 roughness conditions.
From this analysis, it is deduced that the highest ratios of the spectral radiances at the focal point of light reflected off the textured active wall to the spectral radiances of the light reflected off the non-textured active wall are reported in those case scenarios where an opaque non-metallic material was implemented with maximum specularity (0.09) and minimum roughness (0.01); the lowest ratios, are reported in those case scenarios where a metallic material was implemented with minimum specularity (0.01) and maximum roughness (0.01).

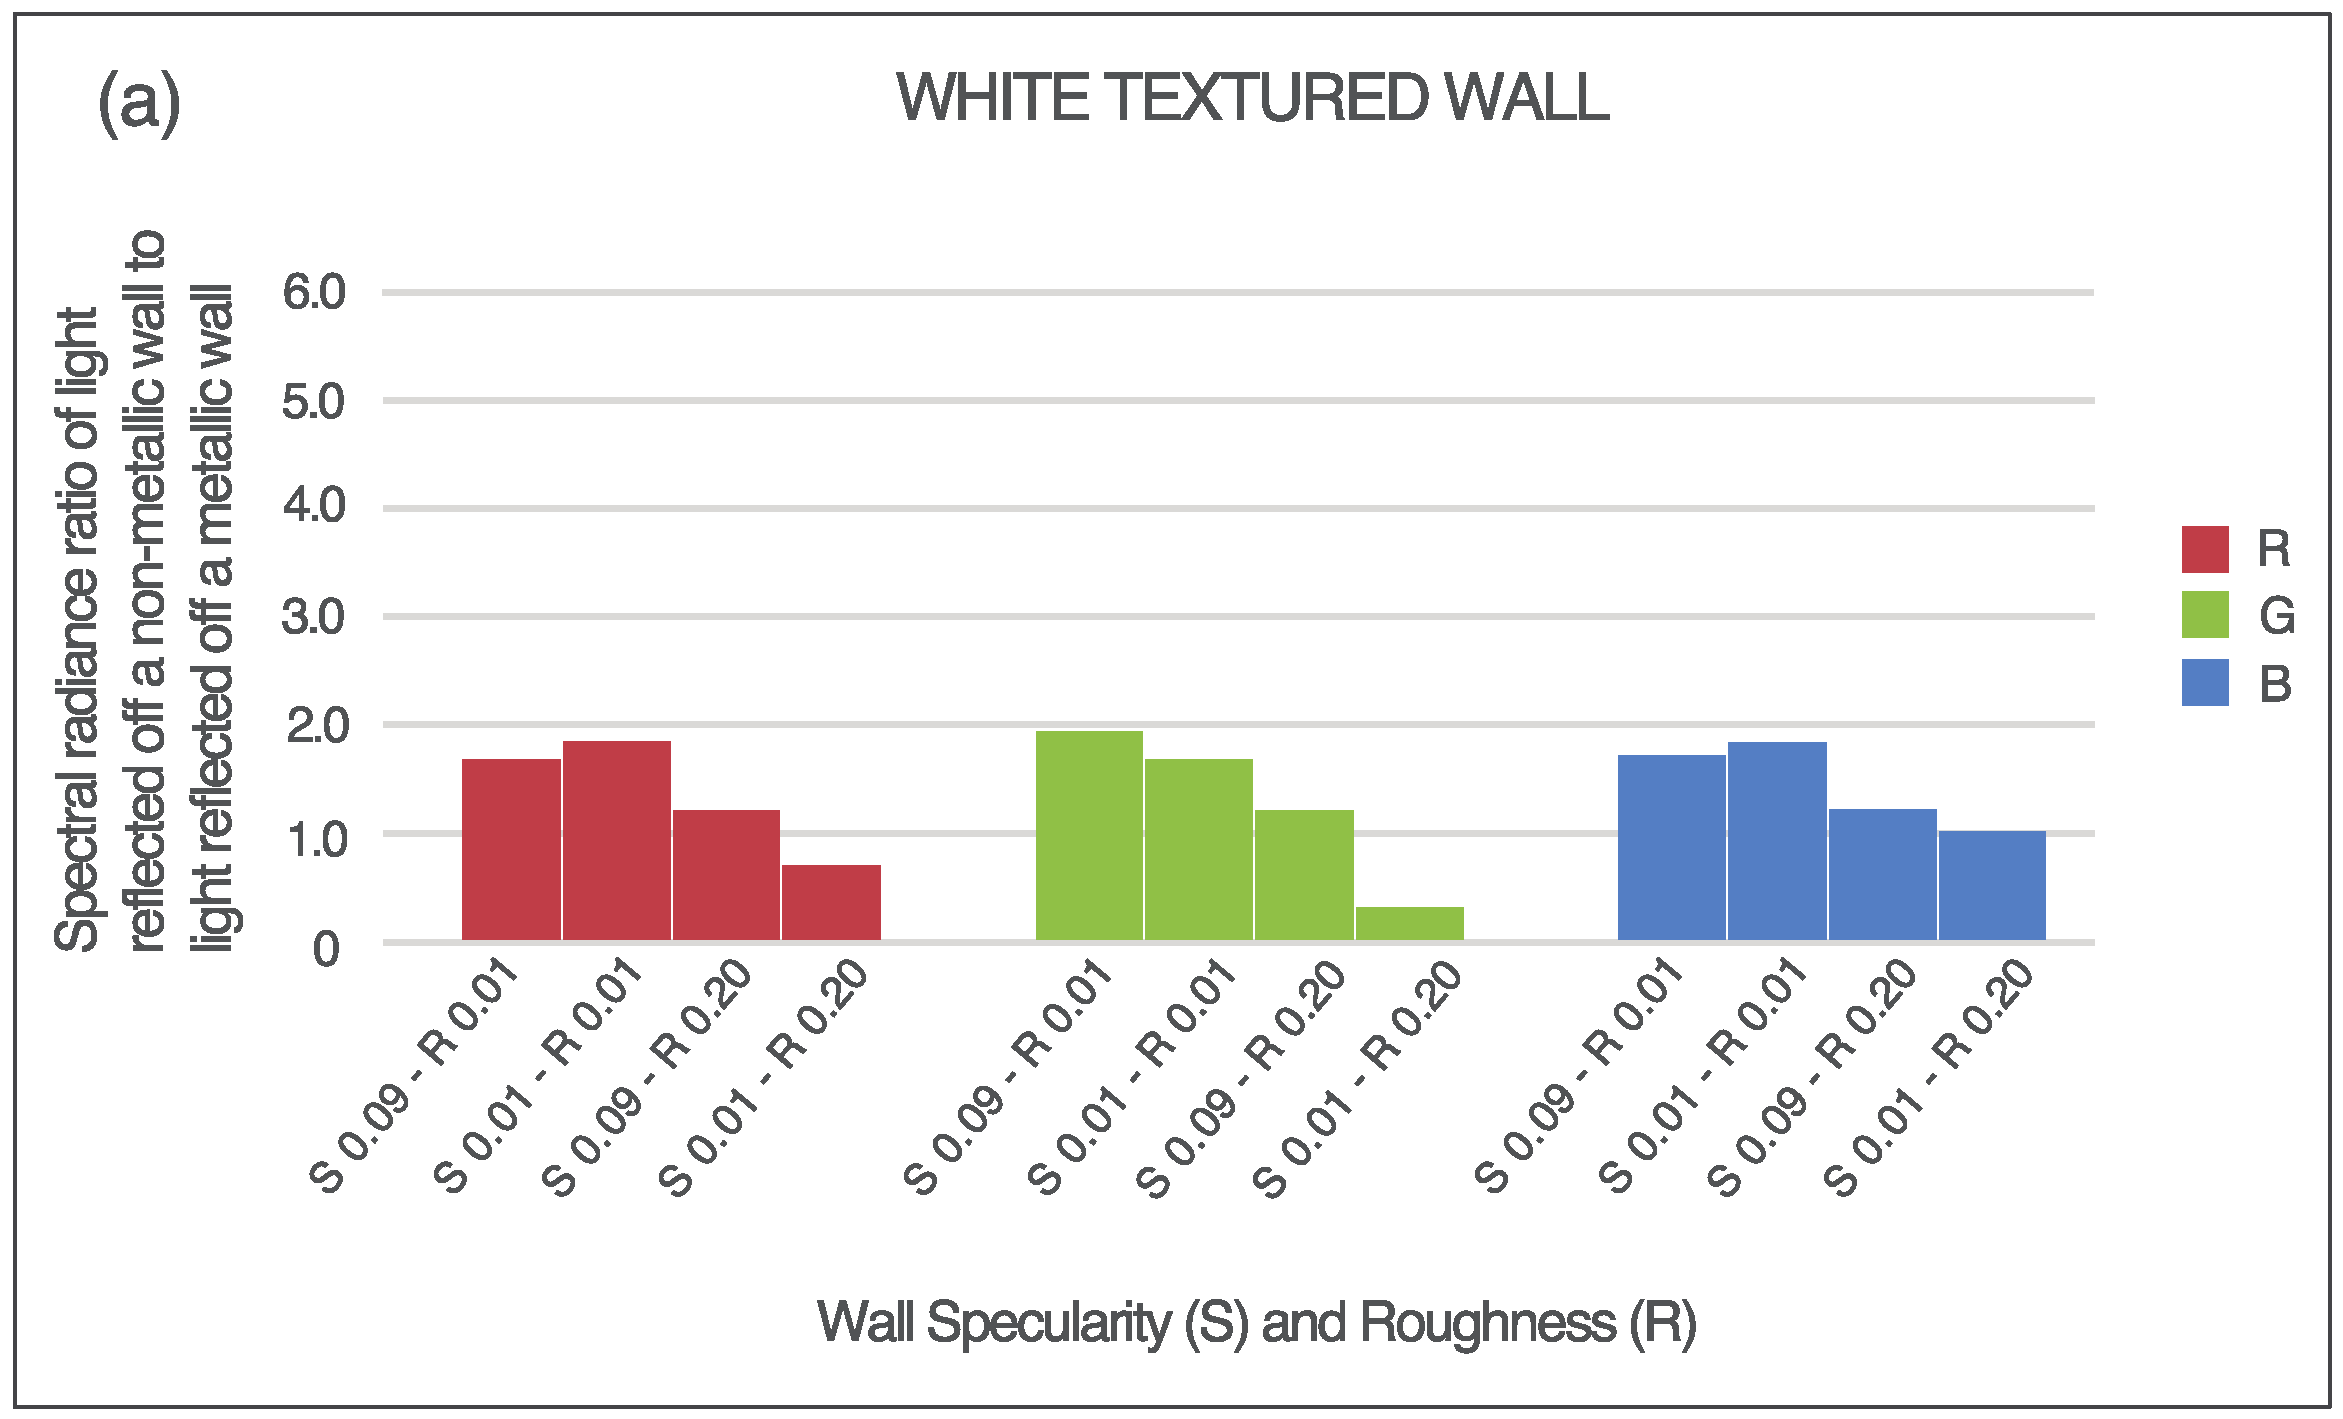
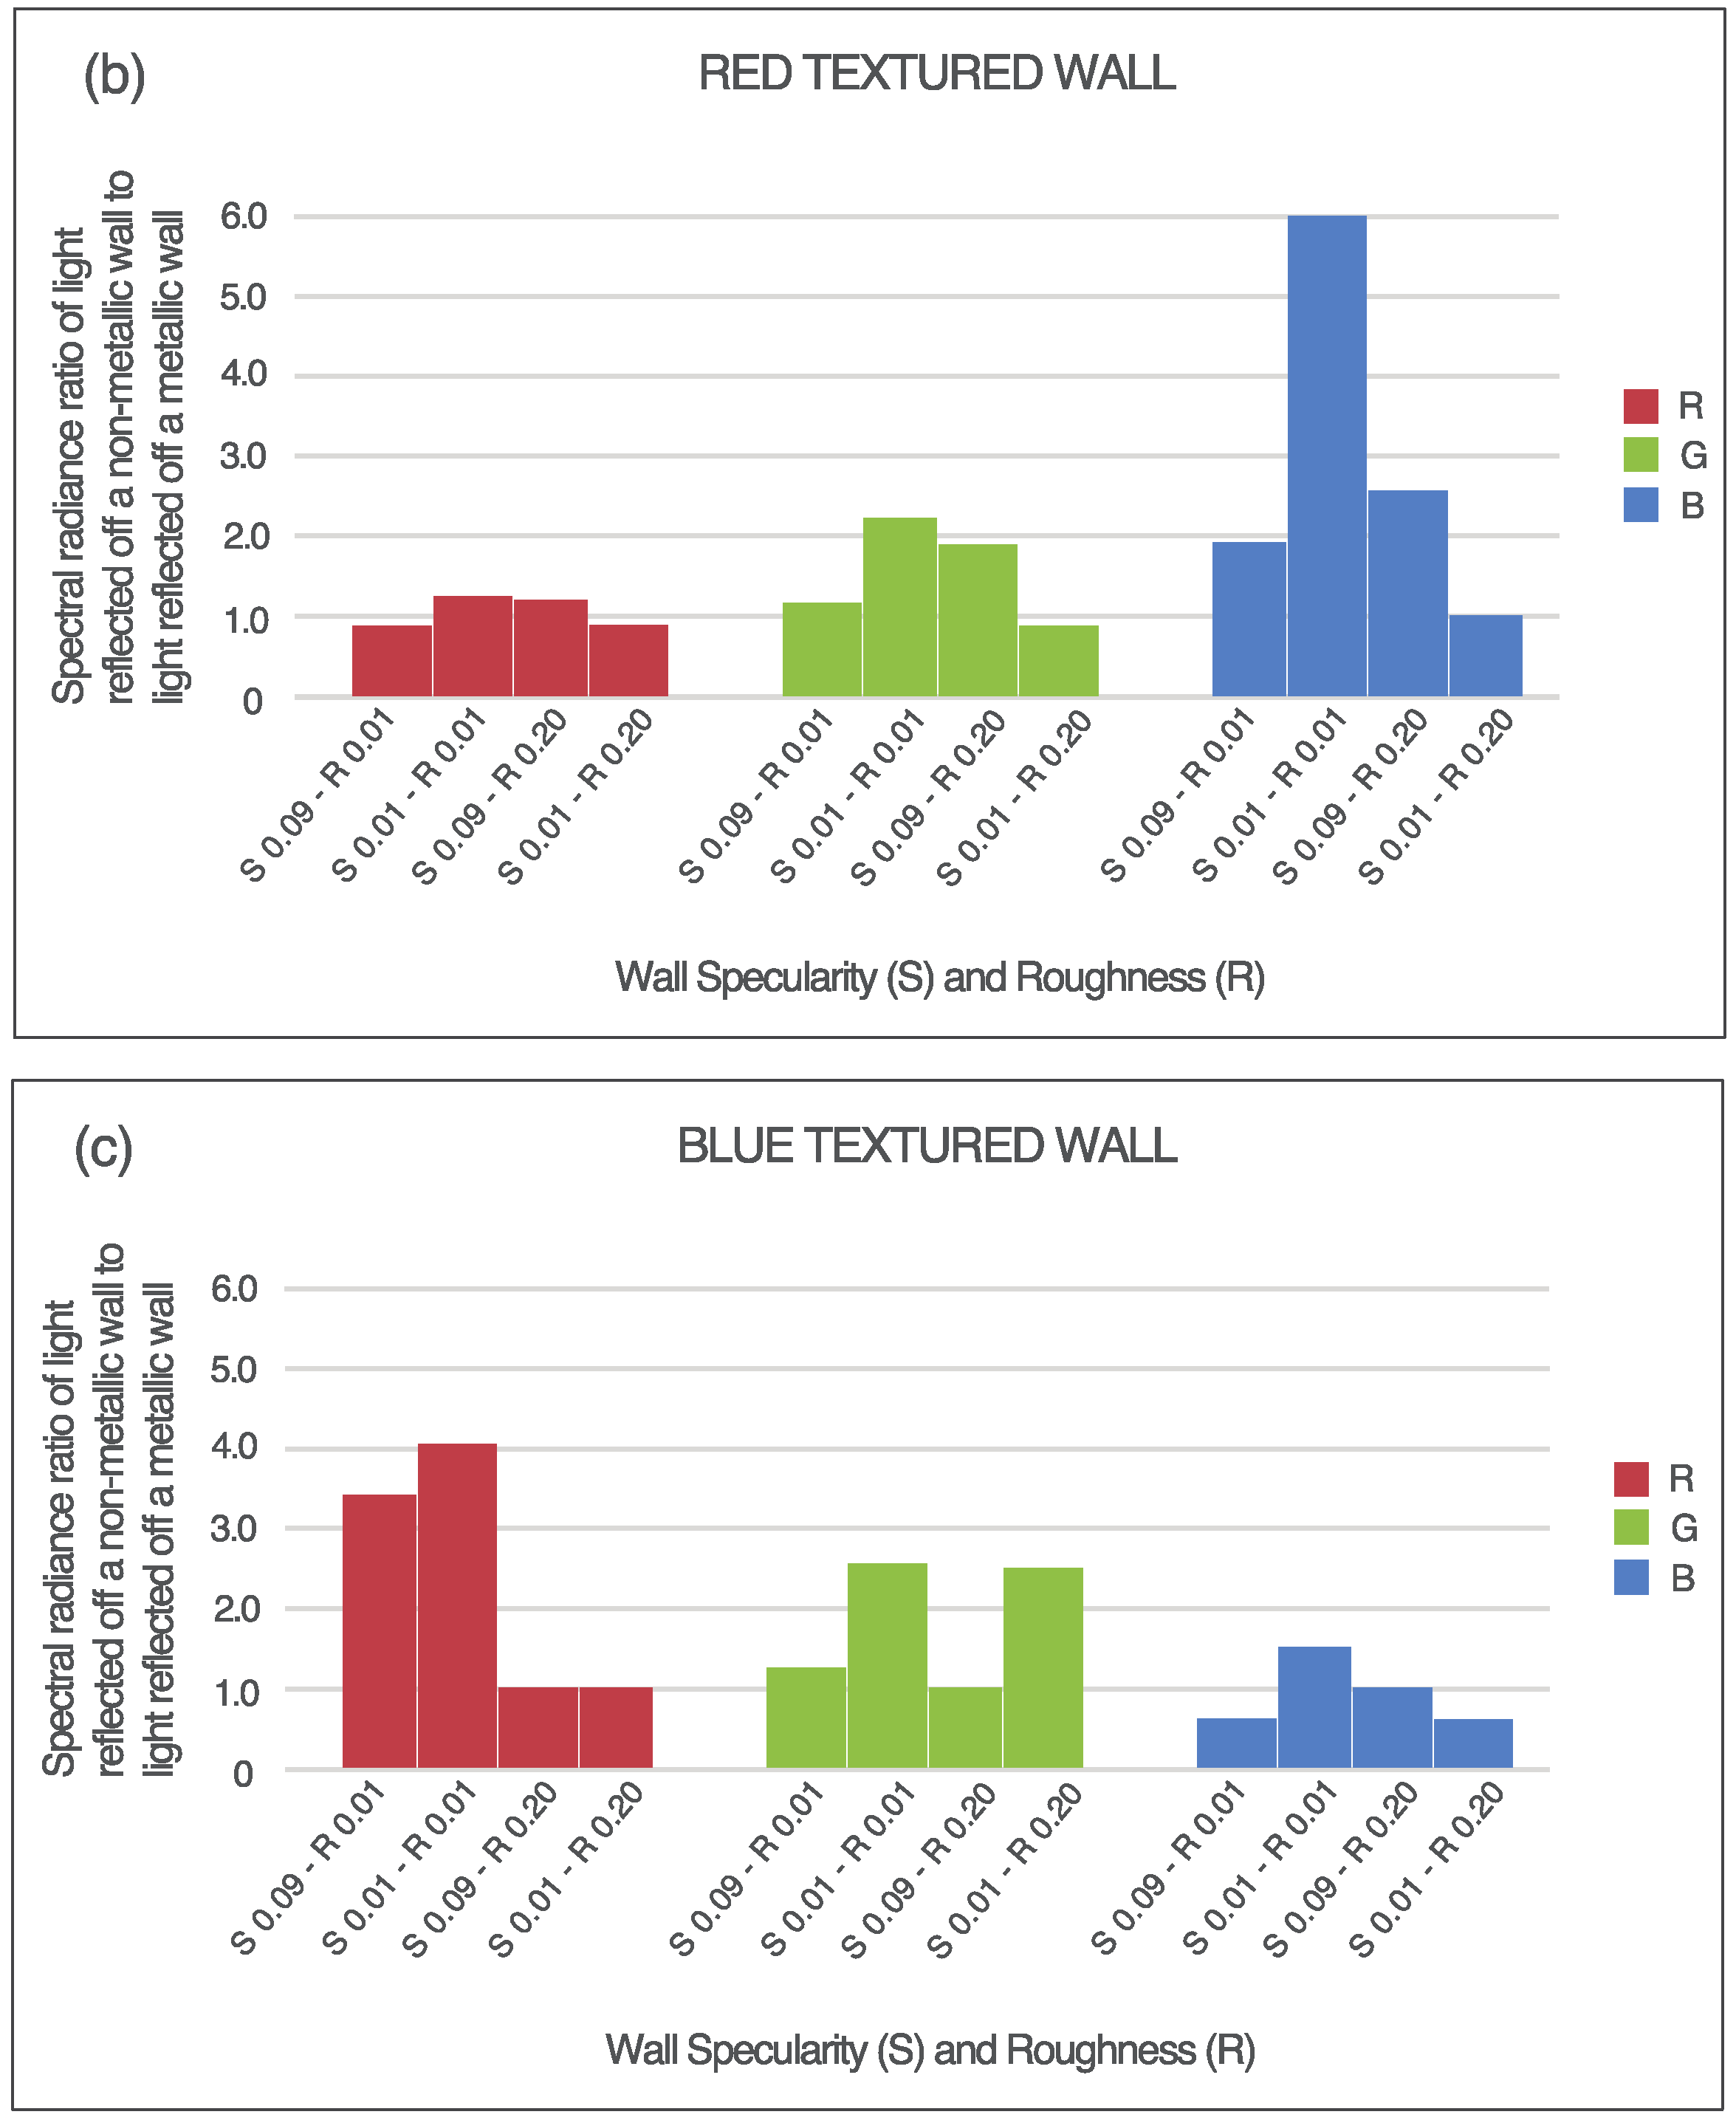
3.5. The Effect of the Wall Spectral Reflectance in Combination with Specularity–Roughness Properties on Spectral Radiances

Those case scenarios with a textured active wall and with extreme specularity and roughness conditions were also analyzed to better understand the effect of the wall spectral reflectance in combination with the specularity–roughness properties on the spectral radiances by comparing active opaque non-metallic walls with the active metallic walls described in Figure 10a–c.
  • Figure 10c shows that the highest ratio of the red spectrum radiance of light reflected off the textured opaque non-metallic wall to the red spectrum radiance of the light reflected off the textured metallic wall is 4.04 with a cyan active wall reflectance and with 0.01 specularity and a 0.01 roughness conditions;
  • Figure 10c shows that the highest ratio of the green spectrum radiance of light reflected off the textured opaque non-metallic wall to the green spectrum radiance of the light reflected off the textured metallic wall is 2.56 with a cyan active wall reflectance and a 0.01 specularity and a 0.01 roughness;
  • Figure 10b shows that the highest ratio of the blue spectrum radiance of light reflected off the textured opaque non-metallic wall to the blue spectrum radiance of the light reflected off the textured metallic wall is 6.00 with a red-yellowish active wall reflectance and with a 0.01 specularity and a 0.01 roughness.
From this analysis, it is deduced that the highest ratios of the spectral radiances at the focal point of light reflected off the textured active wall to the spectral radiances of the light reflected off the non-textured wall are reported in those case scenarios where an opaque non-metallic material was implemented with a spectral reflectance opposite to the spectral color of the reflected light and with minimum specularity (0.01) and minimum roughness (0.01). However, when roughness is increased to its maximum (0.02) and specularity stays on its minimum (0.01), the lowest ratios of the spectral radiances at the focal point of light reflected off the textured active wall to the spectral radiances of the light reflected off the non-textured wall are reported.

4. Discussion

The simulations performed in this work demonstrate that it is possible to increase or decrease radiance values corresponding to certain parts of the light spectrum at certain points in space by a passive method. This was achieved by concentrating and redirecting them towards specific points in space, in this case towards and away from the focal point through strategic interactions of spectral light characteristics with different material types and optical properties—such as spectral reflectance, specularity and roughness—as well as surface texture.
Minimum radiance values at the focal point were reported in all those cases when the active wall was non-textured, disregarding material type, surface spectral reflectance, specularity or roughness. Spectral radiances of light reflected off a metallic non-textured wall at the focal point do not differ much from those corresponding to light reflected off an opaque non-metallic non-textured flat wall. However, specularity, roughness, material type, and surface spectral reflectance do become important when the texture that concentrates the light rays towards a specific point is applied, resulting in maximum radiance values at the focal point when a white opaque non-metallic textured wall is applied with maximum specularity and minimum roughness.
The type of material of a surface reflecting light determines the nature of the specular reflection; the spectral reflectance of the surface reflecting the light enhances the nature of that specular reflection. A texture redirecting the reflected rays towards a specific point increases the spectral radiance values at that point. If that texture reflects those rays specularly, and not diffusively, towards that point, the spectral radiances can be much better modulated. Specularity of the surface reflecting light modulates the amount of light reaching a specific point; roughness modulates the concentration of the light rays.
Modulation of the spectral composition of light is more achievable when light is reflected off materials with opaque non-metallic properties due to the fact that light rays coming from this highlight are not greatly affected by the color of the surface material. On the other hand, modulation of the amount of light at a specific point can be much better achieved by changing a material specularity as long as roughness is maintained in its minimum or very low. When a balanced reflectance (white) is applied to an opaque non-metallic material, the highest spectral radiance values are obtained because the reflected light spectral composition is less affected by the spectral characteristics of the material, as opposed to the case of a metallic material. Although metals are highly reflective, the ratio of spectral radiance values of light reflected off a textured metallic wall to light reflected off a non-textured metallic wall is not as great as the ratio of spectral radiance values of light reflected off a textured opaque non-metallic wall to light reflected off a non-textured opaque non-metallic wall.
If a texture that concentrates the reflected rays towards a specific point is applied to a white opaque non-metallic material, the spectral radiance values are greatly increased. However, radiance of a certain color (i.e., red) of the reflected light spectrum may be much more increased, even if the spectral reflectance of the surface reflecting the rays is opposite to it (i.e., blue), as long as the material of the reflecting surface is an opaque non-metallic type material that reflects specularly.

5. Conclusions

The present work results show that it is possible to create indoor lighting conditions with different light spectral and quantity characteristics by using materials with certain optical properties in combination with textures using a fixed light source. The studied case scenarios show that indoor surface conditions allow one to increase or reduce the intensity of the different spectral components of light, and therefore, modulate the spectral composition of indoor polychromatic light. Light spectrum and quantity are two light characteristics important for both the visual and the circadian system, and consequently for the provision of healthy light.
Architects and light designers should consider that an interior light environment doesn’t have to provide uniform conditions to satisfy the circadian system in addition to the visual system. By knowing and choosing the right optical properties and texture of indoor surface materials, they can design comfortable spaces from the visual and circadian point of view.

Acknowledgments

The author kindly acknowledges the financial support from Consejo Nacional de Ciencia y Tecnología and Secretaría de Energía (CONACyT-SENER), project 260155. The author gratefully acknowledges Greg Ward for his technical support on the determination of the mathematical description for the modeling of the active wall texture.

Conflicts of Interest

The author declares no conflict of interest.

References

  1. Rea, M.S. The lumen seen in a new light: Making distinctions between light, lighting and neuroscience. Light. Res. Technol. 2015, 47, 259–280. [Google Scholar] [CrossRef]
  2. Dangol, R.; Islam, M.S.; Hyävrinen, M.; Bhushal, P.; Puolakka, M.; Halolen, L. User acceptance studies for LED office lighting: Preference, naturalness and colourfulness. Light. Res. Technol. 2015, 47, 36–53. [Google Scholar] [CrossRef]
  3. Baniya, R.R.; Dangol, R.; Bhusal, P.; Wilm, A.; Baur, E.; Puolakka, M.; Halonen, L. User-acceptance studies for simplified light-emitting diode spectra. Light. Res. Technol. 2015, 47, 177–191. [Google Scholar] [CrossRef]
  4. Szabó, F.; Kéri, R.; Schanda, J.; Csuti, P.; Mihálykó-Orbán, E. A study of preferred colour rendering of light sources: Home lighting. Light. Res. Technol. 2016, 48, 103–125. [Google Scholar] [CrossRef]
  5. Kuijsters, A.; Redi, J.; de Ruyter, B.; Seuntiëns, P.; Heynderickx, I. Affective ambiences created with lighting for older people. Light. Res. Technol. 2015, 47, 859–875. [Google Scholar] [CrossRef]
  6. Borisuit, A.; Linhart, F.; Scartezzini, J.-L.; Münch, M. Effects of realistic office daylighting and electric lighting conditions on visual comfort, alertness and mood. Light. Res. Technol. 2015, 47, 192–209. [Google Scholar] [CrossRef]
  7. Denk, E.; Jimenez, P.; Schulz, B. The impact of light source technology and colour temperature on the well-being, mental state and concentration of shop assistants. Light. Res. Technol. 2015, 47, 419–433. [Google Scholar] [CrossRef]
  8. Aries, M.B.C.; Begemann, S.H.A.; Zonneveldt, L.; Tenner, A.D. Retinal illuminance from vertical daylight openings in office spaces. In Proceedings of the Right Light 5 (RL5 2002), Nice, France, 29–31 May 2002; ECEEE: Stockholm, Sweden, 2002; pp. 75–80. [Google Scholar]
  9. Wilkins, A.J. A physiological basis for visual discomfort: Application in lighting design. Light. Res. Technol. 2016, 48, 44–54. [Google Scholar] [CrossRef]
  10. Comission Internationale de l’Eclairage. Ocular Lighting Effects on Human Physiology and Behaviour; Technical Report; Report No. 158; CIE: Vienna, Austria, 2004. [Google Scholar]
  11. Aries, M.B.C.; Aarts, M.P.J.; van Hoof, J. Daylight and health: A review of the evidence and consequences for the built environment. Light. Res. Technol. 2015, 47, 6–27. [Google Scholar] [CrossRef]
  12. Van Bommel, W.J.M.; van den Beld, G.J. Lighting for work: A review of visual and biological effects. Light. Res. Technol. 2004, 36, 255–269. [Google Scholar] [CrossRef]
  13. Lewy, A.J.; Wehr, T.A.; Goodwin, F.K.; Newsome, D.A.; Markey, S.P. Light suppresses melatonin secretion in human. Science 1980, 210, 1267–1269. [Google Scholar] [CrossRef] [PubMed]
  14. Rea, M.S.; Bullough, J.D.; Figueiro, M.G. Phototransduction for human melatonin suppression. J. Pineal Res. 2002, 32, 209–213. [Google Scholar] [CrossRef] [PubMed]
  15. Kronauer, R.E.; Czeisler, C.A. Understanding the use of light to control the circadian pacemaker in humans. In Light and Biological Rhythms in Man, 1st ed.; Wetterberg, L., Ed.; Pergamon Press: Tarrytown, NY, USA, 1993; pp. 179–233. [Google Scholar]
  16. Gronfier, C.; Wright, K.P.; Kronauer, R.E.; Jewett, M.E.; Czeisler, C.A. Efficacy of a single sequence of intermittent bright light pulses for delaying circadian phase in humans. Am. J. Physiol. Endocrinol. Metab. 2004, 287, E174–E181. [Google Scholar] [CrossRef] [PubMed]
  17. Jewett, M.E.; Rimmer, D.W.; Duffy, J.F.; Klerman, E.B.; Kronauer, R.E.; Czeisler, C.A. Human circadian pacemaker is sensitive to light throughout subjective day without evidence of transients. Am. J. Physiol. 1997, 273, R1800–R1809. [Google Scholar] [CrossRef] [PubMed]
  18. Warman, V.L.; Dijk, D.J.; Warman, G.R.; Arendt, J.; Skene, D.J. Phase advancing human circadian rhythms with short wavelength light. Neurosci. Lett. 2003, 342, 37–40. [Google Scholar] [CrossRef]
  19. Wright, H.R.; Lack, L.C. Effect of light wavelength on suppression and phase delay of the melatonin rhythm. Chronobiol. Int. 2001, 18, 801–808. [Google Scholar] [CrossRef] [PubMed]
  20. Wright, H.R.; Lack, L.C.; Kennaway, D.J. Differential effects of light wavelength in phase advancing the melatonin rhythm. J. Pineal Res. 2004, 36, 140–144. [Google Scholar] [CrossRef] [PubMed]
  21. Cajochen, C.; Zeitzer, J.M.; Czeisler, C.A.; Dijk, D.J. Dose–response relationship for light intensity and ocular and electroencephalographic correlates of human alertness. Behav. Brain Res. 2000, 115, 75–83. [Google Scholar] [CrossRef]
  22. Cajochen, C.; Munch, M.; Kobialka, S.; Krauchi, K.; Steiner, R.; Oelhafen, P.; Orgul, S.; Wirz-Justice, A. High sensitivity of human melatonin, alertness, thermoregulation and heart rate to short wavelength light. J. Clin. Endocrinol. Metab. 2005, 90, 1311–1316. [Google Scholar] [CrossRef] [PubMed]
  23. Scheer, F.A.; Van Doornen, L.J.; Buijs, R.M. Light and diurnal cycle affect human heart rate: Possible role for the circadian pacemaker. J. Biol. Rhythm. 1999, 14, 202–212. [Google Scholar] [CrossRef] [PubMed]
  24. Scheer, F.A.; Van Doornen, L.J.; Buijs, R.M. Light and diurnal cycle affect autonomic cardiac balance in human; possible role for the biological clock. Auton. Neurosci. 2004, 110, 44–48. [Google Scholar] [CrossRef] [PubMed]
  25. Scheer, F.A.; Buijs, R.M. Light affects morning salivary cortisol in humans. J. Clin. Endocrinol. Metab. 1999, 84, 3395–3398. [Google Scholar] [CrossRef] [PubMed]
  26. Gooley, J.J.; Rajaratnam, S.M.; Brainard, G.C.; Kronauer, R.E.; Czeisler, C.A.; Lockley, S.W. Spectral responses of the human circadian system depend on the irradiance and duration of exposure to light. Sci. Transl. Med. 2010, 2, 31–33. [Google Scholar] [CrossRef] [PubMed]
  27. Sahin, L.; Figueiro, M.G. Alerting effects of short-wavelength (blue) and long-wavelength (red) lights in the afternoon. Physiol. Behav. 2013, 116–117, 1–7. [Google Scholar] [CrossRef] [PubMed]
  28. Münch, M.; Scheuermaier, K.D.; Zhang, R.; Dunne, S.P.; Guzik, A.M.; Silva, E.J.; Ronda, J.M.; Duffy, J.F. Effects on subjective and objective alertness and sleep in response to evening light exposure in older subjects. Behav. Brain Res. 2011, 224, 272–278. [Google Scholar] [CrossRef] [PubMed]
  29. Berson, D.M.; Dunn, F.A.; Takao, M. Phototransduction by retinal ganglion cells that set the circadian clock. Science 2002, 295, 1070–1073. [Google Scholar] [CrossRef] [PubMed]
  30. Rea, M.S.; Figueiro, M.; Bierman, A.; Bullough, J.D. Circadian light. J. Circadian Rhythm. 2010, 8, 2. [Google Scholar] [CrossRef] [PubMed]
  31. Brainard, G.C.; Hanifin, J.P.; Greeson, J.M.; Byrne, B.; Glickman, G.; Gerner, E.; Rollag, M.D. Action spectrum for melatonin regulation in humans: Evidence for a novel circadian photoreceptor. J. Neurosci. 2001, 21, 6405–6412. [Google Scholar] [PubMed]
  32. Thapan, K.; Arendt, J.; Skene, D.J. An action spectrum for melatonin suppression: Evidence for a novel non-rod, non-cone photoreceptor system in humans. J. Physiol. 2001, 535, 261–267. [Google Scholar] [CrossRef] [PubMed]
  33. Hattar, S.; Lucas, R.J.; Mrosovsky, N.; Thompson, S.; Douglas, R.H.; Hankins, M.W.; Lem, J.; Biel, M.; Hofmann, F.; Foster, R.G.; et al. Melanopsin and rod-cone photoreceptive systems account for all major accessory visual functions in mice. Nature 2003, 424, 75–81. [Google Scholar] [CrossRef] [PubMed]
  34. Panda, S.; Provencio, I.; Tu, D.C.; Pires, S.S.; Rollag, M.D.; Castrucci, A.M.; Pletcher, M.T.; Sato, T.K.; Wiltshire, T.; Andahazy, M.; et al. Melanopsin is required for non-image-forming photopic responses in blind mice. Science 2003, 301, 525–527. [Google Scholar] [CrossRef] [PubMed]
  35. Rea, M. Light—Much more than vision. In Proceedings of the EPRI/LRO 5th International Lighting Research Symposium on Light and Human Health, Orlando, FL, USA, 3–5 November 2002; The Lighting Research Office of the Electric Power Research Institute: Palo Alto, CA, USA, 2002; pp. 1–15. [Google Scholar]
  36. Figueiro, M.G.; Bierman, A.; Plitnick, B.; Rea, M.S. Preliminary evidence that both blue and red light can induce alertness at night. BMC Neurosci. 2009, 10, 105. [Google Scholar] [CrossRef] [PubMed]
  37. Figueiro, M.G.; Bullough, J.D.; Bierman, A.; Rea, M.S. Retinal mechanisms determine the subadditive response to polychromatic light by the human circadian system. Neurosci. Lett. 2008, 438, 242–245. [Google Scholar] [CrossRef] [PubMed]
  38. Figueiro, M.G.; Rea, M.S.; Bullough, J.D. Circadian effectiveness of two polychromatic lights in suppressing human nocturnal melatonin. Neurosci. Lett. 2006, 406, 293–297. [Google Scholar] [CrossRef] [PubMed]
  39. Viola, A.U.; James, L.M.; Schlangen, L.J.M.; Dijk, D.J. Blue-enriched white light in the workplace improves self-reported alertness, performance and sleep quality. Scand. J. Work Environ. Health 2008, 34, 297–306. [Google Scholar] [CrossRef] [PubMed]
  40. Mills, P.R.; Tomkins, S.C.; Schlangen, L.J.M. The effect of high correlated colour temperature office lighting on employee wellbeing and work performance. J. Circadian Rhythm. 2007, 5, 2–10. [Google Scholar] [CrossRef] [PubMed]
  41. Revell, V.L.; Skene, D.J. Light-induced melatonin suppression in humans with polychromatic and monochromatic light. Chronobiol. Int. 2007, 24, 1125–1137. [Google Scholar] [CrossRef] [PubMed]
  42. Smith, M.R.; Eastman, C.I. Phase delaying the human circadian clock with blue-enriched polychromatic light. Chronobiol. Int. 2009, 26, 709–725. [Google Scholar] [CrossRef] [PubMed]
  43. Rea, M.S.; Revell, V.L.; Eastman, C.I. Phase advancing the human circadian clock with blue-enriched polychromatic light. Sleep Med. 2009, 10, 287–294. [Google Scholar]
  44. Phipps-Nelson, J.; Redman, J.R.; Dijk, D.J.; Rajaratnam, S.M. Daytime exposure to bright light, as compared to dim light, decreases sleepiness and improves psychomotor vigilance performance. Sleep 2003, 26, 695–700. [Google Scholar] [CrossRef] [PubMed]
  45. Van de walle, G.; Balteau, E.; Phillips, C.; Degueldre, C.; Moreau, V.; Sterpenich, V.; Albouy, G.; Darsaud, A.; Desseilles, M.; Dang-Vu, T.T.; et al. Daytime light exposure dynamically enhances brain responses. Curr. Biol. 2006, 16, 1616–1621. [Google Scholar] [CrossRef] [PubMed]
  46. Partonen, T.; Lönnqvist, J. Bright light improves vitality and alleviates distress in healthy people. J. Affect. Disord. 2000, 57, 55–61. [Google Scholar] [CrossRef]
  47. Rea, M.S.; Figueiro, M.G.; Bullough, J.D.; Bierman, A. A model of human circadian system. Brain Res. Rev. 2005, 50, 213–228. [Google Scholar] [CrossRef] [PubMed]
  48. Youngstedt, S.D.; Kline, C.E.; Elliott, J.A.; Zielinski, M.R.; Devlin, T.M.; Moore, T.A. Circadian Phase-Shifting Effects of Bright Light, Exercise, and Bright Light + Exercise. J. Circadian Rhythm. 2016, 14, 2. [Google Scholar]
  49. Aoki, H.; Yamada, N.; Ozeki, Y.; Yamane, H.; Kato, N. Minimum light intensity required to suppress nocturnal melatonin concentration inhuman saliva. Neurosci. Lett. 1998, 252, 91–94. [Google Scholar] [CrossRef]
  50. McIntyre, I.M.; Norman, T.R.; Burrows, G.D.; Armstrong, S.M. Human melatonin suppression by light is intensity dependent. J. Pineal Res. 1989, 6, 149–156. [Google Scholar] [CrossRef] [PubMed]
  51. McIntyre, I.M.; Norman, T.R.; Burrows, G.D.; Armstrong, S. Quantal melatonin suppression by exposure to low intensity light in man. Life Sci. 1989, 45, 327–332. [Google Scholar] [CrossRef]
  52. Rea, M.S.; Bullough, J.D.; Figueiro, M.G. Human melatonin suppression by light: A case for scotopic efficiency. Neurosci. Lett. 2001, 299, 45–48. [Google Scholar] [CrossRef]
  53. Zeitzer, J.M.; Dijk, D.J.; Kronauer, R.; Brown, E.; Czeisler, C. Sensitivity of the human circadian pacemaker to nocturnal light: Melatonin phase resetting and suppression. J. Physiol. 2000, 526, 695–702. [Google Scholar] [CrossRef] [PubMed]
  54. Davidn, H.F. Color constancy. Vis. Res. 2011, 51, 674–700. [Google Scholar]
  55. Nair, M.G.; Ganesan, A.R.; Ramamurthy, K. Daylight enhancement using laser cut panels integrated with a profiled Fresnel collector. Light. Res. Technol. 2015, 47, 1017–1028. [Google Scholar] [CrossRef]
  56. Paroncini, M.; Calcagni, B.; Corvaro, F. Monitoring of a light-pipe system. Sol. Energy 2007, 88, 1180–1186. [Google Scholar] [CrossRef]
  57. Ward Larson, G.; Shakespeare, R. Rendering with Radiance, 1st ed.; Space & Light: Davis, CA, USA, 2003; p. 13. [Google Scholar]
  58. Angelopoulou, E.; Poger, S. Color of specular highlights. In Proceedings of the SPIE 5007 on Human Vision and Electronic Imaging VIII, Santa Clara, CA, USA, 17 June 2003; Rogowitz, B.E., Pappas, T.N., Eds.; SPIE: Santa Clara, CA, USA, 2003; pp. 298–309. [Google Scholar]
  59. Barrera, R.G. El color de los metales. Rev. Mex. Fís. 1981, 3, 411–447. (In Spanish) [Google Scholar]
Figure 1. Virtual rooms configuration.
Technologies 06 00011 g001
Figure 2. Image of spheres modeled and rendered with the RADIANCE software, showing the colors of highlights present in non-metallic and metallic materials with the same spectral reflectance.
Technologies 06 00011 g002
Figure 3. Images of the active wall with different material types, spectral reflectances, and texture, rendered with the RADIANCE software.
Technologies 06 00011 g003
Figure 4. Active wall texture redirecting the reflected light rays towards the focal point.
Technologies 06 00011 g004
Figure 5. Detail of the active wall showing sections reflecting diffusively and sections reflecting specularly.
Technologies 06 00011 g005
Figure 6. Spectral radiance values and spectral radiance ratios of light reflected off a textured active wall to light reflected off a non-textured active wall with a 0.01 specularity and a 0.01–0.20 range roughness.
Technologies 06 00011 g006
Figure 7. Spectral radiance values and spectral radiance ratios of light reflected off a textured active wall to light reflected off a non-textured active wall with a 0.05 specularity and a 0.01–0.20 range roughness.
Technologies 06 00011 g007
Figure 8. Spectral radiance values and spectral radiance ratios of light reflected off a textured active wall to light reflected off a non-textured active wall with a 0.09 specularity and a 0.01–0.20 range roughness.
Technologies 06 00011 g008
Figure 9. Comparison of spectral radiance ratios of light reflected off an active textured wall to light reflected of a non-textured active wall for different materials for those cases with extreme specularity and roughness values.
Technologies 06 00011 g009
Figure 10. Comparison of spectral radiance ratios of light reflected off an active textured opaque non-metallic wall to light reflected of an active textured metallic wall for those cases with extreme specularity–roughness values.
Technologies 06 00011 g010aTechnologies 06 00011 g010b
Table 1. Studied wall optical properties.
Non-MetallicMetal
ReflectanceSpecularityRoughnessReflectanceSpecularityRoughness
--0.01--0.01
R: 0.50-0.05R: 0.50-0.05
R: 0.600.010.1R: 0.600.010.1
R: 0.10-0.2R: 0.10-0.2
G: 0.50-0.01G: 0.50-0.01
G: 0.300.050.05G: 0.300.050.05
G: 0.30-0.1G: 0.30-0.1
--0.2--0.2
B: 0.50--B: 0.50--
B: 0.100.090.01B: 0.100.090.01
B: 0.60-0.05B: 0.60-0.05
--0.1--0.1
--0.2--0.2

