Article

Impact of MiFID II on Romanian Stock Market Liquidity—Comparative Analysis with a Developed Stock Market

by
Marius Cristian Miloș
1,2,*,
Laura Raisa Miloș
1,
Flavia Barna
1 and
Claudiu Boțoc
1
1
Department of Finance, Faculty of Economics and Business Administration, West University of Timișoara, 16 Pestalozzi Street, 300115 Timișoara, Romania
2
ECREB, Faculty of Economics and Business Administration, West University of Timișoara, 16 Pestalozzi Street, 300115 Timișoara, Romania
*
Author to whom correspondence should be addressed.
Int. J. Financial Stud. 2021, 9(4), 69; https://doi.org/10.3390/ijfs9040069
Submission received: 14 September 2021 / Revised: 3 December 2021 / Accepted: 6 December 2021 / Published: 8 December 2021

Abstract

:
In light of previous literature that has investigated the effects of MiFID and MiFID II regulation on stock market liquidity, we investigate whether the introduction of MiFID II in Romania has had any effect on the stock market liquidity. Through our empirical analysis, we were able to estimate a meaningful reduction of liquidity in the Romanian stock market liquidity, in response to MiFID II, in line with the previous empirical literature. We find that the liquidity of the BET index constituents has decreased in the period following MiFID II. We find contradictory results in what concerns the German stock market, which could be explained by the different level of development of the stock markets and of the financial education of investors.

1. Introduction

The financial crisis has revealed weaknesses in the functioning and the level of transparency of financial markets. MiFID II is aimed at establishing safer, sounder, more transparent and more responsible financial markets that ensure better protection for investors, in the best interest of the economy and society as a whole. Market liquidity represents one of the most important aspects of financial system stability as a liquid market is better able to absorb systemic shocks (IOSCO 2007). Liquidity in trading is especially important for emerging markets1 as they are usually exposed to the flows of short-term investment (Santoso et al. 2010). Liquidity is the basis of a well-functioning stock market, leading to an efficient allocation of economic resources and improved information efficiency (IOSCO 2007). Given its importance, it is not surprising why regulators attach great importance to regulations improving overall market liquidity. If a regulation, such as MiFID II in our case, has an adverse impact on the market, it is in the interest of both market participants and regulators to acknowledge it and correct it if possible.
Recent empirical research has shown that the previous MiFID regulations had a positive impact on the market liquidity in all EU countries, for which there are several explanations. First, a higher degree of transparency reduces information asymmetry, cutting trading costs for all market participants. Then, the level-playing field created by regulation improves the stock market informativeness and encourages market participation. Stronger investor protection, which is at the core of MiFID regulation, motivates the investors to actively participate on the stock market. Lastly, stronger competition from other venues besides organized stock exchanges will also reduce the transaction costs and improve market liquidity (Aghanya et al. 2020). However, the effect of regulation on stock market liquidity is not always straightforward. There is empirical evidence that shows a decrease in the European stock market liquidity following MiFID II. This decrease is justified in the previous studies with a decrease in the analyst coverage due to the unbundling research provision in MiFID (Utkilen and Wakeford-Wesmann 2019; Fang et al. 2020; Anselmi and Petrella 2021; Guo and Mota 2021). To our knowledge, there are no similar studies up to this date that have investigated the effects of MiFID II on liquidity in the Romanian stock market, while the impact of MiFID II on other European stock markets is scarcely addressed, partly due to the complex measures of MiFID II and the early point of analysis.
Bucharest Stock Exchange (BSE) manages the regulated stock market in Romania, which is in line with European Union regulation. This stock market was re-established in 1995, after being closed for almost half of a century. Since then, BSE has witnessed an increasing flow of capital and has worked on removing any barriers which stand in the way of development of the local stock market, its current mission being becoming one of the most active financing vehicles of the Romanian economy. BSE embarked in 2014 on an ambitious project, of being upgraded from the Frontier to Emerging market status by global index providers, the main criteria for this upgrade being market liquidity. Although this project proved to be successful (the Romanian stock market being upgraded to Secondary Emerging market status by FTSE Russell in September 2020)2, the level of development of the Romanian stock market is currently lagging not only behind developed European Union countries, such as Germany, but also behind other regional countries, such as Poland or Czech Republic (OECD 2021). Since MiFID II was implemented in Romania in mid-2018, both regulators and investors should be interested in depicting the impact that MiFID II has had so far on the domestic stock market in terms of liquidity.
The main contribution of the paper is therefore to investigate whether the introduction of MiFID II in Romania has had any effect on the stock market liquidity. We use four measures of liquidity: Hui and Heubel liquidity ratio, daily Amihud illiquidity ratio, turnover ratio, and the bid–ask spread. While not neglecting other anticipated effects that the implementation of MiFID II has had on the Romanian stock market, we do not assess in this paper the impact of the new MiFID regulation on other variables, other than liquidity, giving this sort of fertile analysis a separate investigation in a recent study (Miloș 2021). We use five time periods (of three months, six months, 1 year, 1.5 years and 2 years) before and after the implementation of MiFID II in Romania and we compare the results obtained in the case of the Romanian market with the results obtained for a developed stock market, the German one.
Summarizing our empirical results, we find that Romanian stock market liquidity has decreased in the post-implementation analysed period. The two illiquidity ratios that we have taken into consideration (Hui–Heubel and Amihud ratios) have increased while the general liquidity ratio has decreased. The conclusions remain valid for a 6-month, 1-year, 1.5-year and 2-year horizon after the MiFID II. The only ratio that shows an increase in liquidity is the Corwin–Schultz bid–ask spread, which decreases over the considered period of time, meaning that the Romanian market efficiency has improved over the largest period of analysis, of 2 years. Instead, the German stock market exhibits a rather positive impact of the new financial regulation MiFID II. The two illiquidity ratios are mostly decreasing in the analysed period, while the general liquidity ratio increases. We were able to justify these results by considering the high level of development of the German stock market, in comparison with the Romanian one. Moreover, it is justified by the low degree of financial education of the population. These findings outline the fact that more investor protection need not necessarily be better for the liquidity of emerging stock markets, such as the Romanian one.
The rest of the paper is organized as follows: Section 2 gives a brief review of the empirical literature that has investigated the connection between regulation and stock market liquidity, outlining the studies which aimed at depicting the impact of MiFID II in this respect, the Section 3 presents the data and methodology. Section 4 presents and discusses the results. Section 5 concludes and present some future direction for research.

2. Theoretical Background

Liquidity is becoming a critical issue in capital market development initiatives and creates positive spillover effects for the underlying economy. The importance of market liquidity as well as its importance for sustainable financial market development can be addressed by looking at its impact on the market actors (Wyman and World Federation of Exchanges 2020):
  • For investors, the liquidity of the stock markets is associated with the ease of moving in and out of an investment, lower transaction costs, lower price volatility and improved price formation;
  • For issuers, liquidity is important from the point of view of the cost of raising capital and accurate market valuations;
  • For stock exchanges, liquidity means more market participation, greater investor confidence, and a greater ability to attract new issuers;
  • For the economy, it means attractive alternative ways of raising capital at a reasonable cost, which triggers investments.
According to Deakin et al. (2018), the relationship between regulation and stock market development represents an extremely important topic among researchers and policy makers at least partly due to its connection with the parallel literature that claims that developed financial markets promote economic growth (King and Levine 1993; Beck et al. 2003; Claessens and Laeven 2003).
MiFID II, the most recent directive on the markets in financial instruments, was fully applicable starting on the 3 January 2018 for the European Union countries, required, among other relevant issues, the research unbundling and a separate pricing for investment research analysis, meant to foster the transparency of the services provided by the investment firms to their customers, and avoid the potential conflict of interest between sell-side research and buy-side asset management firms with the final scope of increasing investor protection. Before the implementation of MiFID II, the fees applied by investment firms were opaque and included payments for both research and transactions. Investors were not able to distinguish separately the cost of research and other services provided, since they were included in overall trading commissions (Guo and Mota 2021). This general practice could have led to clients being misled about the services they would actually need or being over-charged for the services that were actually provided (Biffany 2018). In the literature there had been concerns that the reorganization of investment firms, imposed by the MiFID II regulation need to separate research from transactions, would have unintended consequences on the volume and quality of research production in traded firms, and would ultimately hamper the stock market quality and liquidity (Anselmi and Petrella 2021). Recent studies have shown that both quantity and quality of analyst research have been affected by the MiFID II provisions regarding research unbundling. Although the quality of the research seems to have improved, the quantity of the research and the firm’s analyst coverage seems to have dropped, according to the documented connection between analyst coverage and liquidity of the stock market (Roulston 2003), and a reduction of the latter (Utkilen and Wakeford-Wesmann 2019; Fang et al. 2020; Anselmi and Petrella 2021; Lee 2018).
The empirical studies on the impact of MiFID II on the liquidity of the stock market are scarce.
Utkilen and Wakeford-Wesmann (2019) assess the general effect of MiFID II and research unbundling on Norwegian stocks, using three measures of liquidity: turnover, Amihud’s illiquidity ratio and the relative bid–ask spread. Although their results are inconclusive concerning the liquidity of the whole Norwegian sample, for the small and mid-cap stocks they noticed a reduction in liquidity in the two- and six-month—periods following the introduction of MiFID II (showed by an increase of the Amihud’s illiquidity ratio and an increase of the bid–ask spread).
Fang et al. (2020) provide early evidence of the impact of MiFID II on a European sample (treatment sample), relative to a Canadian and a US sample (control sample) using a difference-in-difference (DiD) approach, and analyse the period from 2015 till February 2019. Although the main focus of the paper is to examine the effect of the new regulation in terms of research unbundling on the supply of analyst research, noticing a decline in the analyst coverage of the traded firms on the European stock exchanges, they also find that liquidity, proxied by the bid–ask spread on the stock market, as well as the Amihud illiquidity ratio, has decreased in the period following MiFID II. They conclude that at least in the short term, MiFID II has led to a decrease in the liquidity of the European stock market.
Anselmi and Petrella (2021) investigate the extent to which market liquidity and efficiency were both influenced by the implementation of MiFID II, using monthly data collected from eight major European stock markets, from 2016 to 2018. The liquidity of the market is measured through the percentage bid–ask spread, which exhibits a statistically significant decrease for the entire sample after the implementation of MiFID II (noticing however a more significant decrease in the case of smaller capitalized firms, in the case of which a probable decrease in the price efficiency after MiFID II implementation could also be noticed).
Summarizing the findings of the studies that assessed the impact of MiFID II regulation on stock market liquidity via the unbundling research provision and analyst coverage, we could conclude that MiFID II did not have a positive impact on liquidity in the European stock markets, due to the decrease in the analyst coverage, which seemed to have negatively affected the liquidity of the companies trading on the stock market, regardless of their size (there is empirical evidence that outlines the drop-down in coverage for both small and mid-cap equity (Utkilen and Wakeford-Wesmann 2019; Fang et al. 2020), while others assign the effect of MiFID II to a reduction in analyst coverage for large, old and less volatile companies (Guo and Mota 2021; Lang et al. 2019).
Nevertheless, MiFID II could not have impacted the stock market liquidity only via the research unbundling provision. The new regulation aimed at ensuring a harmonized protection for investors in financial instruments by establishing a more transparent and safe trading framework for the retail investor in many other provisions, several of which are worth mention here:
  • Article 24 (4): supply of appropriate information in good time to investors or potential investors regarding the investment firm that intermediates their transactions and its services, the financial instruments and proposed strategies, the execution venues and so on;
  • Article 25 (1–2): realization of suitability tests for the investors through which at the moment of providing investment advice and portfolio management the investment firm is obliged to take into account the potential client’s knowledge and experience, risk aversion and financial situation;
  • Article 25 (6): increased reporting obligations for investment firms, associated with the transactions and services undertaken on behalf of the investors;
  • Article 27 (8): best execution of transactions for the investors;
  • Article 28 (1): order handling rules for investment firms, ensuring prompt, fair and expeditious execution of client orders, relative to the trading interests of the investment firm.
All the provisions mentioned above increase investor protection, by updating and strengthening some important areas of the previous directive, MiFID, enhancing the potential of judicial enforcement by holding the investment firm liable for the retail investor. Is it natural then to hypothesise whether the MiFID II, a key piece of European law, has had a positive impact on the stock market liquidity, taking into consideration all the provisions that this regulation brings in terms of increased investor protection and the positive connection between investor protection and stock market development, which is well documented in the literature (Brockman and Chung 2003; Cumming et al. 2011; Christensen et al. 2016; Huang et al. 2020). This assertation is backed up by previous studies investigating the impact of the first directive, MiFID, on the stock market liquidity which found positive effects. Aghanya et al. (2020) examined the impact of MiFID on the liquidity of the EU-28 stock markets using a DiD research design, finding a positive effect of the regulation on the liquidity of EU publicly traded stocks in the period 2006–2008. Their results are consistent with the ones obtained by Cumming et al. (2011), who find that the liquidity increased post-MiFID I. Aghanya et al. (2020) also point out that the improvements in market liquidity depends also on the quality of past financial regulation, finding significantly higher increases in the level of liquidity in the case of more weakly regulated countries. An event study, meant to capture the effect of this regulatory reform on the liquidity of the stock market might be able to better reveal the economic quality of MiFID II. Although as in all empirical studies a relatively short-term horizon of analysis was employed, regulation might have longer-term effects, given the delayed impact of regulation in providing important information on stock market efficiency (Fama 1991).

3. Data and Methodology
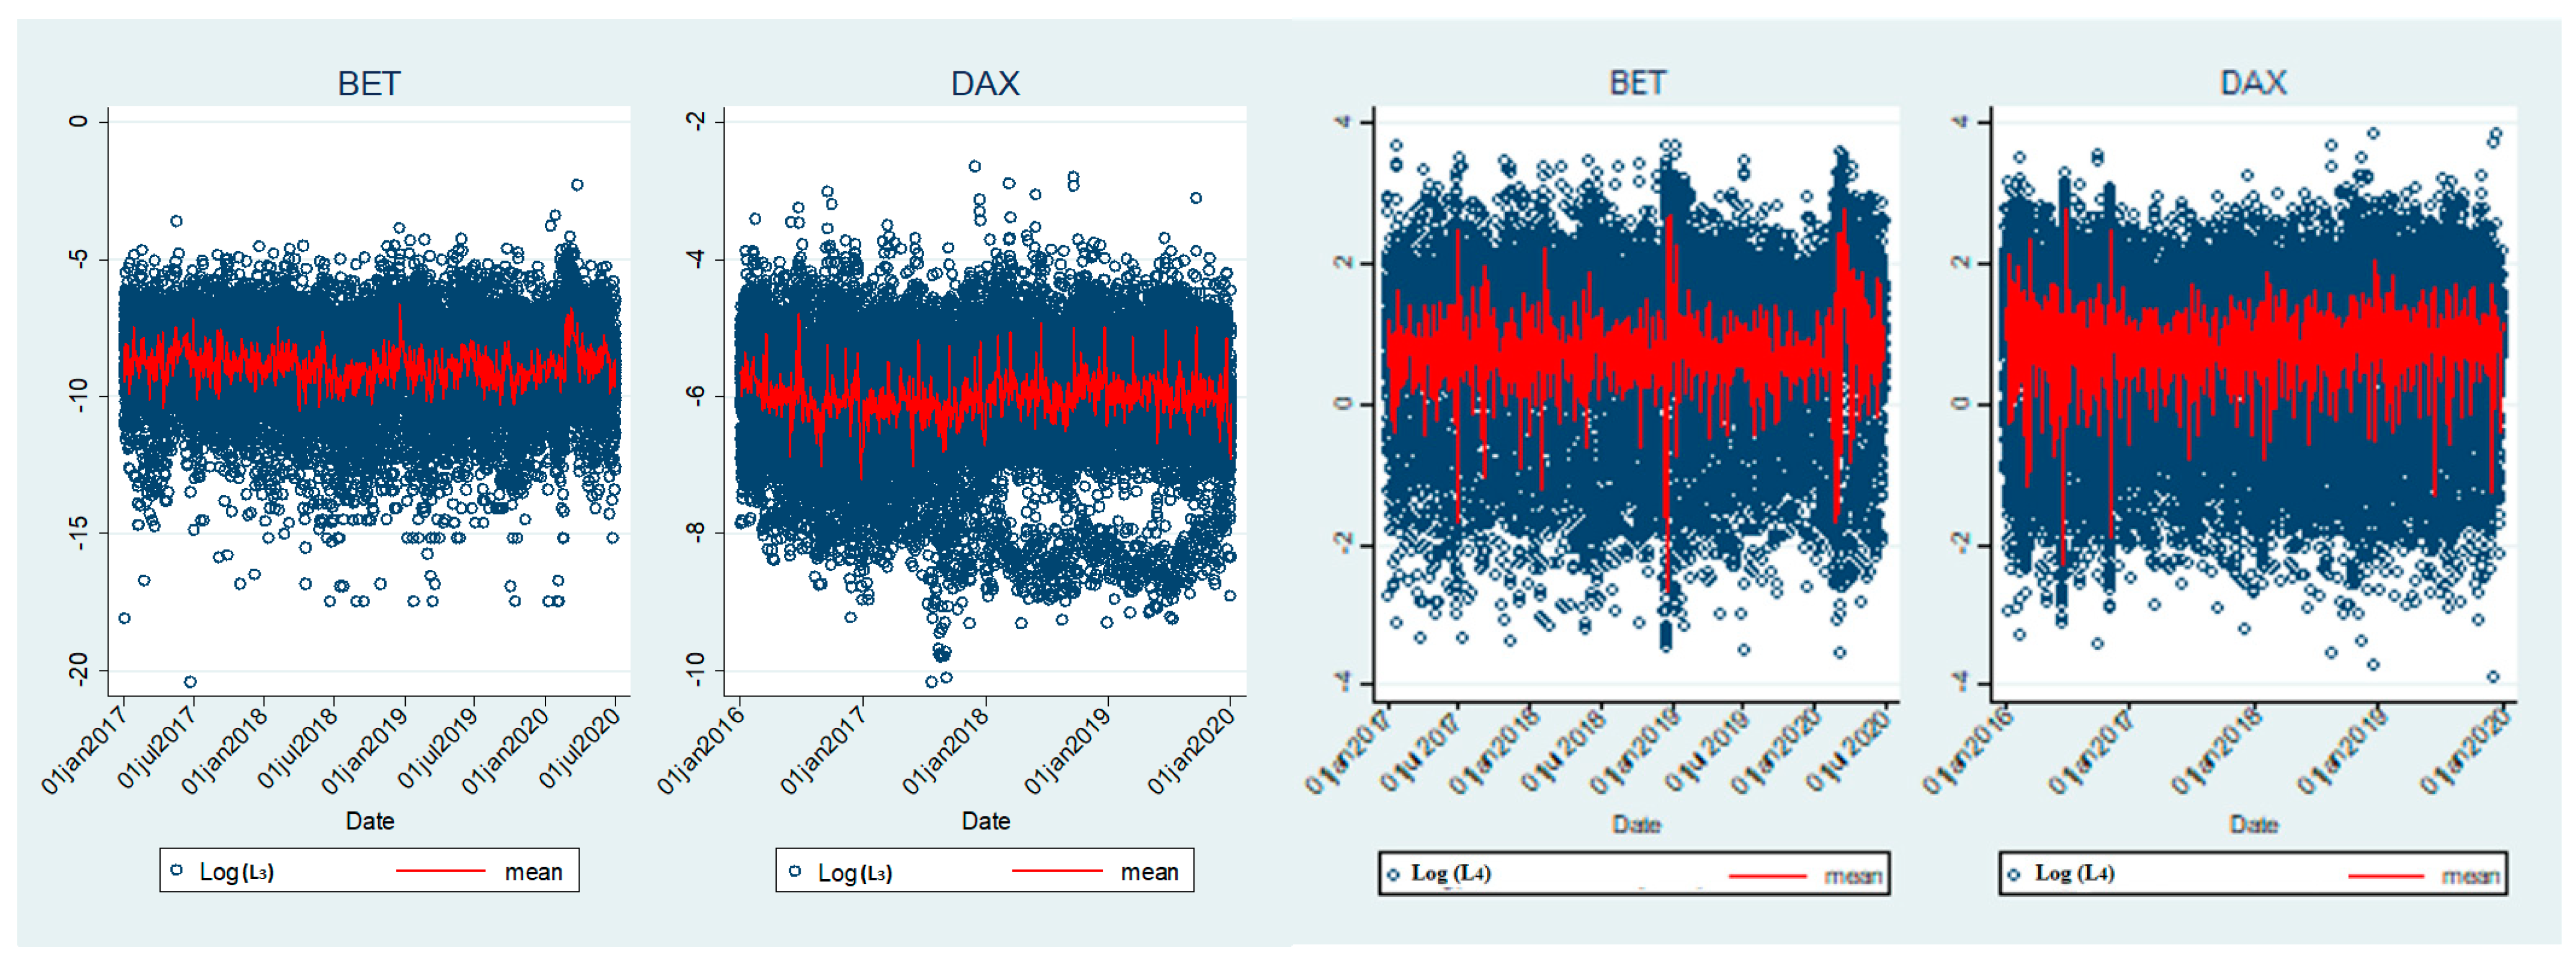
3.1. Data

The stock market data are extracted from Investing.com and comprise information for all Romanian and German companies listed on the national stock exchanges, constituents of the Romanian and German blue-chip indexes (BET and DAX) (Table A1 and Table A2 in Appendix A). The data include closing price, trading volume, high and low quotations, and the number of shares outstanding. We use daily data in the period from July 2016 to July 2020 in the Romanian case, and data in the period from January 2016 to January 2019 in the German case (due to MiFID transposition entering into force at national level, on 6 July 2018 in Romania and 3 January 2018 in Germany). Data for COVID-19 (cumulative cases per capita, cumulative deaths per capita and economic support index that proxy the institutional anti-Covid policy) were obtained from Oxford COVID-19 Government Response Tracker database. The COVID-19 data were used only for the Romanian companies, due to the fact that the analysis period in the case of the German companies did not comprise the outbreak of the COVID-19 pandemic. Data regarding quarterly GDP per capita were obtained from OECD database and transformed to daily data using linear interpolation.

3.2. Methodology

Academics, market operators and regulators use a range of metrics to capture market liquidity. According to the literature, liquidity has several dimensions: depth, which ensures the realization of large transactions without affecting stock prices, there are orders both below and above the trading price of an asset; breadth or tightness which is the spread between bid and offer prices; immediacy of transactions, the speed with which the transactions are realized, and resilience, the rapidity with which the prices are restored after a significant fluctuation (Crockett 2008), a market being resilient if there can be noticed many orders in response to price changes.
We use four measures of liquidity, the first three are adjusted from Gabrielsen et al. (2011); Sarr and Lybeck (2002) while the last one is derived from Corwin and Schultz (2012). All of them reveal the liquidity characteristics mentioned above:
  • The Hui and Heubel liquidity ratio ( L 1 ) is computed as:
    L 1 = ( P m a x P min ) / P m i n V / ( N S · P ¯ )
    where P m a x stands for the highest daily price over a 5-day period, P m i n stands for the lowest daily price over the same horizon, V is the total volume of assets traded over the same horizon, NS is the total number of assets outstanding and P ¯ is the average closing price over a 5 day period; a lower value of L 1 implies higher liquidity;
  • The Daily Amihud illiquidity ratio ( L 2 ) is computed as:
    L 2 = 10 6 · | r t | V t · P t
    where r i is the daily closing price return on day t and V t is the total volume of assets on day t and P t is the daily closing price; a lower value of ILLIQ implies higher liquidity;
  • The turnover ratio ( L 3 ) is computed as:
    L 3 t j j = S h t j N S t j
    where S h t i is the number of assets units traded at time t for stock j, while N S t j is the total number of asset units outstanding; a higher value of TR implies higher liquidity;
  • The Corwin–Schultz bid–ask spread ( L 4 ) is computed as:
    L 4 = 2 ( e α 1 ) e α + 1
    where the expression for the estimate of α is:
    α = 2 β β 3 2 2 γ 3 2 2  
    where β and γ are computed as:
    β = E { j = 0 1 [ ln ( H t + j L t + j ) ] 2 } and   γ = [ ln ( H t , t + 1 L t , t + 1 ) ] 2
    where H t ,   t + 1 denotes the high price over the two days t and t + 1 and L t ,   t + 1 is the low price over days t and t + 1. A reduction of the bid–ask spread implies higher liquidity.
The potential effect of the regulatory reform (MiFID II) is tested using a MiFID II indicator variable equal to 1 for data observed after 6 July 2018 in the case of Romania and 3 January 2018 in the case of Germany and equal to 0 otherwise. The econometric analysis is based on the following panel data regression:
L t = α + γ M I F I D I I t + β X t + ε t
where L t represents, alternatively, one of the liquidity measures described above ( L 1 - Hui–Heubel ratio; L 2 Amihud illiquidity ratio; L 3 Turnover ratio;   L 4 —Corwin–Schultz bid–ask spread). M I F I D I I t is a dummy variable equal to 1 for the post-MiFID II period and 0 otherwise. X t is a vector of control variables with corresponding coefficients β, ε t is the error term and t is time. Market capitalization (Mcap) and the 10-day return volatility (SD), which are also used in other empirical studies that have investigated the impact of MiFID II on stock market liquidity (Utkilen and Wakeford-Wesmann 2019; Fang et al. 2020) are added to the model as control variables. We also use other control variables, in order to determine the effect of MiFID II on liquidity more accurately: the GDP per capita (GDPcap) and in the case of the Romanian companies, three COVID-19 measures to flag the impact of COVID-19 pandemic: cumulative cases per capita, (NC), cumulative deaths per capita, (ND) and economic support index that proxy the institutional anti-Covid policy (EP). The model is estimated using panel data fixed (FE) and random (RE) effects estimators. Both estimators consider the existence of unobserved individual firm heterogeneity, with the difference that the random effects estimator treats individual heterogeneity as a random variable that is assumed to be uncorrelated with observed covariates, and the fixed effect estimator treated individual heterogeneity as a parameter to be estimated for each cross-section observation, and is allowed to be correlated with observed covariates. FE is the chosen model based on both Hausman test results and the non-validity of random unobserved individual heterogeneity assumption in our case.

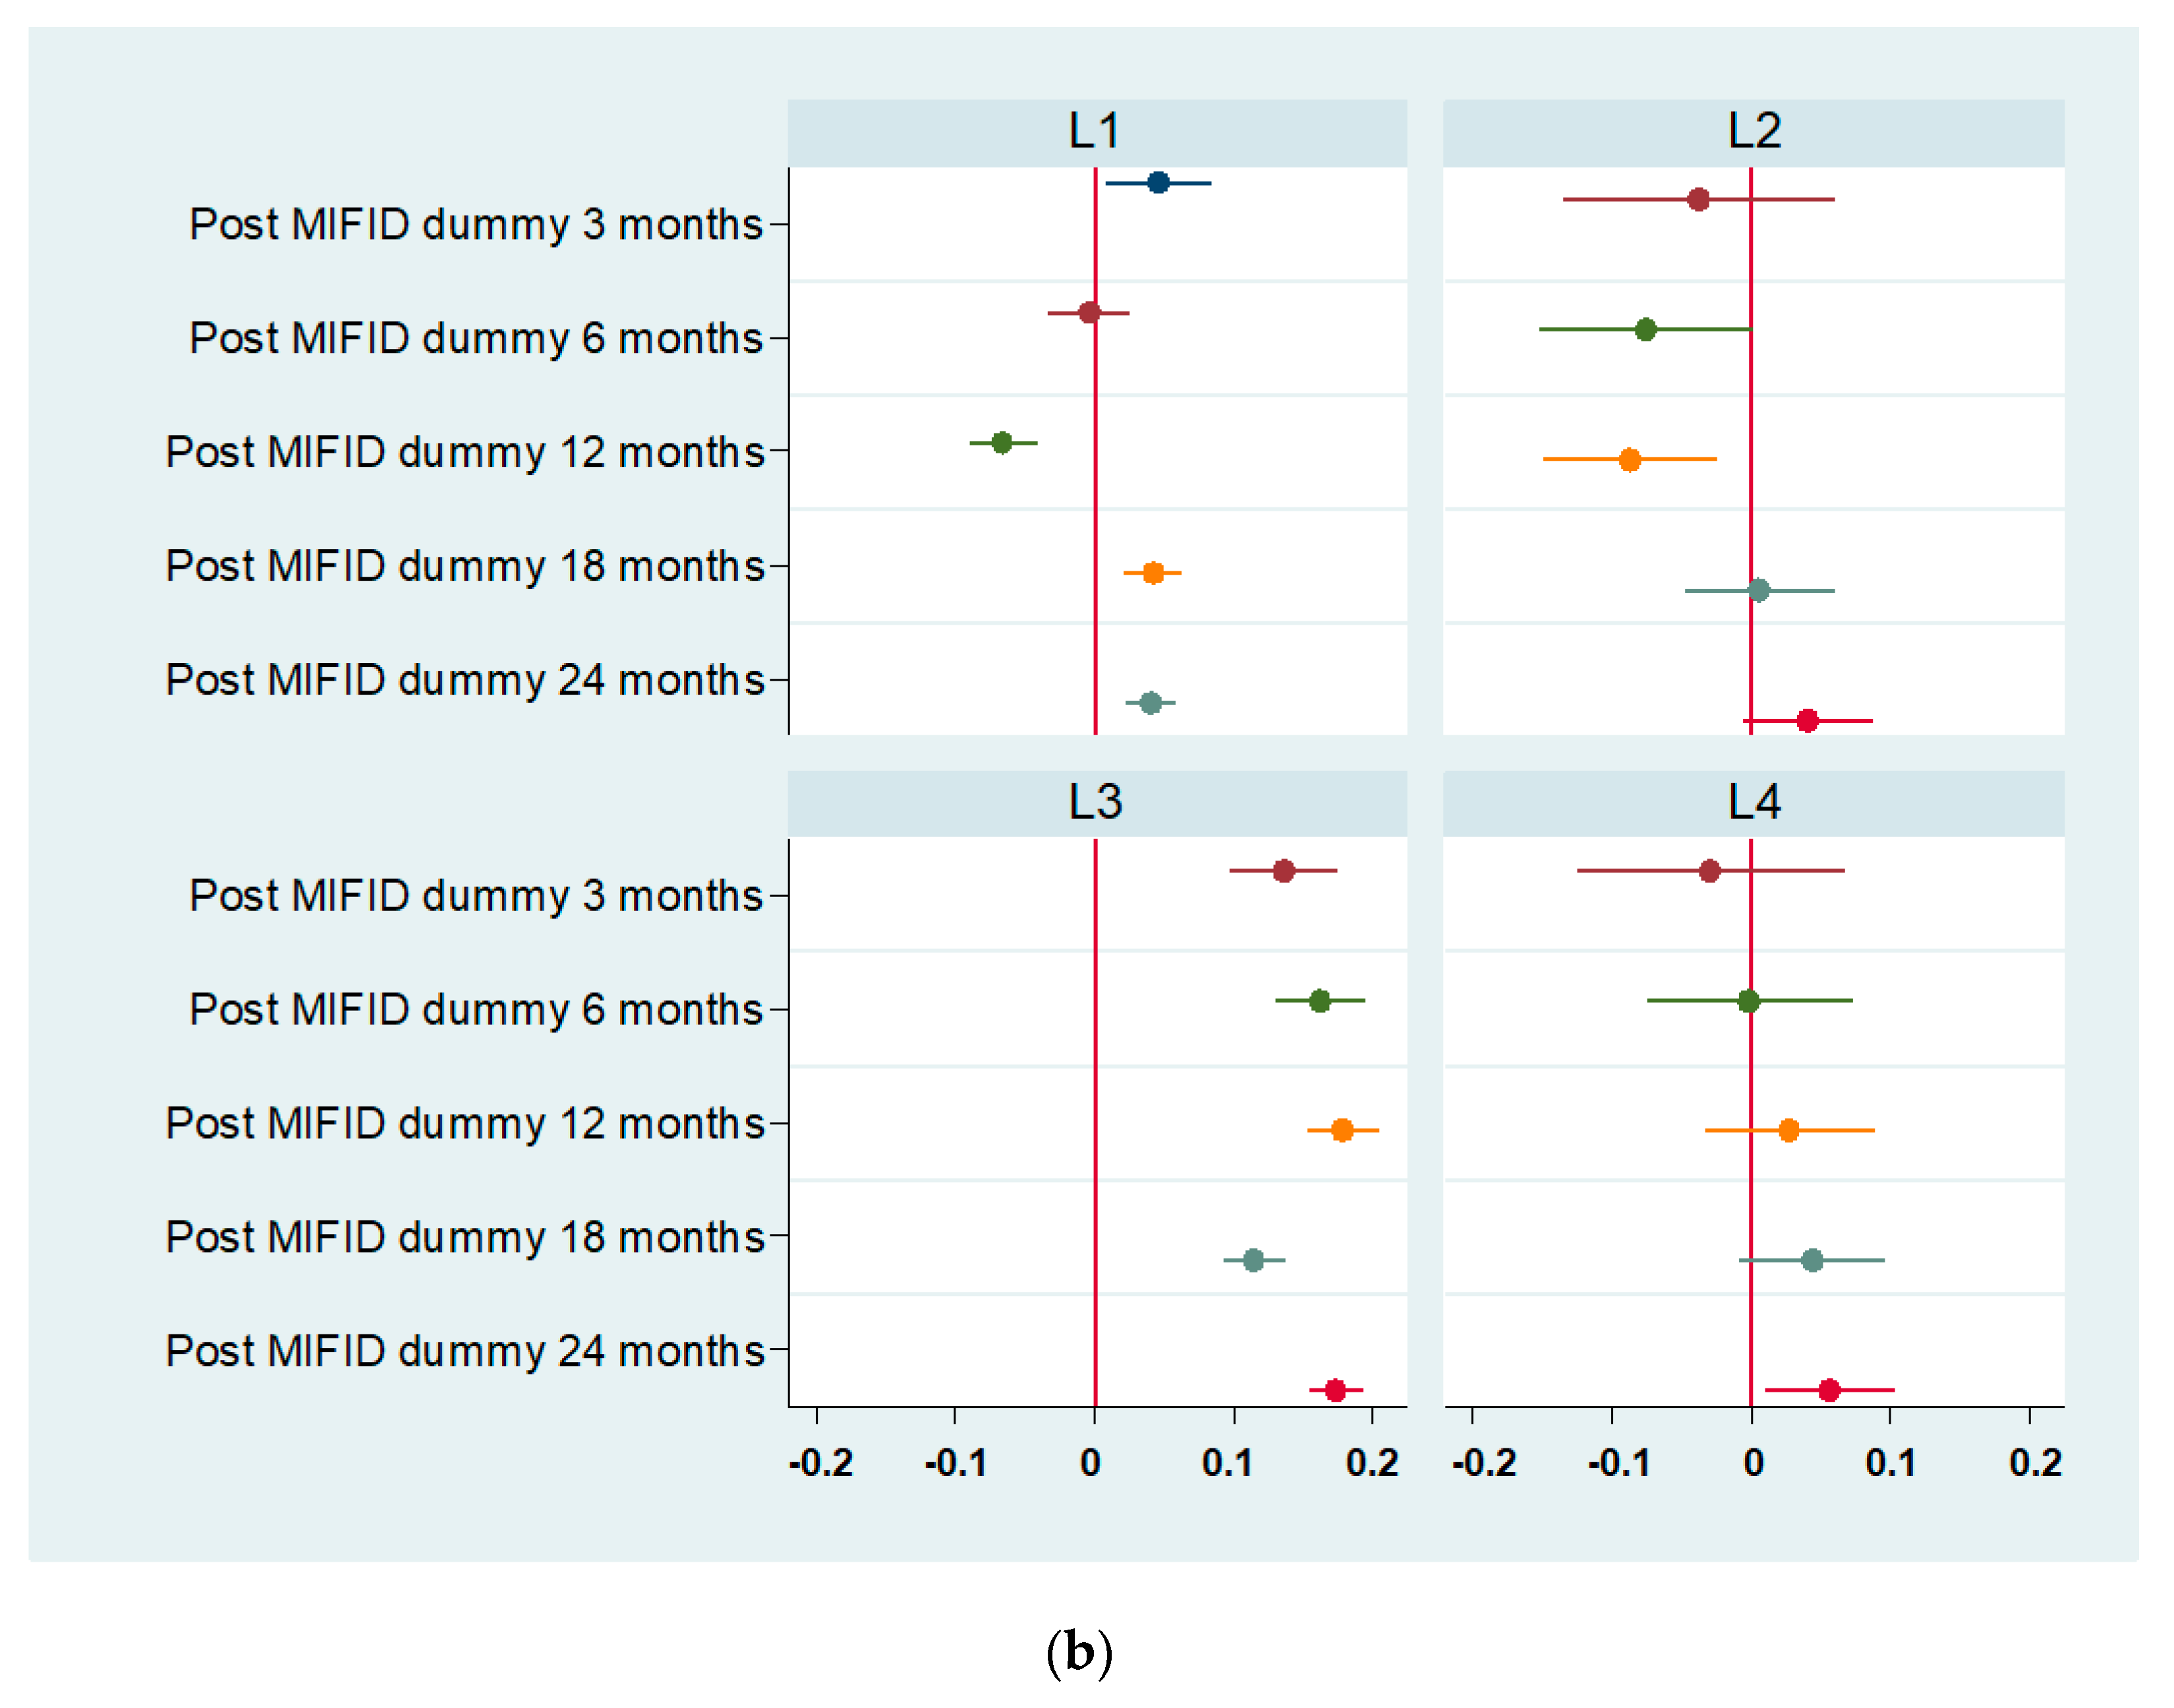
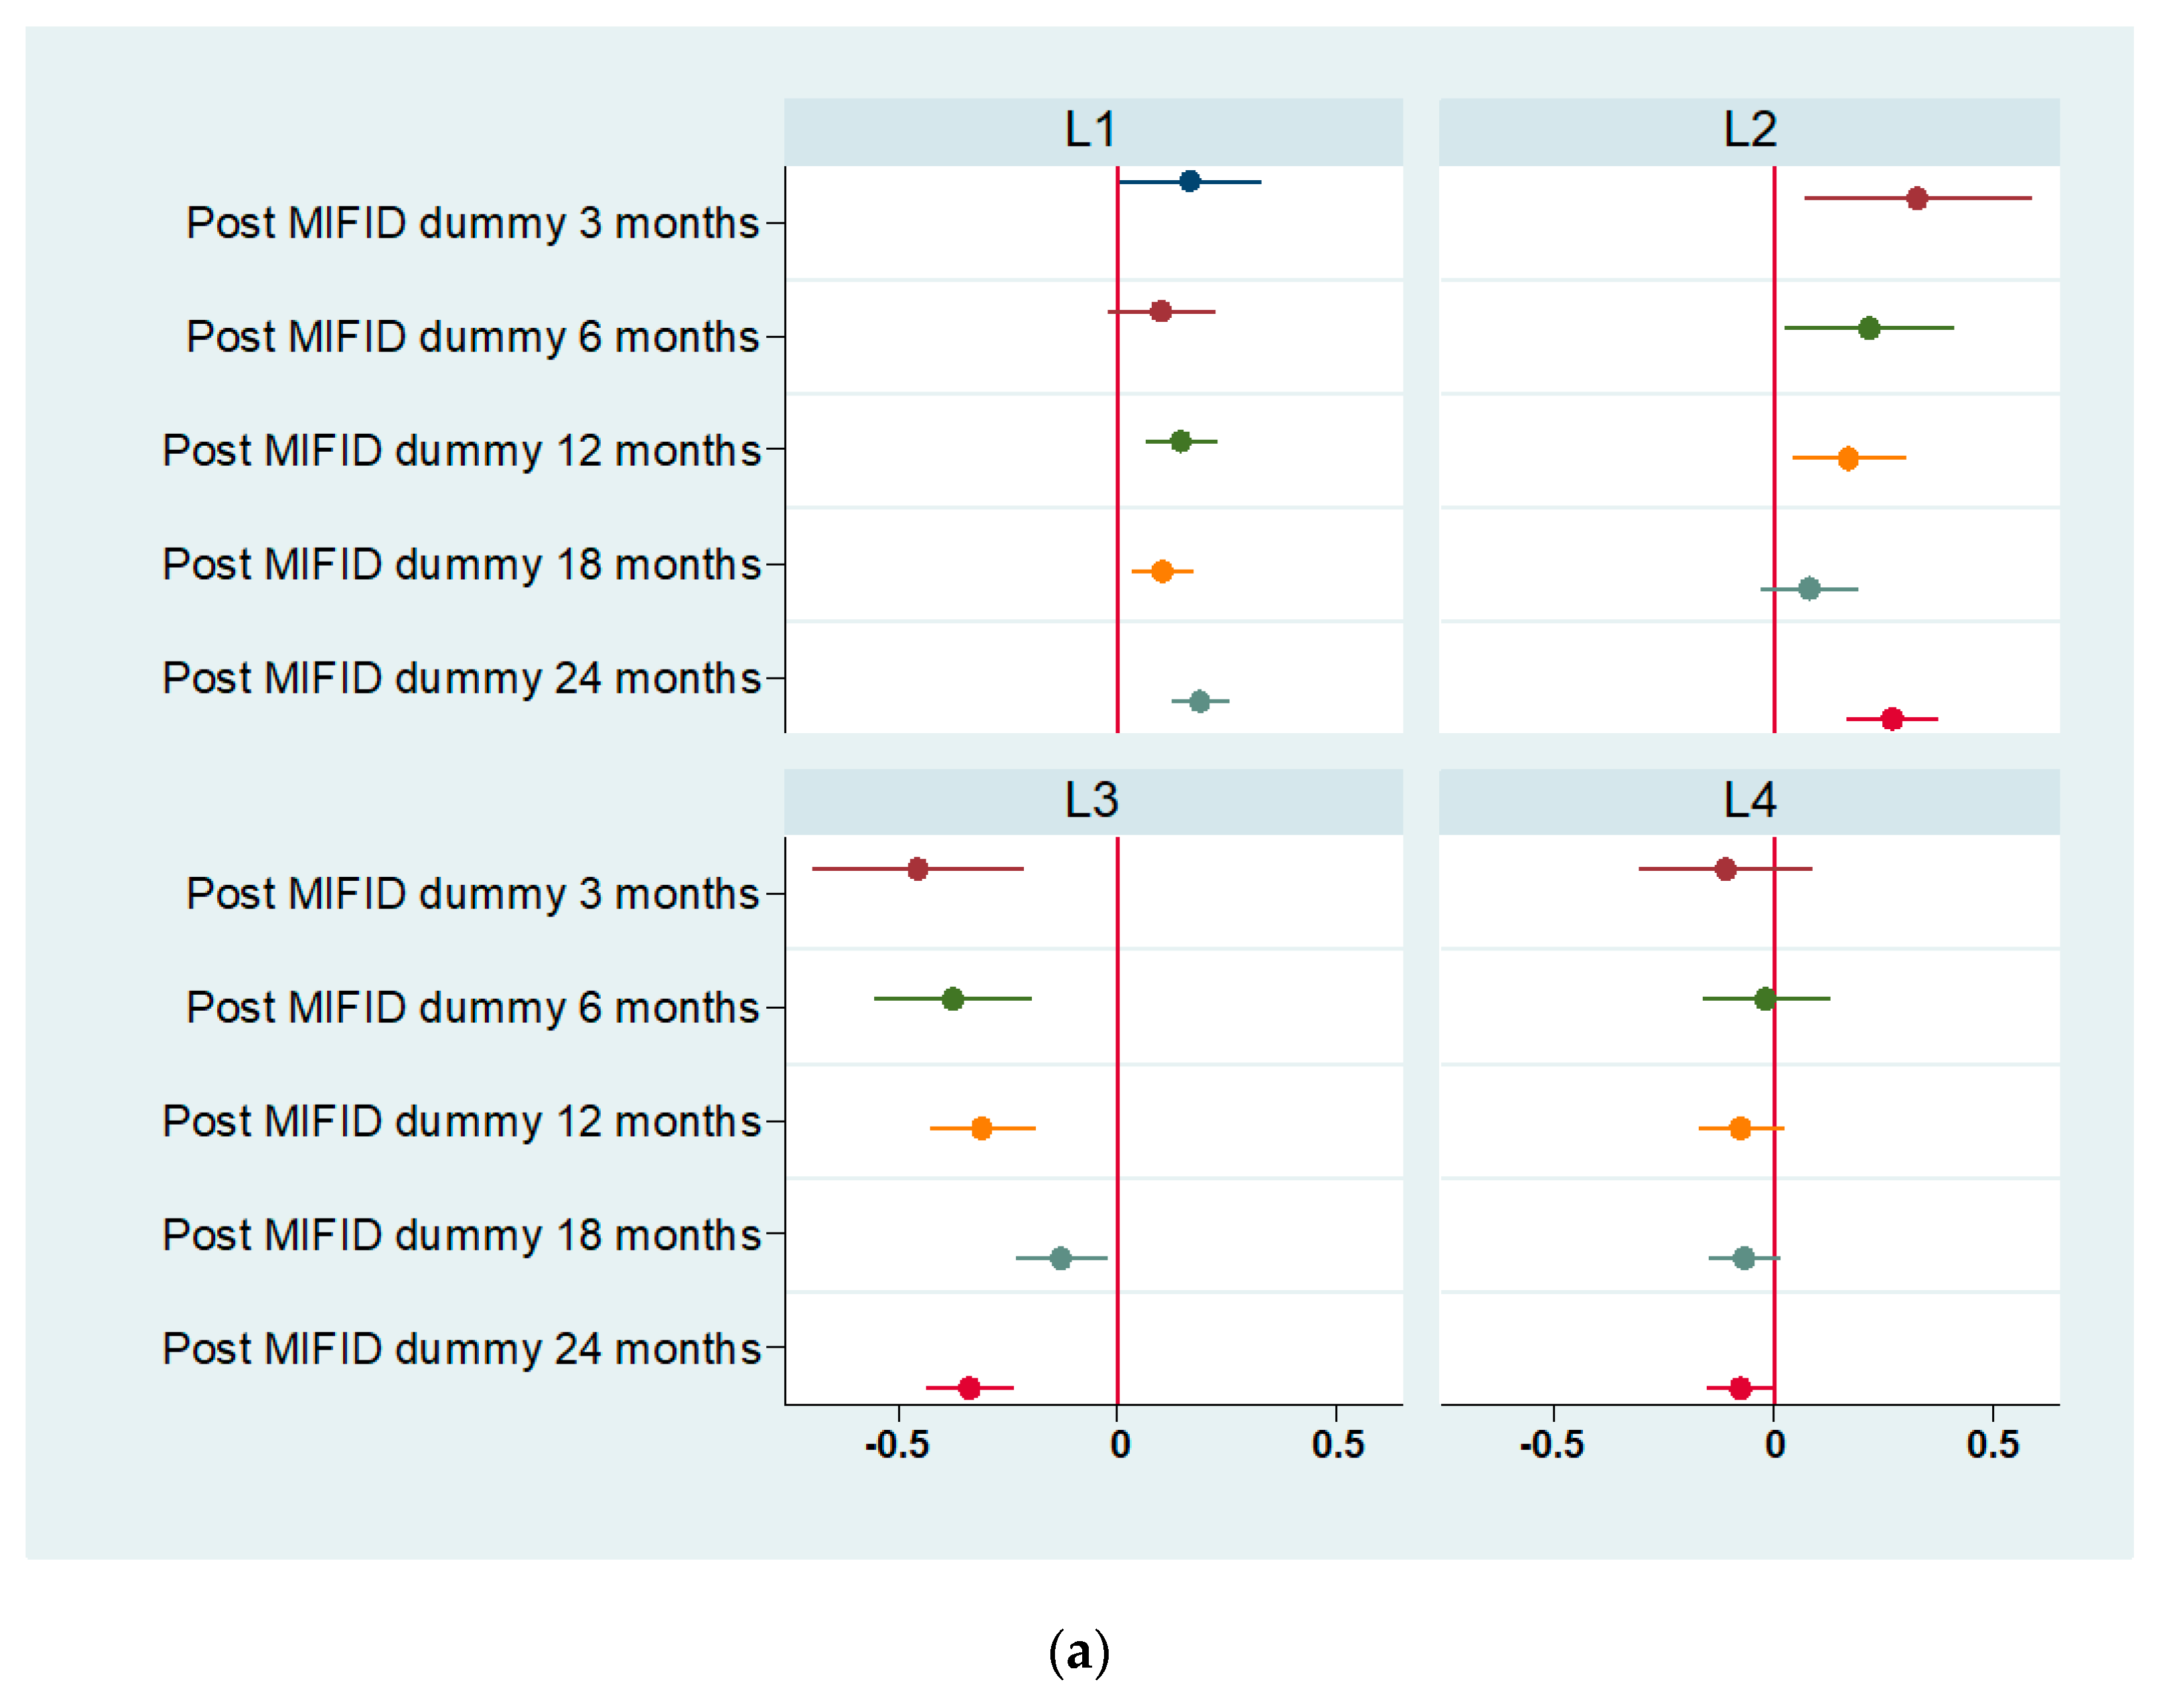
4. Results and Interpretation

Table 1 summarizes the main descriptive statistics for the period before and after the MiFID II implementation for the Romanian and German stock markets. In the Romanian market, the average liquidity ratios indicate a decrease in the level of liquidity in the post-implementation period. The number of observations is higher in the post-implementation period due to the fact that some companies were later listed on the stock market after the initial moment of analysis, the 6 July 2016. On the contrary, for the German market, it can be noticed an increase in the level of average liquidity ratios in the post-implementation period. The standard deviation around the average values is similar between the two periods for both Romanian and German companies.
Table 2 presents the correlation matrix for both Romanian and German samples. In the case of the Romanian companies. This shows a direct correlation between the Hui–Heubel liquidity ratio and the Amihud illiquidity ratio and the negative correlation that exists between the general liquidity ratio and the other liquidity indicators. An increase in the Hui–Heubel ratio, respectively in the Amihud illiquidity ratio reveal a worsening of the stock market liquidity. In the case of the German companies, there is also a direct correlation between the Hui–Heubel liquidity ratio and the Amihud illiquidity ratio and a negative correlation between the general liquidity ratio and the other liquidity indicators. The Corwin–Schultz bid–ask spread is positively correlated with the Amihud illiquidity ratio, general liquidity ratio and Hui–Heubel ratio for both Romanian and German companies.
Figure 1 presents the way in which the dynamics of the liquidity indicators for each company and the market average have evolved over the analysed period of time. From these figures, a decrease in liquidity can be observed after the implementation of MiFID II in the Romanian market, while an increase in liquidity can be depicted in the case of the German one. It can also be seen that the variance of liquidity indicators is approximately constant.
The estimation results of the impact of MiFID II on the liquidity ratio for both Romanian and German markets are displayed in Figure 2. For the Romanian market, market liquidity decreased over the analysed periods with positive values for the Hui–Heubel ratio and the Amihud ratio and negative values for the general liquidity ratio. The only indicator that shows an increase of the liquidity is the Corwin–Schultz bid–ask spread, which has decreased over the analysed period. For the German market, the situation is rather inverse, with negative values for Amihud ratio and positive values for the general liquidity ratio, while the Hui-Heubel ratio shows an increase in the first year of implementation of MiFID II. The only indicator that shows a decrease of the liquidity is the Corwin–Schultz bid–ask spread, which has increased over the analysed period.
Full estimation results are given in Table 3 and Table 4. General conclusions from the two different estimators are consistent and prove that after the adoption of the MiFID II regulation, liquidity was affected significantly in the case of both Romanian and German stock markets, but in different ways. Hausman test results are given in Table A3 and Table A4.
In the case of the Romanian market, the illiquidity ratios, Hui–Heubel and Amihud have increased while the general liquidity ratio has decreased. The conclusions remain valid for a 6-month, 1-year, 1.5-year and 2-year horizon after the MiFID II. The only ratio that shows an increase in liquidity is the Corwin–Schultz bid–ask spread, which decreases over the considered period of time, meaning that market efficiency has improved. However, the results are only statistically significant for the 24-month horizon. Using FE results, we can conclude that the impact of MiFID II on the Romanian market is as follows:
  • Increase in the Hui–Heubel ratio by 16.5% on the 3-month horizon, 14.6% in 12 months, 10.4% in 18 months and 19% in 24 months;
  • Increase in Amihud ratio by 32.9% on the 3-month horizon, 21.7% in 6 months, 17.2% in 12 months, and 27% in 24 months;
  • Decrease in the turnover ratio by 45.4% on the 3-month horizon, 37.5% in 6 months, 30.7% in 12 months, 12.7% in 18 months and 33.7% in 24 months;
  • Decrease in the Corwin–Schultz bid–ask by 7.58% in 24 months.
When referring to the results obtained for the German stock market, the illiquidity Amihud ratio has decreased while the general liquidity ratio has increased in the analysed period. The illiquidity Hui–Heubel ratio shows a decrease only in the first year of implementation of MiFID II. The only ratio that shows a decrease of the liquidity is the Corwin–Schultz bid–ask spread, which increases over the last two considered periods of time (1.5 years and 2 years after the implementation of MiFID II).
More specifically, we can conclude that the impact of MiFID II on the liquidity is as follows:
  • An increase in the Hui–Heubel ratio of over 4.62% over a 3-month period, a decrease of 6.54% over a 12-month period, followed by an increase of the ratio of 4.21% over an 18-month period and of 4.03% over a 24-month period;
  • A decrease in the Amihud ratio by 7.54% over a 6-month period, 8.74% over a 12-month period, and an increase of 4.02% over a 24-month period;
  • An increase in the general liquidity ratio by 13.6% over a 3-month period, 16.2% over a 6-month period, 17.9% over 12 months, 11.5% over 18-month period and 17.4% over 24 months;
  • An increase in the Corwin–Schultz bid–ask spread by 4.38% over 18 months and 5.62% over the 24-month period.

5. Conclusions

The results in this paper suggest that the new regulation did not produce any positive effects in terms of liquidity for the Romanian stock market. These findings outline the fact that more investor protection need not necessarily be better for the liquidity of emerging stock markets, such as the Romanian one. Financial reforms (including financial regulation reforms) are critical for emerging stock markets in their pursue of finding a sustainable high-growth path, considering the level of development of their financial systems and their vulnerability to domestic and external shocks3. Both regulators and investors should be interested in depicting the impact that MiFID II has had so far on the domestic stock markets in terms of liquidity. In the case of the Romanian stock market, regulation should balance between the different interests of the market participants (investors, issuers, financial intermediaries) and of the economy as a whole such as an optimum amount of investor protection must be found. On the contrary, the German stock market was affected rather positively by the introduction of the new financial regulation (MiFID II). The difference between the two effects can be explained by the different level of maturity of the German stock market, in comparison with the Romanian one, and the higher level of financial education of investors, which might have better understanding of the new regulation, and acknowledged the positive effects of MiFID II in terms of transparency, investor protection and market quality. However, the results for the Romanian stock market are in line with the conclusions obtained in previous empirical studies that have investigated the impact of MiFID II on liquidity (Utkilen and Wakeford-Wesmann 2019, Fang et al. 2020, Anselmi and Petrella 2021, Guo and Mota 2021). Our study, however, captures the general impact of MiFID II on stock market liquidity, and not only the research unbundling provision that was taken in consideration in the previous empirical work. A limitation of this study has to do with the subset of companies chosen for analysis, as to whether the sample is sufficiently representative of the whole stock market. Although we have considered the blue-chip indexes for both stock markets (Romanian and German), their structure in terms of size, industry and distribution might not be perfectly representative. Future research could also include other methodological approaches, such as difference-in-differences. Moreover, a future research venue could take into consideration a wider period of analysis. Starting with September 2020, the Romanian stock exchange was included in the Secondary Emerging Markets indexes, according to the classification made by FTSE Russell, a validation received by the Romanian stock market after a long period of efforts and determination that also included the transposition of the European directives. Romania’s stock market upgrade and its further consolidation, by increasing its representativeness in the emerging markets, will certainly have some consequences in terms of liquidity that are worth being investigated. Lastly, the research could be extended with the impact of the provisions of some new regulations or legislative amendments. Directive (EU) 2021/338, published in February 2021 and applicable from February 2022 for all EU countries comprised certain amendments to client information, product governance and best execution requirements, to help EU’s economic recovery from the COVID-19 pandemic. All these amendments could have impacted the EU stock markets liquidity. Delegated Regulation EU 2017/565 on the European stock markets, on the other hand, published in August 2021, introduced new organizational requirements for the MiFID II investment firms in terms of integrating sustainability factors in their business conduct. Among others, the investment firms are to assess clients concerning their preference regarding sustainable investments. Scarcely addressed in the literature (Siri and Zhu 2019), this new piece of regulation could impact even more the liquidity of the European stock markets.

Author Contributions

Conceptualization, M.C.M.; methodology, M.C.M. and L.R.M.; software, L.R.M. and C.B.; validation, M.C.M., L.R.M., C.B.; formal analysis, M.C.M. and L.R.M.; investigation, M.C.M.; resources, M.C.M. and L.R.M.; data curation, L.R.M., C.B.; writing—original draft preparation, M.C.M.; writing—review and editing, M.C.M., L.R.M., F.B. and C.B.; visualization, M.C.M., L.R.M.; supervision, M.C.M., F.B. All authors have read and agreed to the published version of the manuscript.

Funding

This research received no external funding.

Institutional Review Board Statement

Not applicable.

Informed Consent Statement

Not applicable.

Data Availability Statement

Interested readers may contact the corresponding author for acquiring relevant datasets generated in this research study.

Conflicts of Interest

The authors declare no conflict of interest.

Appendix A

Table A1. Romanian companies considered in the analysis, components of BET index.
CompanyStart Date of AnalysisEnd Date of Analysis
Alro 6 July 20166 July 2020
BRD Groupe Societe Generale6 July 20166 July 2020
Bursa de Valori București6 July 20166 July 2020
Conpet6 July 20166 July 2020
Digi Communications N.V.17 May 20176 July 2020
Societatea Energetică Electrica 6 July 20166 July 2020
Fondul Proprietatea6 July 20166 July 2020
MedLife 22 December 2016 *6 July 2020
Sphera Franchise Group10 November 2017 *6 July 2020
S.N.G.N. Romgaz 6 July 20166 July 2020
S.N. Nuclearelectrica6 July 20166 July 2020
OMV Petrom6 July 20166 July 2020
C.N.T.E.E. Transelectrica6 July 20166 July 2020
S.N.T.G.N. Transgaz6 July 20166 July 2020
Banca Transilvania6 July 20166 July 2020
Teraplast 6 July 20166 July 2020
Purcari Wineries Public Company Limited16 February 2018 *6 July 2020
Notes: *—these companies were admitted later trading on Bucharest Stock Exchange. Source: own table.
Table A2. German companies considered in the analysis, components of DAX index.
CompanyStart Date of AnalysisEnd Date of AnalysisCompanyStart Date of AnalysisEnd Date of Analysis
Adidas3 January 20163 January 2020E.ON SE3 January 20163 January 2020
Allianz3 January 20163 January 2020Fresenius SE3 January 20163 January 2020
BASF3 January 20163 January 2020Fresenius ST3 January 20163 January 2020
Bayer3 January 20163 January 2020Heidelbergcement3 January 20163 January 2020
Beiersdorf AG3 January 20163 January 2020Henkel VZO3 January 20163 January 2020
BMW ST3 January 20163 January 2020Infineon3 January 20163 January2020
Continental AG3 January 20163 January 2020Linde PLC3 January 20163 January 2020
Covestro3 January 20163 January 2020Merck3 January 20163 January 2020
Daimler3 January 20163 January 2020MTU Aero3 January 20163 January 2020
Delivery Hero3 July 20173 January 2020Muenc.Rueckvers.3 January 20163 January 2020
Deutsche Bank AG3 January 20163 January 2020RWE AG ST3 January 20163 January 2020
Deutsche Boerse3 January 20163 January 2020SAP3 January 20163 January 2020
Deutsche Post3 January 20163 January 2020Siemens AG3 January 20163 January 2020
Deutsche Telekom AG3 January 20163 January 2020Volkswagen VZO3 January 20163 January 2020
Deutsche Wohnen3 January 20163 January 2020Vonovia3 January 20163 January 2020
Source: own table.
Table A3. Hausman test results for the Romanian sample.
Period of Analysischi2p-ValuePreferred Model
L1 3 months10.500.0147FE
6 months2.720.4374RE
12 months4.630.2010RE
18 months4.550.2078RE
24 months10.610.0050FE
L23 months13.370.0039FE
6 months23.070.0000FE
12 months10.510.0147FE
18 months23.390.0000FE
24 months33.390.0000FE
L33 months13.390.0039FE
6 months18.560.0003FE
12 months8.130.0434FE
18 months18.750.0003FE
24 months28.570.0000FE
L4 3 months1.8061.50RE
6 months2.030.5655RE
12 months1.350.7168RE
18 months4.990.1725RE
24 months1.160.7623RE
Notes: L1-Hui-Heubel liquidity ratio; L2-Amihud ratio; L3-Turnover ratio; L4-Corwin-Schultz bid-ask spread; FE—fixed effects models; RE—random effects models. Source: own table.
Table A4. Hausman test results for the German sample.
Period of Analysischi2p-ValuePreferred Model
L1 3 months13.340.0013FE
6 months5.210.0739RE
12 months7.900.0481FE
18 months8.570.0356FE
24 months6.730.0346FE
L23 months7.400.0247FE
6 months7.350.0253FE
12 months17.020.0007FE
18 months11.880.0078FE
24 months2.810.2451RE
L33 months42.030.0000FE
6 months10.760.0046FE
12 months17.350.0006FE
18 months13.770.0032FE
24 months4.090.1293RE
L4 3 months2.090.3515RE
6 months2.880.2373RE
12 months2.040.5633RE
18 months2.320.5080RE
24 months7.770.0206FE
Notes: L1-Hui-Heubel liquidity ratio; L2-Amihud ratio; L3-Turnover ratio; L4-Corwin-Schultz bid-ask spread; FE—fixed effects models; RE—random effects models. Source: own table.

Notes

1
See (Arouri et al. 2013) for more details on related research in emerging markets.
2
3
See (Kawai and Prasad 2011) for more details regarding the financial market regulation and reforms in emerging markets.

References

  1. Aghanya, Daniel, Vineet Agarwal, and Sunil Poshakwale. 2020. Market in Financial Instruments Directive (MiFID), stock price informativeness and liquidity. Journal of Banking & Finance 113: 105730. [Google Scholar]
  2. Anselmi, Giulio, and Giovanni Petrella. 2021. Regulation and stock market quality: The impact of MiFID II provision on research unbundling. International Review of Financial Analysis 76: 101788. [Google Scholar] [CrossRef]
  3. Arouri, Mohammed El Hedi, Sabri Boubaker, and Duc Khuong Nguyen, eds. 2013. Emerging Markets and the Global Economy: A Handbook, 1st ed. Cambridge, MA, USA: Academic Press. [Google Scholar]
  4. Beck, Thorsten, Asli Demirgüc-Kunt, and Ross Levine. 2003. Law, endowments, and finance. Journal of Financial Economics 70: 137–81. [Google Scholar] [CrossRef]
  5. Biffany, Brendan. 2018. Fixing soft dollars is not that hard: A consent and reporting framework for regulating client commission arrangements. Duke Law Journal 68: 141–74. [Google Scholar]
  6. Brockman, Paul, and Dennis Y. Chung. 2003. Investor protection and firm liquidity. The Journal of Finance 58: 921–37. [Google Scholar] [CrossRef]
  7. Christensen, Hans B., Luzi Hail, and Christian Leuz. 2016. Capital-market effects of securities regulation: Prior conditions, implementation, and enforcement. The Review of Financial Studies 29: 2885–924. [Google Scholar] [CrossRef] [Green Version]
  8. Claessens, Stijn, and Luc Laeven. 2003. Financial development, property rights, and growth. The Journal of Finance 58: 2401–36. [Google Scholar] [CrossRef]
  9. Corwin, Shane A., and Paul Schultz. 2012. A simple way to estimate bid-ask spreads from daily high and low prices. The Journal of Finance 67: 719–60. [Google Scholar] [CrossRef]
  10. Crockett, Andrew. 2008. Market liquidity and financial stability. Financial Stability Review 11: 13–17. [Google Scholar]
  11. Cumming, Douglas, Sofia Johan, and Dan Li. 2011. Exchange trading rules and stock market liquidity. Journal of Financial Economics 99: 651–71. [Google Scholar] [CrossRef] [Green Version]
  12. Deakin, Simon, Prabirjit Sarkar, and Mathias Siems. 2018. Is there a relationship between shareholder protection and stock market development? Journal of Law, Finance and Accounting 3: 115–46. [Google Scholar] [CrossRef]
  13. Fama, Eugene F. 1991. Efficient capital markets: II. The Journal of Finance 46: 1575–617. [Google Scholar] [CrossRef]
  14. Fang, Bingxu, Ole-Kristian Hope, Zhongwei Huang, and Rucsandra Moldovan. 2020. The effects of MiFID II on sell-side analysts, buy-side analysts, and firms. Review of Accounting Studies 25: 855–902. [Google Scholar] [CrossRef]
  15. Gabrielsen, Alexandros, Massimiliano Marzo, and Paolo Zagaglia. 2011. Measuring Market Liquidity: An Introductory Survey, Quaderni DSE, Working Papers No. 802, Dipartimento Scienze Economiche, Universita’ di Bologna. Available online: https://papers.ssrn.com/sol3/papers.cfm?abstract_id=1976149 (accessed on 5 December 2020).
  16. Guo, Yifeng, and Lira Mota. 2021. Should information be sold separately? Evidence from MiFID II. Journal of Financial Economics 142: 97–126. [Google Scholar] [CrossRef]
  17. Huang, Tao, Fei Wu, Jing Yu, and Bohui Zhang. 2020. Investor protection and the value impact of stock liquidity. Journal of International Business Studies 51: 72–94. [Google Scholar] [CrossRef]
  18. IOSCO. 2007. Factors Influencing Liquidity in Emerging Markets. Available online: https://www.iosco.org/library/pubdocs/pdf/IOSCOPD258.pdf (accessed on 5 December 2020).
  19. 2011. Financial Market Regulation and Reforms in Emerging Markets. Asian Development Bank Institute and the Brookings Institution. Available online: https://www.adb.org/publications/financial-market-regulation-and-reforms-emerging-markets (accessed on 5 June 2021).
  20. King, Robert G., and Ross Levine. 1993. Finance and growth: Schumpeter might be right. The Quarterly Journal of Economics 108: 717–37. [Google Scholar] [CrossRef]
  21. Lang, Mark H., Jedson Pinto, and Edward Sul. 2019. MiFID II Unbundling and Sell Side Analyst Research. Available online: https://papers.ssrn.com/sol3/papers.cfm?abstract_id=3408198 (accessed on 10 June 2021).
  22. Lee, J. 2018. Where Are the Analysts? Europe Small Caps Battle to Be Seen. Bloomberg. Available online: https://www.bloomberg.com/news/articles/2018-09-10/where-are-the-analysts-europe-s-small-caps-battle-to-be-seen (accessed on 10 June 2021).
  23. Miloș, Marius C. 2021. Impact of MiFID II on the market volatility–analysis on some developed and emerging European stock markets. Laws 10: 55. [Google Scholar] [CrossRef]
  24. OECD. 2021. OECD Capital Market Review of Romania 2021. Mapping Report. Available online: https://www.oecd.org/corporate/OECD-Capital-Market-Review-Romania-2021-Mapping-Report.pdf (accessed on 5 November 2021).
  25. Roulston, Darren T. 2003. Analyst following and market liquidity. Contemporary Accounting Research 20: 552–78. [Google Scholar] [CrossRef]
  26. Santoso, Wimboh, Cicilia A. Harun, Taufik Hidayat, and Hero Wonida. 2010. Market Liquidity Risk as an Indicator of Financial Stability: The Case of Indonesia. Available online: https://www.bis.org/repofficepubl/arpresearch201003.05.pdf (accessed on 10 December 2020).
  27. Sarr, Abdourahmane, and Tonny Lybeck. 2002. Measuring Liquidity in FINANCIAL markets, IMF Working Paper 02/232. Available online: https://www.imf.org/en/Publications/WP/Issues/2016/12/30/Measuring-Liquidity-in-Financial-Markets-16211 (accessed on 10 December 2020).
  28. Siri, Michele, and Shanshan Zhu. 2019. Will the EU Commission successfully integrate sustainability risks and factors in the investor protection regime? A research agenda. Sustainability 11: 6292. [Google Scholar] [CrossRef] [Green Version]
  29. Utkilen, Henriette, and Synne Wakeford-Wesmann. 2019. Liquidity Following MiFID II. Estimating the Effect of Research Unbundling on Norwegian Small- and Mid-Cap Stocks. Master’s thesis, Norwegian School of Economics, Bergen. Available online: https://openaccess.nhh.no/nhh-xmlui/handle/11250/2609729 (accessed on 10 December 2020).
  30. Wyman, Oliver, and World Federation of Exchanges. 2020. Enhancing Liquidity in Emerging Market Exchanges. Available online: https://www.world-exchanges.org/storage/app/media/research/Studies_Reports/liquidity-in-emerging-market-exchanges-wfe-amp-ow-report.pdf (accessed on 5 June 2021).
Figure 1. Dynamics of liquidity ratios at company level and their average throughout the analysis period. Notes: BET-Romanian blue-chip index; DAX-German blue-chip index; L1-Hui–Heubel liquidity ratio; L2-Amihud ratio; L3-Turnover ratio; L4-Corwin–Schultz bid-ask spread. Source: Own figure.
Ijfs 09 00069 g001aIjfs 09 00069 g001b
Figure 2. Estimated coefficients for MiFID II, 95% confidence interval: (a) BET; (b) DAX. Notes: L1-Hui-Heubel liquidity ratio; L2-Amihud ratio; L3-Turnover ratio; L4-Corwin-Schultz bid-ask spread. Source: Own figures.
Ijfs 09 00069 g002aIjfs 09 00069 g002b
Table 1. Descriptive statistics (2-year horizon).
L o g ( L 1 ) L o g ( L 2 ) L o g ( L 3 ) L o g ( L 4 ) L o g ( M C a p ) S D GDPcapNCNDEP
Pre-MiFID II (Romanian stock market)
Average7.23−3.98−8.780.7521.640.0127,442.34
SD2.292.411.601.171.340.01907.3988
Min 0.72−9.98−20.39−3.3818.830.0025,601.19
Max 13.408.78−3.603.6423.750.1029,029.47
Post-MiFID II (Romanian stock market)
Mean7.38−3.53−8.930.7621.470.0131,402.641986.965.510.95
SD2.312.491.681.191.450.011336.532344.855.428.62
Min 0.21−10.11−17.47−3.5718.430.0029,049.850.001.00.00
Max 13.987.25−2.273.6823.960.1133,365.9210,26929487.50
Pre-MiFID II (German stock market)
Mean 6.92−9.29−6.080.8424.130.0151,750.02
SD1.161.390.721.000.780.011531.40
Min 3.11−15.27−10.15−3.4422.080.0048,763.08
Max 10.30−2.41−2.643.5325.510.0854,378.88
Post-MiFID II (German stock market)
Mean 6.91−9.42−5.940.8824.200.0155,742.49
SD1.261.280.711.010.750.01664.25
Min 2.89−14.64−9.30−3.8822.360.0054,381.12
Max 11.29−4.98−2.803.8625.730.0956,625.49
Notes: L1—Hui–Heubel liquidity ratio; L2—Amihud ratio; L3—Turnover ratio; L4—Corwin–Schultz bid–ask spread; Mcap—market capitalization; SD—10 day return volatility; GDPcap—GPP/capita; NC—cumulative COVID-19 cases per capita; ND—cumulative COVID-19 deaths per capita; EP—economic support index that proxy the institutional anti-Covid policy. Source: Own table.
Table 2. Correlation matrix.
L o g
( L 1 )
L o g
( L 2 )
L o g
( L 3 )
L o g
( L 4 )
Log
(MCap)
SDGDPcapNCNDEP
BET
L o g ( L 1 ) 1
L o g ( L 2 ) 0.381
L o g ( L 3 ) −0.37−0.641
L o g ( L 4 ) 0.030.020.151
L o g ( M C a p )−0.15−0.70.13−0.011
S D 0.070.160.060.2−0.071
GDPcap0.030.08−0.030.01−0.050.061
NC0.020.030.010.03−0.030.080.061
ND0.020.030.010.03−0.030.070.0511
EP0.020.040.030.04−0.040.160.120.890.881
DAX
L o g ( L 1 ) 1
L o g ( L 2 ) 0.151
L o g ( L 3 ) −0.6−0.171
L o g ( L 4 ) −0.000.130.191
L o g ( M C a p )0.31−0.52−0.22−0.051
S D −0.080.230.330.17−0.21
GDPcap−0.01−0.10.03−0.010.07−0.131
Notes: BET—Romanian blue-chip index; DAX—German blue-chip index; L1—Hui–Heubel liquidity ratio; L2—Amihud ratio; L3—Turnover ratio; L4—Corwin–Schultz bid–ask spread; Mcap—market capitalization; SD—10 day return volatility; GDPcap—GDP per capita; NC—cumulative COVID-19 cases per capita; ND—cumulative COVID-19 deaths per capita; EP—economic support index that proxy the institutional anti-Covid policy. Source: Own table.
Table 3. Impact of MiFID II on Romanian stock market liquidity.
VARIABLESL1L1L1L1L1L2L2L2L2L2
MiFID II (3m)0.165 ** 0.329 **
(0.0818) (0.132)
MiFID II (6m) 0.101 0.217 **
(0.0623) (0.0998)
MiFID II (12m) 0.146 *** 0.172 ***
(0.0415) (0.0662)
MiFID II (18m) 0.104 *** 0.0806
(0.0360) (0.0569)
MiFID II (24m) 0.190 *** 0.270 ***
(0.0340) (0.0531)
Log (Mcap)1.171 ***0.398 **0.578 ***0.538 ***1.068 ***−0.202−0.674 **−1.327 ***−1.510 ***−0.796 ***
(0.326)(0.180)(0.0861)(0.0566)(0.0363)(0.526)(0.288)(0.137)(0.0895)(0.0568)
SD25.04 ***17.29 ***19.08 ***18.23 ***17.57 ***27.46 ***10.49 ***14.59 ***13.79 ***11.91 ***
(2.603)(1.677)(1.208)(1.009)(0.837)(4.203)(2.684)(1.925)(1.596)(1.308)
GDPcap−0.000195 *−0.000103 ** 4.80 × 10 5 *** 2.00 × 10 5 ** 3.63 × 10 5 ***−0.000275 9.82 × 10 5 2.82 × 10 5 2.12 × 10 5 2.85 × 10 5 **
(0.000114) ( 4.30 × 10 5 ) ( 1.37 × 10 5 ) ( 8.17 × 10 6 ) ( 7.19 × 10 6 )(0.000185) ( 6.89 × 10 5 ) ( 2.18 × 10 5 ) ( 1.29 × 10 5 ) ( 1.12 × 10 5 )
NC 8642 *** 7100 ***
(1198) (1874)
ND −126,131 *** −102,629 ***
(17,274) (27,009)
EP −0.00552 *** −0.00655 ***
(0.00134) (0.00209)
Constant−12.351.602−4.006 **−3.995 ***−14.98 ***8.45713.50 **25.45 ***27.98 ***13.97 ***
(8.643)(4.300)(1.930)(1.194)(0.784)(13.96)(6.884)(3.077)(1.888)(1.226)
Observations20844118805811,90714,04220844118805811,90714,042
R-squared0.0490.0270.0360.0330.0860.0230.0080.0260.0360.029
Number of FirmID17171717171717171717
Country FEYesYesYesYesYesYesYesYesYesYes
Variables L3L3L3L3L3L4L4L4L4L4
MiFID II (3m)−0.454 *** −0.109
(0.123) (0.101)
MiFID II (6m) −0.375 *** −0.0165
(0.0917) (0.0751)
MiFID II (12m) −0.307 *** −0.0749
(0.0617) (0.0503)
MiFID II (18m) −0.127 ** −0.0659
(0.0536) (0.0427)
MiFID II (24m) −0.337 *** −0.0758 *
(0.0501) (0.0410)
Log(Mcap)−1.036 **−0.3790.1900.407 ***−0.230 ***−0.125−0.218−0.08240.0195−0.0165
(0.488)(0.264)(0.128)(0.0844)(0.0536)(0.401)(0.216)(0.104)(0.0672)(0.0438)
SD3.99018.77 ***17.16 ***19.78 ***23.06 ***17.76 ***23.84 ***22.50 ***22.87 ***23.16 ***
(3.901)(2.467)(1.795)(1.503)(1.233)(3.209)(2.019)(1.464)(1.197)(1.009)
GDPcap0.0002260.000156 ** 8.68 × 10 5 *** 6.79 × 10 6 5.37 × 10 5 *** 7.84 × 10 5 5.45 × 10 5 7.08 × 10 6 7.90 × 10 6 1.12 × 10 5
(0.000171) ( 6.33 × 10 5 ) ( 2.04 × 10 5 ) ( 1.22 × 10 5 ) ( 1.06 × 10 5 )(0.000141) ( 5.18 × 10 5 ) ( 1.66 × 10 5 ) ( 9.70 × 10 6 ) ( 8.67 × 10 6 )
NC −8713 *** 1688
(1767) (1445)
ND 126,548 *** −23,984
(25,466) (20,823)
EP 0.00938 *** −0.00118
(0.00197) (0.00161)
Constant6.720−5.409−15.64 ***−17.69 ***−5.650 ***0.9626.6862.044−0.1880.495
(12.95)(6.328)(2.868)(1.779)(1.156)(10.66)(5.179)(2.340)(1.417)(0.945)
Observations20844118805811,90714,04220844118805811,90714,042
R-squared0.0130.0230.0150.0200.0320.0180.0360.0290.0300.039
Number of FirmID17171717171717171717
Country FEYesYesYesYesYesYesYesYesYesYes
Notes: L1-Hui-Heubel liquidity ratio; L2-Amihud ratio; L3-Turnover ratio; L4-Corwin–Schultz bid-ask spread; Mcap-market capitalization; SD-10 day return volatility; GDPcap-GDP per capita; NC-cumulative COVID-19 cases per capita; ND-cumulative COVID-19 deaths per capita; EP-economic support index that proxy the institutional anti-Covid policy. Standard errors in parentheses. *** p < 0.01, ** p < 0.05, * p < 0.1. Source: own table.
Table 4. Impact of MiFID II on German stock market liquidity.
VARIABLESL1L1L1L1L1L2L2L2L2L2
MiFID II (3m)0.0462 ** −0.0382
(0.0190) (0.0499)
MiFID II (6m) −0.00366 −0.0754 *
(0.0153) (0.0393)
MiFID II (12m) −0.0654 *** −0.0874 ***
(0.0124) (0.0321)
MiFID II (18m) 0.0421 *** 0.00580
(0.0105) (0.0274)
MiFID II (24m) 0.0403 *** 0.0402 *
(0.00909) (0.0239)
Log (Mcap)1.348 ***0.946 ***1.025 ***1.030 ***1.012 ***−0.289−0.463 ***−0.516 ***−0.633 ***−0.710 ***
(0.0776)(0.0455)(0.0223)(0.0148)(0.0110)(0.203)(0.117)(0.0576)(0.0386)(0.0289)
SD16.42 ***18.99 ***14.27 ***15.73 ***14.65 ***33.53 ***38.41 ***26.72 ***27.32 ***27.43 ***
(1.245)(0.926)(0.554)(0.446)(0.347)(3.264)(2.372)(1.431)(1.162)(0.912)
GDPcap−0.000242 ***−0.000120 *** 4.53 × 10 6 5.39 × 10 5 *** 4.45 × 10 5 ***−0.000134 7.01 × 10 5 ** 9.84 × 10 6 3.83 × 10 5 *** 4.48 × 10 5 ***
( 3.73 × 10 5 ) ( 1.09 × 10 5 )(5.05 × 10⁻⁶) ( 2.97 × 10 6 ) ( 2.03 × 10 6 ) ( 9.78 × 10 5 ) ( 2.78 × 10 5 ) ( 1.30 × 10 5 ) ( 7.74 × 10 6 ) ( 5.35 × 10 6 )
Constant−12.87 ***−9.741 ***−18.30 ***−15.34 ***−15.36 ***4.3735.127 *2.2017.605 ***9.826 ***
(2.811)(1.148)(0.585)(0.363)(0.261)(7.371)(2.941)(1.510)(0.947)(0.686)
Observations3690744014,81922,19229,5973690744014,81922,19229,597
R-squared0.1180.1100.1460.1980.2440.0290.0400.0320.0480.084
Number of FirmID30303030303030303030
Country FEYesYesYesYesYesYesYesYesYesYes
VariablesL3L3L3L3L3L4L4L4L4L4
MiFID II (3m)0.136 *** −0.0293
(0.0196) (0.0494)
MiFID II (6m) 0.162 *** −0.00165
(0.0165) (0.0377)
MiFID II (12m) 0.179 *** 0.0276
(0.0133) (0.0309)
MiFID II (18m) 0.115 *** 0.0438 *
(0.0114) (0.0264)
MiFID II (24m) 0.174 *** 0.0562 **
(0.00988) (0.0237)
Log(Mcap)−1.122 ***−0.545 ***−0.473 ***−0.386 ***−0.318 ***−0.266−0.199 *−0.0557−0.0108−0.0433
(0.0799)(0.0489)(0.0239)(0.0161)(0.0119)(0.201)(0.112)(0.0555)(0.0373)(0.0286)
SD20.00 ***17.88 ***19.46 ***20.43 ***20.53 ***29.87 ***27.84 ***23.10 ***23.89 ***22.19 ***
(1.281)(0.995)(0.595)(0.484)(0.377)(3.230)(2.275)(1.379)(1.122)(0.903)
GDPcap0.000199 *** 7.83 × 10 5 *** 5.38 × 10 6 2.89 × 10 5 *** 2.00 × 10 6 0.000151 3.26 × 10 5 5.33 × 10 6 7.25 × 10 6 6.45 × 10 6
( 3.84 × 10 5 ) ( 1.17 × 10 5 ) ( 5.42 × 10 6 ) ( 3.22 × 10 6 ) ( 2.21 × 10 6 ) ( 9.68 × 10 5 ) ( 2.67 × 10 5 ) ( 1.26 × 10 5 ) ( 7.47 × 10 6 ) ( 5.30 × 10 6 )
Constant10.14 ***2.636 **4.820 ***1.428 ***1.206 ***−1.2543.5351.5851.1591.922 ***
(2.892)(1.233)(0.628)(0.394)(0.283)(7.293)(2.820)(1.456)(0.914)(0.678)
Observations3690744014,81922,19229,5973690744014,81922,19229,597
R-squared0.2120.1540.1660.1700.1640.0280.0230.0230.0230.024
Number of FirmID30303030303030303030
Country FEYesYesYesYesYesYesYesYesYesYes
Notes: L1-Hui-Heubel liquidity ratio; L2-Amihud ratio; L3-Turnover ratio; L4-Corwin-Schultz bid-ask spread. Mcap-market capitalization; SD-10 day return volatility; GDPcap-GDP per capita; NC-cumulative COVID-19 cases per capita; ND-cumulative COVID-19 deaths per capita; EP-economic support index that proxy the institutional anti-Covid policy. Stand-rd errors in parentheses. *** p < 0.01, ** p < 0.05, * p < 0.1. Source: own table.
Publisher’s Note: MDPI stays neutral with regard to jurisdictional claims in published maps and institutional affiliations.

