The Business Sector, Firm Age, and Performance: The Mediating Role of Foreign Ownership and Financial Leverage


Abstract
1. Introduction
2. Materials and Methods
2.1. Materials
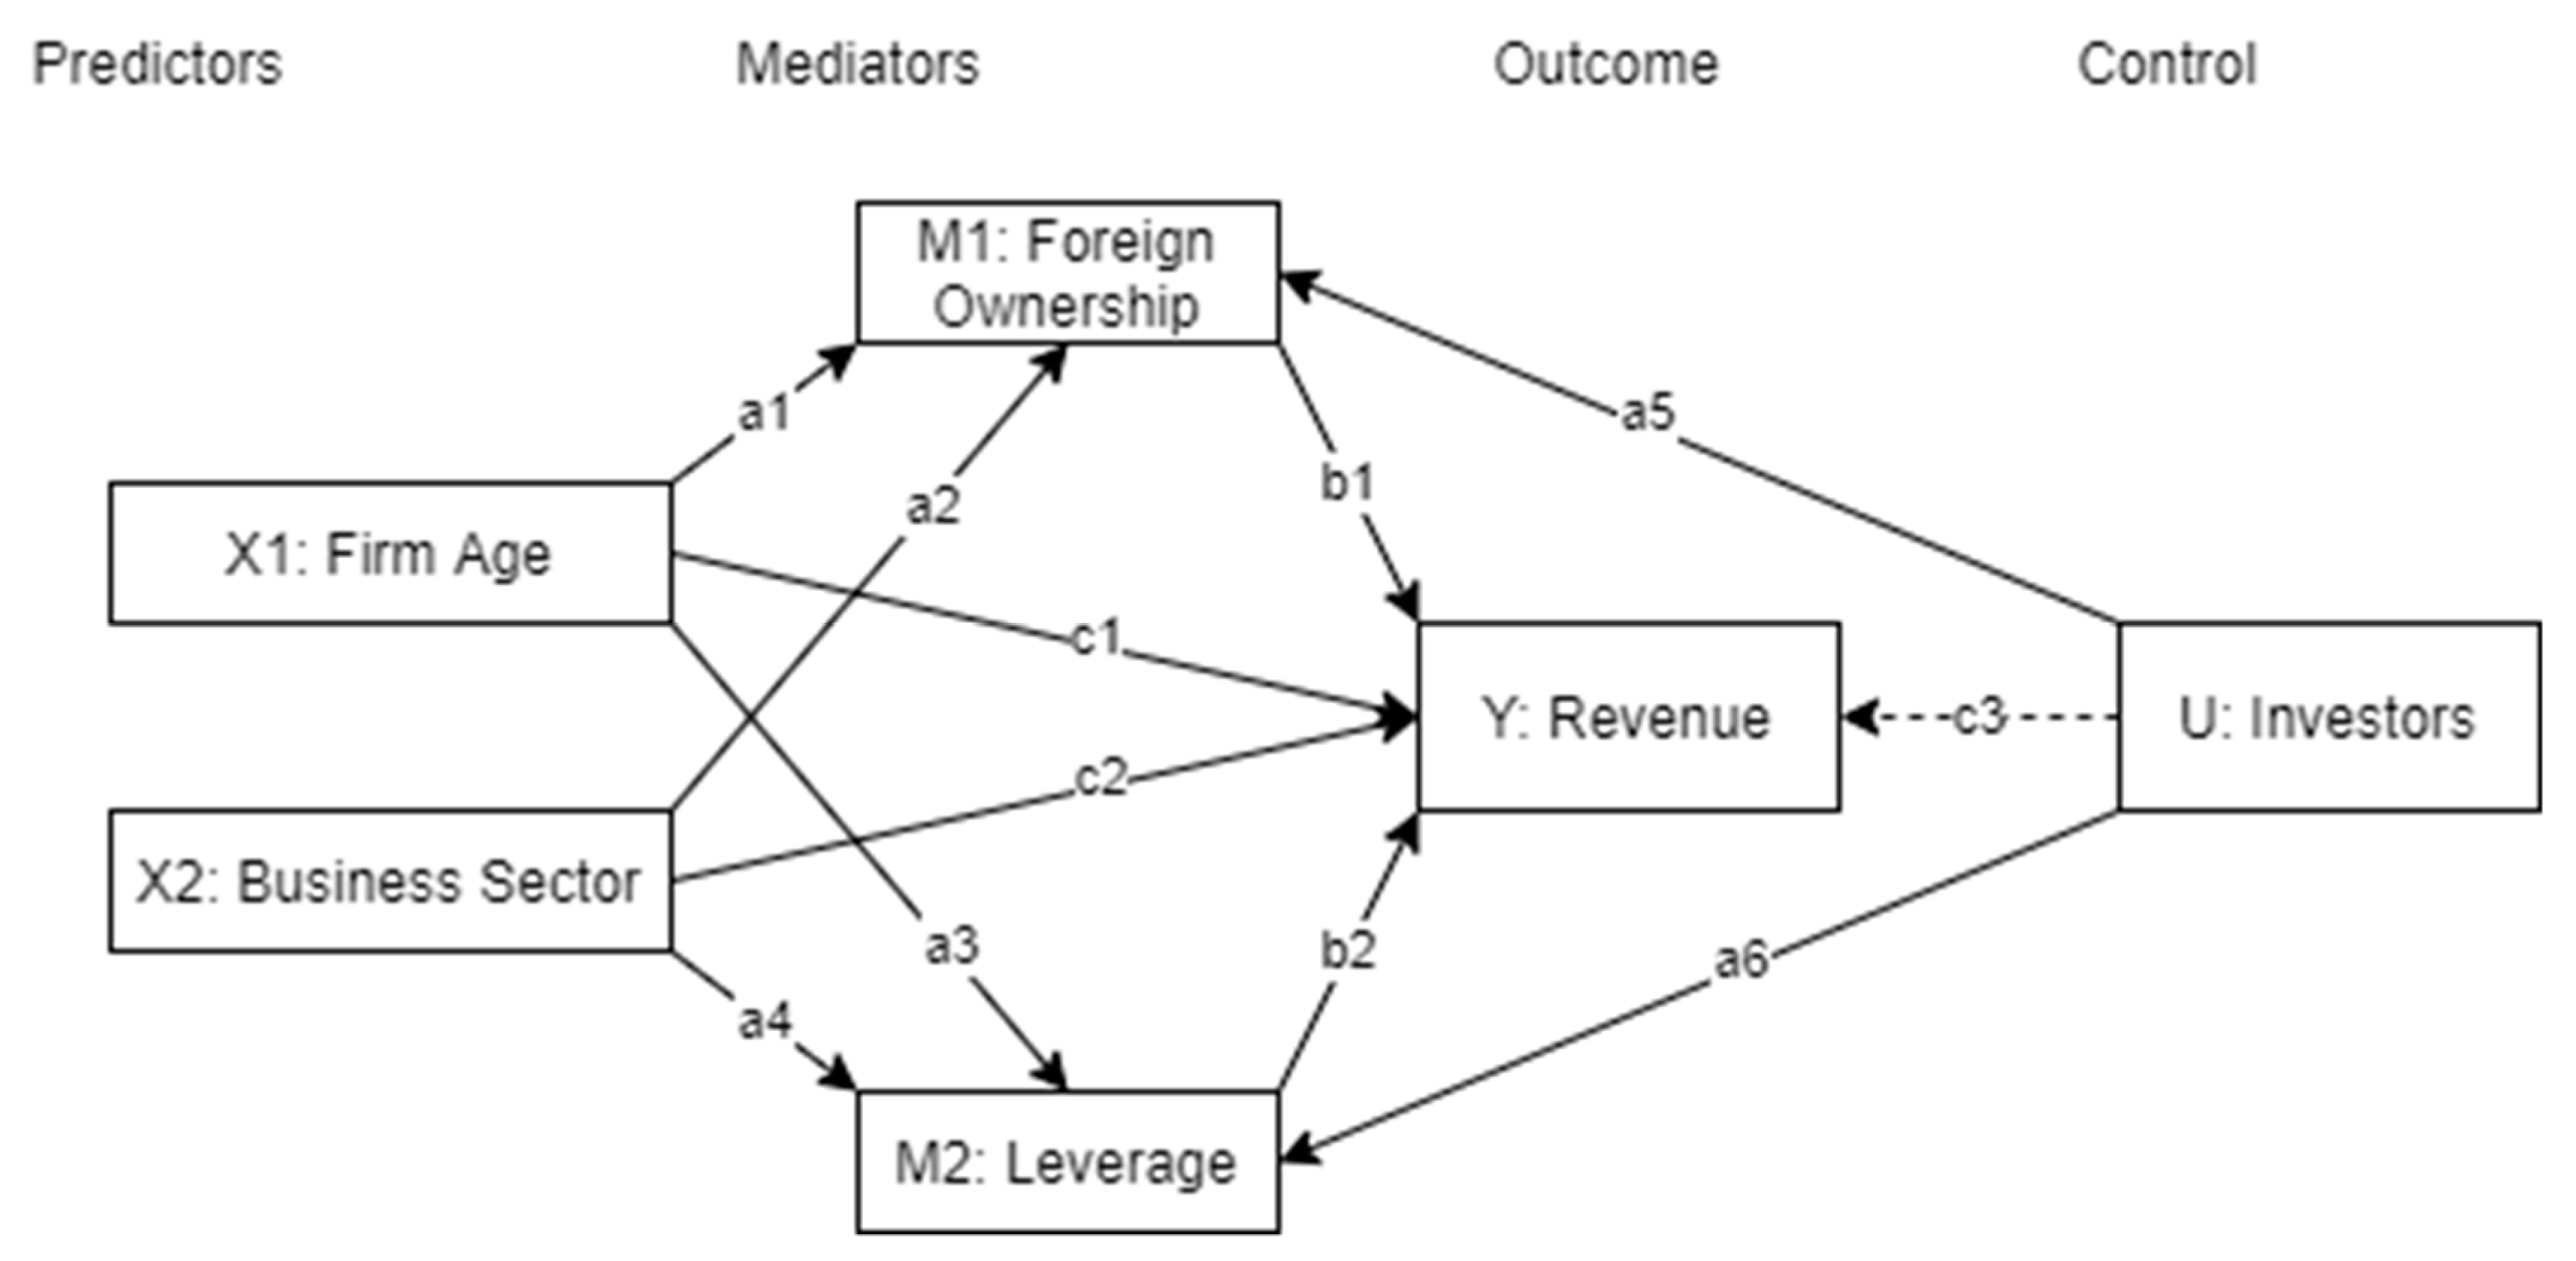
2.2. Methods
3. Results
4. Discussion
5. Conclusions
Author Contributions
Funding
Acknowledgments
Conflicts of Interest
References
- Akolaa, Andrews Adugudaa. 2018. Foreign Market Entry through Acquisition and Firm Financial Performance: Empirical Evidence from Ghana. International Journal of Emerging Markets 13: 1348–71. [Google Scholar] [CrossRef]
- Anton, Sorin Gabriel. 2019. Leverage and Firm Growth: An Empirical Investigation of Gazelles from Emerging Europe. International Entrepreneurship and Management Journal 15: 209–32. [Google Scholar] [CrossRef]
- Arnold, Jens Matthias, Beata Javorcik, Molly Lipscomb, and Aaditya Mattoo. 2016. Services Reform and Manufacturing Performance: Evidence from India. The Economic Journal 126: 1–39. [Google Scholar] [CrossRef]
- Benfratello, Luigi, and Alessandro Sembenelli. 2006. Foreign Ownership and Productivity: Is the Direction of Causality so Obvious? International Journal of Industrial Organization 24: 733–51. [Google Scholar] [CrossRef]
- Bentivogli, Chiara, and Litterio Mirenda. 2017. Foreign Ownership and Performance: Evidence from Italian Firms Foreign Ownership and Performance: Evidence From. International Journal of the Economics of Business 1516: 1–23. [Google Scholar] [CrossRef]
- Campello, Murillo. 2006. Debt Financing: Does It Boost or Hurt Firm Performance in Product Markets? Journal of Financial Economics 82: 135–72. [Google Scholar] [CrossRef]
- Canales, Rodrigo, and Ramana Nanda. 2012. A Darker Side to Decentralized Banks: Market Power and Credit Rationing in SME Lending. Journal of Financial Economics 105: 353–66. [Google Scholar] [CrossRef]
- Capasso, Arturo, Carmen Gallucci, and Matteo Rossi. 2015. Standing the Test of Time. Does Firm Performance Improve with Age? An Analysis of the Wine Industry. Business History 57: 37–41. [Google Scholar] [CrossRef]
- Casey, Eddie, and Conor M. OToole ’. 2014. Bank Lending Constraints, Trade Credit and Alternative Financing during the Financial Crisis: Evidence from European SMEs. Journal of Corporate Finance 27: 173–93. [Google Scholar] [CrossRef]
- Chen, Homin, and Tain-jy Chen. 1998. Network Linkages and Location Choice in Foreign Direct Investment. Journal of International Business Studies 29: 445–67. [Google Scholar] [CrossRef]
- Cheong, Calvin W. H., Miin Huui Lee, and Marc Arul Weissmann. 2020. Credit Access, Tax Structure and the Performance of Malaysian Manufacturing SMEs. International Journal of Managerial Finance 16: 433–54. [Google Scholar] [CrossRef]
- Coad, Alex. 2018. Firm Age: A Survey. Journal of Evolutionary Economics 28: 13–43. [Google Scholar] [CrossRef]
- Coad, Alex, Agustí Segarra, and Mercedes Teruel. 2013. Like Milk or Wine: Does Firm Performance Improve with Age? Structural Change and Economic Dynamics 24: 173–89. [Google Scholar] [CrossRef]
- Cubillas, Elena, and Nuria Suárez. 2018. Bank Market Power and Lending during the Global Financial Crisis. Journal of International Money and Finance 89: 1–22. [Google Scholar] [CrossRef]
- Duggan, Victor, Sjamsu Rahardja, and Gonzalo Varela. 2013. Service Sector Reform and Manufacturing Productivity: Evidence from Indonesia. Policy Research Working Papers. Washington: The World Bank. [Google Scholar] [CrossRef]
- Esteve-Pérez, Silviano, Fabio Pieri, and Diego Rodriguez. 2018. Age and Productivity as Determinants of Firm Survival over the Industry Life Cycle. Industry and Innovation 25: 167–98. [Google Scholar] [CrossRef]
- Ettlie, John E., and Stephen R. Rosenthal. 2011. Service versus Manufacturing Innovation. Journal of Product Innovation Management 28: 285–99. [Google Scholar] [CrossRef]
- Fowowe, Babajide. 2017. Access to Finance and Firm Performance: Evidence from African Countries. Journal of Advanced Research 7: 6–17. [Google Scholar] [CrossRef]
- Fungáčová, Zuzana, Laura Solanko, and Laurent Weill. 2014. Does Competition Influence the Bank Lending Channel in the Euro Area? Journal of Banking & Finance 49: 356–66. [Google Scholar] [CrossRef]
- Hande, Karadag. 2017. The Impact of Industry, Firm Age and Education Level on Financial Management Performance in Small and Medium-Sized Enterprises (SMEs): Evidence from Turkey. Journal of Entrepreneurship in Emerging Economies 9: 300–314. [Google Scholar] [CrossRef]
- Ibhagui, Oyakhilome W., and Felicia O. Olokoyo. 2018. Leverage and Firm Performance: New Evidence on the Role of Firm Size. The North American Journal of Economics and Finance 45: 57–82. [Google Scholar] [CrossRef]
- Ilhan, Dalci. 2018. Impact of Financial Leverage on Profitability of Listed Manufacturing Firms in China. Pacific Accounting Review 30: 410–32. [Google Scholar] [CrossRef]
- Jin, Man, Shunan Zhao, and Subal C. Kumbhakar. 2019. Financial Constraints and Firm Productivity: Evidence from Chinese Manufacturing. European Journal of Operational Research 275: 1139–56. [Google Scholar] [CrossRef]
- Joshua, Abor. 2007. Debt Policy and Performance of SMEs: Evidence from Ghanaian and South African Firms. Edited by Michael R Powers. The Journal of Risk Finance 8: 364–79. [Google Scholar] [CrossRef]
- Kashefi Pour, Eilnaz, and Ehsan Khansalar. 2015. Does Debt Capacity Matter in the Choice of Debt in Reducing the Underinvestment Problem? Research in International Business and Finance 34: 251–64. [Google Scholar] [CrossRef]
- Kücher, Alexander, Stefan Mayr, Christine Mitter, Christine Duller, and Birgit Feldbauer Durstmüller. 2018. Firm Age Dynamics and Causes of Corporate Bankruptcy: Age Dependent Explanations for Business Failure. Review of Managerial Science, 0123456789. [Google Scholar] [CrossRef]
- Lahiri, Somnath, and Saptarshi Purkayastha. 2017. Impact of Industry Sector on Corporate Diversification and Firm Performance: Evidence from Indian Business Groups. Canadian Journal of Administrative Sciences/Revue Canadienne Des Sciences de l’Administration 34: 77–88. [Google Scholar] [CrossRef]
- Lang, Larry, Eli Ofek, and René M. Stulz. 1996. Leverage, Investment, and Firm Growth. Journal of Financial Economics 40: 3–29. [Google Scholar] [CrossRef]
- Lefever, Samúel, Michael Dal, and Ásrún Matthíasdóttir. 2007. Online Data Collection in Academic Research: Advantages and Limitations. British Journal of Educational Technology 38: 574–82. [Google Scholar] [CrossRef]
- Legesse, Guta. 2018. An Analysis of the Effects of Aging and Experience on Firms’ Performance BT—Economic Growth and Development in Ethiopia. Edited by Almas Heshmati and Haeyeon Yoon. Singapore: Springer, pp. 255–76. [Google Scholar] [CrossRef]
- Li, Yao Amber, Wei Liao, and Chen Carol Zhao. 2018. Credit Constraints and Firm Productivity: Microeconomic Evidence from China. Research in International Business and Finance 45: 134–49. [Google Scholar] [CrossRef]
- Lindemanis, Mārtiņš, Artūrs Loze, and Anete Pajuste. 2019. The Effect of Domestic to Foreign Ownership Change on Firm Performance in Europe. International Review of Financial Analysis, 101341. [Google Scholar] [CrossRef]
- Loderer, Claudio, and Urs Waelchli. 2010. Munich Personal RePEc Archive Firm Age and Performance Firm Age and Performance. no. 26450. Available online: http://mpra.ub.unimuenchen.de/26450/1/MPRA_paper_26450.pdf (accessed on 26 October 2020).
- Love, James H., Brian Ashcroft, and Stewart Dunlop. 1996. Corporate Structure, Ownership and the Likelihood of Innovation. Applied Economics 28: 737–46. [Google Scholar] [CrossRef]
- Lwango, Albert, Régis Coeurderoy, and Gabriel A. Giménez Roche. 2017. Family Influence and SME Performance under Conditions of Firm Size and Age. Journal of Small Business and Enterprise Development 24: 629–48. [Google Scholar] [CrossRef]
- MacKinnon, David P., Stefany Coxe, and Amanda N. Baraldi. 2012. Guidelines for the Investigation of Mediating Variables in Business Research. Journal of Business and Psychology 27: 1–14. [Google Scholar] [CrossRef] [PubMed]
- Majumdar, Sumit K. 1997. The Impact of Size and Age on Firm-Level Performance: Some Evidence from India. Review of Industrial Organization 12: 231–41. [Google Scholar] [CrossRef]
- Mallinguh, Edmund, Christopher Wasike, and Zoltan Zeman. 2020. Technology Acquisition and Smes Performance, the Role of Innovation, Export and the Perception of Owner-Managers. Journal of Risk and Financial Management 13: 258. [Google Scholar] [CrossRef]
- Mattoo, Aaditya, Marcelo Olarreaga, and Kamal Saggi. 2004. Mode of Foreign Entry, Technology Transfer, and FDI Policy. Journal of Development Economics 75: 95–111. [Google Scholar] [CrossRef]
- Nachum, Lilach. 2009. When Is Foreignness an Asset or a Liability? Explaining the Performance Differential Between Foreign and Local Firms. Journal of Management 36: 714–39. [Google Scholar] [CrossRef]
- Prajogo, Daniel I. 2006. The Relationship between Innovation and Business Performance—A Comparative Study between Manufacturing and Service Firms. Knowledge and Process Management 13: 218–25. [Google Scholar] [CrossRef]
- Prajogo, Daniel I. 2016. The Strategic Fit between Innovation Strategies and Business Environment in Delivering Business Performance. International Journal of Production Economics 171: 241–49. [Google Scholar] [CrossRef]
- Preacher, Kristopher J., and Andrew F. Hayes. 2008. Asymptotic and Resampling Strategies for Assessing and Comparing Indirect Effects in Multiple Mediator Models. Behavior Research Methods 40: 879–91. [Google Scholar] [CrossRef]
- Reed, Richard, and Susan F Storrud-Barnes. 2009. Systematic Performance Differences across the Manufacturing-Service Continuum. Service Business 3: 319. [Google Scholar] [CrossRef]
- Seo, Yong Won, Youn Sung Kim, DaeSoo Kim, Yung-Mok Yu, and Sung Hee Lee. 2016. Innovation Patterns of Manufacturing and Service Firms in Korea. Total Quality Management & Business Excellence 27: 718–34. [Google Scholar] [CrossRef]
- Srholec, Martin. 2009. Does Foreign Ownership Facilitate Cooperation on Innovation? Firm-Level Evidence from the Enlarged European Union. The European Journal of Development Research 21: 47–62. [Google Scholar] [CrossRef]
- Thai, An. 2019. The Effect of Foreign Ownership on Capital Structure in Vietnam. Review of Integrative Business and Economics Research 8: 20–32. [Google Scholar]
- Trung, Tran Quoc. 2020. Foreign Ownership and Investment Efficiency: New Evidence from an Emerging Market. International Journal of Emerging Markets 15: 1185–99. [Google Scholar] [CrossRef]
- Tsuruta, Daisuke. 2015. Leverage and Firm Performance of Small Businesses: Evidence from Japan. Small Business Economics 44: 385–410. [Google Scholar] [CrossRef]
- Tsuruta, Daisuke. 2017. Variance of Firm Performance and Leverage of Small Businesses. Journal of Small Business Management 55: 404–29. [Google Scholar] [CrossRef]
- Vithessonthi, Chaiporn, and Jittima Tongurai. 2015. The Effect of Leverage on Performance: Domestically-Oriented versus Internationally-Oriented Firms. Research in International Business and Finance 34: 265–80. [Google Scholar] [CrossRef]
- Wang, Xiaodong, Liang Han, and Xing Huang. 2020. Bank Competition, Concentration and EU SME Cost of Debt. International Review of Financial Analysis 71: 101534. [Google Scholar] [CrossRef]
- Zaborek, Piotr, and Jolanta Mazur. 2019. Enabling Value Co-Creation with Consumers as a Driver of Business Performance: A Dual Perspective of Polish Manufacturing and Service SMEs. Journal of Business Research 104: 541–51. [Google Scholar] [CrossRef]


| Variable | Min Stat | Mean Stat | Max Stat | STD Deviation | VIF | 1 | 2 | 3 | 4 | 5 | 6 |
|---|---|---|---|---|---|---|---|---|---|---|---|
| Revenue (1) | 4.14 | 6.5535 | 8.16 | 0.8596 | 1 | ||||||
| Firm Age (2) | 0.9 | 1.7293 | 2.18 | 0.29125 | 1.248 | 0.204 | 1 | ||||
| Sector (3) | 1 | 4.03 | 8 | 2.179 | 1.293 | 0.88 | 0.07 | 1 | |||
| Investors (4) | 1 | 3.7587 | 5.75 | 0.7841 | 1.491 | 0.204 | −0.15 | 0.32 | 1 | ||
| Leverage (5) | 3.65 | 6.0453 | 8.14 | 6.0453 | 1.262 | 0.57 | 0.009 | 0.31 | 0.411 | 1 | |
| Foreign Owned (6) | −3.52 | −0.959 | 1.67 | 0.8440 | 1.477 | 0.207 | 0.444 | 0.2 | −0.298 | −0.021 | 1.00 |
| Antecedent | Estimates | Standard Error | p-Value | 95% Bootstrap Confidence Interval |
|---|---|---|---|---|
| X1M1: Firm Age~Foreign Own | 0.109 | 0.036 | 0.002 | 0.0480→0.0740 |
| X2M1: Sector~Foreign Own | −0.393 | 0.427 | 0.357 | −1.3190→0.5000 |
| X1M2: Firm Age~Leverage | −0.085 | 0.000 | 0.096 | −0.1820→0.0031 |
| X2M2: Sector~Leverage | 1.113 | 0.0607 | 0.067 | −0.1000→2.2480 |
| M1U: Investors~Foreign Own | 0.000 | 0.000 | 0.062 | 0.0000→0.0000 |
| M2U: Investors~Leverage | 0.000 | 0.000 | 0.474 | 0.0000→0.0000 |
| M1; Y: Foreign Own~Revenue | 0.434 | 0.163 | 0.008 | 0.1230→0.7200 |
| M2; Y: Leverage~Revenue | 0.241 | 0.118 | 0.042 | 0.0100→0.7200 |
| X1; Y: Firm Age~Revenue | 0.237 | 0.068 | 0.000 | 0.0990→0.3660 |
| X2; Y: Sector~Revenue | −1.830 | 0.816 | 0.025 | −3.464→−0.2580 |
| U; Y: Investors~Revenue | 0.000 | 0.000 | 0.000 | 0.0000→0.0000 |
| Indirect Effect 1 | 0.047 | 0.025 | 0.041 | 0.0100→0.1100 |
| Indirect Effect 2 | −0.02 | 0.017 | 0.231 | −0.0580→0.0070 |
| Indirect Effect 3 | −0.17 | 0.213 | 0.424 | −0.6130→0.2660 |
| Indirect Effect 4 | 0.268 | 0.218 | 0.219 | −0.0310→0.8050 |
| Comp1: | 0.068 | 0.030 | 0.022 | 0.0170→0.1340 |
| Comp2: | −0.439 | 0.319 | 0.169 | −1.1220→0.1550 |
| Comp3: | 0.218 | 0.211 | 0.303 | −0.1910→0.6630 |
| Comp4: | −0.289 | 0.224 | 0.198 | −0.8230→0.0210 |
| T. Effect 1: | 0.263 | 0.063 | 0.000 | 0.1460→0.3920 |
| T. Effect 2: | −1.732 | 0.850 | 0.042 | −3.4530→−0.1040 |
| T. Effect 3: | 0.000 | 0.00 | 0.000 | 0.0000→0.000 |
| R Square Estimates: | Revenue | 0.350 | ||
| Foreign Own | 0.107 | |||
| Leverage | 0.041 |
| Sector | Effect (Standard Error) | p-Value | 95% Bootstrap Confidence Interval |
|---|---|---|---|
| Agriculture | −0.5450 (0.2731) | 0.0504 | −1.0909→0.009 |
| Commercial and Service | −0.6210 (0.3089) | 0.0487 | −1.2386→−0.0035 |
| Construction and Allied | 0.4367 (0.3899) | 0.2670 | −0.3427→1.2160 |
| Energy and Petroleum | −1.2016 (0.3152) | 0.0003 | −1.8317→−0.5716 |
| Insurance | −1.3351 (0.7523) | 0.809 | −2.8390→0.1687 |
| Investment | −0.6576 (0.3165) | 0.0419 | −1.2902→−0.0249 |
| Manufacturing and Allied | 1.1765 (0.4155) | 0.0062 | 0.3459→2.0071 |
Publisher’s Note: MDPI stays neutral with regard to jurisdictional claims in published maps and institutional affiliations. |
© 2020 by the authors. Licensee MDPI, Basel, Switzerland. This article is an open access article distributed under the terms and conditions of the Creative Commons Attribution (CC BY) license (http://creativecommons.org/licenses/by/4.0/).
Share and Cite
Mallinguh, E.; Wasike, C.; Zoltan, Z. The Business Sector, Firm Age, and Performance: The Mediating Role of Foreign Ownership and Financial Leverage. Int. J. Financial Stud. 2020, 8, 79. https://doi.org/10.3390/ijfs8040079
Mallinguh E, Wasike C, Zoltan Z. The Business Sector, Firm Age, and Performance: The Mediating Role of Foreign Ownership and Financial Leverage. International Journal of Financial Studies. 2020; 8(4):79. https://doi.org/10.3390/ijfs8040079
Chicago/Turabian StyleMallinguh, Edmund, Christopher Wasike, and Zeman Zoltan. 2020. "The Business Sector, Firm Age, and Performance: The Mediating Role of Foreign Ownership and Financial Leverage" International Journal of Financial Studies 8, no. 4: 79. https://doi.org/10.3390/ijfs8040079
APA StyleMallinguh, E., Wasike, C., & Zoltan, Z. (2020). The Business Sector, Firm Age, and Performance: The Mediating Role of Foreign Ownership and Financial Leverage. International Journal of Financial Studies, 8(4), 79. https://doi.org/10.3390/ijfs8040079