Stock-Market Behavior on Ex-Dates: New Insights from German Stocks with Tax-Free Dividend
Abstract
1. Introduction
2. Tax and Accounting Background of Tax-Free Dividend Payments
3. Returns and Trading Volume on Ex-Dates—Taxes and Alternative Explanations
3.1. Taxes
3.2. Alternative Explanations
4. Data and Summary Statistics
5. Price Analysis
5.1. Methodology
5.2. Results
6. Volume Analysis
6.1. Methodology
6.2. Results
7. Conclusions
Funding
Acknowledgments
Conflicts of Interest
Appendix A. Additional Tables and Figures
| Full Sample | HI-System | FT-System | |
|---|---|---|---|
| 2002–2019 | 2002–2008 | 2009–2019 | |
| D | 0.8719 | 0.8035 | 0.9158 |
| t-statistic | 7.68 | 3.34 | 14.00 |
| −0.0398 | 0.0284 | −0.0616 | |
| t-statistic | −0.93 | 0.34 | −2.28 |
| t-statistic (D ≠ 1) | −1.13 | −0.82 | −1.29 |
| N | 456 | 70 | 386 |
| Full Sample | HI-System | FT-System | |
|---|---|---|---|
| 2002–2019 | 2002–2008 | 2009–2019 | |
| Panel A: Closing prices—bid | |||
| D | 0.9392 | 0.8744 | 0.9770 |
| t-statistic | 9.97 | 4.29 | 18.01 |
| −0.0689 | 0.0103 | −0.0898 | |
| t-statistic | −1.75 | 0.12 | −3.31 |
| t-statistic (D ≠ 1) | −0.64 | −0.62 | −0.42 |
| N | 450 | 65 | 385 |
| Panel B: Closing prices—ask | |||
| D | 0.8795 | 0.8237 | 0.9206 |
| t-statistic | 9.01 | 4.10 | 14.73 |
| −0.0425 | −0.0081 | −0.0584 | |
| t-statistic | −1.21 | −0.11 | −2.47 |
| t-statistic (D ≠ 1) | −1.23 | −0.88 | −1.27 |
| N | 447 | 67 | 380 |
References
- Andres, Christian, Andrè Betzer, Inga Van den Bongard, Christian Haesner, and Erik Theissen. 2013. The information content of dividend surprises: Evidence from Germany. Journal of Business Finance & Accounting 40: 620–45. [Google Scholar]
- Baker, Malcolm, and Jeffrey Wurgler. 2004. A catering theory of dividends. Journal of Finance 59: 1125–65. [Google Scholar] [CrossRef]
- Bali, Rakesh, and Gailen L. Hite. 1998. Ex dividend day stock price behavior: Discreteness or tax-induced clienteles? Journal of Financial Economics 47: 127–59. [Google Scholar] [CrossRef]
- Bartholdy, Jan, Dennis Olson, and Paula Peare. 2007. Conducting event studies on a small stock exchange. European Journal of Finance 13: 227–52. [Google Scholar] [CrossRef]
- Boyd, John H., and Ravi Jagannathan. 1994. Ex-dividend price behavior of common stocks. Review of Financial Studies 7: 711–41. [Google Scholar] [CrossRef]
- Buettner, Thiess, Carolin Holzmann, Felix Kreidl, and Hendrik Scholz. 2020. Withholding-tax non-compliance: The case of cum-ex stock-market transactions. International Tax and Public Finance, 1–28. [Google Scholar]
- Dimson, Elroy. 1979. Risk measurement when shares are subject to infrequent trading. Journal of Financial Economics 7: 197–226. [Google Scholar] [CrossRef]
- Dubofsky, David A. 1992. A market microstructure explanation of ex-day abnormal returns. Financial Management 21: 32–43. [Google Scholar] [CrossRef]
- Eades, Kenneth M., Patrick J. Hess, and E. Han Kim. 1984. On interpreting security returns during the ex-dividend period. Journal of Financial Economics 13: 3–34. [Google Scholar] [CrossRef]
- Elton, Edwin J., and Martin J. Gruber. 1970. Marginal stockholder tax rates and the clientele effect. Review of Economics and Statistics 52: 68–74. [Google Scholar] [CrossRef]
- Elton, Edwin J., Martin J. Gruber, and Christopher R. Blake. 2005. Marginal stockholder tax effects and ex-dividend-day price behavior: Evidence from taxable versus nontaxable closed-end funds. Review of Economics and Statistics 87: 579–86. [Google Scholar] [CrossRef]
- Elton, Edwin J., Martin J. Gruber, and Joel Rentzler. 1984. The ex-dividend day behavior of stock prices; A re-examination of the clientele effect: A comment. Journal of Finance 39: 551–56. [Google Scholar] [CrossRef]
- Frank, Murray, and Ravi Jagannathan. 1998. Why do stock prices drop by less than the value of the dividend? Evidence from a country without taxes. Journal of Financial Economics 47: 161–88. [Google Scholar] [CrossRef]
- Gomber, Peter, Marco Lutat, Axel Pierron, and Moritz C. Weber. 2011. Shedding light on the dark: OTC equities trading in Europe. Journal of Trading 6: 74–86. [Google Scholar] [CrossRef]
- Gomber, Peter, Satchit Sagade, Erik Theissen, Moritz C. Weber, and Christian Westheide. 2016. Spoilt for Choice: Order Routing Decisions in Fragmented Equity Markets. SAFE working paper No. 143. Frankfurt: Goethe Universität Frankfurt am Main. [Google Scholar]
- Gomber, Peter. 2016. The German Equity Trading Landscape. SAFE Working Paper No. 43. Frankfurt: Goethe Universität Frankfurt am Main. [Google Scholar]
- Haesner, Christian, and Deborah Schanz. 2013. Payout policy tax clienteles, ex-dividend day stock prices and trading behavior in Germany: The case of the 2001 tax reform. Journal of Business Finance & Accounting 40: 527–63. [Google Scholar]
- Harris, Lawrence E., Samuel M. Hartzmark, and David H. Solomon. 2015. Juicing the dividend yield: Mutual funds and the demand for dividends. Journal of Financial Economics 116: 433–51. [Google Scholar] [CrossRef]
- Hartzmark, Samuel M., and David H. Solomon. 2013. The dividend month premium. Journal of Financial Economics 109: 640–60. [Google Scholar] [CrossRef]
- Hartzmark, Samuel M., and David H. Solomon. 2019. The dividend disconnect. Journal of Finance 74: 2153–99. [Google Scholar] [CrossRef]
- Henry, Tyler R., and Jennifer L. Koski. 2017. Ex-dividend profitability and institutional trading skill. Journal of Finance 72: 461–94. [Google Scholar] [CrossRef]
- Kalay, Avner. 1982. The ex-dividend day behavior of stock prices: A re-examination of the clientele effect. Journal of Finance 37: 1059–70. [Google Scholar] [CrossRef]
- Kalay, Avner. 1984. The ex-dividend day behavior of stock prices; A re-examination of the clientele effect: A reply. Journal of Finance 39: 557–61. [Google Scholar] [CrossRef]
- Kolari, James W., and Seppo Pynnönen. 2010. Event study testing with cross-sectional correlation of abnormal returns. Review of Financial Studies 23: 3996–4025. [Google Scholar] [CrossRef]
- Kreidl, Felix, and Hendrik Scholz. 2020. Exploiting the Dividend Month Premium: Evidence from Germany. Working Paper. Nürnberg: Friedrich-Alexander-Universität Erlangen-Nürnberg. [Google Scholar]
- Lakonishok, Josef, and Theo Vermaelen. 1986. Tax-induced trading around ex-dividend days. Journal of Financial Economics 16: 287–319. [Google Scholar] [CrossRef]
- Lasfer, Meziane. 2008. Taxes and ex-day returns: Evidence from Germany and the U.K. National Tax Journal 61: 721–42. [Google Scholar] [CrossRef][Green Version]
- MacKinlay, A. Craig. 1997. Event studies in economics and finance. Journal of Economic Literature 35: 13–39. [Google Scholar]
- McDonald, Robert L. 2001. Cross-border investing with tax arbitrage: The case of German dividend tax credits. Review of Financial Studies 14: 617–57. [Google Scholar] [CrossRef]
- Michaely, Roni, and Jean-Luc Vila. 1995. Investors’ heterogeneity, prices, and volume around the ex-dividend day. Journal of Financial and Quantitative Analysis 30: 171–98. [Google Scholar] [CrossRef]
- Michaely, Roni, and Jean-Luc Vila. 1996. Trading volume with private valuation: Evidence from the ex-dividend day. Review of Financial Studies 9: 471–509. [Google Scholar] [CrossRef]
- Newey, Whitney K., and Kenneth D. West. 1987. A simple, positive semi-definite, heteroskedasticity and autocorrelation consistent covariance matrix. Econometrica 55: 703–8. [Google Scholar] [CrossRef]
- PNHR Dr. Pelka und Sozien GmbH. 2015. Steuerliche Behandlung von Leistungen der Gesellschaft an die Gesellschafter—Gewinnausschüttung oder Einlagenrückgewähr? (Fallstricke des Steuerlichen Einlagekontos gem. § 27 KStG). Available online: https://www.pnhr.de/aktuelle-themen-specials/steuerliche-behandlung-von-leistungen-der-gesellschaft-an-die-gesellschafter-gewinnausschuettung-oder-einlagenrueckgewaehr (accessed on 1 February 2017).
- Spengel, Christoph. 2016. Sachverständigengutachten Nach § 28 PUAG für den 4. Untersuchungsausschuss der 18. Wahlperiode. Available online: https://www.bundestag.de/blob/438666/15d27facf097da2d56213e8a09e27008/sv2_spengel-data.pdf (accessed on 2 August 2018).
| 1 | The withholding tax burden of 26.375% consists of a 25% dividend tax plus 5.5% solidarity surcharge. |
| 2 | The gross dividend is the distribution to the shareholders after corporate taxes. |
| 3 | |
| 4 | See, among others, Lakonishok and Vermaelen (1986) and Michaely and Vila (1996) showing a significantly negative relationship between transaction costs and trading volume around ex-dates. |
| 5 | Michaely and Vila (1996) document that both market risk and idiosyncratic risk reduce trading volume. |
| 6 | See Buettner et al. (2020) for a detailed discussion. In Germany, cum-ex trades were possible in the years from 1999 to 2011 (Spengel 2016). |
| 7 | Investors may benefit from a tax deferral. However, this advantage is negligible and will not be considered in the following. |
| 8 | Elton and Gruber (1970) derive Equation (1) in an equilibrium model, where risk-neutral investors, with no restriction on short sales, are indifferent between selling or buying the stock before the ex-date or after the stock is traded ex-dividend if the after-tax wealth is identical. |
| 9 | See, for instance, “XETRA Release 15.0—Marktmodell Aktien” or previous releases. |
| 10 | See “https://eur-lex.europa.eu/legalcontent/EN/TXT/PDF/?uri=CELEX:32004L0039&qid=1575473833940&from=EN” for a detailed definition. |
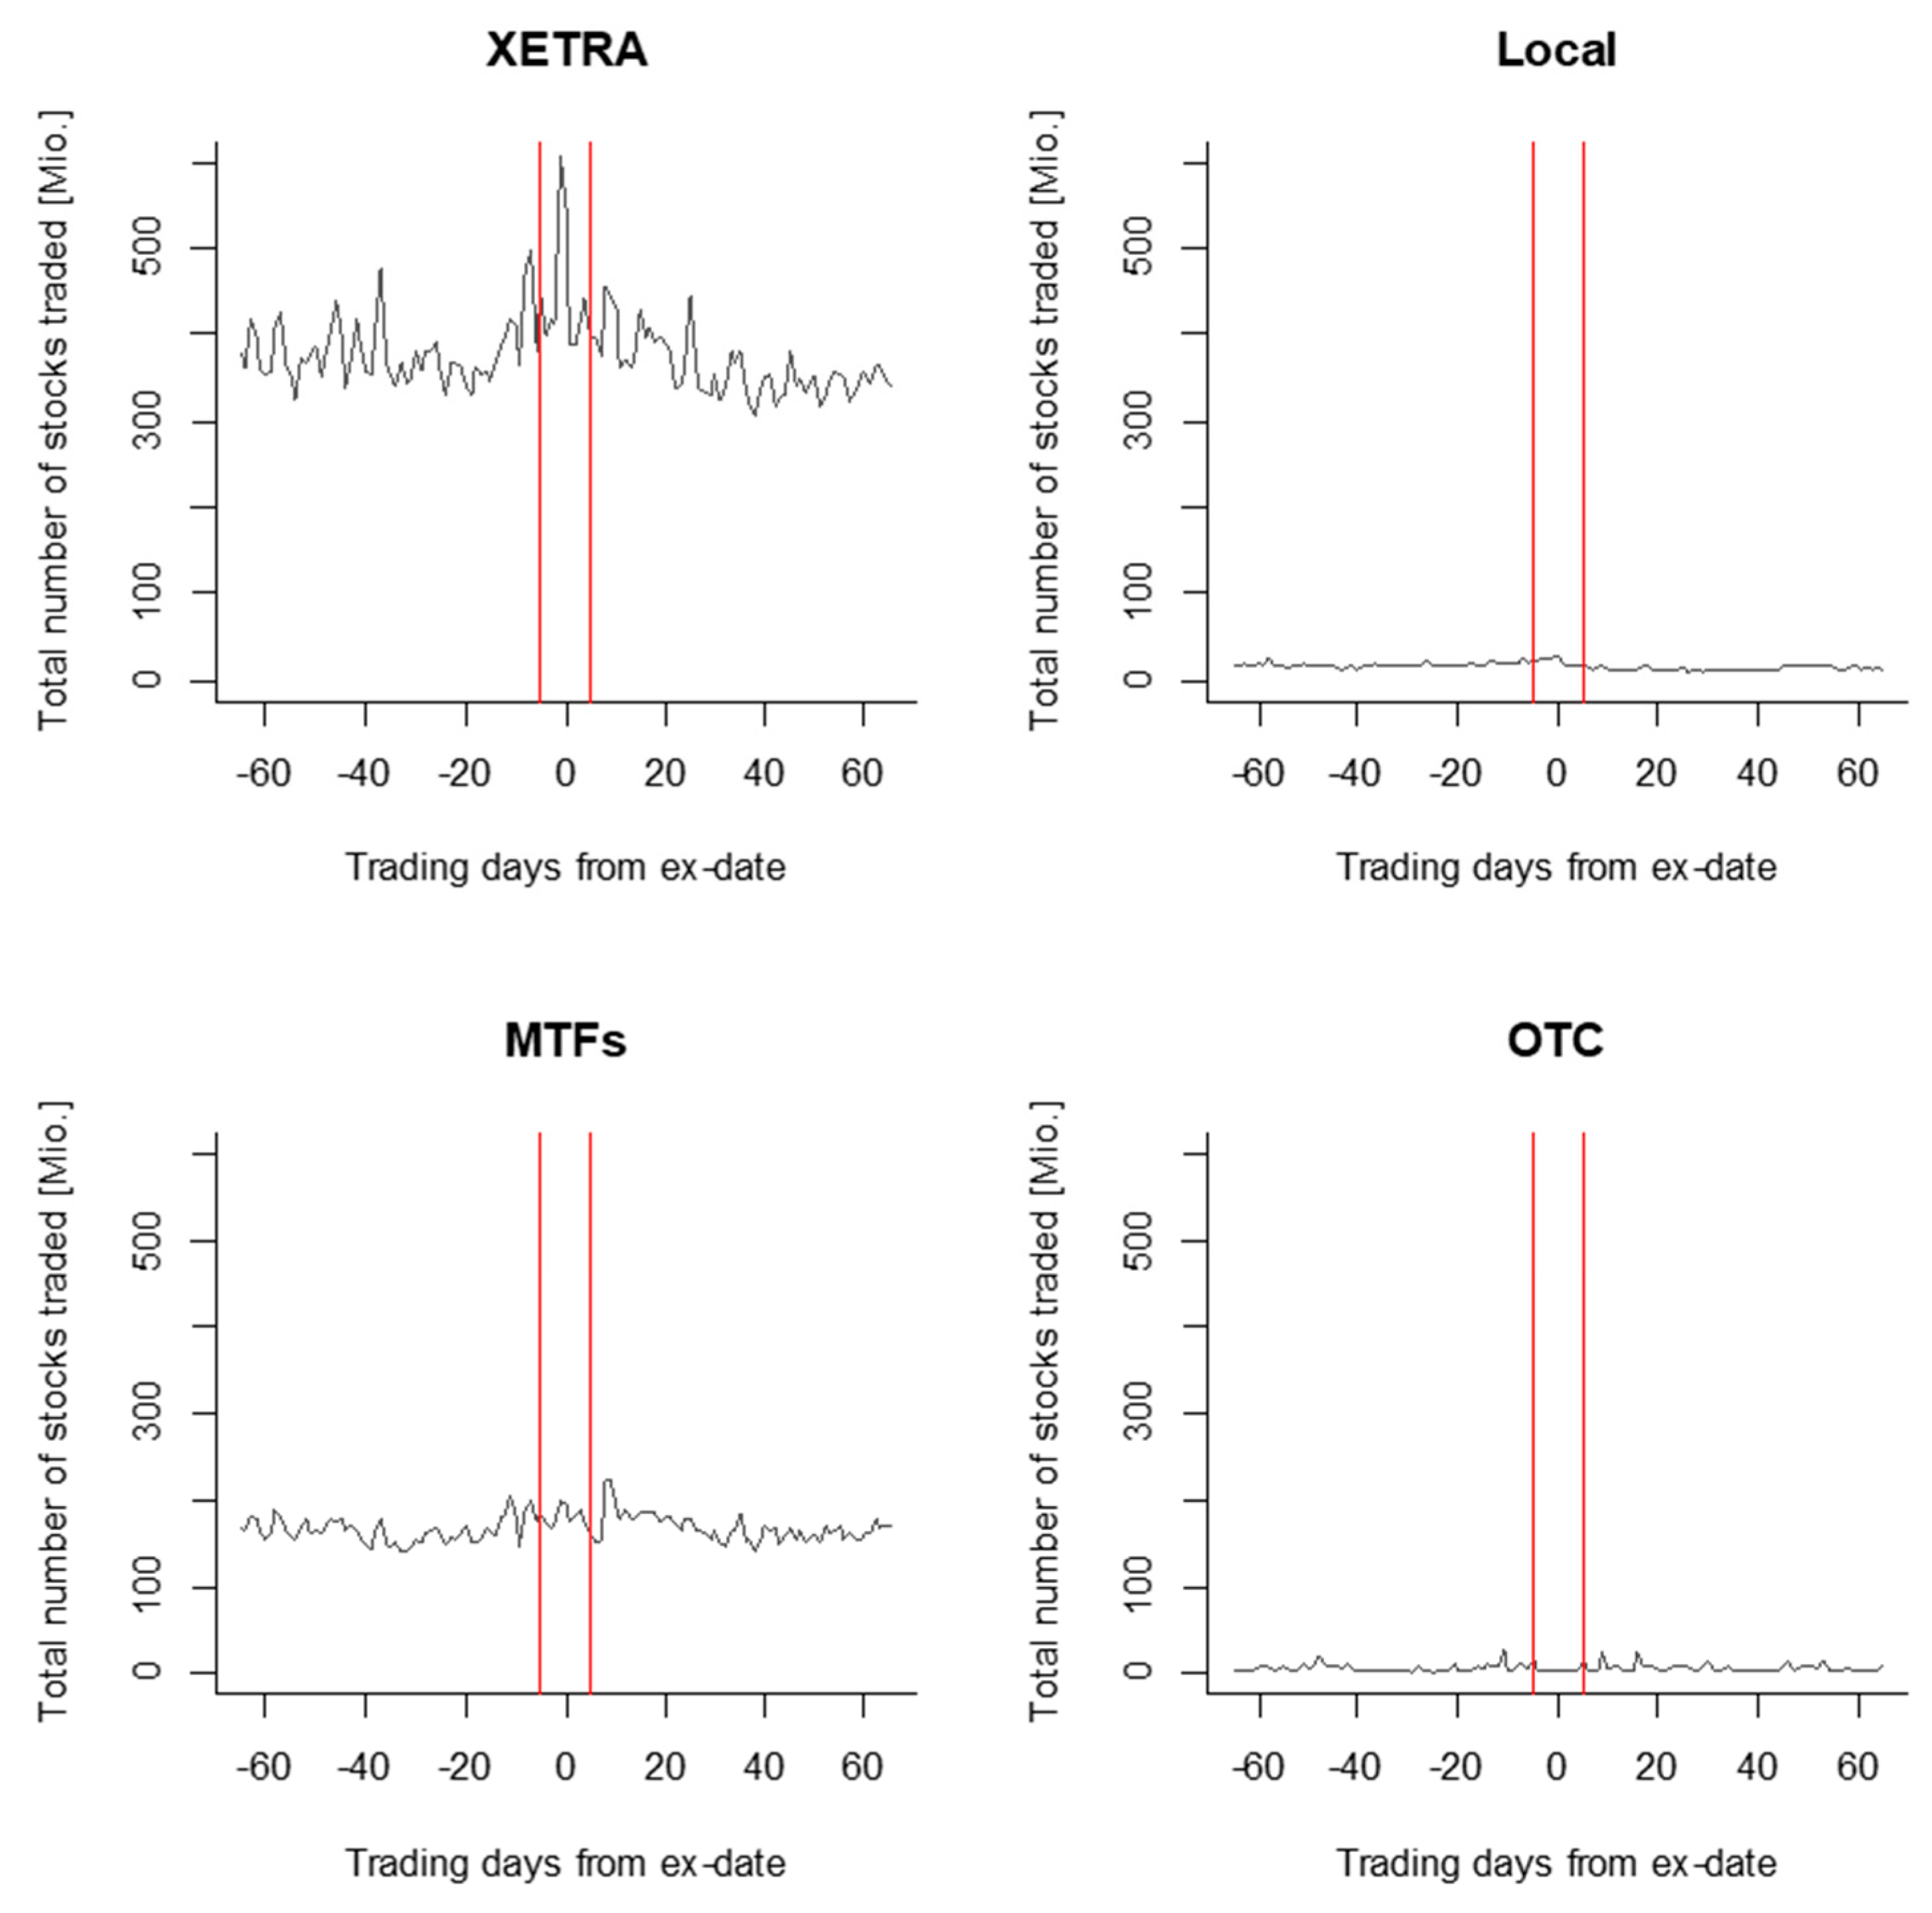
| 11 | BATS and CHI-X merged in November 2011. In the following analysis, we aggregate the number of stocks traded over all MTFs in the sample. |
| 12 | There is no data available for number of stocks traded OTC in Stuttgart and XETRA prior to 2014 and after 2018. |
| 13 | We apply the methodology of trimming as winsorizing would bias the price analysis on ex-dates. |
| 14 | For event i, we adjust the stock’s closing cum price by the respective expected return. See Equations (3) and (4) for the methodology. |
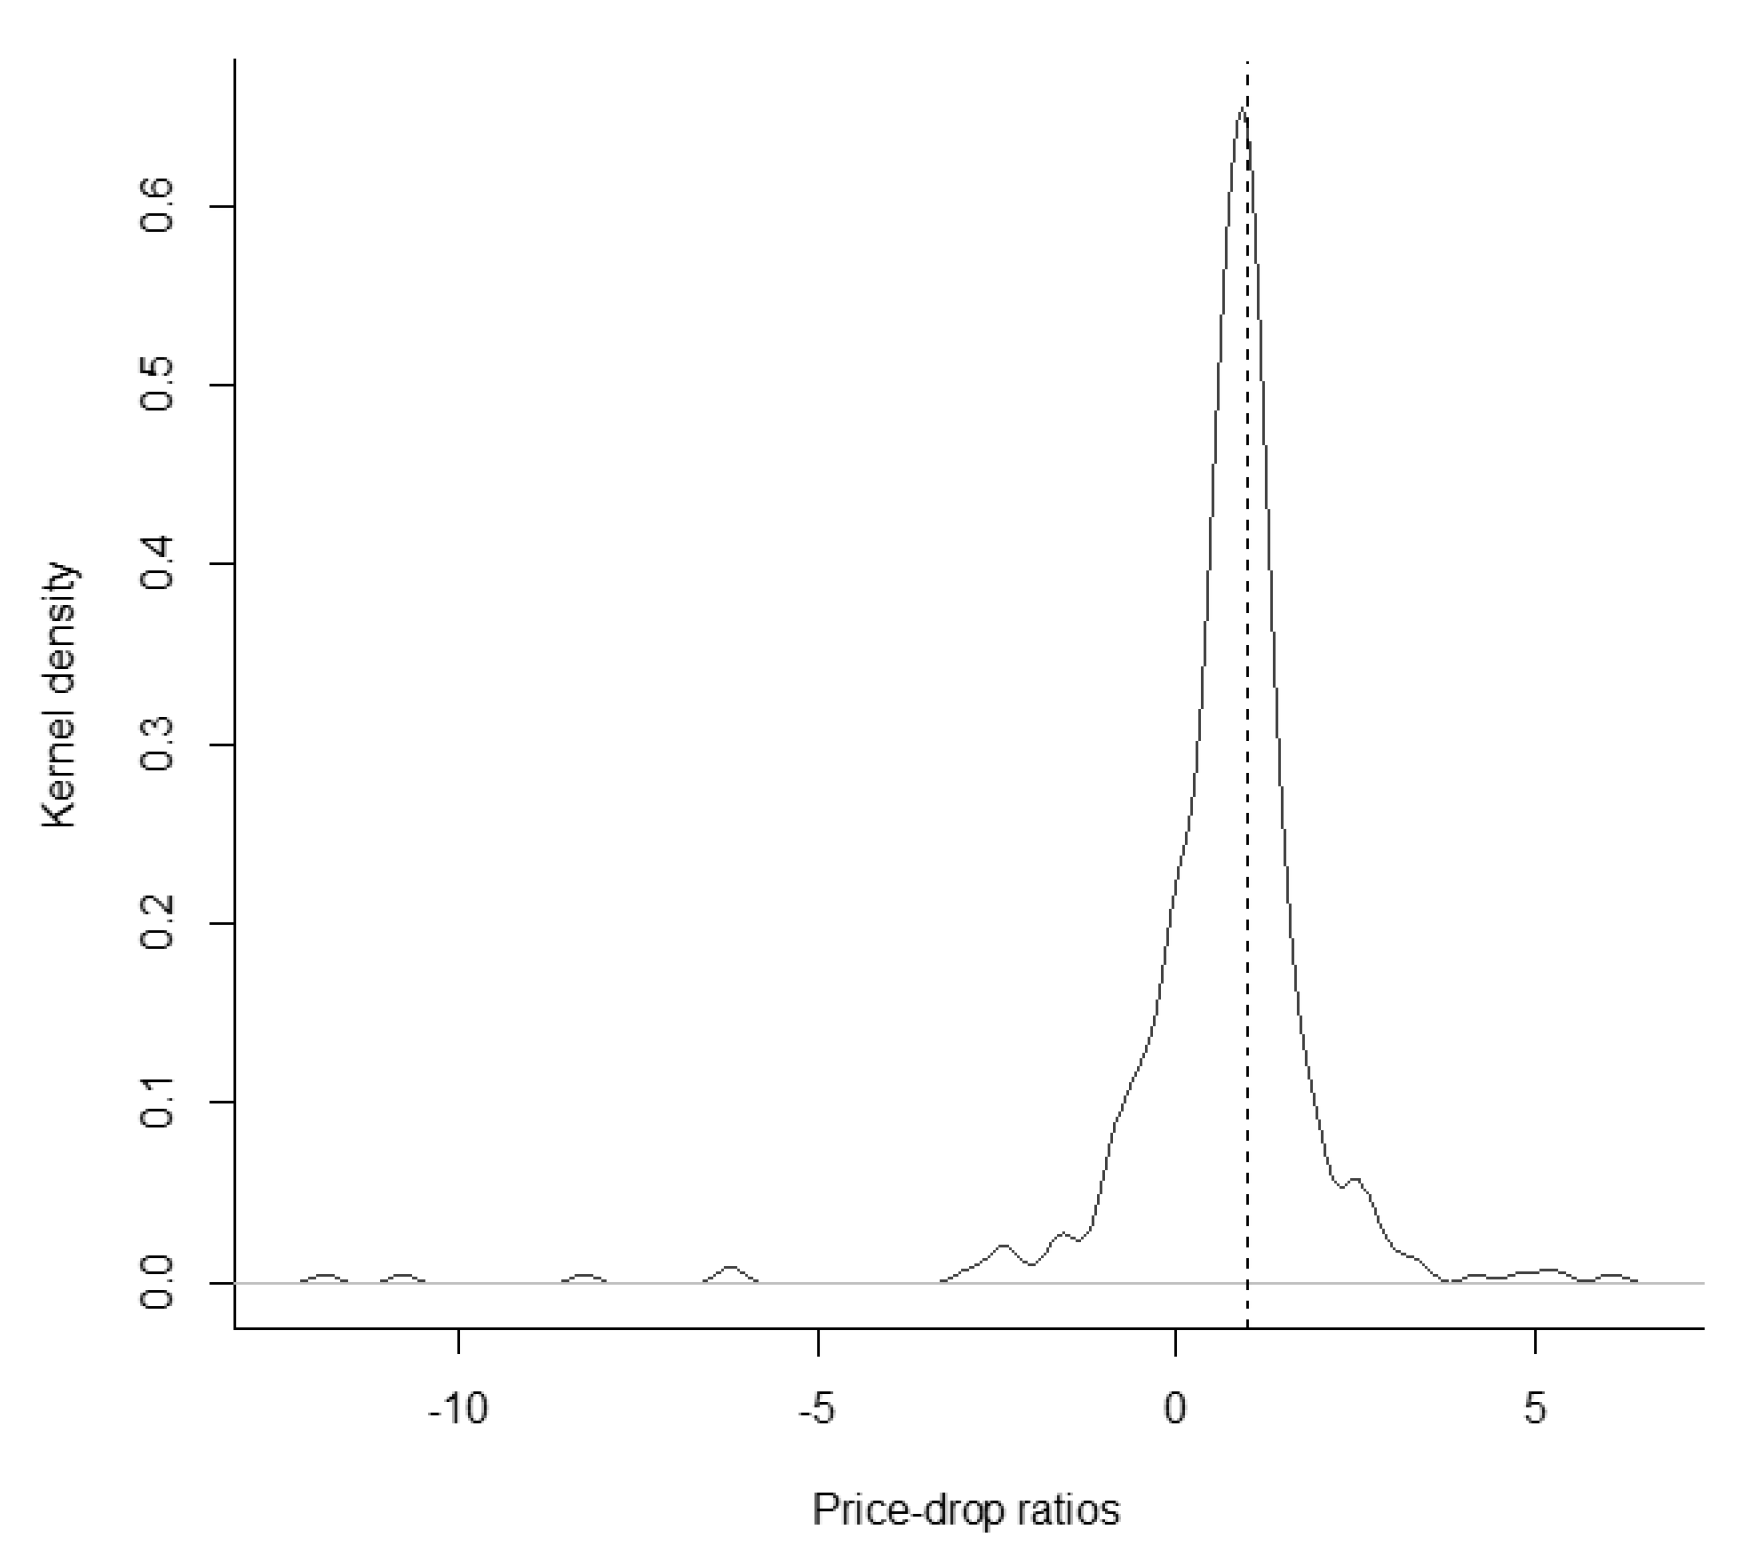
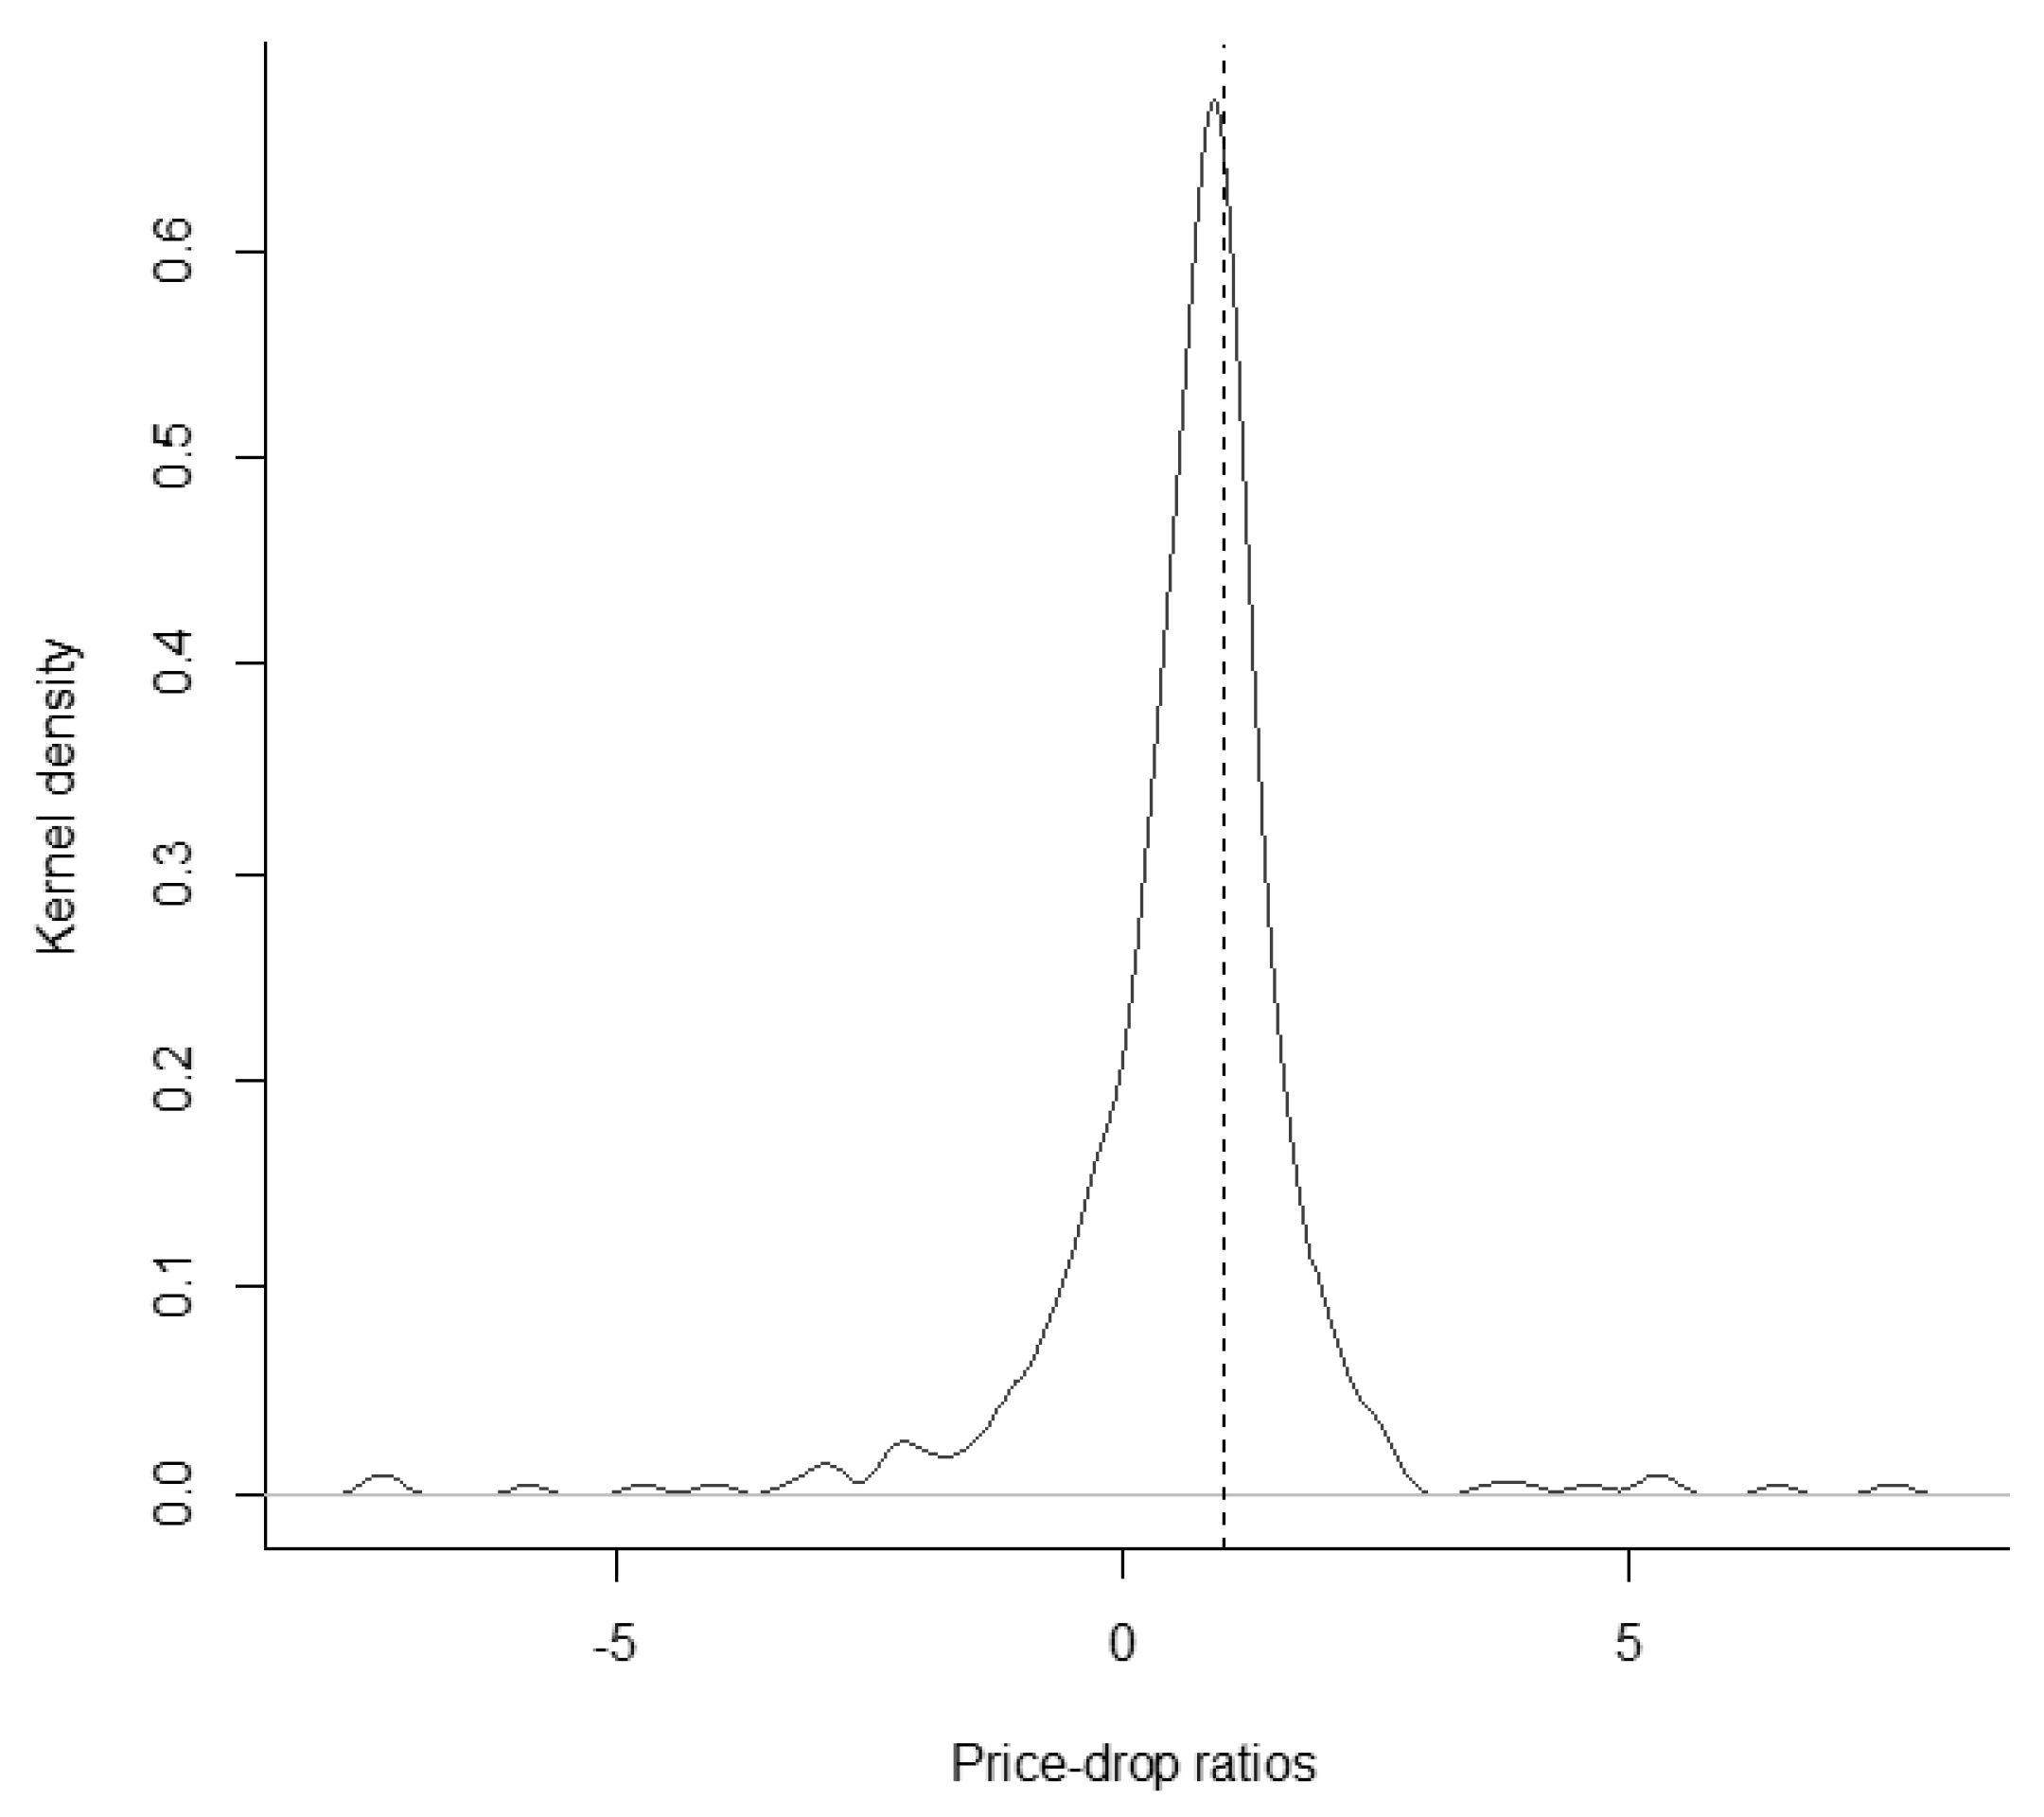
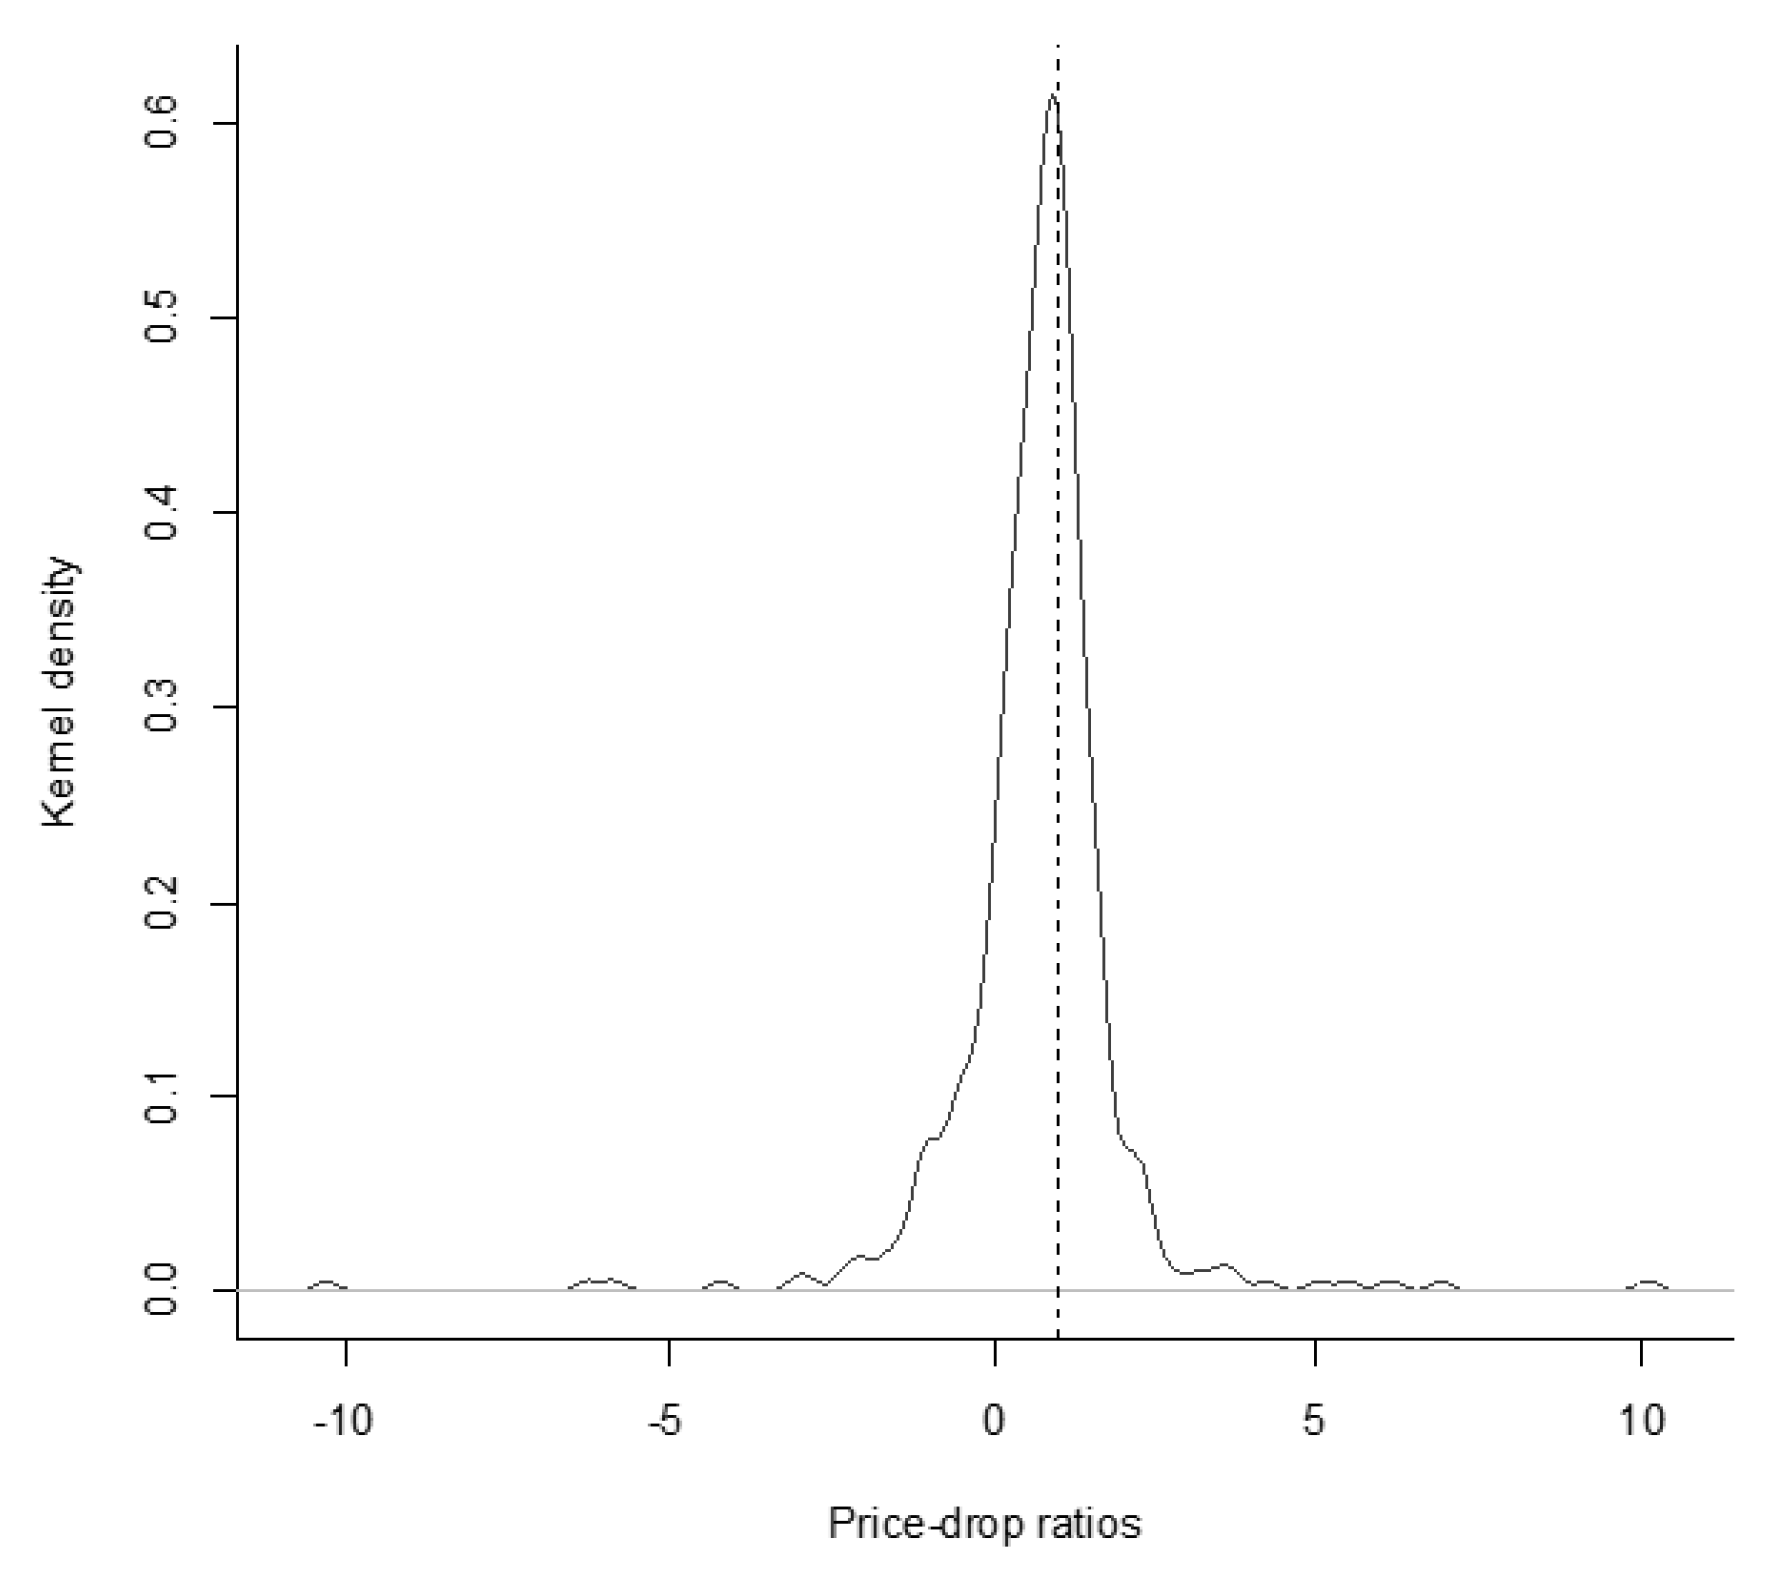
| 15 | Panel A of Table A2 in Appendix A provides the results for bid prices and Panel B shows the results for ask prices. All point estimates for D are larger compared to the results in Table 2. Especially the results for the bid prices in Panel A are clearly closer to one. The PDRs estimated on the basis of bid or ask prices are also not significantly different from one. Hence, the results are as expected and the PDRs are not statistically different from our results in Table 2. The Figure A1 and Figure A2 in Appendix A provide kernel-density estimates of the PDR distribution based on bid or ask prices. |
| 16 | A Hausman test (p-value of 0.3728) cannot reject the null, thus the random-effects estimator is consistent and efficient. |
| 17 | Results available for t-statistics following a Student’s t-distribution are upon request. |
| 18 | Results available are upon request. |
| 19 | Hausman tests cannot reject the null, thus the random-effects estimators are consistent and efficient. The respective p-values are 0.399 (XETRA), 0.854 (Local) and 0.189 (MTFs). |
| 20 | An additional price analysis would provide further insights. To our best knowledge, there is no information available for daily MTF closing prices of German stocks with tax-free dividend. |
| 21 | We do not suppose a significant shift to OTC trading, as reasoned by Gomber et al. (2016), because we do not expect systematic large-in-scale trades around ex-dates for our sample. |
| Tax-Free Dividend Stocks in CDAX | ||||
| Years | 18 | |||
| Constituents | 128 | |||
| Ex-dates | 456 | |||
| Min. | Mean | Median | Max. | |
| Dividend per stock (EUR) | 0.03 | 0.46 | 0.25 | 6.00 |
| Dividend yield (%) | 0.07 | 1.26 | 0.86 | 10.36 |
| Risk | 0.56 | 1.95 | 1.76 | 8.17 |
| Spread (%) | 0.00 | 1.54 | 1.12 | 11.26 |
| Market Capitalization (Mio. EUR) | 2 | 2,551 | 114 | 55,970 |
| Full Sample | HI-System | FT-System | |
|---|---|---|---|
| 2002–2019 | 2002–2008 | 2009–2019 | |
| D | 0.8698 | 0.7937 | 0.9166 |
| t-statistic | 7.29 | 3.11 | 14.57 |
| −0.0380 | 0.0469 | −0.0630 | |
| t-statistic | −0.86 | 0.52 | −2.39 |
| t-statistic (D ≠ 1) | −1.09 | −0.81 | −1.33 |
| N | 456 | 70 | 386 |
| Low DY | Medium DY | High DY | |
|---|---|---|---|
| 2002–2019 | 2002–2019 | 2002–2019 | |
| D | 0.9854 | 1.0409 | 0.9678 |
| t-statistic | 6.99 | 28.28 | 3.65 |
| −0.1660 | −0.0988 | −0.0217 | |
| t-statistic | −1.25 | −3.55 | −0.65 |
| t-statistic (D ≠ 1) | −0.10 | 1.11 | −0.12 |
| Full Sample 2002–2019 | ||
|---|---|---|
| (1) | (2) | |
| 0.6008 | 0.9304 | |
| t-statistic | 2.05 | 2.73 |
| DY | −2.8005 | −4.675 |
| t-statistic | −0.48 | −0.72 |
| Risk | −0.0459 | −0.0381 |
| t-statistic | −0.46 | −0.36 |
| Spread | 2.8976 | 3.1018 |
| t-statistic | 0.63 | 0.71 |
| Cap | 0.0318 | −0.0293 |
| t-statistic | 1.03 | −0.78 |
| N | 436 | 436 |
| Adj. R2 | 0.005 | 0.014 |
| Full Sample 2002–2019 | HI-System 2002–2008 | FT-System 2009–2019 | ||||
|---|---|---|---|---|---|---|
| AARt | t-Statistic | AARt | t-Statistic | AARt | t-Statistic | |
| t − 5 | 0.0012 | 0.84 | 0.0033 | 0.88 | 0.0008 | 0.56 |
| t − 4 | −0.0004 | −0.30 | −0.0041 | −0.07 | 0.0003 | 0.36 |
| t − 3 | −0.0011 | −1.28 | 0.0016 | 0.41 | −0.0016 | −1.61 |
| t − 2 | 0.0012 | 0.94 | −0.0037 | −0.97 | 0.0021 | 1.45 |
| t − 1 | −0.0007 | −0.18 | 0.0068 | 1.93 | −0.0020 | −1.02 |
| t0 | 0.0064 | 5.02 | 0.0013 | 0.88 | 0.0073 | 5.22 |
| t + 1 | −0.0049 | −3.37 | −0.0102 | −2.44 | −0.0040 | −2.73 |
| t + 2 | −0.0050 | −2.61 | −0.0020 | −0.66 | −0.0055 | −2.62 |
| t + 3 | 0.0005 | 0.06 | 0.0030 | 0.79 | 0.0001 | −0.40 |
| t + 4 | −0.0022 | −1.49 | −0.0015 | −0.24 | −0.0023 | −1.56 |
| t + 5 | −0.0030 | −1.71 | −0.0015 | −0.17 | −0.0033 | −1.83 |
| N | 456 | 70 | 386 | |||
| XETRA 2002–2019 | Local 2002–2019 | MTFs 2008–2019 | OTC 2014–2018 | |||||
|---|---|---|---|---|---|---|---|---|
| AAVt | t-Statistic | AAVt | t-Statistic | AAVt | t-Statistic | AAVt | t-Statistic | |
| t − 5 | 0.1303 | 0.40 | 0.2317 | 0.43 | 0.0851 | 2.33 | 1.0553 | −0.28 |
| t − 4 | 0.0768 | 1.08 | 0.3127 | 0.96 | 0.0321 | 0.86 | −0.2499 | −1.95 |
| t − 3 | 0.2160 | 1.20 | 0.5525 | 1.59 | 0.0729 | 0.69 | 0.1594 | −0.56 |
| t − 2 | 0.3285 | 1.51 | 0.6388 | 1.69 | 0.1305 | 2.84 | −0.1013 | −6.70 |
| t − 1 | 0.4040 | 3.24 | 0.5421 | 1.92 | 0.1796 | 6.89 | −0.1435 | −7.82 |
| t0 | 0.3490 | 2.45 | 0.5860 | 1.93 | 0.1968 | 5.94 | −0.0408 | −10.05 |
| t + 1 | 0.1214 | 0.92 | 0.1908 | 0.56 | −0.0222 | −0.09 | 5.6195 | 2.51 |
| t + 2 | 0.1126 | 0.96 | 0.0896 | 0.69 | 0.0725 | 2.24 | 0.2667 | 0.84 |
| t + 3 | −0.0468 | 0.31 | 0.0043 | 0.13 | 0.0571 | 4.14 | 0.1491 | 0.28 |
| t + 4 | −0.0244 | 0.13 | −0.0711 | 0.06 | 0.0005 | 0.95 | −0.2765 | −1.68 |
| t + 5 | 0.0119 | 0.08 | 0.0098 | −0.02 | 0.0041 | 0.43 | 1.1061 | 2.51 |
| ACAV | 1.6684 | 3.71 | 2.9314 | 2.99 | 0.3556 | 8.21 | 1.1642 | 9.09 |
| XETRA | Local | MTFs | ||||
|---|---|---|---|---|---|---|
| (1) | (2) | (1) | (2) | (1) | (2) | |
| 5.3155 | 4.9868 | 3.5429 | 3.3132 | 0.0256 | −0.6745 | |
| t-statistic | 2.88 | 2.14 | 1.94 | 1.68 | 0.02 | −0.48 |
| DY | −12.1346 | −28.3522 | 7.7671 | 1.4437 | 39.9210 | 57.0001 |
| t-statistic | −0.37 | −1.02 | 0.23 | 0.04 | 1.66 | 2.19 |
| Risk | −0.5944 | −0.4877 | −0.7187 | −0.6094 | −0.6269 | −0.5403 |
| t-statistic | −1.12 | −0.81 | −1.50 | −1.47 | −1.67 | −1.27 |
| Spread | −31.2998 | −22.7293 | - | - | - | - |
| t-statistic | −1.38 | −1.35 | - | - | - | - |
| Cap | −0.3321 | −0.3334 | 0.1313 | 0.0960 | 0.2001 | 0.2740 |
| t-statistic | −1.84 | −1.53 | 0.58 | −0.38 | 1.68 | 1.85 |
| N | 436 | 436 | 436 | 436 | 246 | 246 |
| Adj. R2 | 0.012 | 0.007 | 0.004 | 0.000 | 0.004 | 0.000 |
© 2020 by the author. Licensee MDPI, Basel, Switzerland. This article is an open access article distributed under the terms and conditions of the Creative Commons Attribution (CC BY) license (http://creativecommons.org/licenses/by/4.0/).
Share and Cite
Kreidl, F. Stock-Market Behavior on Ex-Dates: New Insights from German Stocks with Tax-Free Dividend. Int. J. Financial Stud. 2020, 8, 58. https://doi.org/10.3390/ijfs8030058
Kreidl F. Stock-Market Behavior on Ex-Dates: New Insights from German Stocks with Tax-Free Dividend. International Journal of Financial Studies. 2020; 8(3):58. https://doi.org/10.3390/ijfs8030058
Chicago/Turabian StyleKreidl, Felix. 2020. "Stock-Market Behavior on Ex-Dates: New Insights from German Stocks with Tax-Free Dividend" International Journal of Financial Studies 8, no. 3: 58. https://doi.org/10.3390/ijfs8030058
APA StyleKreidl, F. (2020). Stock-Market Behavior on Ex-Dates: New Insights from German Stocks with Tax-Free Dividend. International Journal of Financial Studies, 8(3), 58. https://doi.org/10.3390/ijfs8030058


