Impact of CSR-Relevant News on Stock Prices of Companies Listed in the Austrian Traded Index (ATX)

Abstract
:1. Introduction
2. Literature Review
2.1. CSR Impact on Firm Value
2.2. Event Studies on CSR-Relevant News
2.3. Environment
2.4. Society
2.5. Governance
2.6. Hypotheses
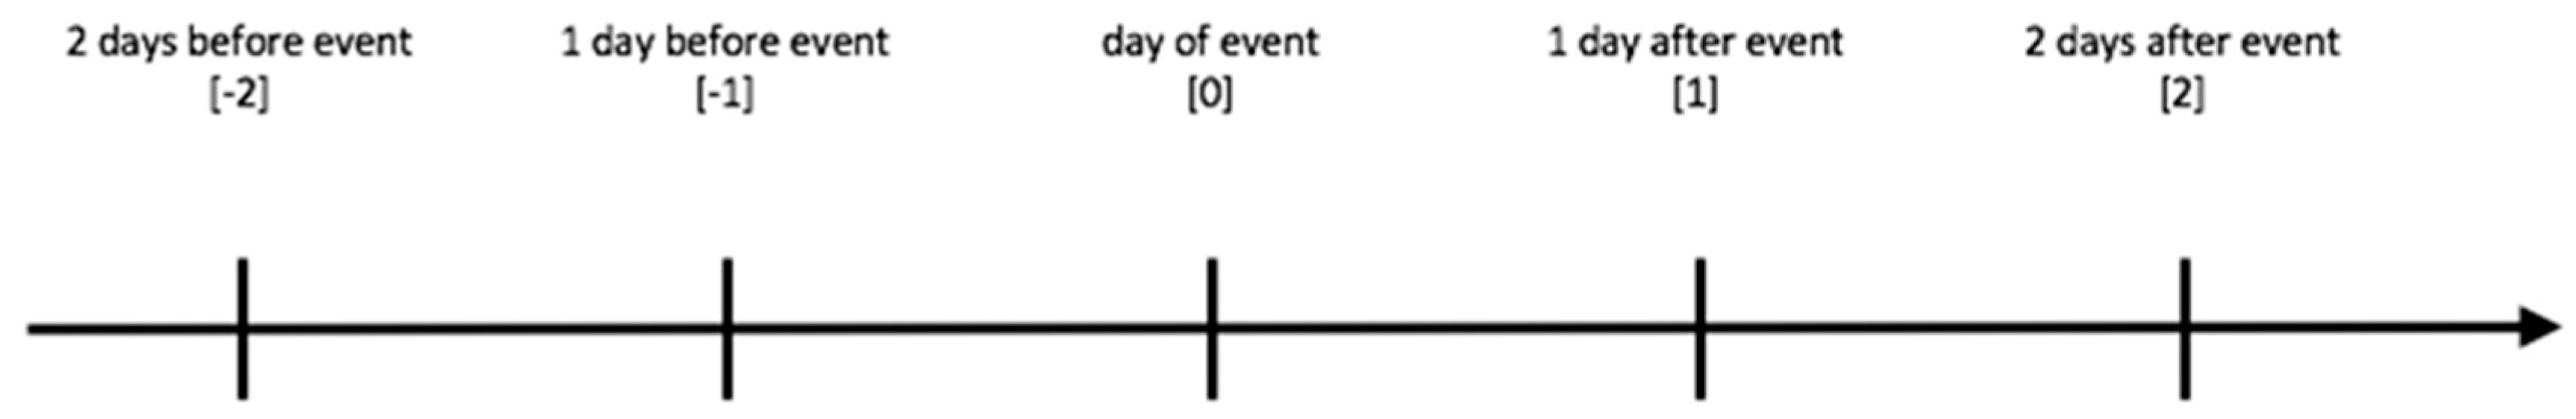
3. Methodology
- Abnormal return AR
- Cumulated abnormal return CAR
- Average abnormal return AAR
- Cumulated average abnormal return CAAR
4. Empirical Analysis
4.1. Sample and Data
- Andritz AG
- AT & S Austria
- BAWAG Group AG
- CA Immobilien Anlagen AG
- Erste Group Bank AG
- FACC AG
- Immofinanz AG
- Lenzing AG
- Österreichische Post AG
- OMV AG
- PORR AG
- Raiffeisen Bank International AG
- S IMMO AG
- Schoeller-Bleckmann Oilfield Equipment AG
- Telekom Austria AG
- Uniqa Insurance Group AG
- Verbund AG
- Vienna Insurance Group AG
- Voestalpine AG
- Wienerberger AG
- AT & S Austria
- CA Immobilien Anlagen AG
- Erste Group Bank AG
- Schoeller-Bleckmann Oilfield Equipment AG
- Uniqa Insurance Group AG
4.2. Empirical Results
4.2.1. Environment—Positive
4.2.2. Environment—Negative
4.2.3. Society—Positive
4.2.4. Society—Negative
4.2.5. Governance—Positive
4.2.6. Governance—Negative
4.3. Robustness Check
5. Discussion of the Results
5.1. Summary
5.2. Critical Acclaim
5.3. Implications
6. Conclusions
Author Contributions
Funding
Acknowledgments
Conflicts of Interest
Appendix A

| Date | Reason | |
|---|---|---|
| 1 | 31 May 2018 | Corpus Christi |
| 2 | 21 May 2018 | Whit Monday |
| 3 | 10 May 2018 | Ascension of Christ |
| 4 | 8 December 2017 | Mary’s conception |
| 5 | 1 November 2017 | All Saints’ Day |
| 6 | 26 October 2017 | National holiday |
| 7 | 15 June 2017 | Corpus Christi |
| 8 | 25 May 2017 | Ascension of Christ |
| 9 | 2 January 2017 | No data on finance.yahoo.com |
| 10 | 16 January 2015 | No data on finance.yahoo.com |
| 11 | 24 December 2014 | Christmas eve |
| t0 Report | Reason | t0 Used | |
|---|---|---|---|
| 1 | 14 July 2018 | Sunday | 16 July 2018 |
| 2 | 9 April 2018 | No data on finance.yahoo.com | 10 April 2018 |
| 3 | 11 February 2018 | Sunday | 12 February 2018 |
| 4 | 19 August 2017 | Saturday | 21 August 2017 |
| 5 | 25 May 2017 | Ascension of Christ | 26 May 2017 |
| t0 Report | Time of Announcement | t0 Used | |
|---|---|---|---|
| 1 | 20 April 2018 | 19:07 h | 23 April 2018 |
| 2 | 9 October 2017 | 17:51 h | 10 October 2017 |
| 3 | 12 September 2017 | 18:52 h | 13 September 2017 |
| 4 | 19 April 2017 | 18:13 h | 20 April 2017 |
| 5 | 19 January 2016 | 23:13 h | 20 January 2016 |
| 6 | 26 November 2015 | 18:01 h | 27 January 2015 |
| Category | Tendency of Reports | Hypotheses Established | AAR | CAAR |
|---|---|---|---|---|
| Environment | positive | H2: AAR > 0 c H3: CAAR > 0 c | t−1 0.0048 * | 0.0101 ** |
| t1 0.0112 **** | ||||
| negative | H4: AAR < 0 H5: CAAR < 0 | t0 0.0127 *** | 0.0171 | |
| Society | positive | H6: AAR > 0 c H7: CAAR > 0 c | t−2 0.0057 *** | 0.0150 *** |
| t1 0.0064 *** | ||||
| negative | H8: AAR < 0 H9: CAAR < 0 | t−1 0.0250 *** | 0.0093 | |
| Governance | positive | H10: AAR > 0 c H11: CAAR > 0 | t−1 0.0259 *** | 0.0351 |
| negative | H12: AAR < 0 c H13: CAAR < 0 | t0 −0.0075 * | 0.0105 ** | |
| t1 0.0045 ** | ||||
| t2 0.0078 *** |
References
- Arya, Bindu, and Gaiyan Zhang. 2009. Institutional Reforms and Investor Reactions to CSR Announcements. Evidence from an Emerging Economy. Journal of Management Studies 46: 1089–112. [Google Scholar] [CrossRef]
- Babiak, Kathy, and Sylvia Trendafilova. 2011. CSR and Environmental Responsibility. Motives and Pressures to Adopt Green Management Practices. Corporate Social Responsibility and Environmental Management 18: 11–24. [Google Scholar] [CrossRef]
- Barth, Regine, and Franziska Wolff. 2009. Corporate Social Responsibility and sustainability impact: Opening up the arena. In Corporate Social Responsibility in Europe. Rhetoric and Realities. Edited by Regine Barth and Franziska Wolff. Cheltenham: Edward Elgar, pp. 3–25. [Google Scholar]
- Becchetti, Leonardo, Rocco Ciciretti, Iftekhar Hasan, and Nada Kobeissi. 2012. Corporate Social Responsibility and Shareholder’s Value. Journal of Business Research 65: 1628–35. [Google Scholar] [CrossRef]
- Borowy, Iris. 2014. Defining Sustainable Development for Our Common Future. A History of the World Commission on Environment and Development (Brundtland Commission). London: Routledge. [Google Scholar]
- Bowman, Robert. 1983. Understanding and Conducting Event Studies. Journal of Business Finance & Accounting 10: 561–84. [Google Scholar]
- Brejning, Jeanette. 2016. Corporate Social Responsibility and the Welfare State. The Historical and Contemporary Role of CSR in the Mixed Economy of Welfare. London: Routledge. [Google Scholar]
- Cable, John, and Kevin Michael Holland. 1999. Modelling normal returns in event studies: A model-selection approach and pilot study. The European Journal of Finance 5: 331–41. [Google Scholar] [CrossRef]
- Capelle-Blancard, Gunther, and Aurélien Petit. 2017. Every little helps? ESG news and stock market reaction. Journal of Business Ethics 157: 543–65. [Google Scholar] [CrossRef]
- Cellier, Alexis, and Pierre Chollet. 2011. The Impact of Corporate Social Responsibility Rating Announcement on Stock Prices: An Event Study on European Markets. Paper presented at International Conference of the French Finance Association (AFFI), Montpellier, France, May 11–13; pp. 1–33. [Google Scholar]
- Chan, Kalok, Allaudeen Hameed, and Wilson Tong. 2000. Profitability of momentum strategies in the international equity markets. Journal of Financial and Quantitative Analysis 2: 153–72. [Google Scholar] [CrossRef]
- Cheung, Adrian. 2010. Do Stock Investors Value Corporate Sustainability? Evidence from an Event Study. Journal of Business Ethics 2: 145–65. [Google Scholar]
- Dhaliwal, Dan, Oliver Zhen Li, Albert Tsang, and Yong Georg Yang. 2014. Corporate social responsibility disclosure and the cost of equity capital: The roles of stakeholder orientation and financial transparency. Journal of Accounting and Public Policy 33: 328–55. [Google Scholar] [CrossRef]
- Fama, Eugene Francis. 1991. Efficient Capital Markets: II. The Journal of Finance 46: 1575–617. [Google Scholar] [CrossRef]
- Freeman, Robert Edward. 1984. Strategic Management: A Stakeholder Approach. Boston: Pitman. [Google Scholar]
- Godfrey, Paul, Craig Merril, and Jared Hansen. 2009. The relationship between corporate social responsibility and shareholder value. An empirical test of the risk management hypothesis. Strategic Management Journal 30: 425–45. [Google Scholar] [CrossRef]
- Griffin, Paul, and Yuan Sun. 2013. Going green. Market reaction to CSR newswire releases. Journal of Accounting and Public Policy 32: 93–113. [Google Scholar] [CrossRef]
- Hamilton, James. 1995. Pollution as News. Media and Stock Market Reactions to the Toxics Release Inventory Data. Journal of Environmental Economics and Management 28: 98–113. [Google Scholar] [CrossRef]
- Hannon, John, and George Milkovich. 1996. The Effect of Human Resource Reputation Signals on Share Prices. An Event Study. Human Resource Management 3: 405–24. [Google Scholar] [CrossRef]
- Harjoto, Maretno Agus, and Hoje Jo. 2015. Legal vs. normative CSR: Differential impact on analyst dispersion, stock return volatility, cost of capital, and firm value. Journal of Business Ethics 128: 1–20. [Google Scholar] [CrossRef]
- Hermanns, Julia. 2006. Optimale Kapitalstruktur und Market Timing. Empirische Analyse Börsennotierter Deutscher Unternehmen. Wiesbaden: GWV. [Google Scholar]
- ISO. 2010. ISO 26000. Guidance on Social Responsibility. Geneva: ISO. [Google Scholar]
- Jeng, Jau-Lian. 2015. Analyzing Event Statistics in Corporate Finance. Methodologies, Evidences, and Critiques. New York: Palgrave Macmillan. [Google Scholar]
- Jennings, Robert, and Laura Starks. 1985. Information content and the speed of stock price adjustment. Journal of Accounting Research 1: 336–50. [Google Scholar] [CrossRef]
- Jones, Oliver, and Rachel Louise Gomes. 2014. Chemical Pollution of the Aquatic Environment by Priority Pollutants and its Control. In Pollution. Causes, Effects and Control. Edited by R. Harrison. Cambridge: The Royal Society of Chemistry, pp. 1–31. [Google Scholar]
- Jonker, Jan, Wolfgang Stark, and Stefan Tewes. 2011. Corporate Social Responsibility und Nachhaltige Entwicklung. Einführung, Strategie und Glossar. Berlin/Heidelberg: Springer. [Google Scholar]
- Karpoff, Jonathan, John Lott, and Eric Wehrly. 2005. The reputational penalties for environmental violations. Empirical evidence. Journal of Law and Economics 48: 653–75. [Google Scholar] [CrossRef]
- Keinert-Kisin, Christina. 2015. CSR in Austria: Exemplary Social and Environmental Practice or Compliance-Driven Corporate Responsibility? Corporate Social Responsibility in Europe, 137–51. [Google Scholar] [CrossRef]
- Klassen, Robert, and Curtis McLaughlin. 1996. The Impact of Environmental Management on Firm Performance. Management Science 8: 1199–214. [Google Scholar] [CrossRef]
- Kliger, Doron, and Gregory Gurevich. 2014. Event Studies for Financial Research. A Comprehensive Guide. New York: Palgrave Macmillan. [Google Scholar]
- Kothari, S. P., and Jerold Warner. 2008. Econometrics of Event Studies. In Handbook of Corporate Finance. Empirical Corporate Finance. Edited by B. Espen Eckbo. Amsterdam: North Holland, Elsevier, vol. 1, pp. 3–36. [Google Scholar]
- Krüger, Philipp. 2015. Corporate Goodness and Shareholder Wealth. Journal of Financial Economics 115: 304–29. [Google Scholar] [CrossRef]
- Lechler, Jörg. 2003. Investor Marketing aus Sicht eines Emissionshauses. In Investor Marketing. Aktionäre erfolgreich gewinnen. Investoren langfristig binden. Börsenkurse nachhaltig steigern. Edited by Bernhard Ebel and Markus Hofer. Wiesbaden: Gabler, pp. 79–94. [Google Scholar]
- Lee, Jooh, and James Jungbae Roh. 2012. Revisiting corporate reputation and firm performance link. Benchmarking. An International Journal 4: 649–64. [Google Scholar] [CrossRef]
- Mayring, Philipp. 2016. Einführung in die qualitative Sozialforschung. Eine Anleitung zu qualitativem Denken. Weinheim: Beltz. [Google Scholar]
- McWilliams, Abagail, Donald Siegel, and Siew Hong Teoh. 1999. Issues in the Use of the Event Study Methodology. A Critical Analysis of Corporate Social Responsibility Studies. Organizational Research Methods 2: 340–65. [Google Scholar] [CrossRef]
- Mitchell, Mark, and Jeffry Netter. 1994. The Role of Financial Economics in Securities Fraud Cases. Applications at the Securities and Exchange Commission. The Business Lawyer 2: 545–90. [Google Scholar]
- Morris, Gregory. 2014. Investing with the Trend. A Rules-based Approach to Money Management. Hoboken: John Wiley & Sons. [Google Scholar]
- MSCI ESG Research. 2015. MSCI ESG Rating Methodology. Executive Summary. New York: MSCI Inc. [Google Scholar]
- MSCI Inc. 2018. MSCI KLD 400 Social Index (USD). Available online: https://www.msci.com/documents/10199/904492e6-527e-4d64-9904-c710bf1533c6 (accessed on 6 February 2019).
- Mumford, Paul. 2016. The Stock Picker. A Financial History from the Sharp End. Petersfield: Harriman House. [Google Scholar]
- Oikonomou, Ioannis, Aspasia Pastra, and Ilias Visvikis. 2018. A Financial Business Case for Corporate Social Responsibility. In Corporate Social Responsibility in the Maritime Industry. Edited by Lisa Loloma Froholdt. Cham: Springer, pp. 219–36. [Google Scholar]
- Ramchander, Sanjay, Robert Schwebach, and KIM Staking. 2012. The Informational Relevance of Corporate Social Responsibility. Evidence from DS400 Index Reconstitutions. Strategic Management Journal 33: 303–14. [Google Scholar] [CrossRef]
- Schäfer, Frank. 1999. Zulässigkeiten und Grenzen der Kurspflege. WM, 1345–52. [Google Scholar]
- Schiff, Felix, and Stéphanie Mittelbach-Hörmanseder. 2018. Verpflichtende Nachhaltigkeitsberichterstattung. Ein Überblick. RWZ 1: 34–7. [Google Scholar]
- Schmidt, Reinhard. 1982. Rechnungslegung als Informationsproduktion auf nahezu effizienten Kapitalmärkten. Schmalenbach Zeitschrift für betriebswirtschaftliche Forschung 34: 728–48. [Google Scholar]
- Schnell, Rainer, Paul Hill, and Elke Esser. 2013. Methoden der Empirischen Sozialforschung. Munich: Oldenbourg. [Google Scholar]
- Smith, Michael, Karlson James Hargroves, and Cheryl Julia Kiran Desha. 2010. Cents and Sustainability. Securing Our Common Future by Decoupling Economic Growth from Environmental Pressures. London: Routledge. [Google Scholar]
- Vilain, Michael. 2010. Meine Firma, meine Mitarbeiter, meine Heimat. Merkmale unternehmerischen Engagement im deutschen Mittelstand. In Gesellschaftliches Engagement von Unternehmen. Der deutsche Weg im internationalen Kontext. Edited by Sebastian Braun. Wiesbaden: Vs, pp. 106–39. [Google Scholar]
- White, Gwendolen. 2009. Sustainability Reporting. Managing for Wealth and Corporate Health. New York: Business Expert Press. [Google Scholar]
- Wiener Börse. 2018. Zusammensetzung ATX. Available online: https://www.wienerborse.at/indizes/aktuelle-indexwertezusammensetzung/?ID_NOTATION=92866&ISIN=AT0000999982 (accessed on 31 August 2018).
- Wiener Börse. 2019a. Definition ATX. Available online: https://www.wienerborse.at/wissen/boersenlexikon/buchstabe-a/atx/ (accessed on 7 February 2019).
- Wiener Börse. 2019b. Österreichs größter Börsengang: BAWAG Group AG im PRIME market der Wiener Börse gelistet. Available online: https://www.wienerborse.at/news/wiener-boerse-news/news/borsengang-bawag-group/ (accessed on 7 February 2019).
- Zhang, Ying. 2014. Stock Message Boards. A Quantitative Approach to Measuring Investor Sentiment. New York: Palgrave Macmillan. [Google Scholar]
| 1 | |
| 2 | |
| 3 | Initial Public Offering. |


| Study | Time Window | Sample Size | Year and Geography | Research Findings |
|---|---|---|---|---|
| Hamilton (1995) | [−1] [0] [0, 5] | 436 | 1989 USA | negative abnormal return |
| Karpoff et al. (2005) | [−1, 0] | 487 | 1980–2000 USA | negative abnormal return |
| Griffin and Sun (2013) | [−2, 2] | 172 | 2000–2010 USA | positive abnormal return |
| Study | Time Window | Sample Size | Year and Geography | Research Findings |
|---|---|---|---|---|
| Hannon and Milkovich (1996) | [-2, 2] | 290 | 1982–1989 USA | Positive abnormal return |
| Godfrey et al. (2009) | [−1, 0] | 187 | 1993–2003 USA | Negative abnormal return |
| Krüger (2015) | [−5, 5] [−10, 10] | 2116 | 2001–2007 USA | Negative abnormal return |
| Study | Time Window | Sample Size | Year and Geography | Research Findings |
|---|---|---|---|---|
| Arya and Zhang (2009) | [−1, 1] [−5, 5] | 71 | 1996–2005 South Africa | Positive abnormal return |
| Cheung (2010) | [−15, 60] | 177 | 2002–2008 USA | Positive and negative abnormal return |
| Ramchander et al. (2012) | [0, 0] [−3, 3] [−1, 3] | 194 | 1990–2007 USA | Positive and negative abnormal return |
| Cellier and Chollet (2011) | [−5, 5] | 1588 | 2004–2009 Europe | Positive and negative abnormal return |
| Tendency of Announcements | Hypotheses Derived | |
|---|---|---|
| positive | H2, H6, H10: | AAR > 0 |
| H0: | AAR ≤ 0 | |
| H3, H7, H11: | CAAR > 0 | |
| H0: | CAAR ≤ 0 | |
| negative | H4, H8, H12: | AAR < 0 |
| H0: | AAR ≥ 0 | |
| H5, H9, H13: | CAAR < 0 | |
| H0: | CAAR ≥ 0 | |
| Step | Content |
|---|---|
| 1 | Select event |
| 2 | Establish hypotheses |
| 3 | Calculate abnormal returns |
| 4 | Calculate the cumulated abnormal returns |
| 5 | Analyze the results |
| Category | Topics | Key Terms |
|---|---|---|
| Environment | Climate change | Sustainability report |
| Release of carbon | ||
| Natural resources | Use of resources | |
| Environmental destruction | ||
| Environmental protection | ||
| Environmental pollution | Discharge of dangerous substances | |
| Waste management | ||
| Ecological opportunities | Driving the energy transition | |
| Use of ecological opportunities | ||
| Building environmentally friendly infrastructure | ||
| Society | Human capital | Innovation |
| Increase human capital | ||
| Labor force | Appreciation of the employees | |
| Establishing jobs | ||
| Product liability | Responsible investment | |
| Social opportunities | Charitable activities | |
| Building infrastructure for society | ||
| Development of society | ||
| Governance | Corporate management | Rating based on ESG |
| Fulfillment of laws | ||
| Company’s behavior | Business ethics | |
| Quality of relationships with stakeholders | ||
| Strengthening trust/peace | ||
| Charges/arguments/convictions | ||
| Corruption |
| Category | Positive | Negative |
|---|---|---|
| Environment | 33 | 6 |
| Society | 44 | 6 |
| Governance | 8 | 32 |
| Total | 85 | 44 |
| Category | Tendency of Report | Company | Headline of Report |
|---|---|---|---|
| Environment | positive | Lenzing AG | 100 million Euro for sustainability * |
| negative | OMV AG | Greenpeace protests in front of OMV headquarters against Arctic drilling * | |
| Society | positive | Voestalpine AG | Voestalpine supports hurricane sufferers in Texas with 350,000 USD in emergency funding * |
| negative | Wienerberger AG | End of April: Wienerberger closes plant in Fürstenfeld * | |
| Governance | positive | Immofinanz AG | Immofinanz wins ‘Asset Management Company of the Year’ |
| negative | Telekom Austria AG | Corruption at Telekom Austria: OGH confirms guilty statements * |
| Category | Tendency of Reports | Hypotheses Established | AAR | CAAR |
|---|---|---|---|---|
| Environment | positive | H2: AAR > 0 c H3: CAAR > 0 c | t−1 0.0107 * | 0.0107 ** |
| t1 0.0113 **** | ||||
| negative | H4: AAR < 0 H5: CAAR < 0 | t0 0.0138 *** | 0.0199 | |
| Society | positive | H6: AAR > 0 c H7: CAAR > 0 c | t−2 0.0057 *** | 0.0148 *** |
| t1 0.0062 *** | ||||
| negative | H8: AAR < 0 H9: CAAR < 0 | t−1 0.0217 *** | 0.0076 | |
| Governance | positive | H10: AAR > 0 c H11: CAAR > 0 | t−1 0.0248 *** | 0.0316 |
| negative | H12: AAR < 0 c H13: CAAR < 0 | t−1 0.0038 * | 0.0113 ** | |
| t0 −0.0073 * | ||||
| t1 0.0045 ** | ||||
| t2 0.0079 *** |
© 2019 by the authors. Licensee MDPI, Basel, Switzerland. This article is an open access article distributed under the terms and conditions of the Creative Commons Attribution (CC BY) license (http://creativecommons.org/licenses/by/4.0/).
Share and Cite
Ender, M.; Brinckmann, F. Impact of CSR-Relevant News on Stock Prices of Companies Listed in the Austrian Traded Index (ATX). Int. J. Financial Stud. 2019, 7, 36. https://doi.org/10.3390/ijfs7030036
Ender M, Brinckmann F. Impact of CSR-Relevant News on Stock Prices of Companies Listed in the Austrian Traded Index (ATX). International Journal of Financial Studies. 2019; 7(3):36. https://doi.org/10.3390/ijfs7030036
Chicago/Turabian StyleEnder, Manuela, and Finn Brinckmann. 2019. "Impact of CSR-Relevant News on Stock Prices of Companies Listed in the Austrian Traded Index (ATX)" International Journal of Financial Studies 7, no. 3: 36. https://doi.org/10.3390/ijfs7030036
APA StyleEnder, M., & Brinckmann, F. (2019). Impact of CSR-Relevant News on Stock Prices of Companies Listed in the Austrian Traded Index (ATX). International Journal of Financial Studies, 7(3), 36. https://doi.org/10.3390/ijfs7030036