1. Introduction
Commodity prices have fallen over the past few years, and this decline has been accompanied by a severe slowdown in economic growth in emerging market economies that rely on the export of primary commodities. In addition, the recent collapse of oil prices and the accompanying volatility in global equity and bond market returns have raised the importance of studying the nature of the relationship between financial markets and commodity markets. Investment trends in commodity markets have raised doubts about the diversification benefits of commodity investments. An increasing correlation in the returns of financial markets and commodity indices would discourage investors from choosing commodities as a refuge during periods of stress.
Many investors and corporations have turned to Islamic finance both to satisfy their religious and ethical investing and to find innovative partnership and risk-sharing products with different levels of risk and competitive returns. In recent years, Islamic finance has continued to receive attention from across the globe and has been able to maintain its growth pattern. Among global Islamic financing instruments, sukuk (Islamic bonds) have become the most widely-used financial securities. The investment concept of sukuk was created as an alternative to interest-bearing fixed-income securities, namely, common bonds. In the last several years, the sukuk market has moved from a period of growth to a period of transformation. The sukuk market is well developed in Malaysia and the Gulf Cooperation Council (GCC) countries. Malaysia dominates the market for sukuk issuances and is the only jurisdiction to allow for the trading of debt-based structures. However, GCC countries constitute an important segment of the market and demand a higher Sharia standard.
The main objective of this paper is to investigate how major commodity price volatility shapes the distribution of GCC sukuk returns. The study includes commodity indices for precious metals, energy, soft agriculture and industrial metals. Cross correlations between financial and commodity markets have several important practical implications in terms of optimal asset allocation, asset pricing and portfolio diversification opportunities. To the best of our knowledge, this study is the first to investigate these relationships. More precisely, we address the following unanswered questions: Have commodities and Islamic bonds become a “financialized market of one”? Does dependence exist between sukuk returns and global commodity markets? Can sukuk and commodity markets offer international investors more alternatives for hedging and diversification purposes?
The financialization of commodity markets and the impact of financial factors on commodity price dynamics have motivated us to focus on the dynamics between sukuk and commodity markets. The financialization of commodity markets implies that commodity price dynamics are determined not only by supply and demand but also by numerous financial factors. This study is conducted with a multivariate GARCH-DCC process, which is a generalization of univariate GARCH models and allows for the investigation of asset interconnectedness, volatility transmission, and the dynamic correlation between assets, as well as potential spillovers and contagion effects between markets.
This study adds to the related literature in three ways. First, it investigated the dynamic links between sukuk (Islamic bonds) and commodity markets based on a time-varying framework, which had not been researched before in the literature. Second, it examined whether sukuk returns in the dominant GCC sukuk countries (including Saudi Arabia, UAE, Qatar and Bahrain) were more (or less) exposed to volatility in global commodity markets. Third, our recent sample period (November 2010 to August 2015) allowed us to investigate the dynamic and similarities in periods that contain information from recent events, such as the recent collapse in oil prices, the US economic recovery, the European sovereign debt crisis, and the growth of ethical investments, including Islamic finance.
The remainder of this paper is organized as follows:
Section 2 presents an overview of sukuk market development.
Section 3 reviews the related literature.
Section 4 discusses the model and the testing framework.
Section 5 describes the data and presents the preliminary statistics.
Section 6 analyzes the empirical findings.
Section 7 gives concluding comments.
2. Sukuk Market Development
The word sukuk refers to certificates that demonstrate entitlement to a property (ies). Sukuk are defined by the Auditing and Accounting Organization of the Islamic Financial Institutions (AAOIFI) as “the certificates of equal value representing undivided shares in ownership of tangible assets, usufruct and services or in ownership of the asset of a particular project or special investment activity.” Sukuk can be classified into asset-backed sukuk and asset-based sukuk. The main difference between these two groups lies in the ownership and sale of the assets. The asset-based sukuk include tangible assets, which may not be legally admitted to being owned outright by the sukuk holders. This structure grants only beneficial ownership to the sukuk holders, implying that they do not have full recourse to the underlying assets, which cannot be used as collateral. The asset-backed sukuk allow the sukuk holder a share of the real asset or business venture. In this structure, there is a true sales transaction, where the originator of the sukuk sells the underlying assets to a special purpose vehicle (SPV) that holds these assets and issues the sukuk backed by them.
Sukuk certificates have some similar features with conventional bonds (CBs) since both have fixed-term maturities, both of their holders are entitled to a regular stream of income, both produce a final market value payment at maturity and both are tradable on the secondary market. However, Sukuk certificates differ from conventional bonds in terms of their legal nature, business activity, structure type, investment returns and risks, and issuance and pricing procedures. These differences are explained in
Table 1.
Sukuk markets have experienced phenomenal growth all over the globe. Malaysia and GCC countries are the dominant market players. According to the Islamic Financial Services Board (IFSB) report (
Islamic Financial Services Board 2017), global Islamic banking assets reached USD
$1.5 trillion in 2016. The market share of Sukuk is estimated at 17%. The IFSB data also show that new Sukuk issuances experienced a 16.3% increase in volume to USD 74.8 billion in 2016. In total, 79% of the issuances originated from sovereigns, and only 21% originated from corporate issuers. Malaysia was the largest market of total Sukuk outstanding in 2016, accounting for a 46.4% share of the total market. Saudi Arabia, UAE, and Qatar had market shares of 17.4%, 10.5%, and 5.9%, respectively. According to the International Islamic Financial Markets (IIFM) annual sukuk report (
International Islamic Financial Markets 2018), total global issuance amounted to USD 116.7 billion in 2017. The increase in volume from 2016 to 2017 was mainly due to sovereign Sukuk issuances by Saudi Arabia (around USD 9 billion) coupled with stable issuances from Asia, GCC, and Africa. Although Malaysia continued to dominate the Sukuk market, countries such as Indonesia, UAE and, to some extent, Turkey increased their market share as well.
3. Literature Review
The financialization of commodity markets and the globalization of financial markets have contributed to the integration of financial and commodity markets. Recent empirical studies have suggested a dynamic linkage between commodities and equity markets.
Baur and McDermott (
2010) find a negative relationship between gold and stock prices. They conclude that gold can be considered a safe-haven asset.
Vacha and Barunik (
2012) and
Delatte and Lopez (
2013) show no relationship between equity and commodity market returns in the 1990s and during most of the 2000s, except for industrial metals.
Silvennoinen and Thorp (
2013) find that correlations between S&P 500 returns and common commodity returns increased in many cases over the 1990–2009 period and increased sharply in the wake of the recent global financial crisis.
Creti et al. (
2013) found significant volatility transmission between commodity and equity markets since 2008. The largest decrease in correlations was at the time of the recent global financial crisis, but only for a short period.
Charfeddine and Benlagha (
2016) studied time-varying dependence between commodity and stock market returns (SP500, CAC40, DAX30 and FTSE100) using copula functions. They found a dynamic linkage between stock market and commodity returns and that the Student’s
t-copula is more appropriate for modeling dependency.
Olson et al. (
2017) investigate whether commodities are effective hedges for equity holders. They found that commodities are not effective hedges for equity market investors during normal or crisis periods. However,
Daskalaki et al. (
2017) found that commodities provide diversification benefits for second and third generation indices. This result holds for both in-sample and out-of-sample and for different equity strategies.
Few studies have investigated the relationship between Islamic equities and Islamic commodity markets. Among those few studies,
Nagayev et al. (
2016) investigated the dynamic links between commodities and the Dow Jones Islamic Market (DJIM). They found that correlations between commodity markets and the Islamic Equity Index are time-varying and highly volatile throughout the period of study (January 1999–April 2015). They also found that gold and natural gas are better portfolio diversifiers than oil and other metals.
Mensi et al. (
2017) investigated the risk spillovers between crude oil and gold and both the aggregate Dow Jones Islamic index (DJIM) and its associated ten stock sectors. They found a dynamic correlation between crude oil and gold and all Islamic indices. Moreover, they found that both the oil and gold markets and the Islamic financial, technology, energy, and telecommunications sectors are net receivers of risk spillovers, whereas the DJIM index, consumer goods, consumer services, health care, industrials, and utilities sectors are net contributors to risk spillovers.
Shahzad et al. (
2018) investigated the extreme dependence between five global Islamic equity indices (the Islamic Market World index, the Islamic indices of the US, the UK, and Japan and the Islamic Financials sector index) and crude oil prices. Using time-varying copulas, VaRs, CoVaRs and ΔCoVaRs, they find time-varying lower tail dependence between the oil and Islamic stock markets. Moreover, they find asymmetric down- and upside risk spillovers from oil to the Islamic stock markets and vice versa.
As the above literature suggests, some recent studies have analyzed the dynamics between commodity and equity markets. This research contributes to the related literature in several dimensions. First, we extend the scant literature on the spillover effects between Islamic bonds (sukuk) and commodity markets (including soft commodity, precious metals, industrial metals, and energy). The investigation of the dynamic correlation behavior between commodity prices and sukuk provides new insights into the international diversification of asset portfolios and the financialization of commodity markets. Second, we use an empirical multivariate GARCH-DCC model to investigate the dynamic correlations between sukuk indices and different commodity markets. This model allows us to investigate the behavior of cross-interactions between sukuk and commodity indices and to evaluate the implications for portfolio risk management. Finally, all the above-mentioned studies consider only the combination of Islamic equities and some commodities; therefore, these studies do not include sukuk that are in the asset menus of international investors, noncommercial traders and faith-based investors.
4. Methodology and Testing Framework
The multivariate GARCH model developed by
Engle (
1982) is widely used to estimate the dynamic conditional correlation (DCC) between bivariate time series. The DCC-GARCH model is the extension of the constant conditional correlation (CCC) model presented by
Bollerslev (
1990), which allows the correlation matrix to depend of the time. The basic idea of the models is that the covariance matrix can be decomposed into conditional standard deviations and a correlation matrix which are designed to be time-varying. The DCC-GARCH model includes a two-stage estimation of the conditional covariance matrix. In the first stage, univariate GARCH models parameters are estimated for each return time series (sukuk and commodities). The likelihood used in the first stage results in replacing the conditional correlation matrix of the standardized disturbances by the Identity matrix. In the second stage, the returns, transformed by their estimated standard deviations, are used to estimate the parameters of the conditional correlations.
The time-varying conditional volatility of index return (
ri,t) is given by the following GARCH model:
where
is the conditional variance for the series,
ω is a constant term,
α captures the ARCH effect,
β measures the persistence of the volatility,
is the error term of a
d-dimensional model, and
is a sequence of independently and identically distributed random variables with zero mean.
In the second stage, we describe
as a function in terms of the diagonal matrix and time-varying correlation matrix, formulated as follows:
where
is the diagonal matrix of the conditional standard deviation from univariate GARCH models, (
ri,t ) is the rate of return and is supposed to be normally distributed with zero mean,
indicates the information available at
t − 1,
is the
k ×
k diagonal matrix of the time-varying residuals obtained from step one with √(
h(i,t)) on the
i th diagonal,
These residuals are standardized and applied to Equation (2).
is the
k ×
k time-varying conditional correlation matrix that can be presented as follows:
The correlation structure can be extended to the general DCC(
m,
n)-GARCH model: and can be expressed as follows:
where
is the matrix of unconditional covariances of the standardized errors obtained in the first stage. Since the residuals from the Equation (1) are standardized and used in the second stage of estimation, the dynamic correlation coefficient matrix is P
t =
Q*−1·
QtQ*−1, where
, which is a diagonal matrix composed of the square root of the diagonal elements of
, is expressed as follows:
The conditional correlation coefficients between two index returns of the matrix can be estimated as follows: and is the unconditional covariance of the standardized residuals.
5. Data Description
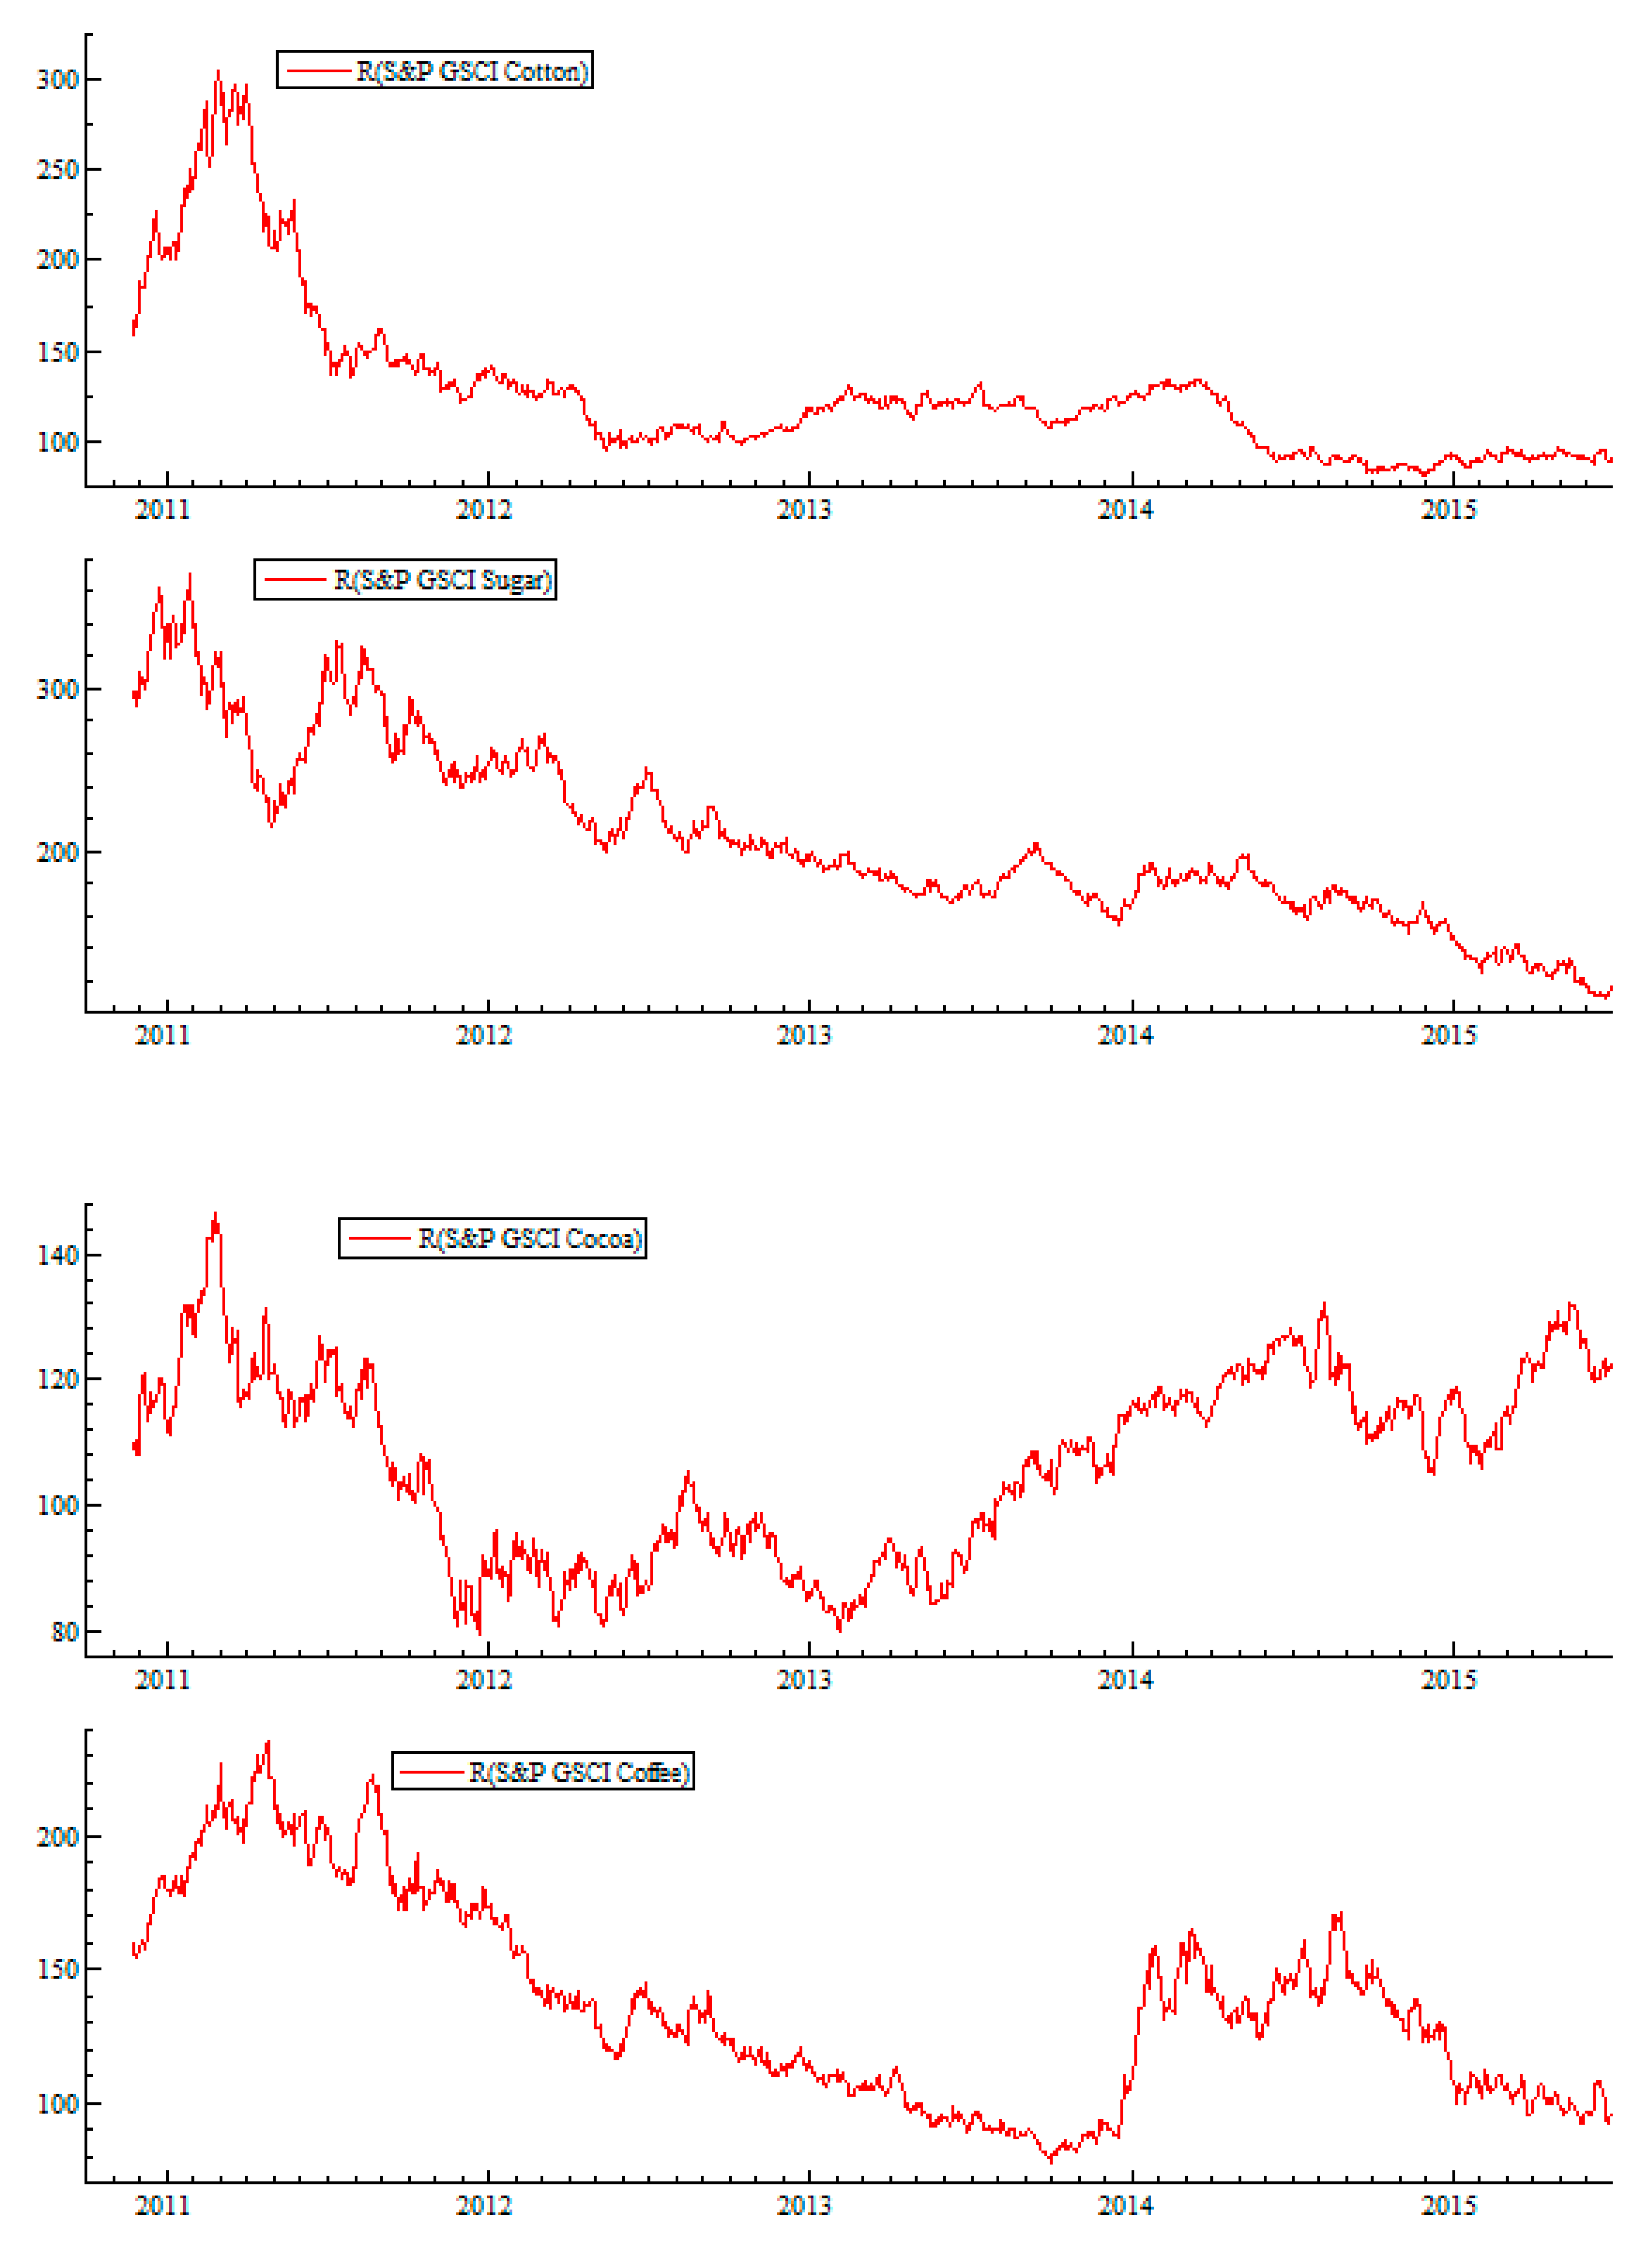
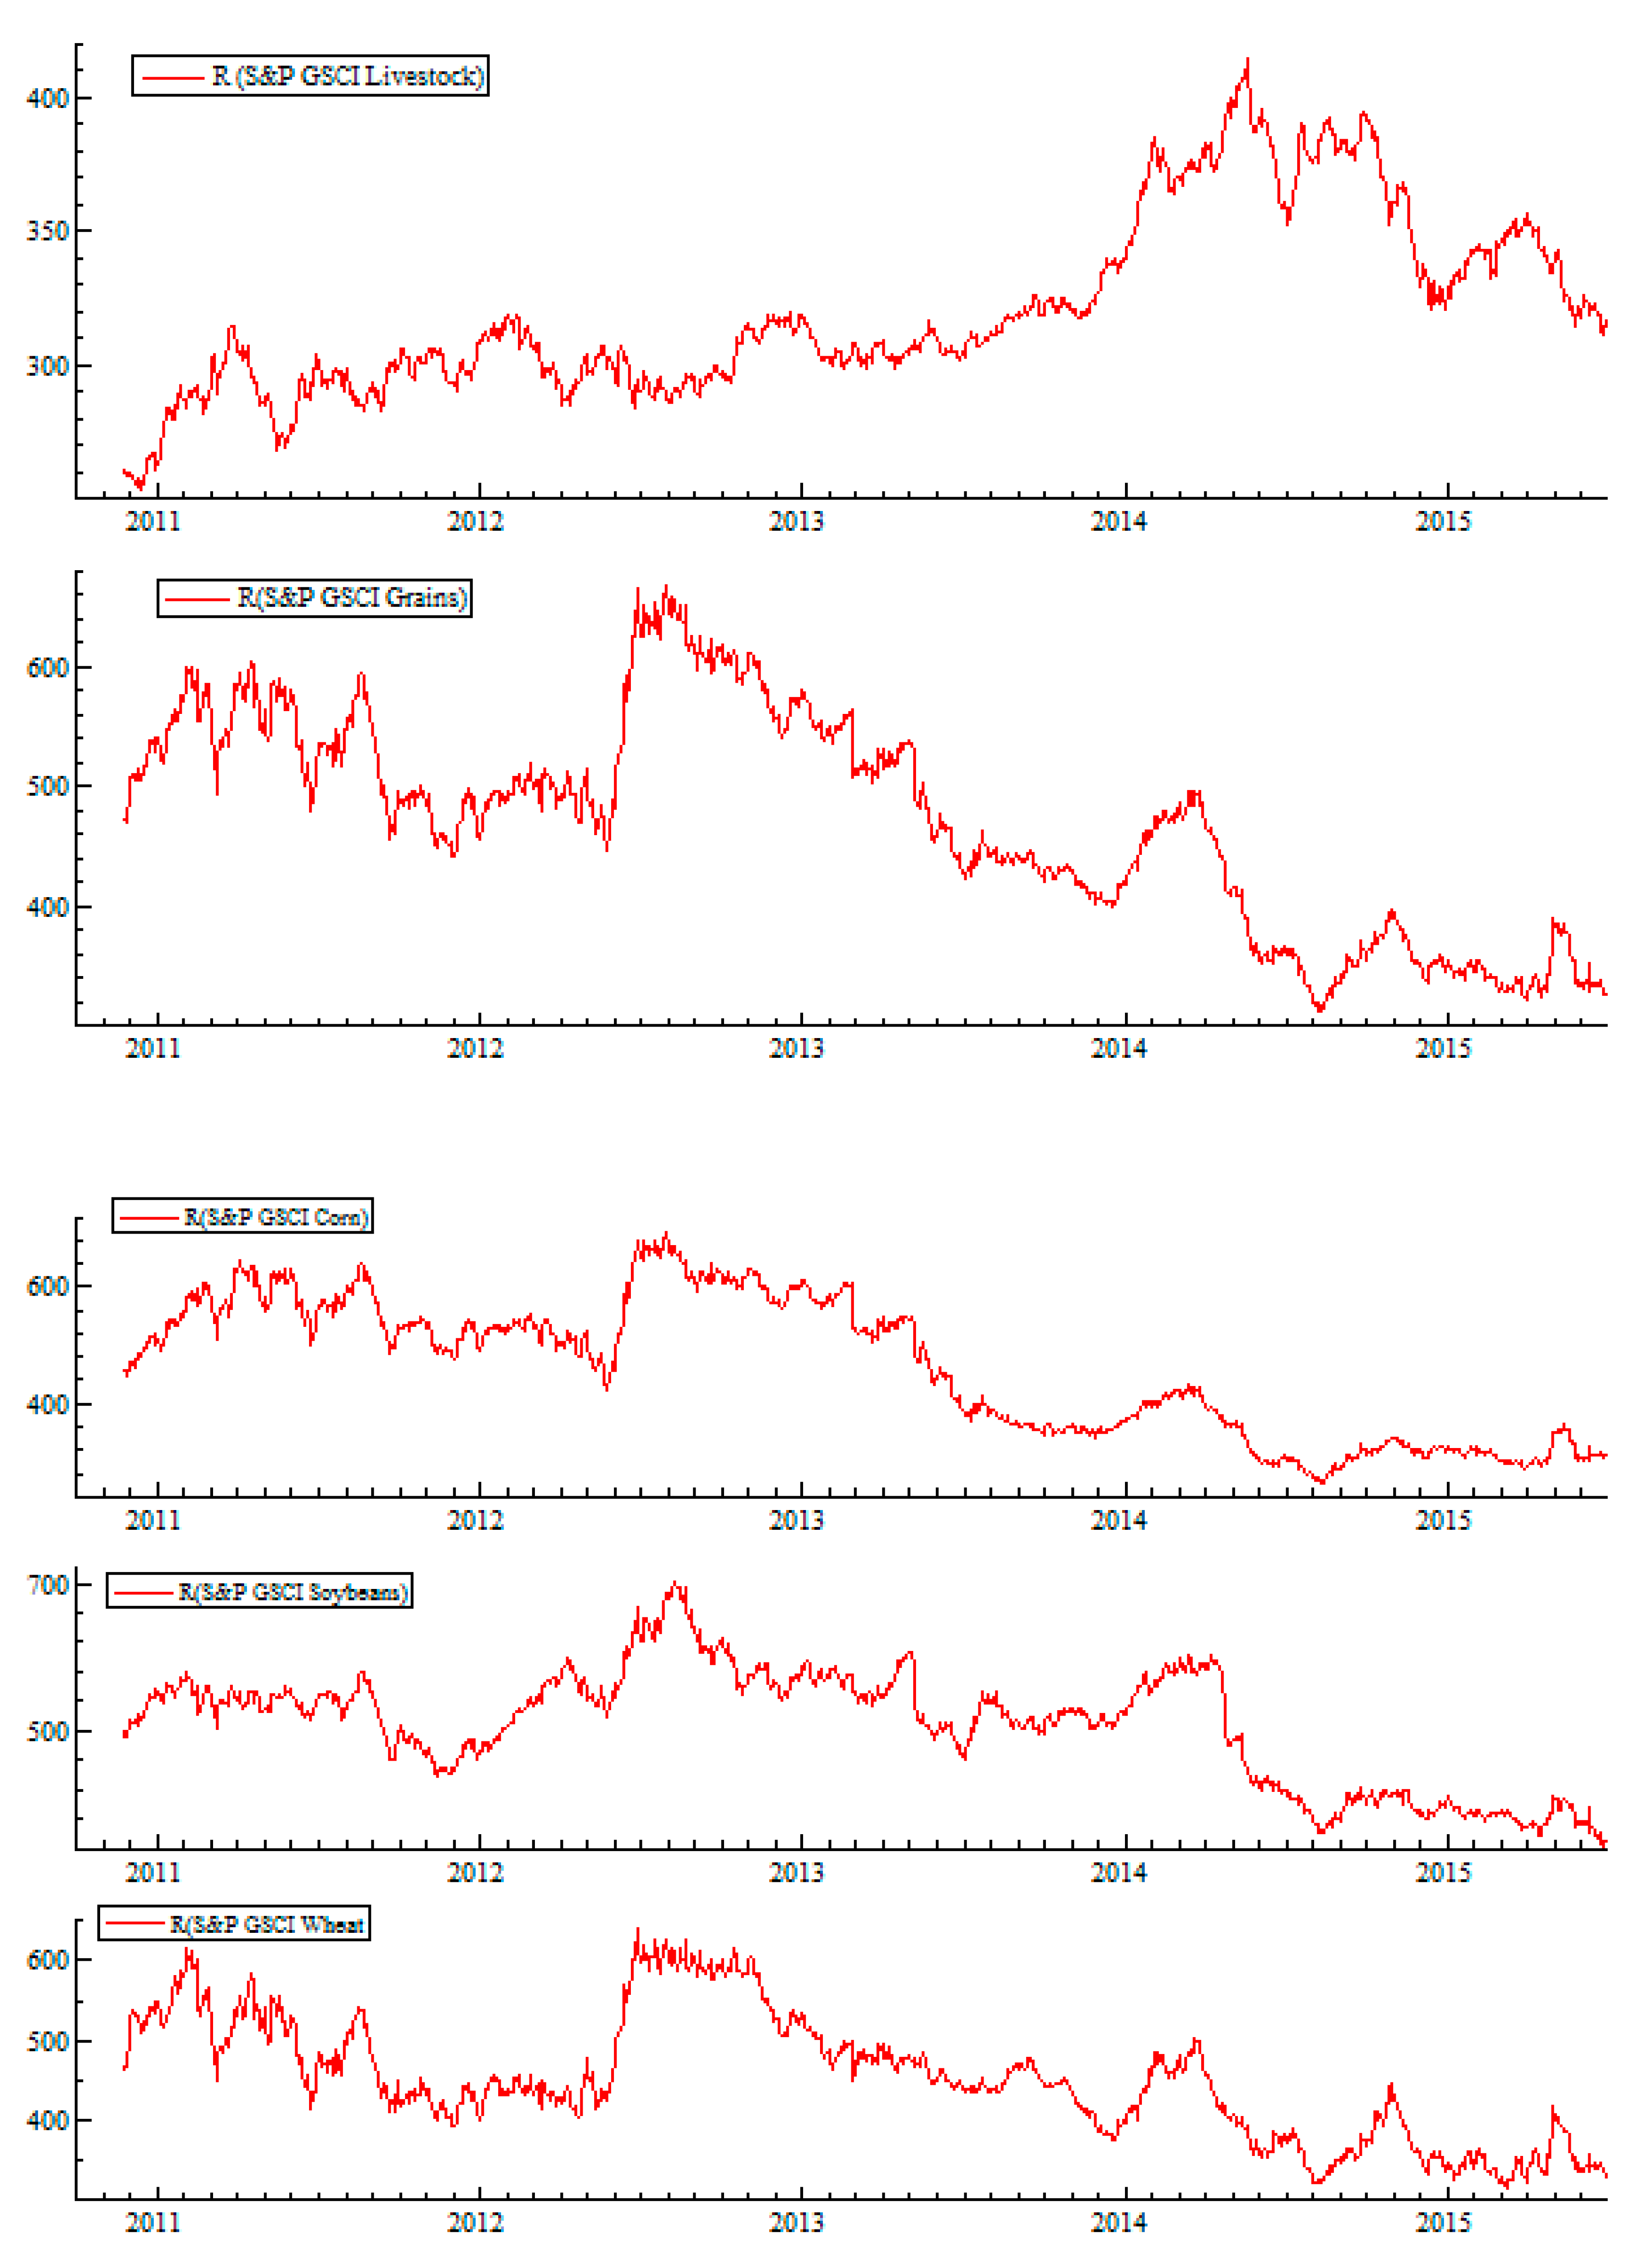
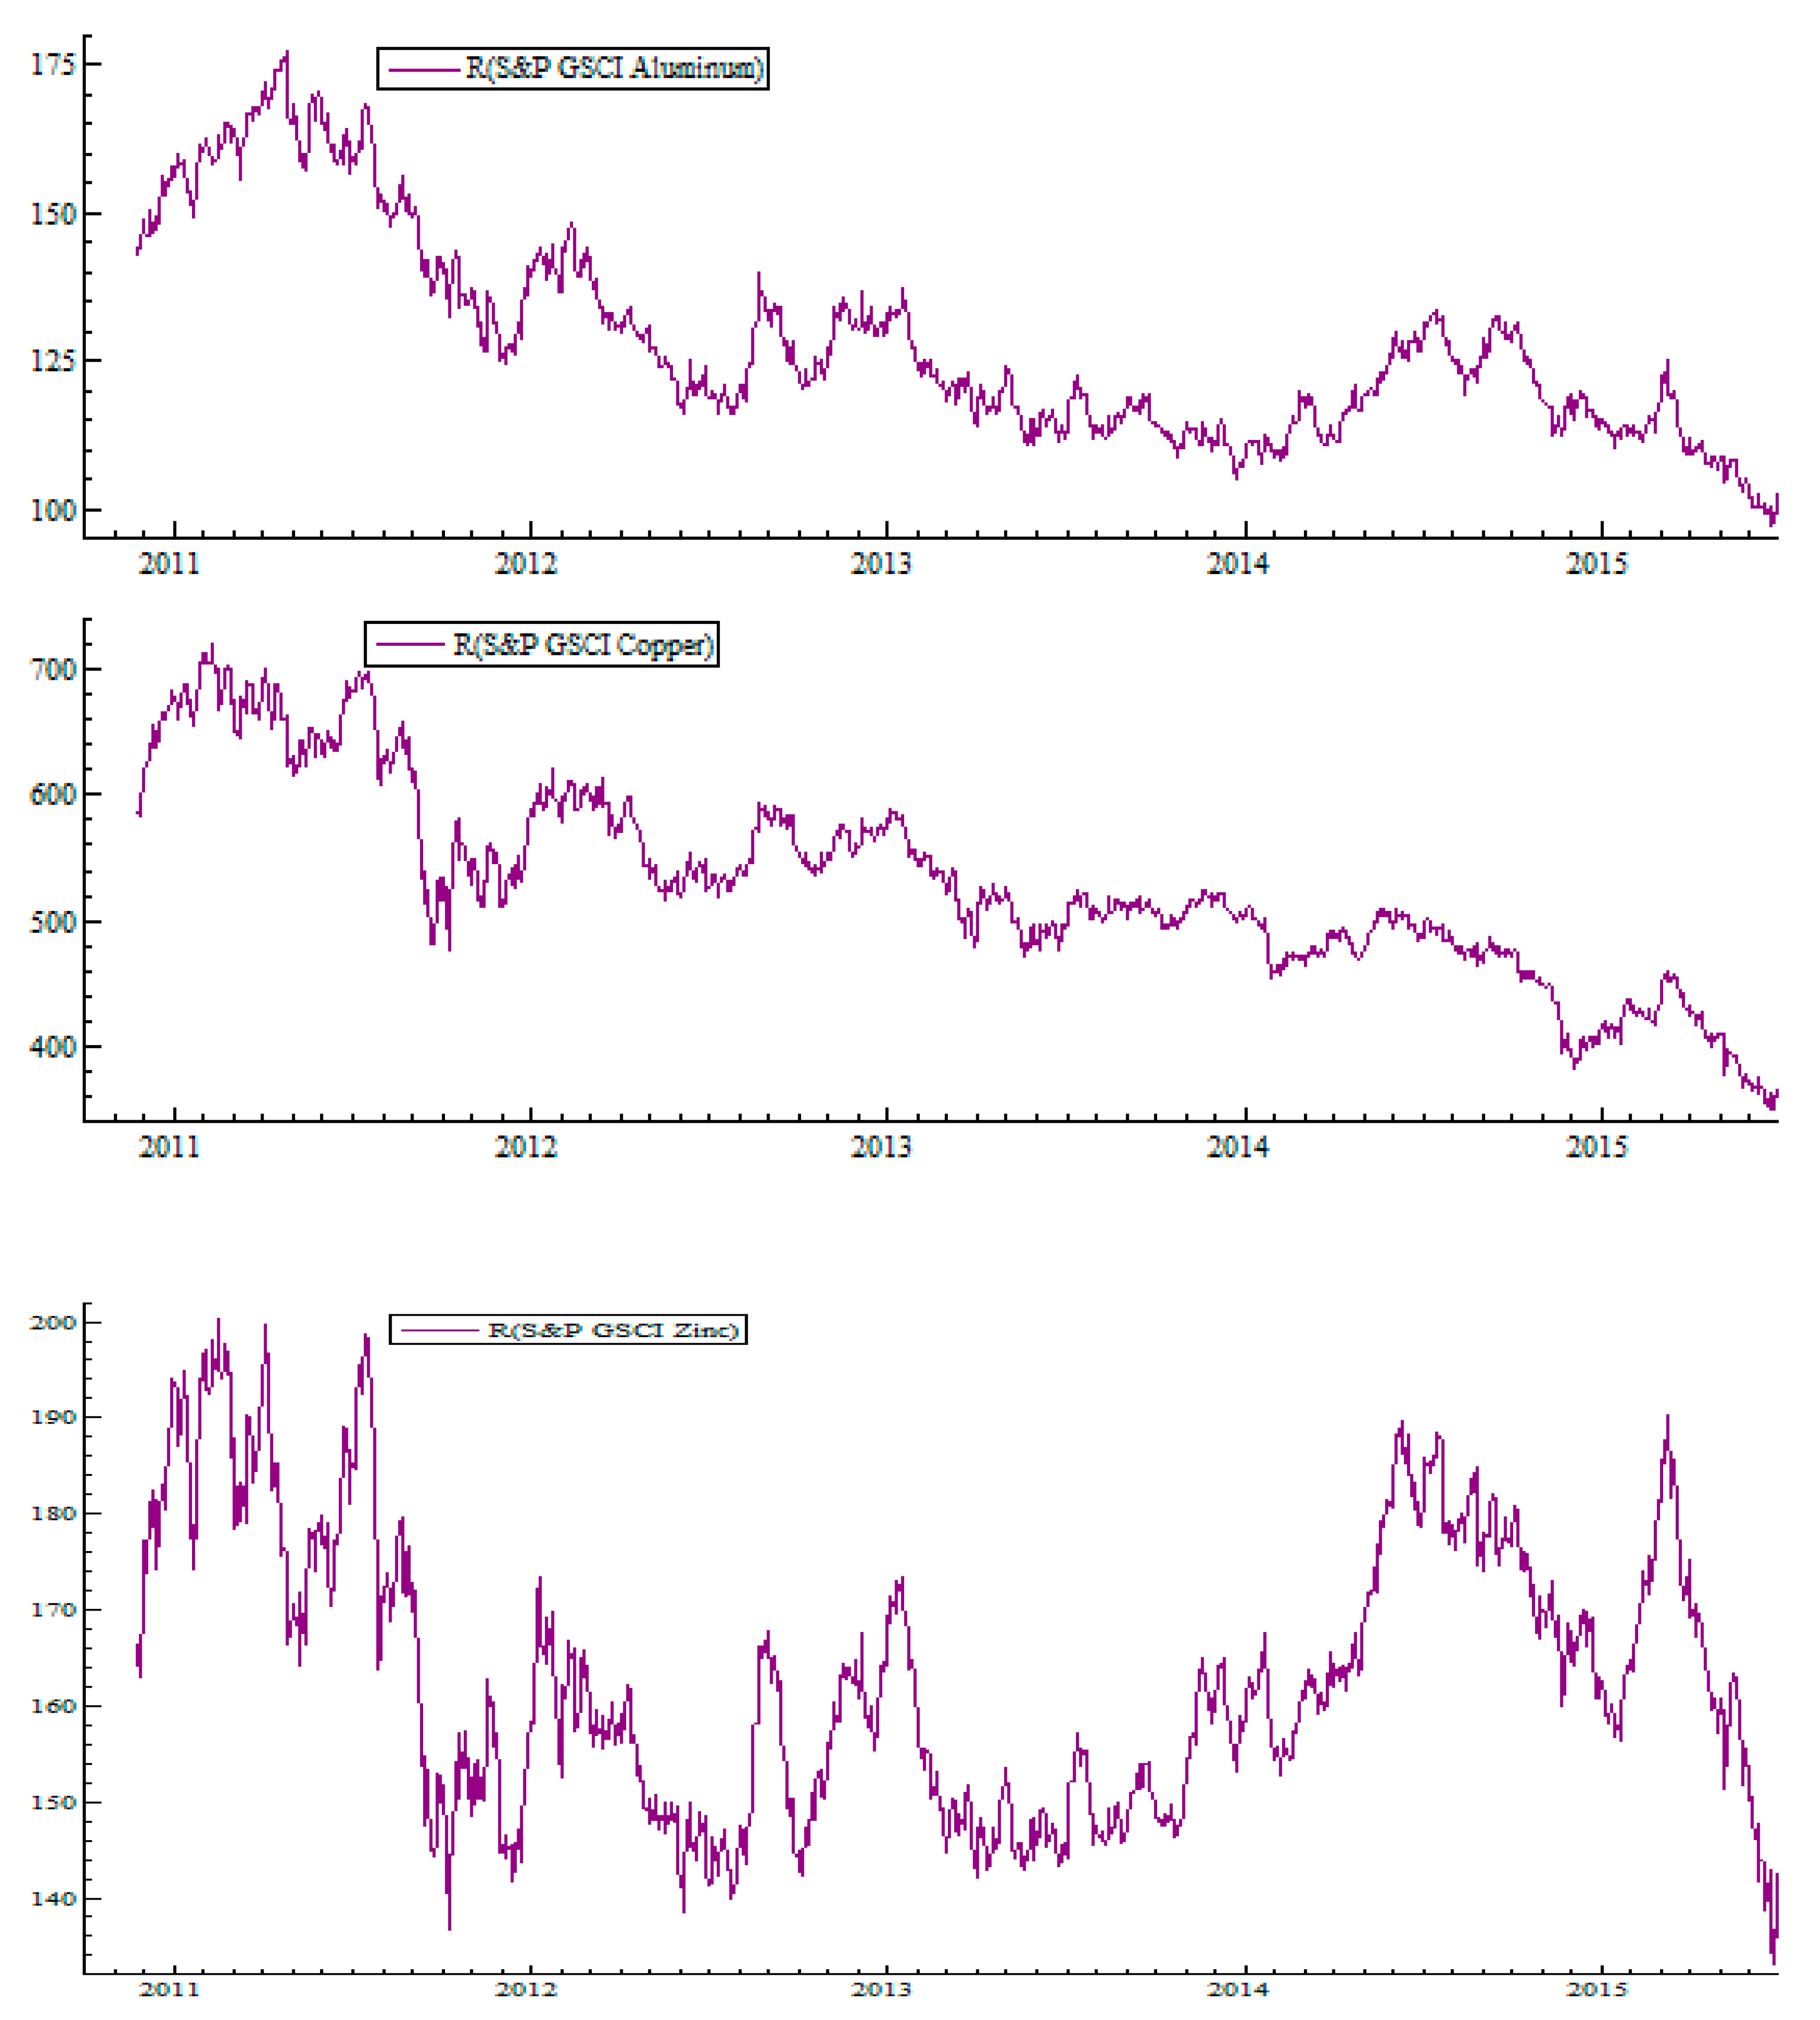
We use the log returns of daily spot prices for 16 commodities derived from the Dow Jones Commodity Index over the 23 November 2010–28 August 2015 period to assess the dynamic linkage between sukuk and commodity markets. Spot returns are the main drivers of the variation in commodity returns over short-term horizons, whereas rolling returns (annualized average returns) are crucial factors that contribute to commodity excess returns over longer-term horizons (
Nagayev et al. 2016). The S&P GSCI is the first major investable commodity index. It is one of the most widely recognized benchmarks that is broad-based and production weighted. The indices include the precious metals commodity index (gold (GOLD) and silver (SILV)); the energy commodity index (crude oil (COIL) and natural gas (NGAS)); the soft agriculture commodity index (cocoa (COCO), coffee (COFF), cotton (COTT), sugar (SUGA), grains (GRAIN), livestock (LIVE), corn (CORN), soybeans (SOYB) and wheat (WHEA)), and the industrial metals commodity index (aluminum (ALUM), copper (COPP), and zinc (ZINC)). The diversity of commodities used in this study offers potential insights into the exposure of sectors in determining the risk and return of sukuk indices.
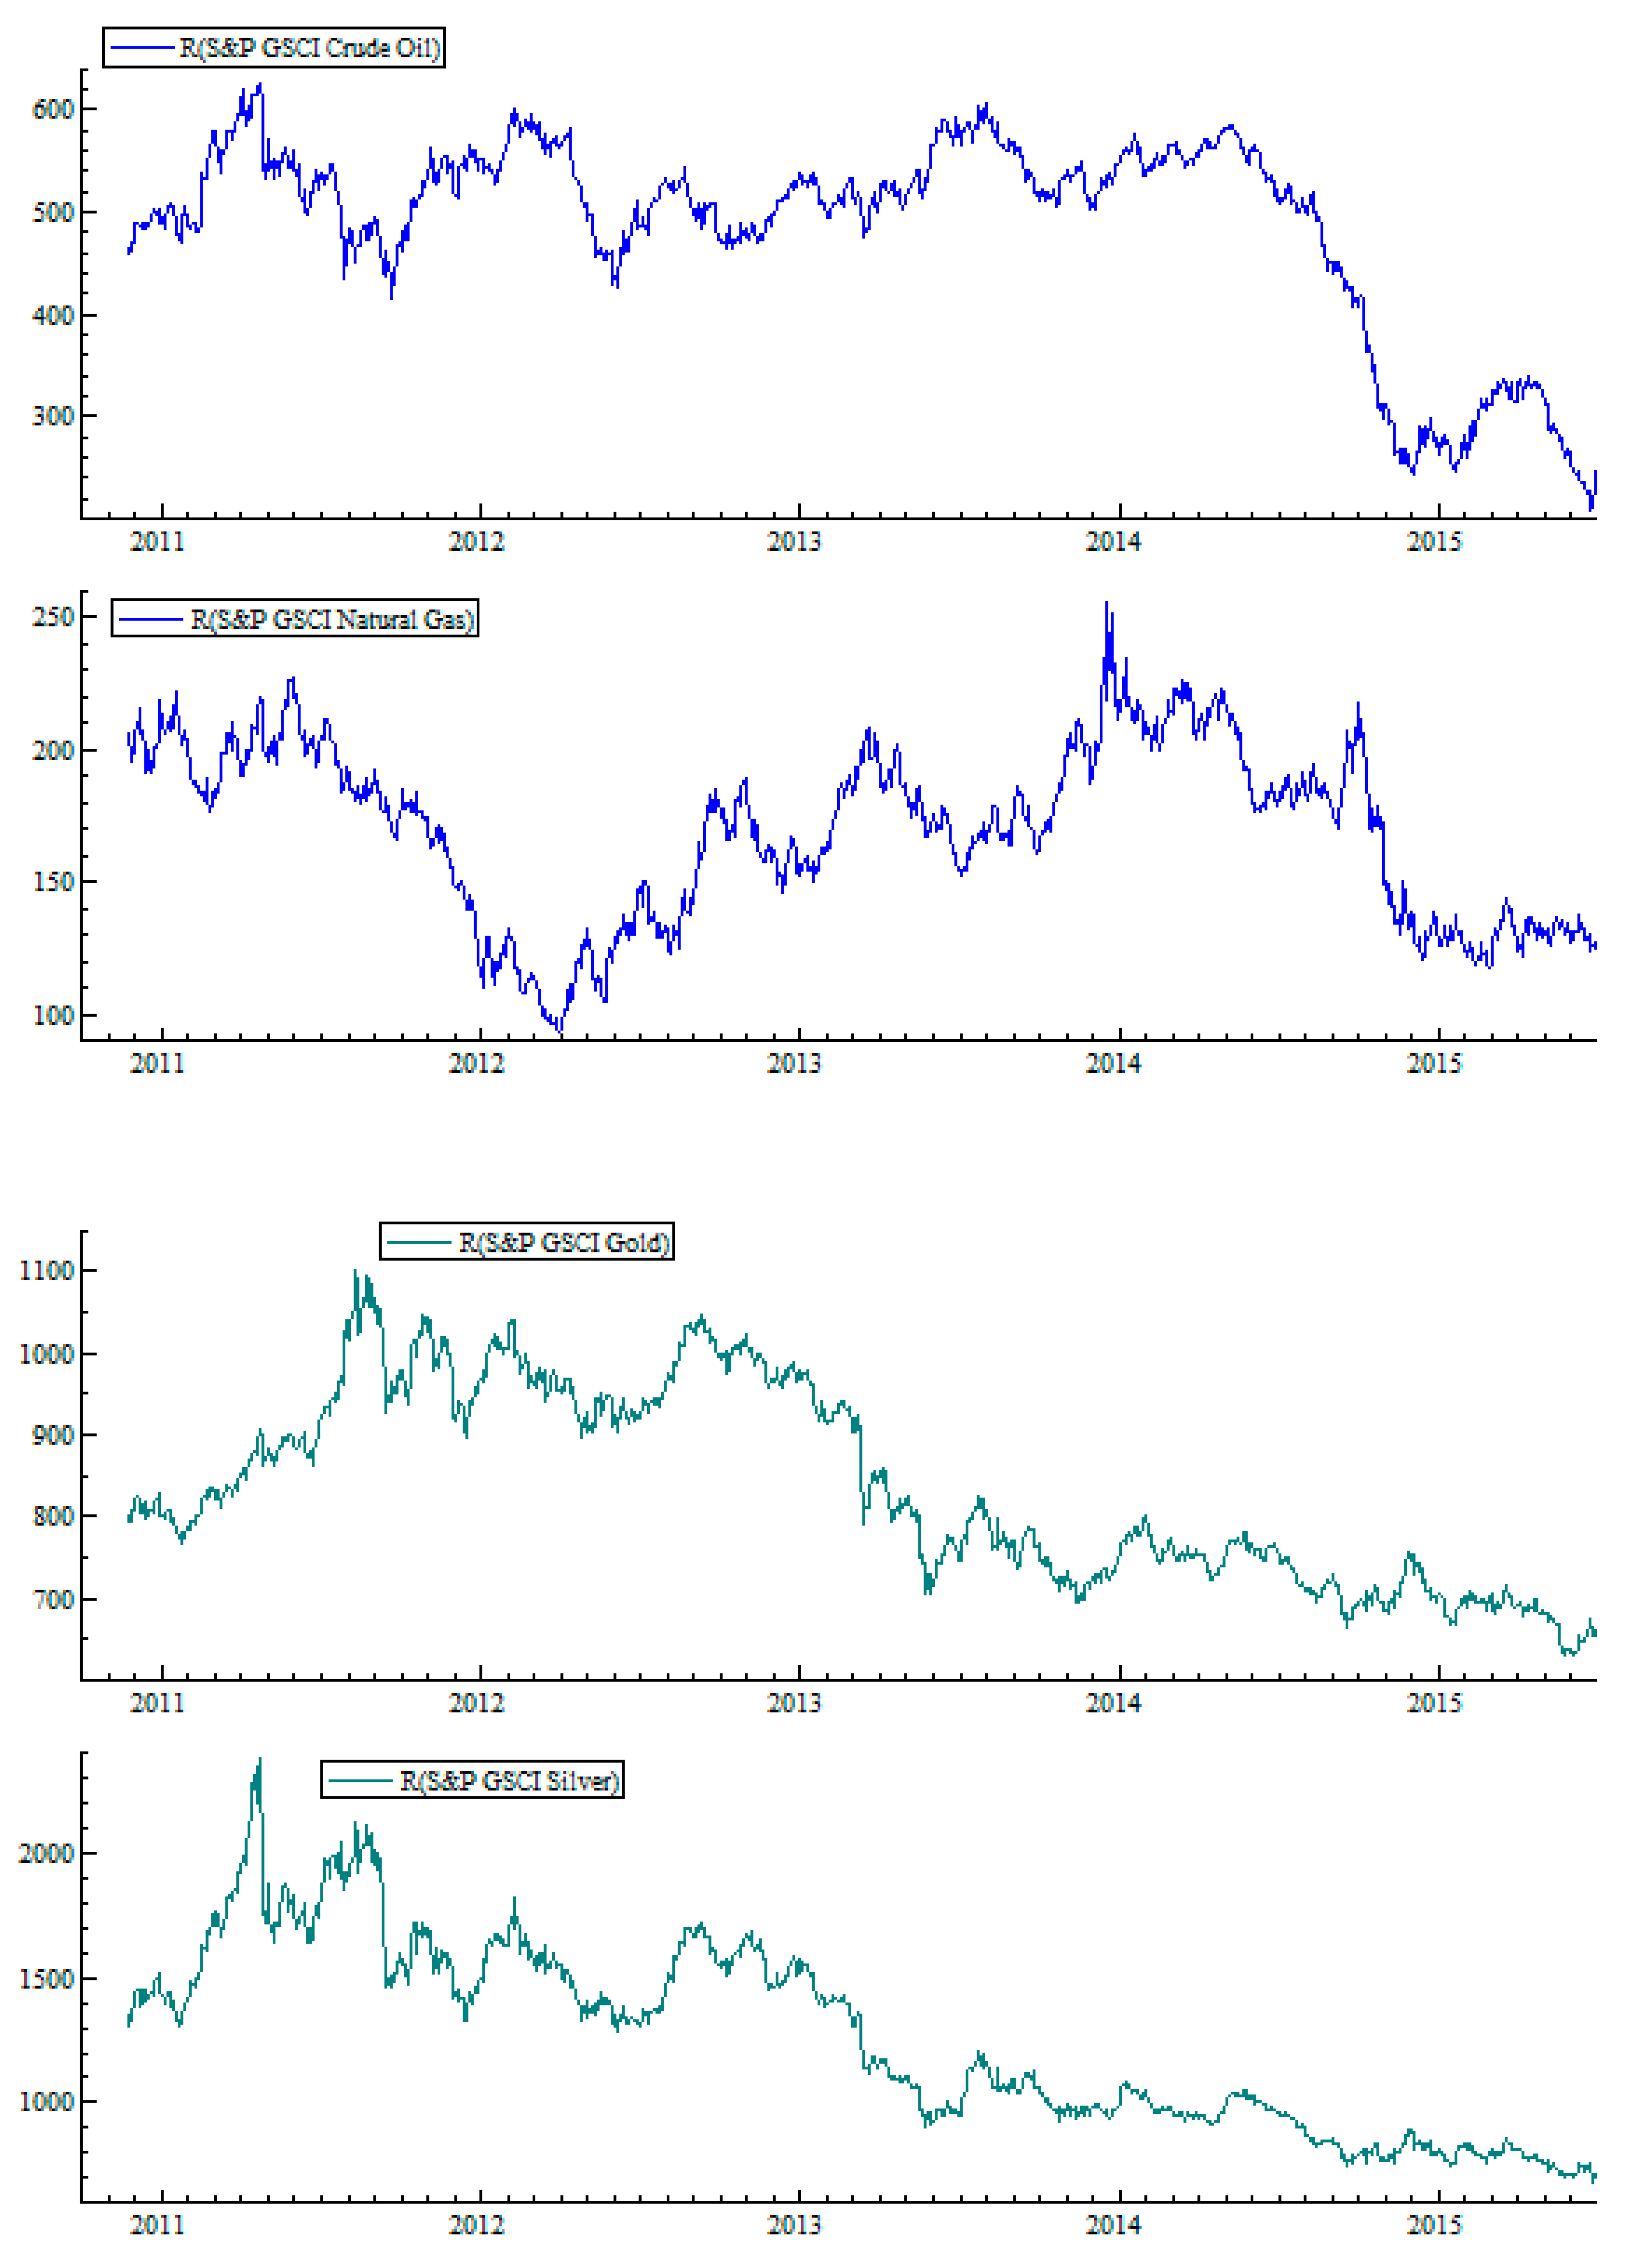
Figure 1 plots the time variation of the various commodity indices, including soft commodities, precious metals, industrial metals and energy indices. We can see some periods of significant price fluctuations, but price development patterns are different for most of the commodity indices.
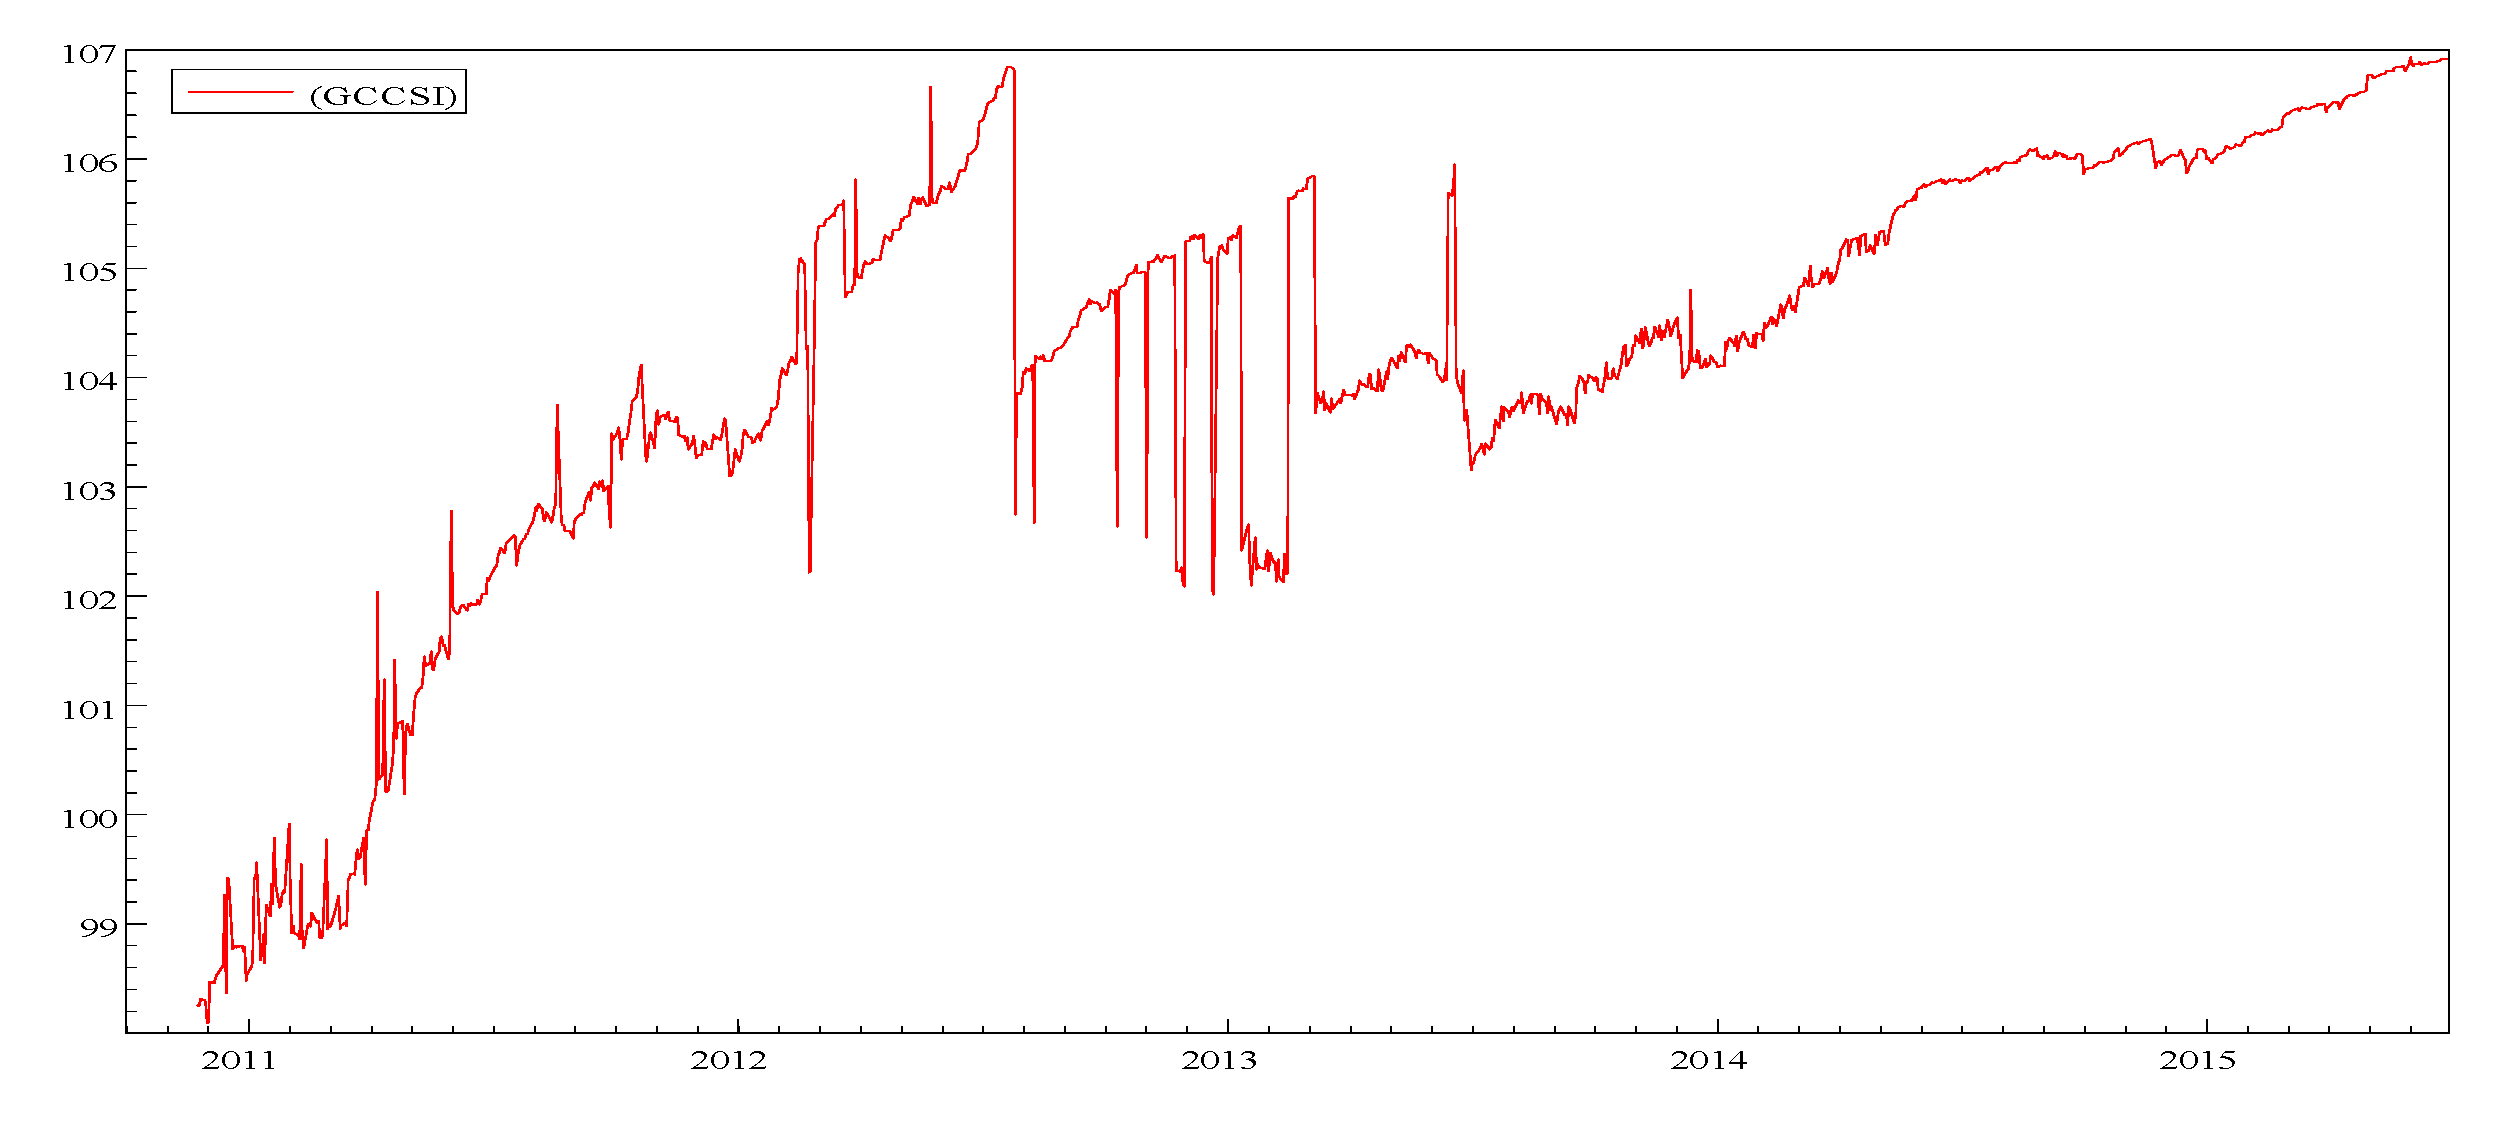
We also use the daily returns of sukuk from the GCC region (GCCSI) for the period 23 November 2010 to 28 August 2015. We select only the liquid sukuk that have regular daily data. We construct an equally weighted sukuk index for the GCC sukuk markets of Saudi Arabia, UAE, Bahrain and Qatar
1.
Figure 2 plots the time variation of the constructed GCC sukuk index
For each commodity price index, we estimate the return (
) as
, where
is the price on day.
Table 1 presents the descriptive statistics for the commodity and sukuk returns.
From
Table 2 we notice that all of the commodities (except for livestock) exhibit negative average daily returns over the stated period. The Jarque–Bera normality test statistic indicates a significant departure from the normal distribution. The Lagrange multiplier test for ARCH disturbances LM-ARCH test provides robust evidence of heteroscedasticity and shows that DCC volatility can be captured by a GARCH model. The
Ljung and Box (
1978) statistic on the first twenty lags of the sample autocorrelation function is significant only for zinc, oil, gas, coffee and cotton returns, suggesting the existence of high serial correlation among these series. In addition, we tested the stationarity for all of the time series by using the Augmented
Dickey and Fuller (
1979) (ADF) and the
Phillips and Perron (
1988) (PP) unit root tests. The results reject the hypothesis of a unit root for all time series returns at the 1% significance level.
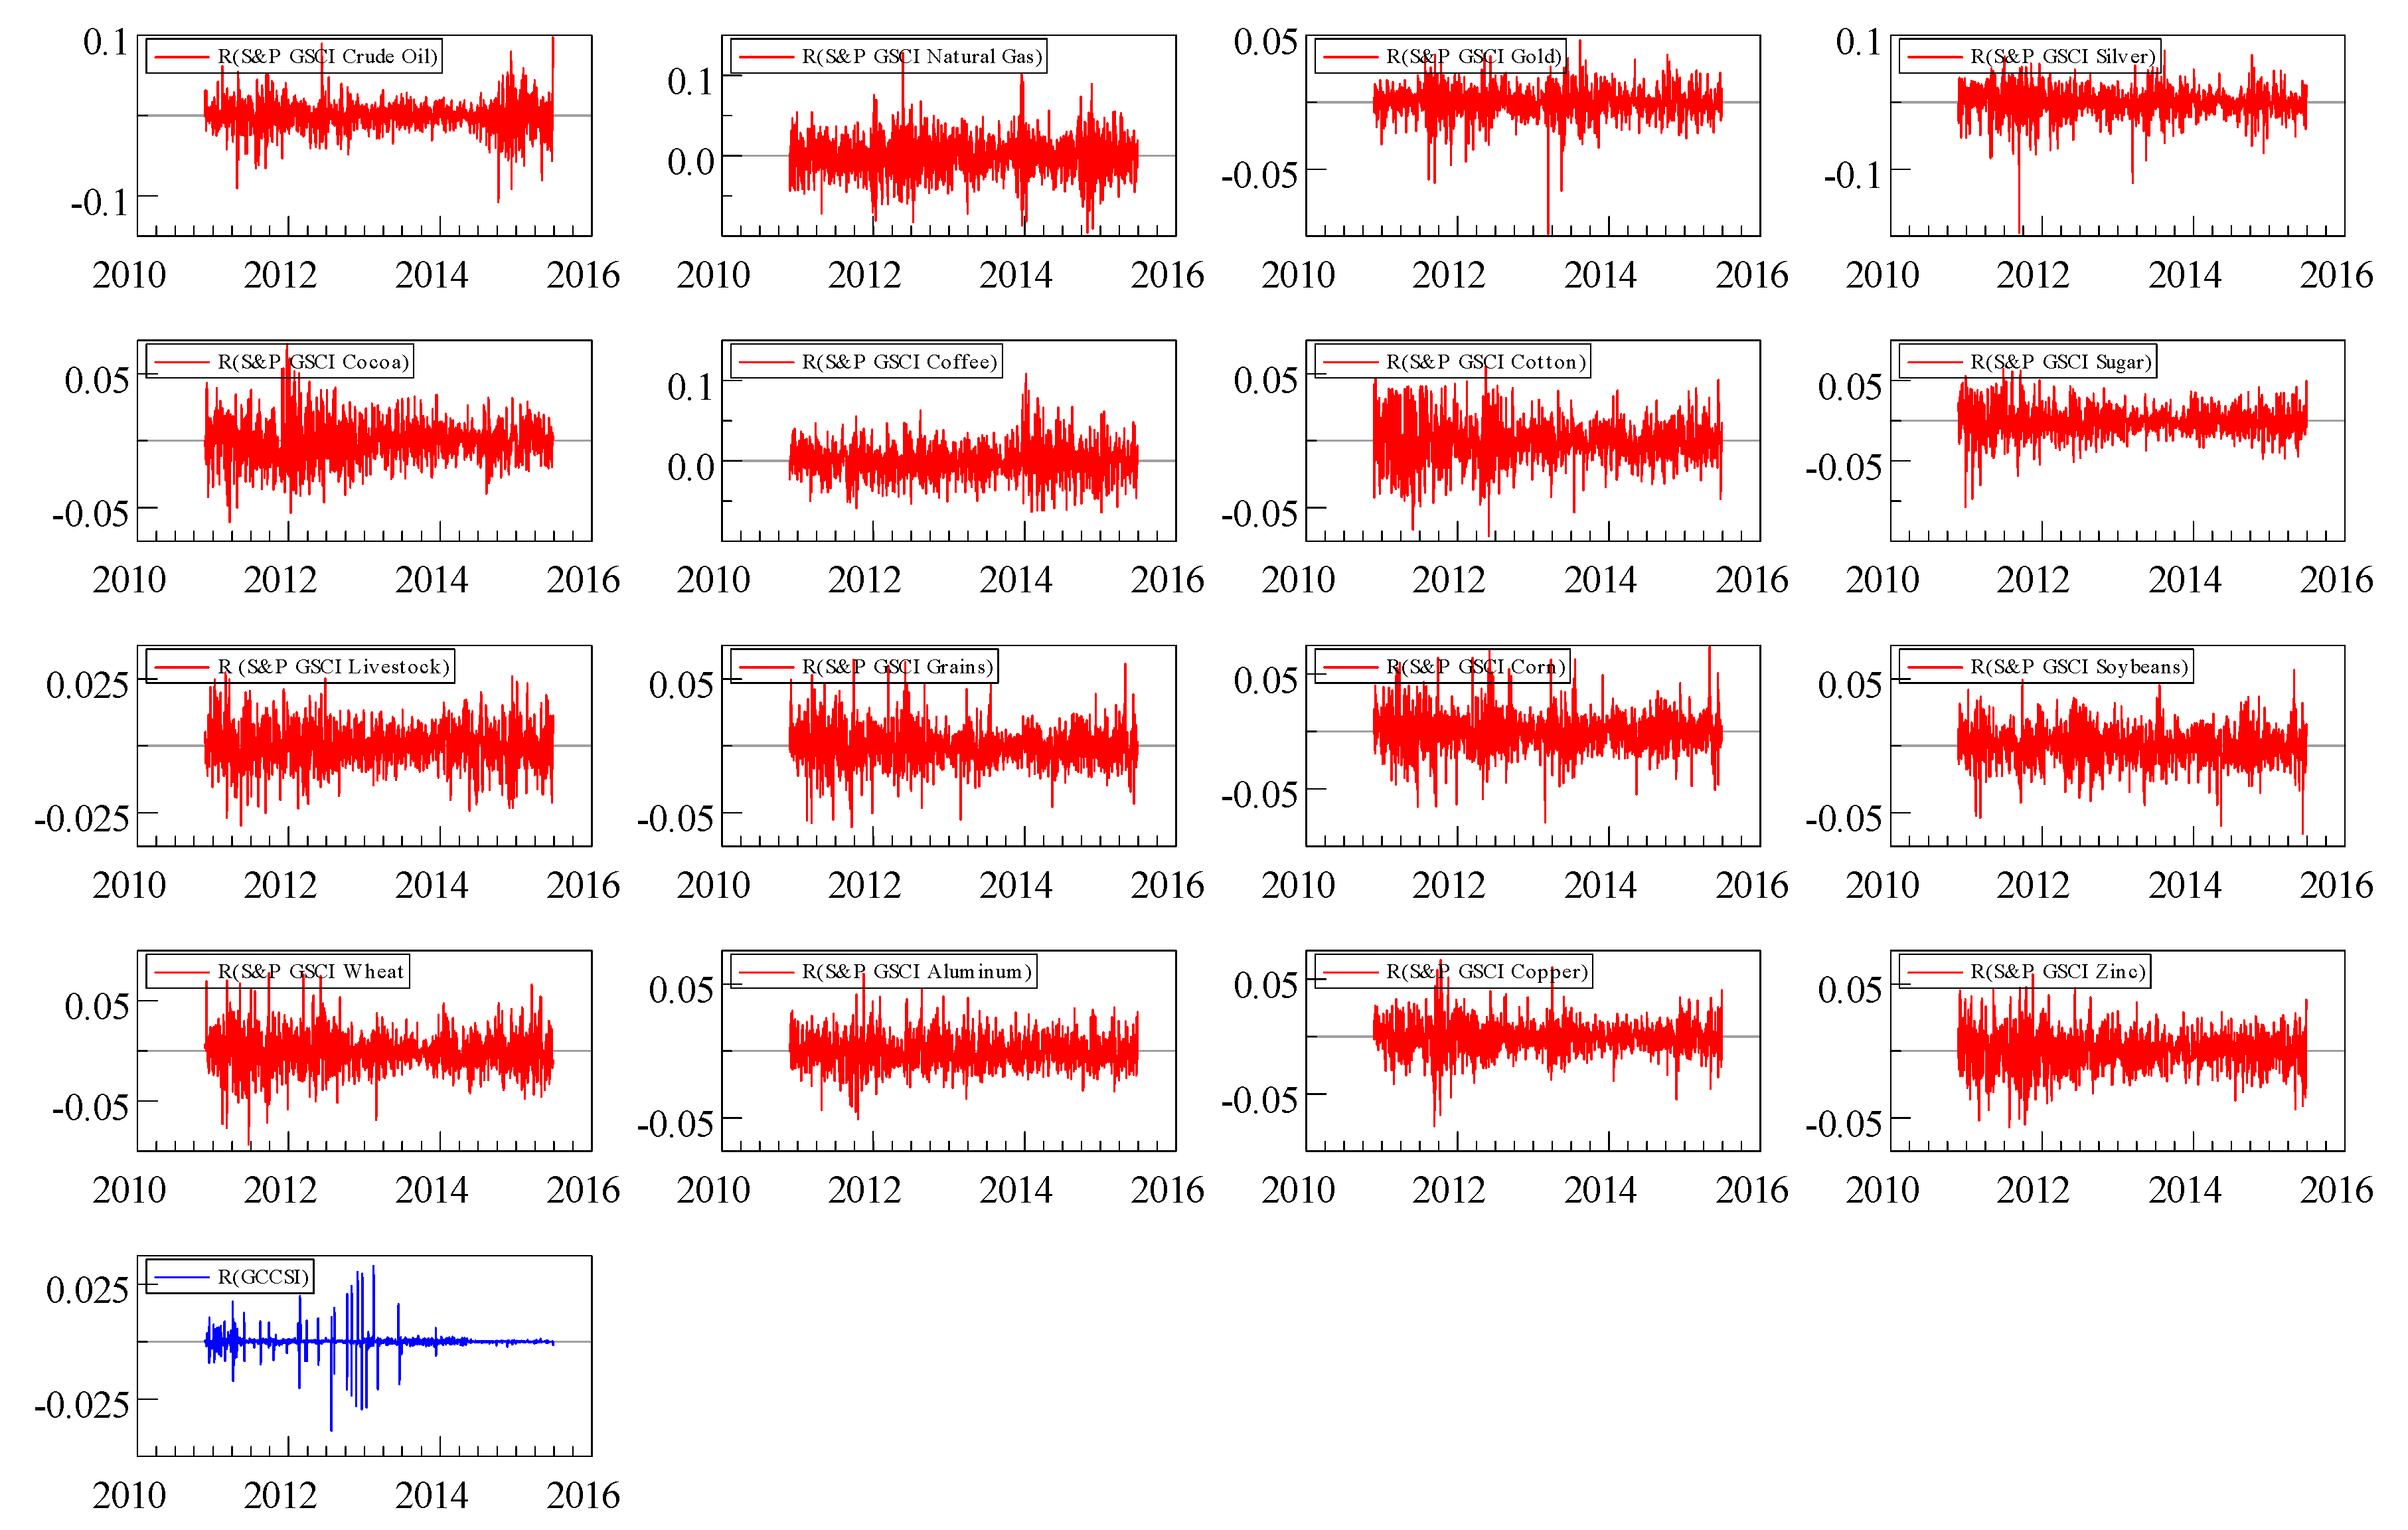
Figure 3 shows the dynamics of sukuk and commodity market returns during the study period. We notice the presence of volatility clustering and ARCH effects in all series, supporting the adoption of the GARCH family models.
6. Estimation Results
To assess the dynamic co-movements of the selected commodities and sukuk returns, we have applied the Dynamic Conational Correlation (DCC-GARCH) model. The estimation results of the multivariate GARCH model are reported in
Table 3.
The parameters of the model and the diagnostic tests are given in
Table 3. We notice that the ARCH parameters are statistically significant and satisfy the non-negativity condition set for the conditional variance. Based on the goodness-of-fit tests (Li–McLeod and Hosking tests computed with 20 lags), the results indicate no serial correlation and no remaining ARCH effect, demonstrating no evidence of statistical misspecification. Therefore, the data set fits the model specifications very well; thus, the derived dynamic conditional correlation series can provide a reasonable inference about the evolution of correlations over time. In addition, the findings in
Table 3 suggest a negative correlation among sukuk returns and the commodity indices.
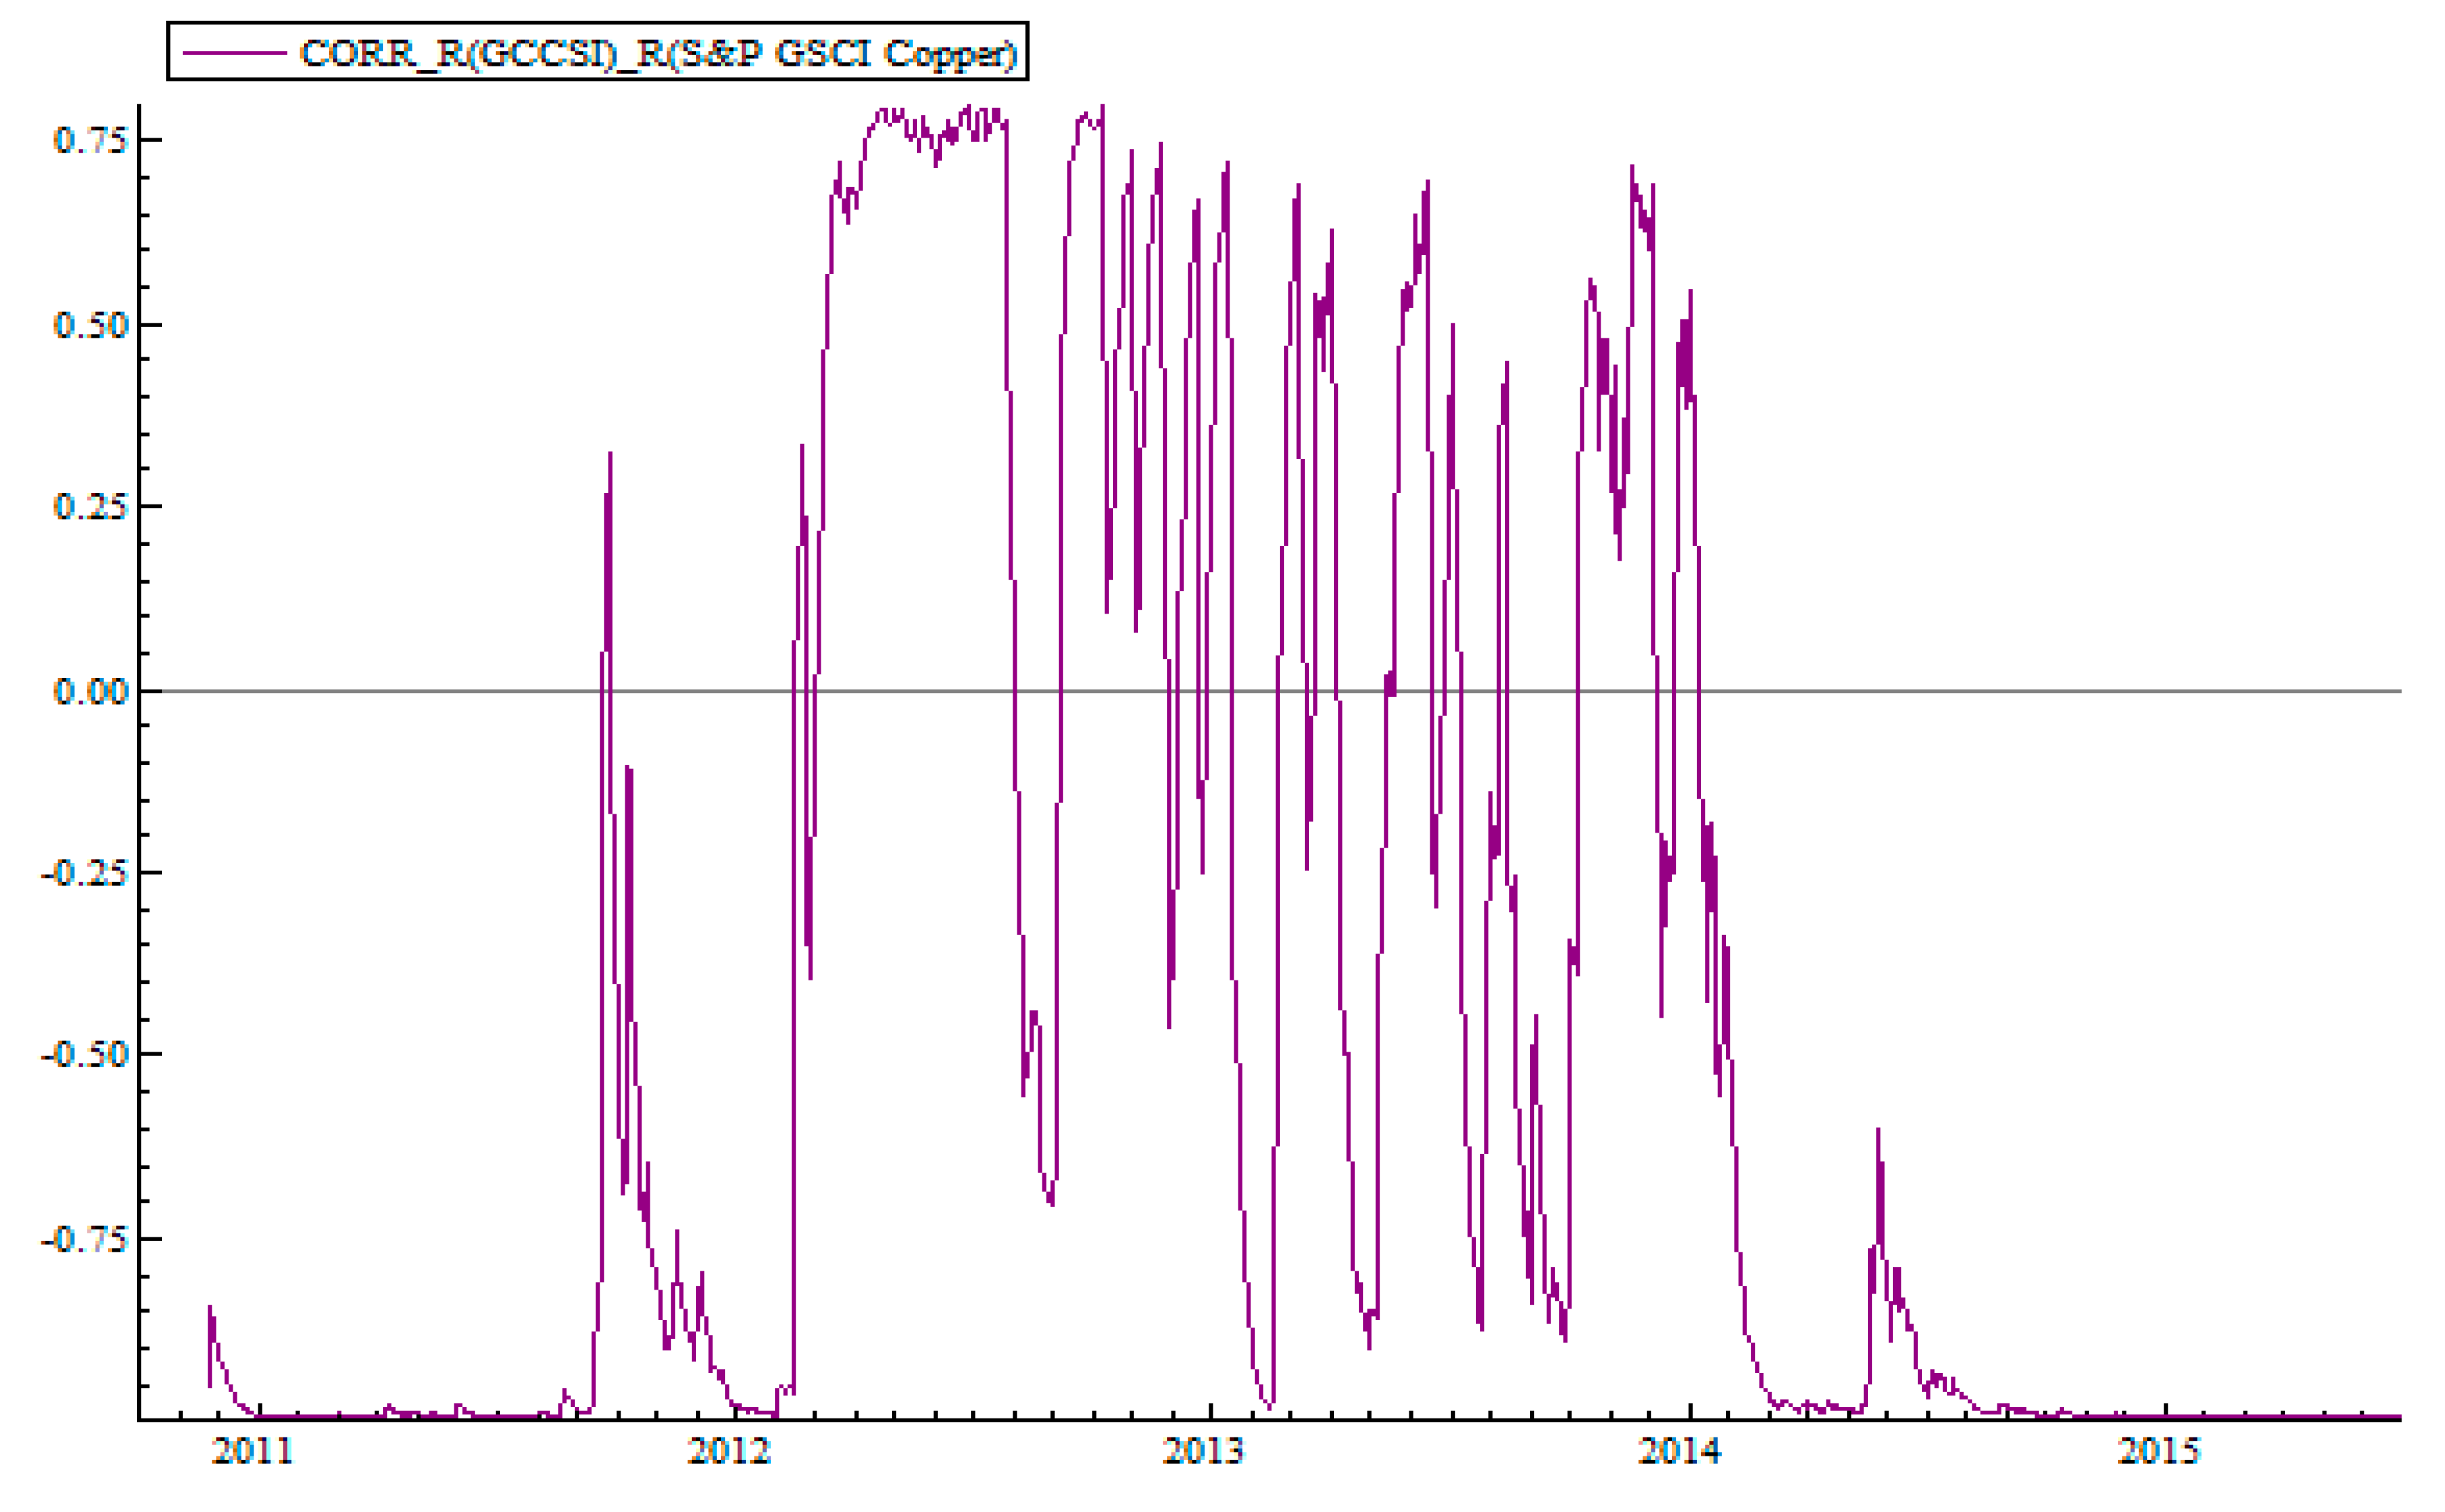
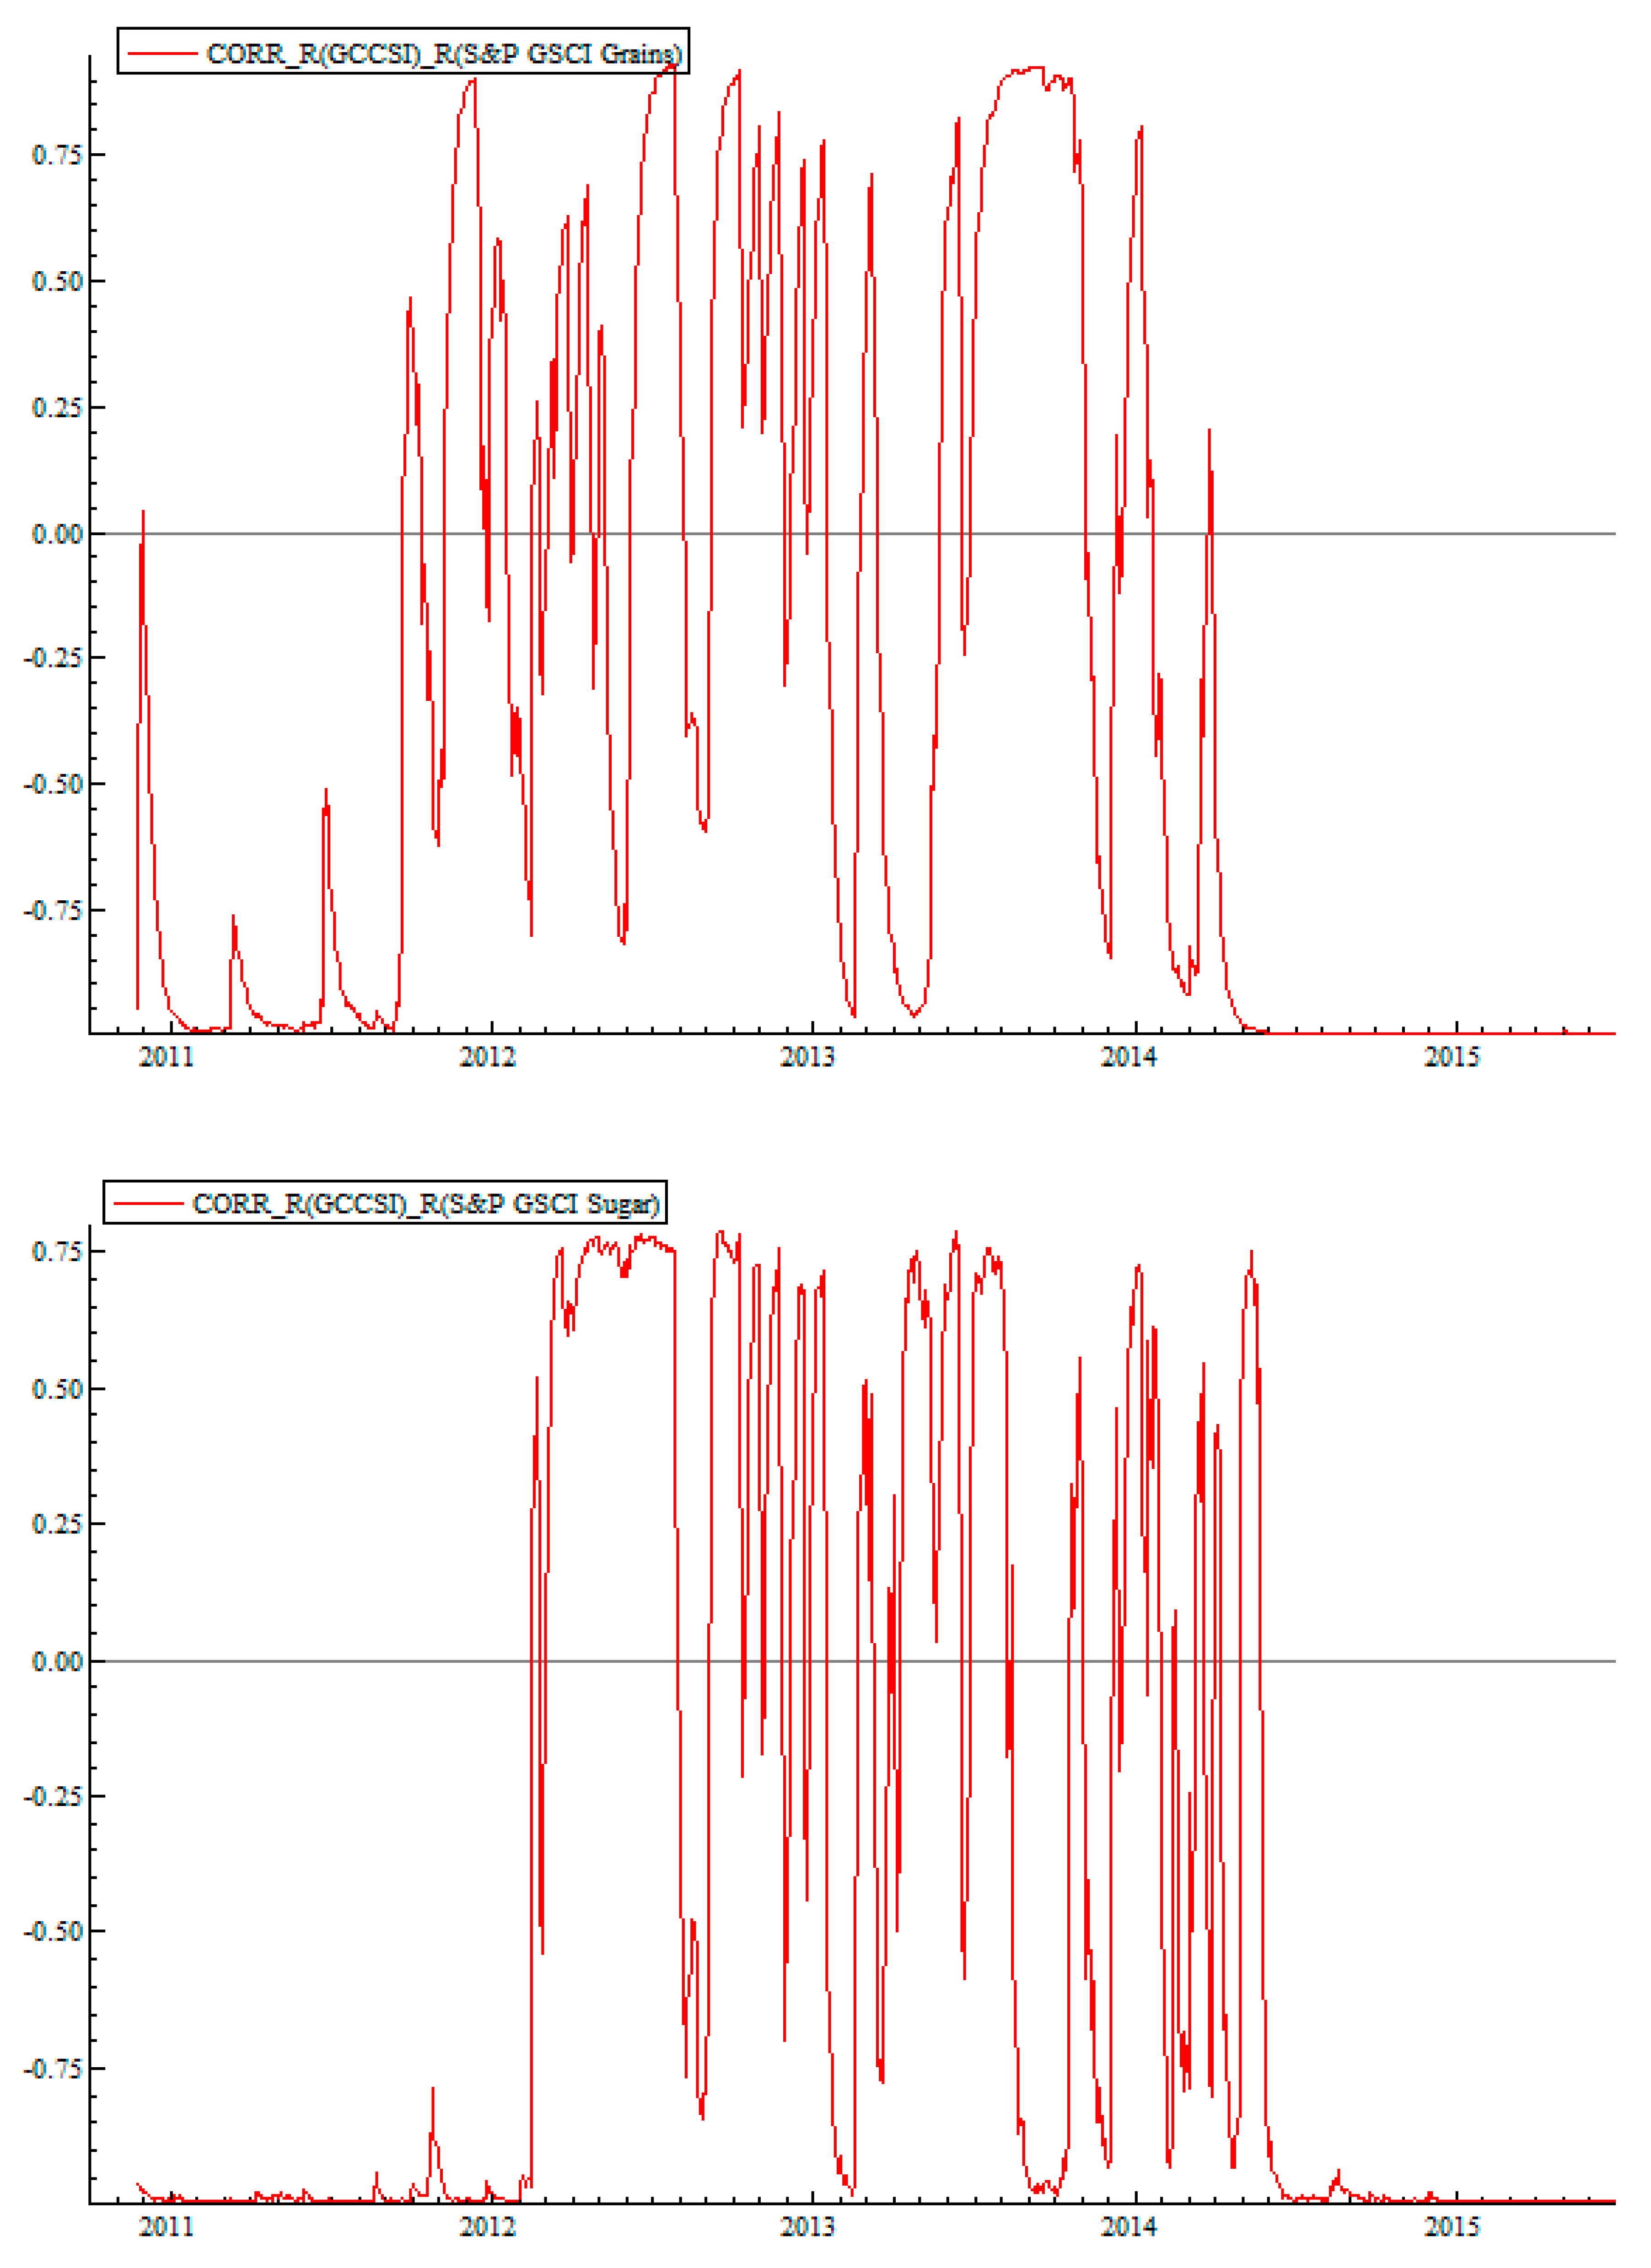
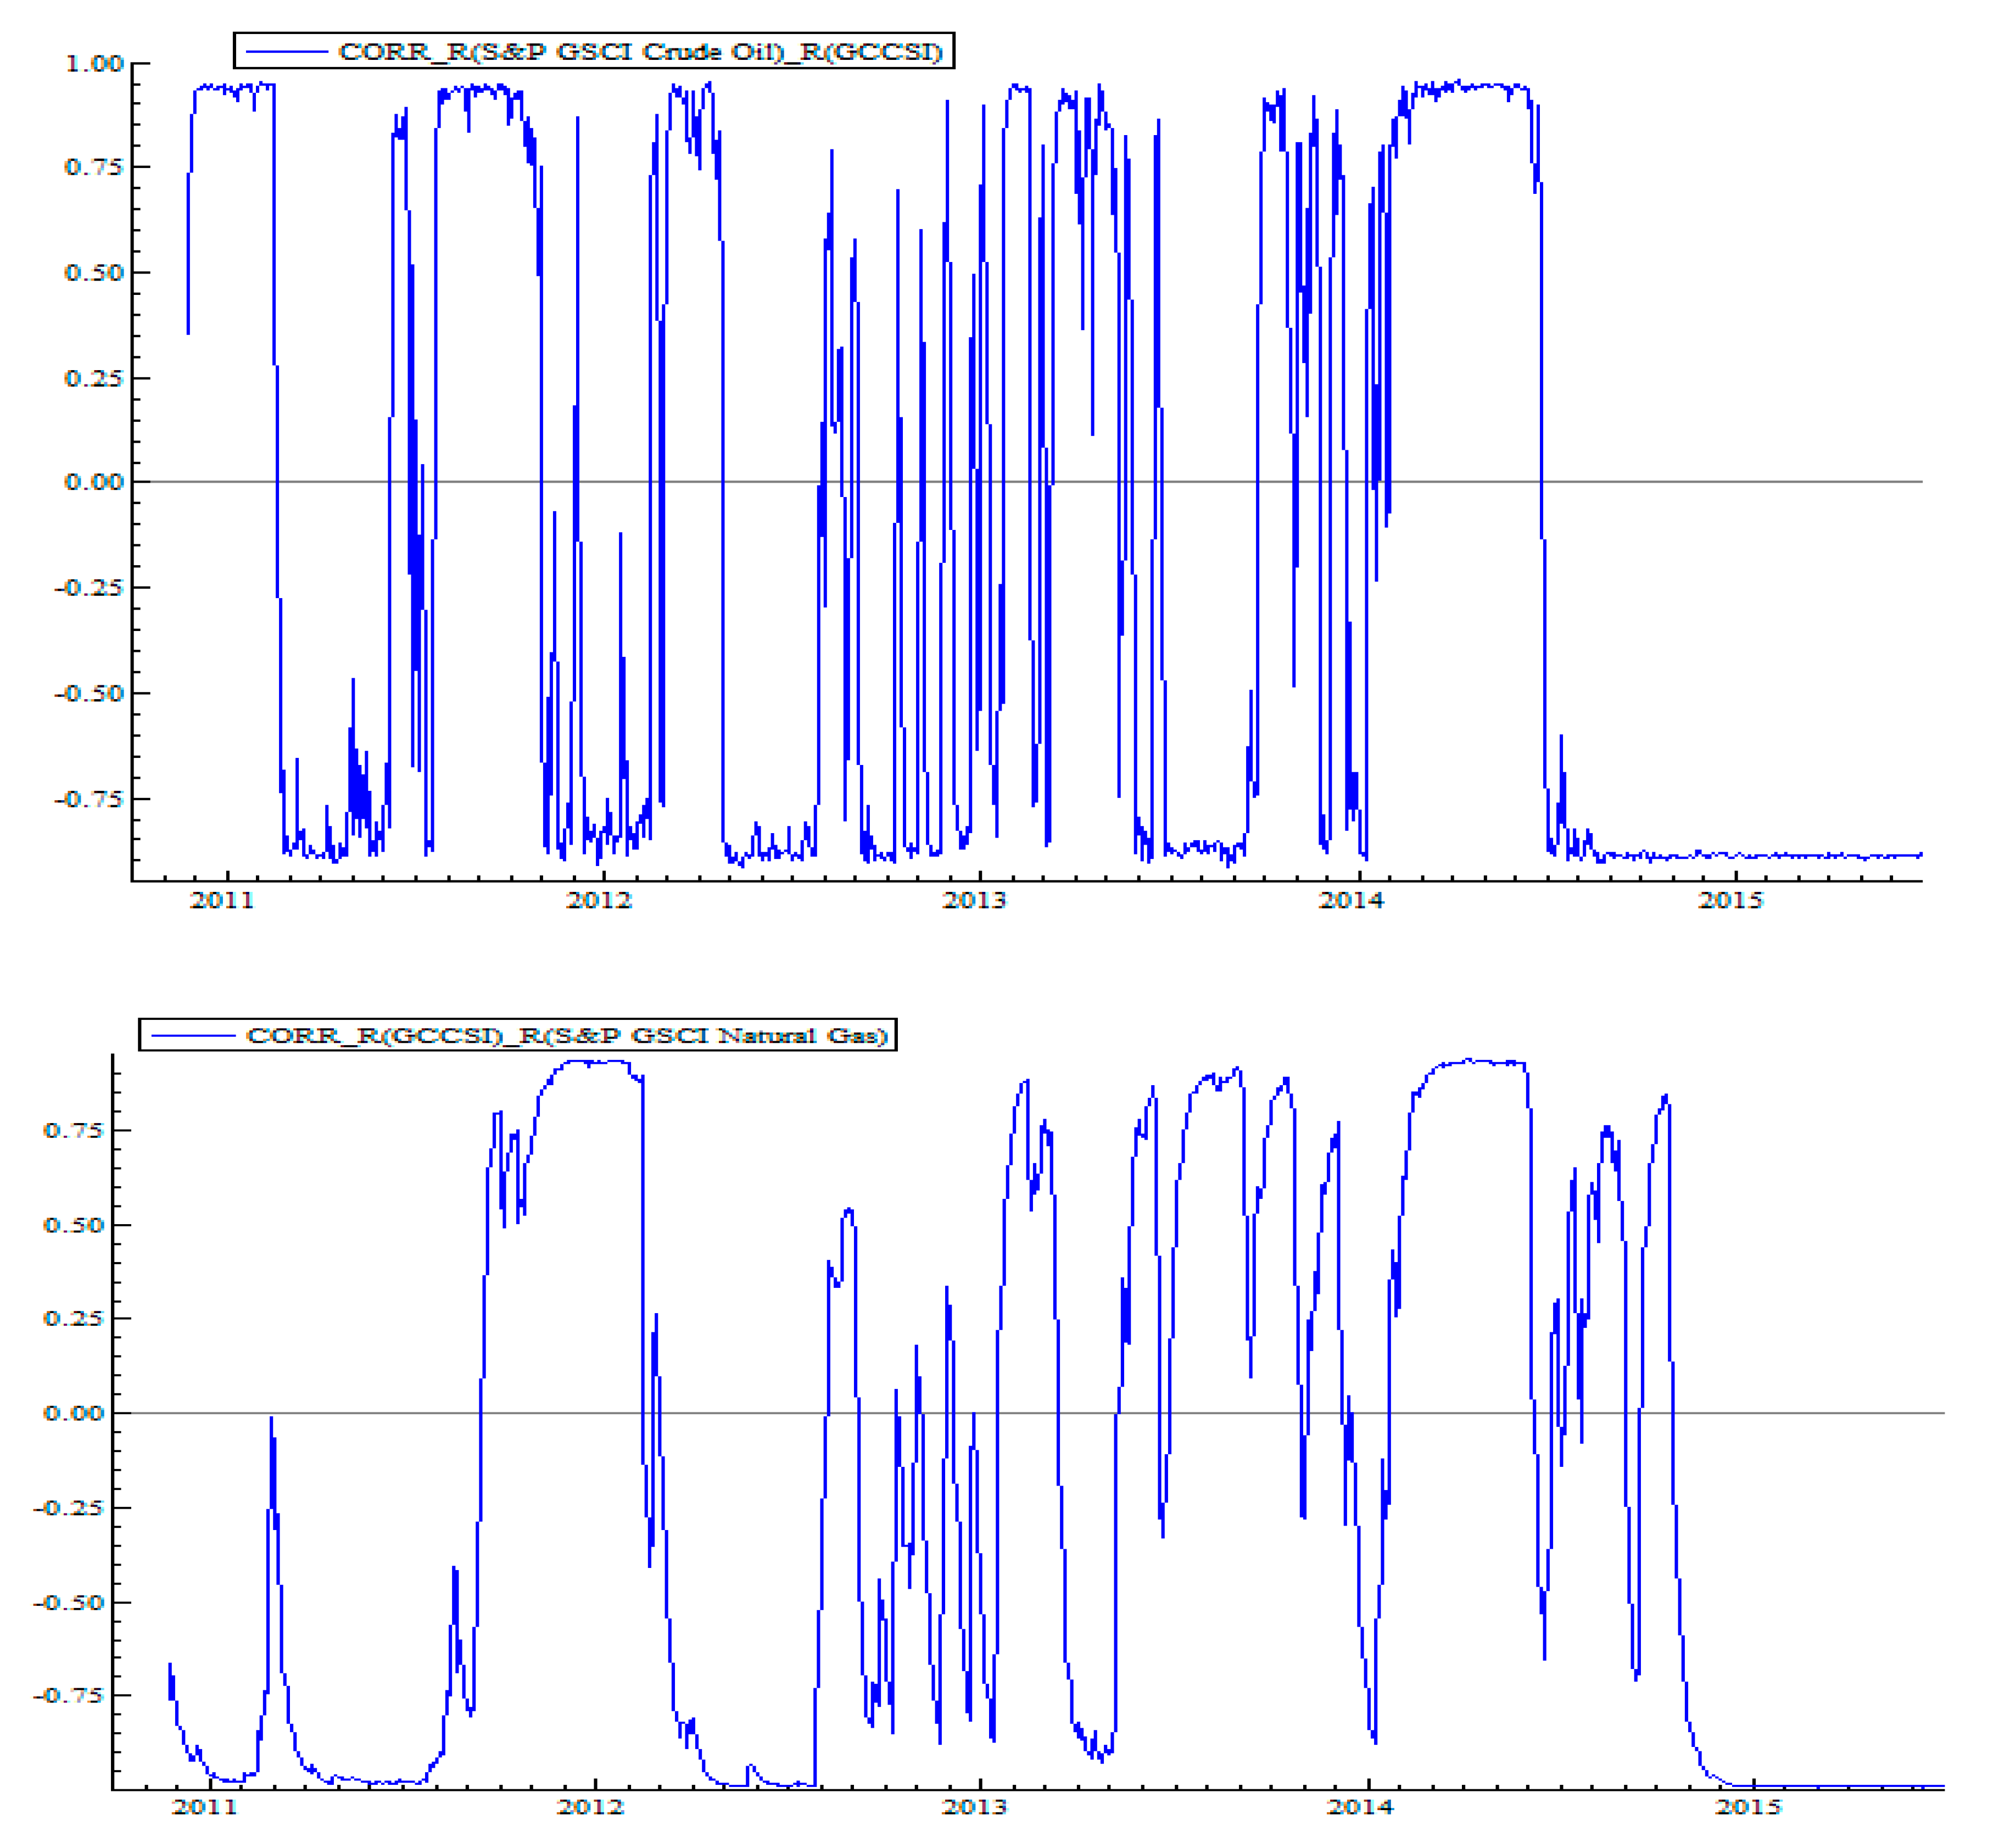
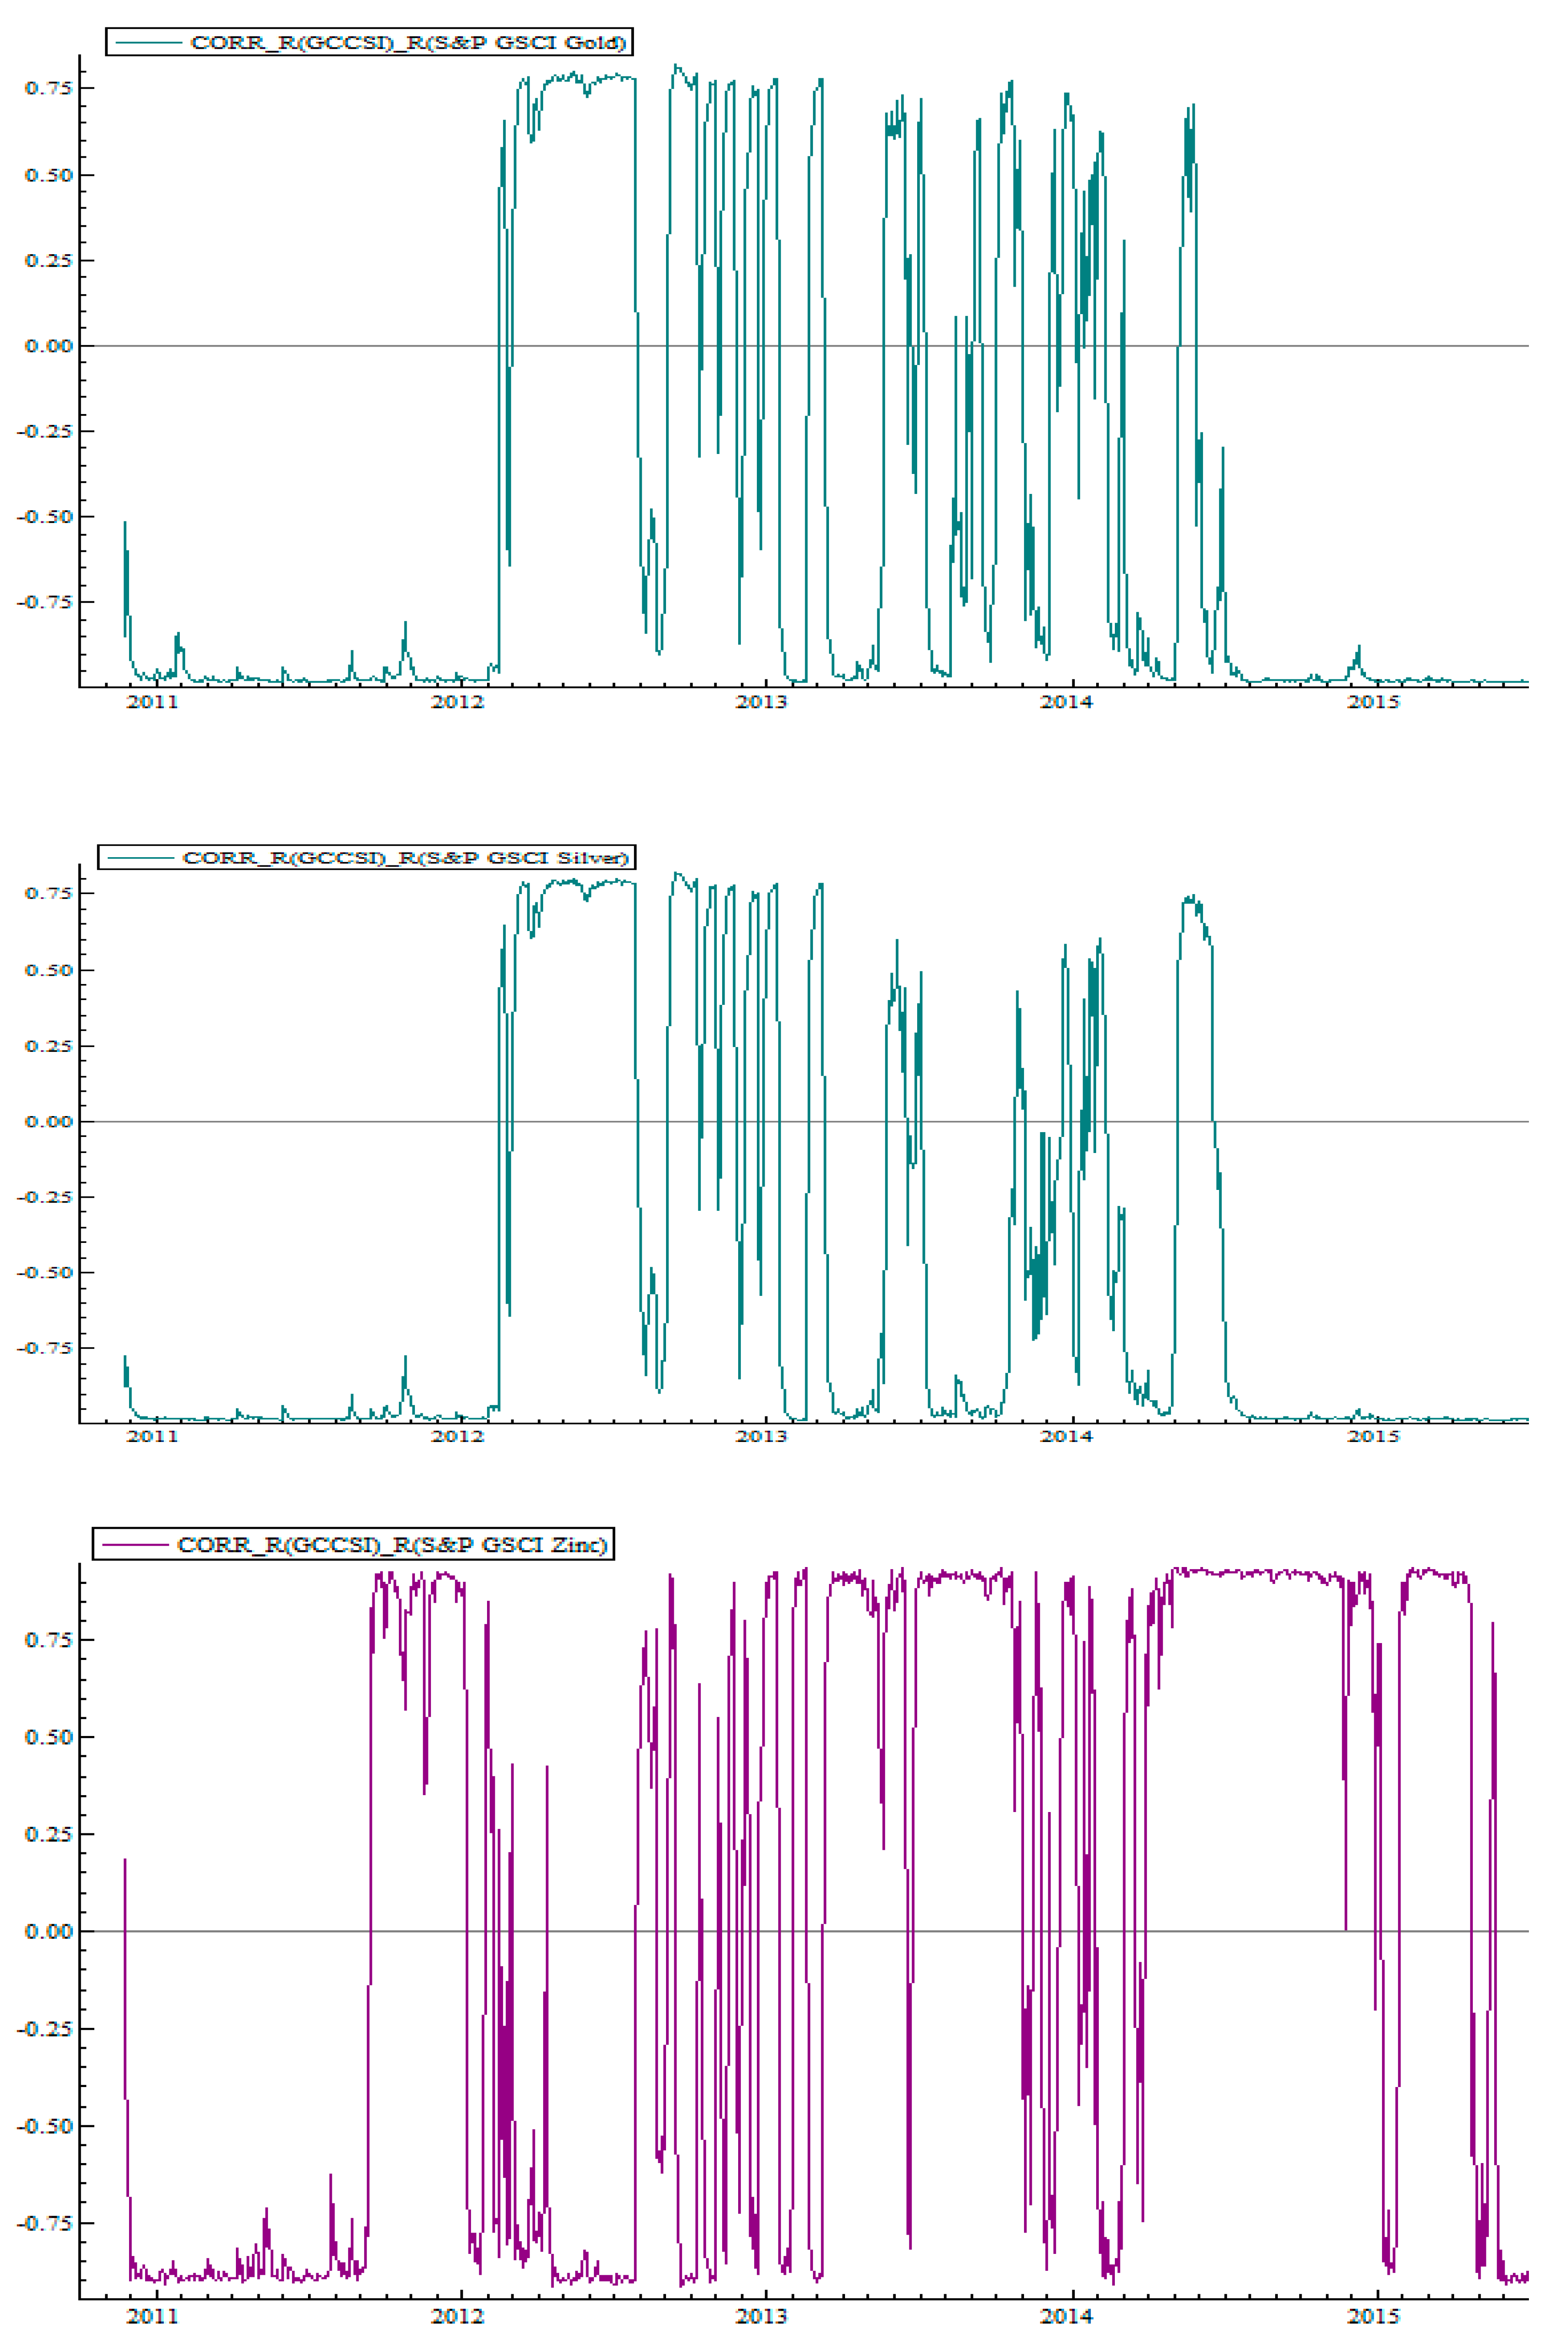
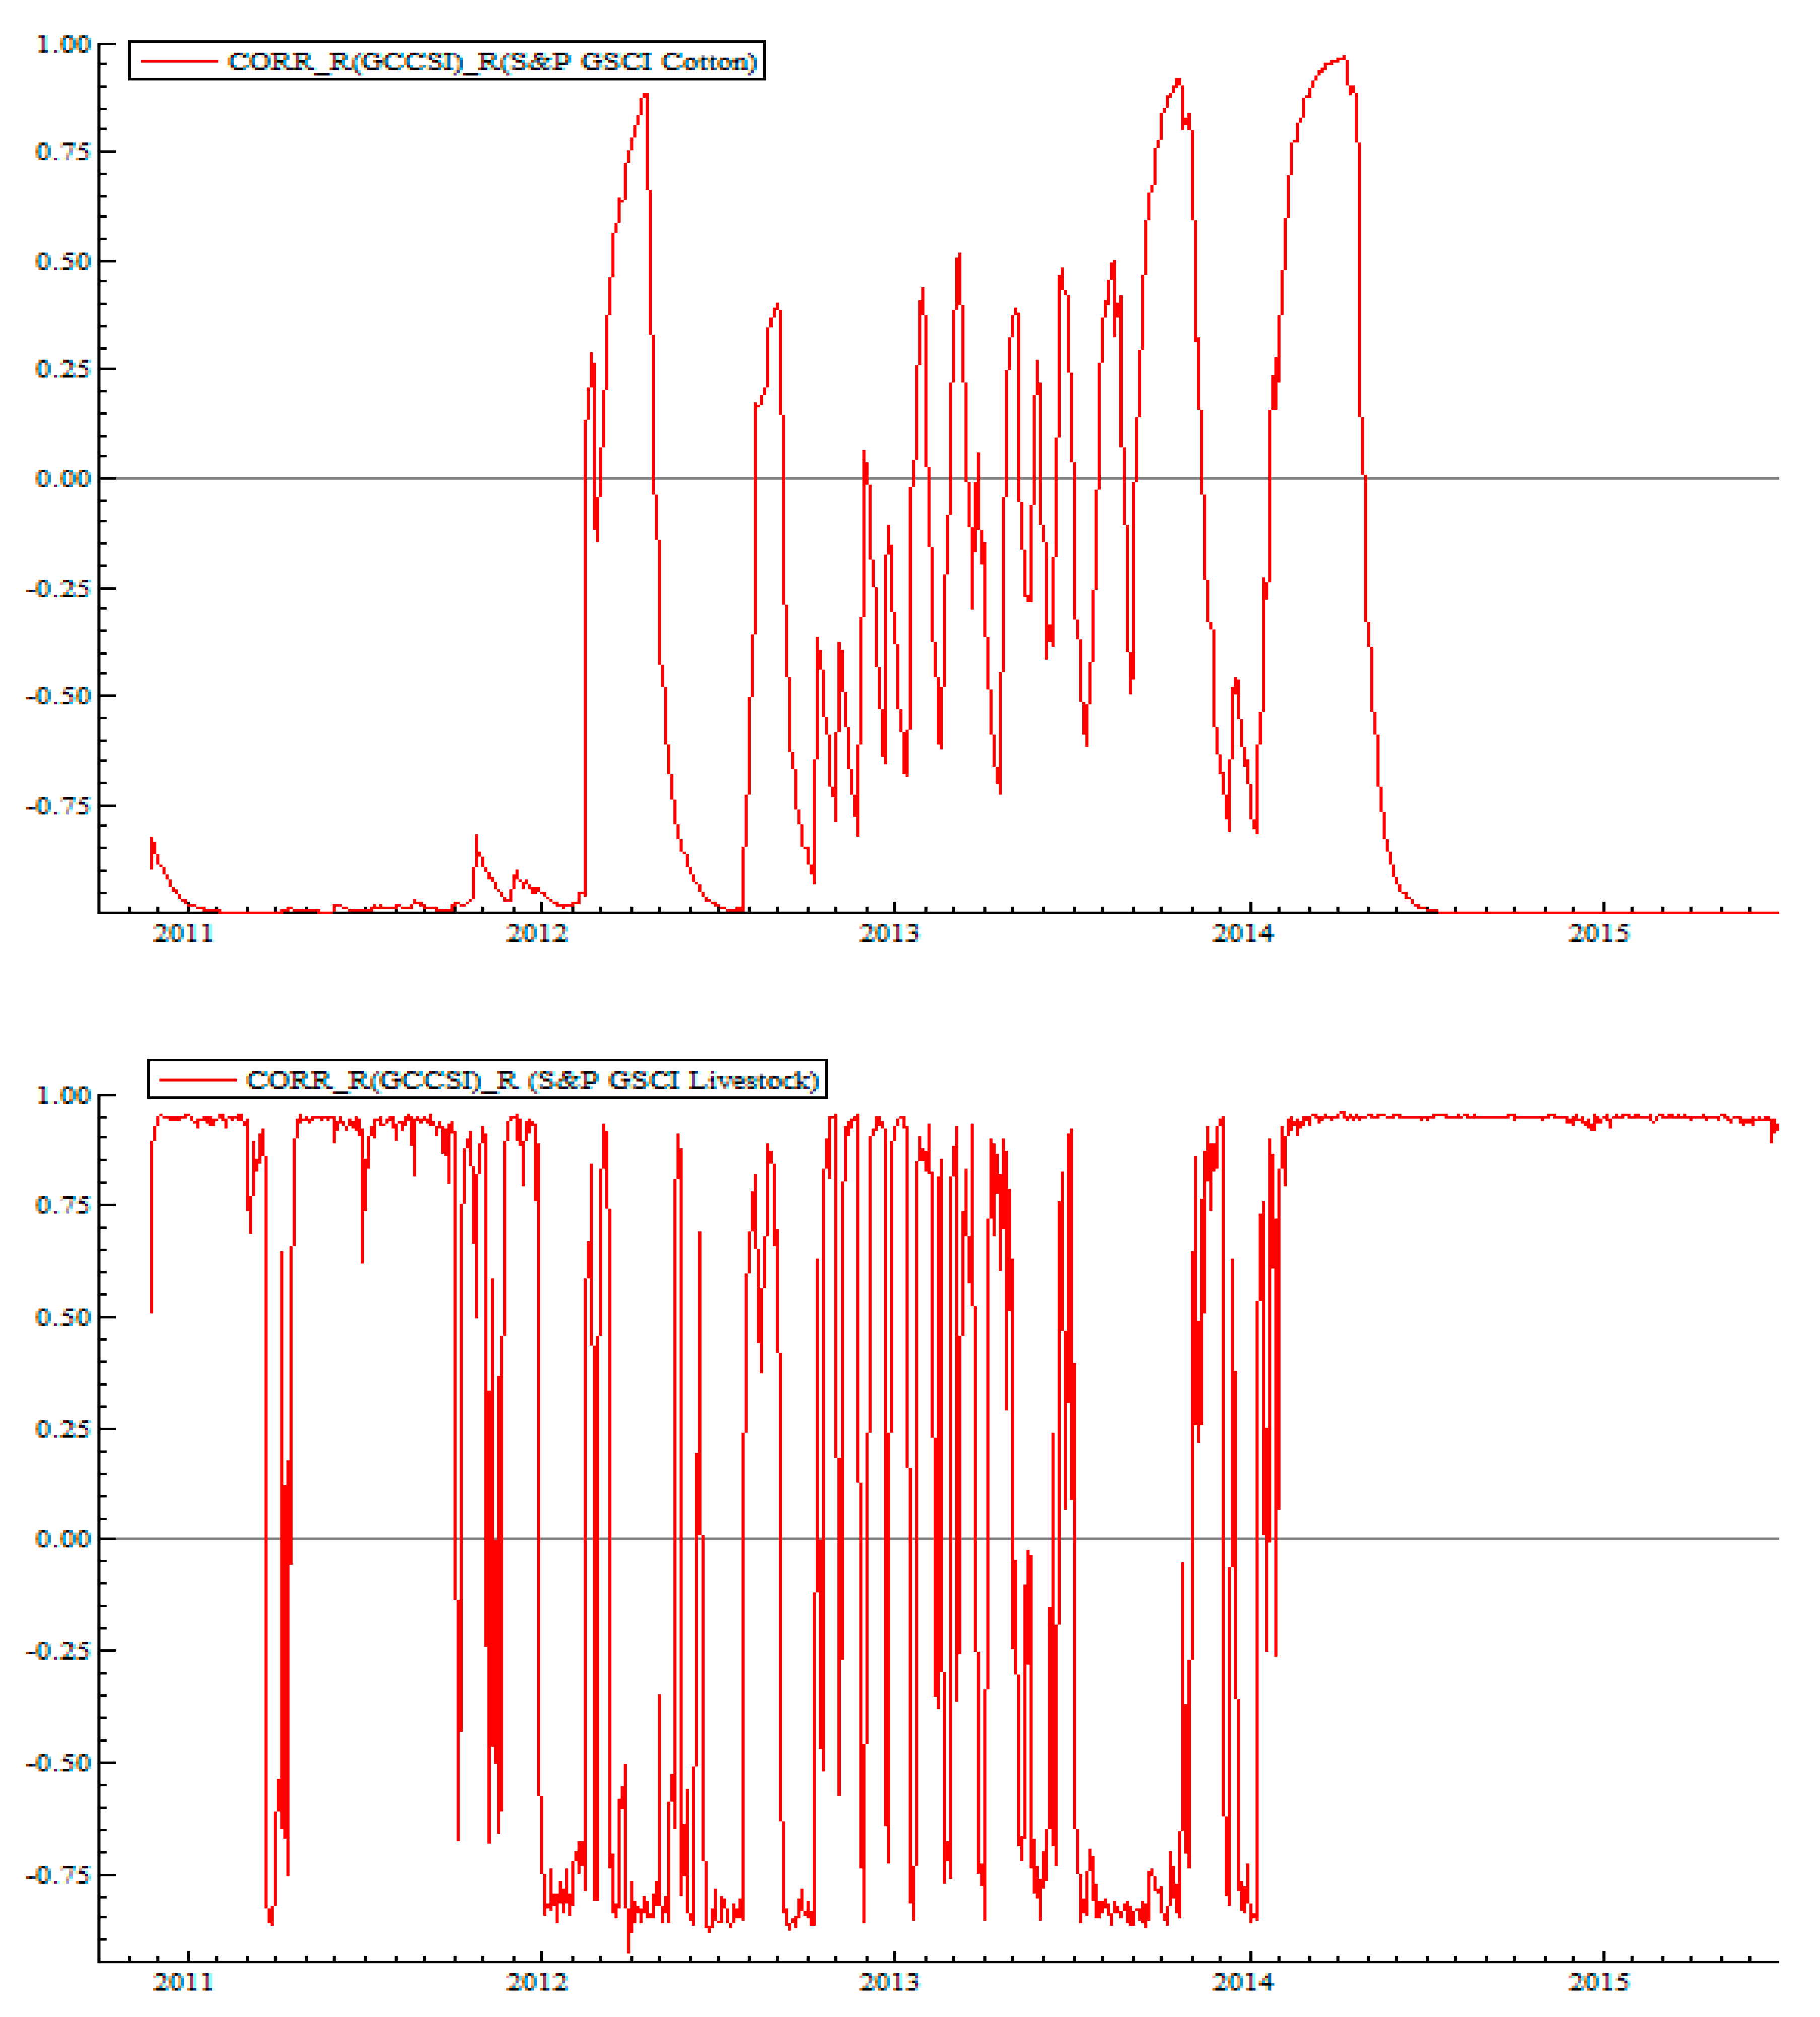
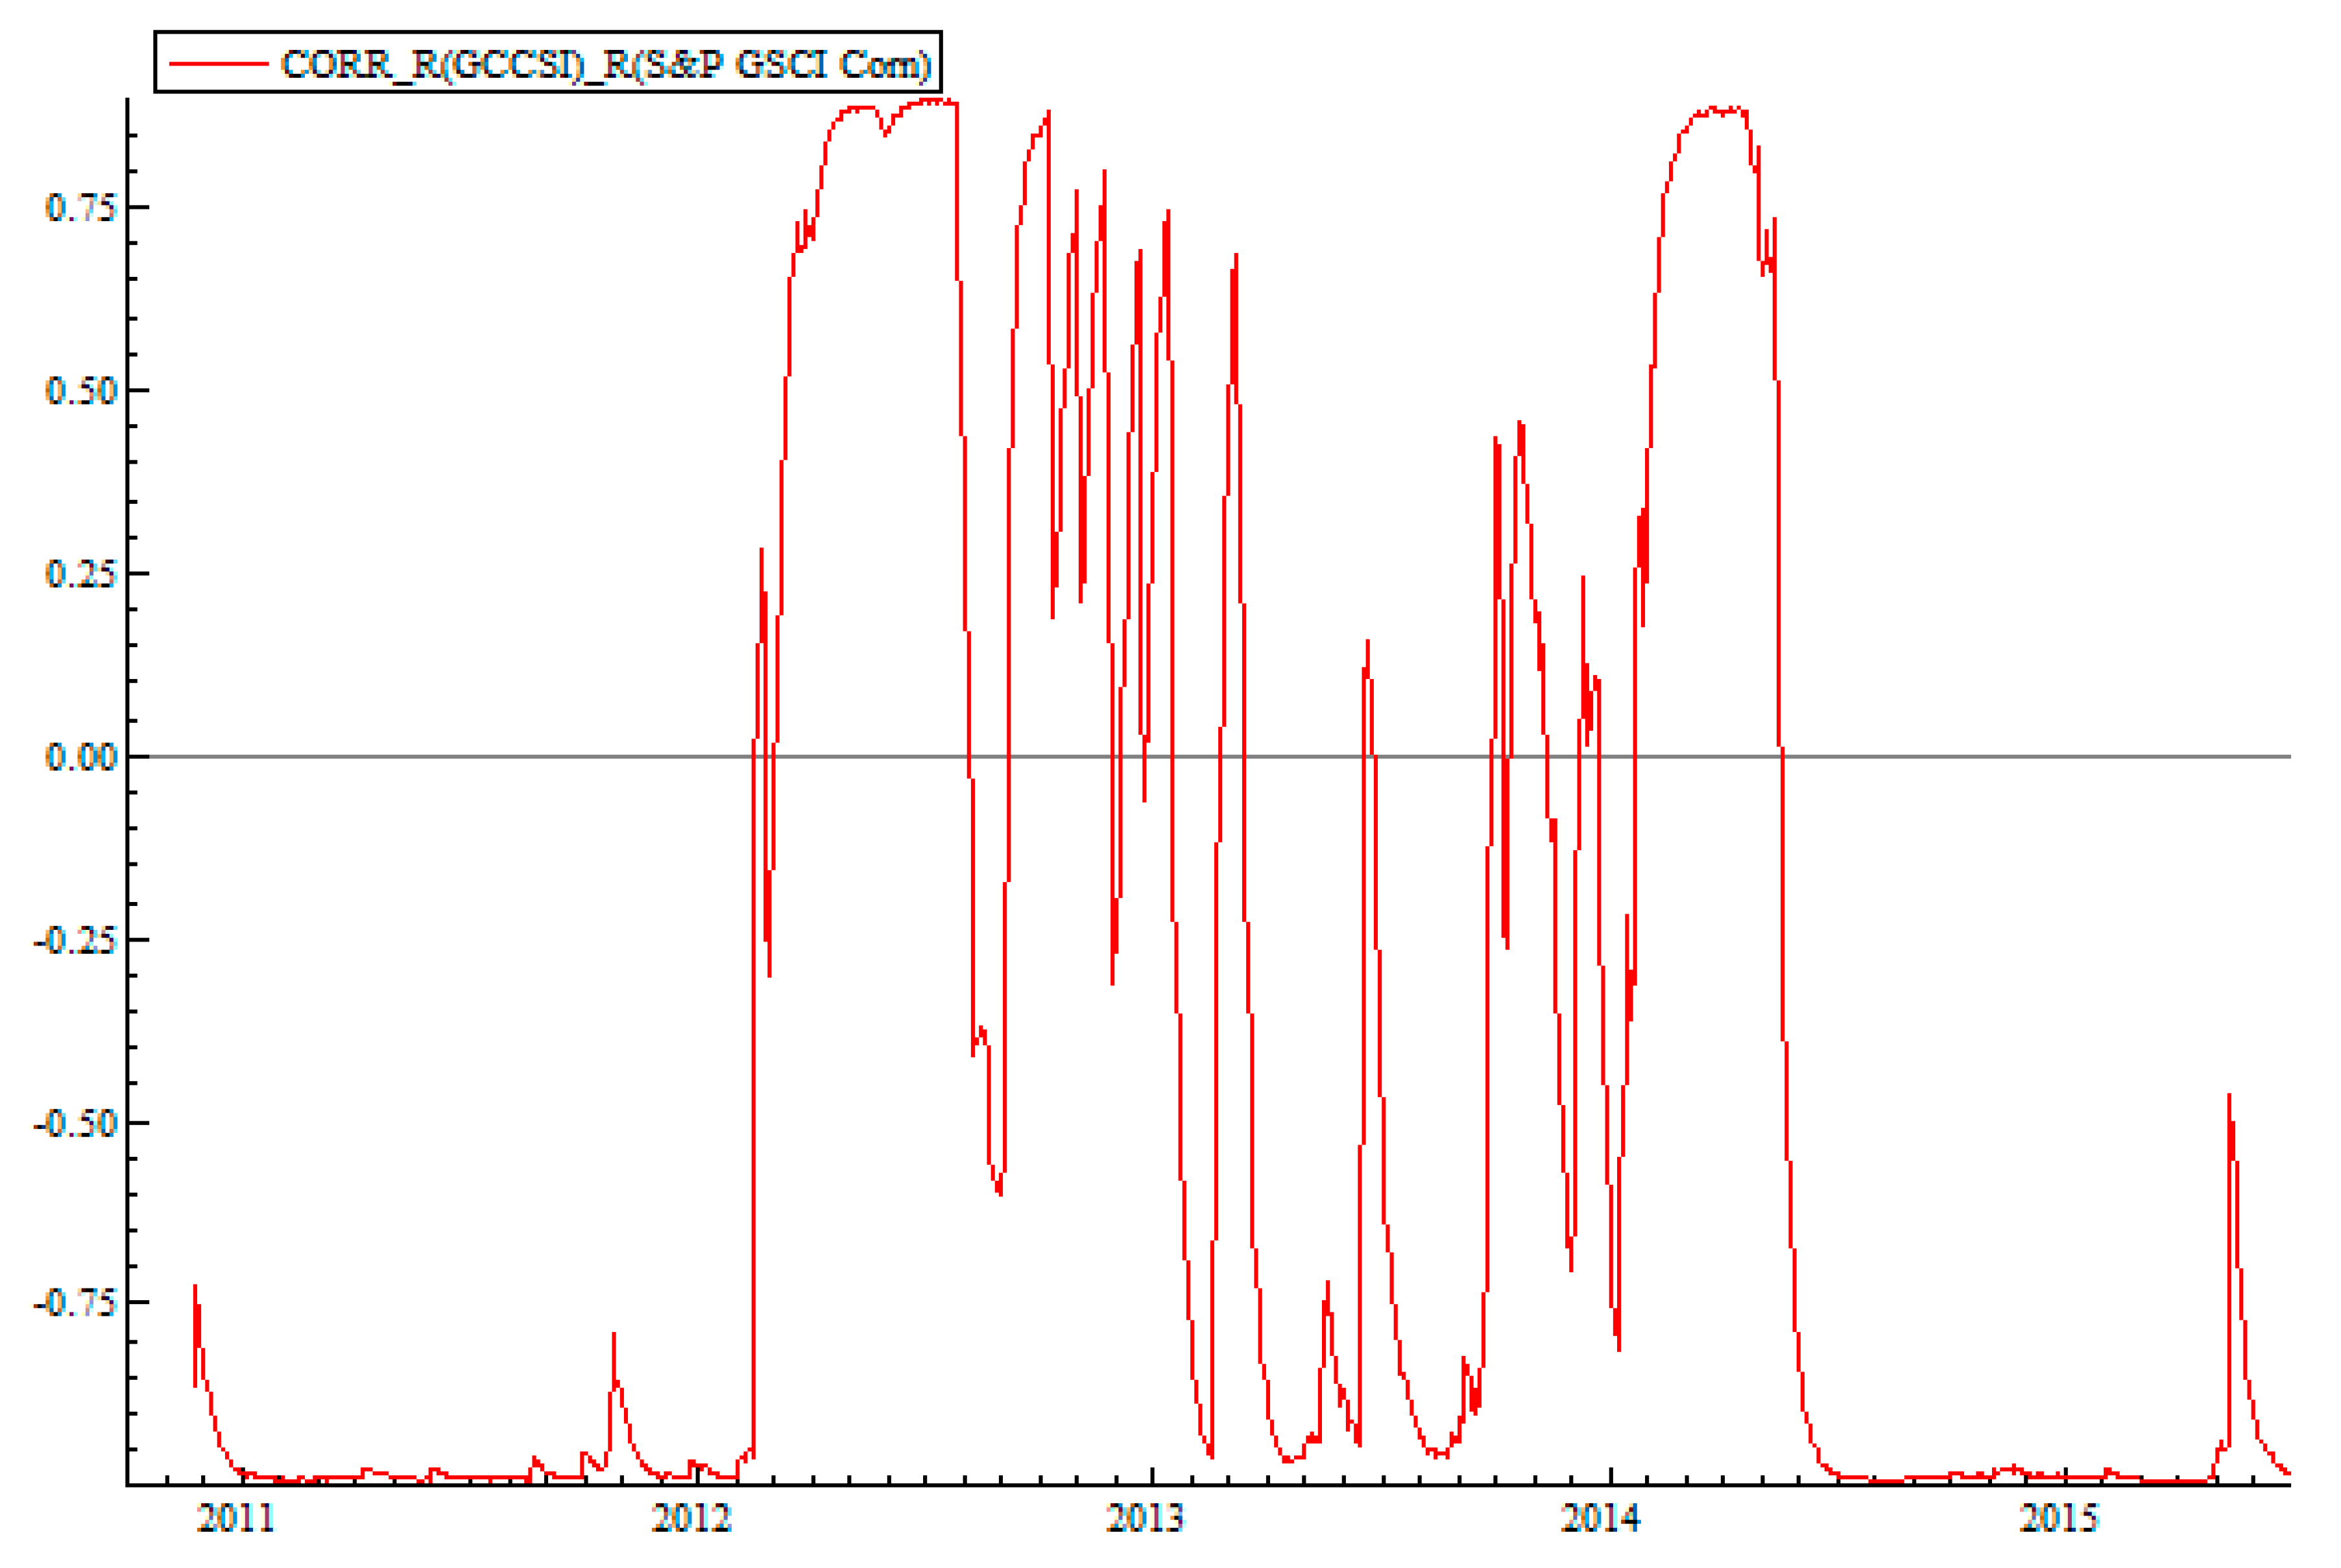
Figure 4 and
Figure 5 plot the estimated dynamic conditional correlations (DCC) between the GCC sukuk and commodity indices.
Figure 4 and
Figure 5 show that dynamic conditional correlation between time series in question is not stable across time and is varying substantively from −0.5 to 0.5 and close to zero in the long run. There are sharp moves in correlation coefficient in the short run from negative to positive values. In the 2015 year most graphs show correlation close to −1. The GCC sukuk and commodity pairs exhibit an average negative dynamic conditional correlation between these assets. This result is consistent with the study of
Aloui et al. (
2015), which provided evidence of negative dynamic correlation between sukuk and Sharia-compliant stocks in GCC countries. From the DCC plots, we notice that the patterns of the DCC values differ from one pair to another. For example, the DCC values for the GCCSI-Oil pair reach their highest levels at the end of 2014, which was at the height of the June 2014 collapse in oil prices. Even though the patterns of the DCC values differ from one pair to another, we can easily observe significant behavioral shifts from 2012 to 2014, when commodity prices experienced a boom.
7. Conclusions
The global economy is highly influenced by commodity price dynamics, which are the consequence of market-specific supply and demand. Recently, local and international investors have considered commodities as investment instruments due to the potential benefits of market diversification. The inclusion of commodities in investment portfolios is important for portfolio allocation and risk management practices. The continuous growth of Islamic securities has raised the question of whether they can move with global markets, including commodity markets.
In this paper, we investigated the volatility behavior and the dynamic co-movements between sukuk and international commodity markets. Multivariate GARCH models with dynamic conditional correlations (DCC) were estimated. Empirical results of the DCC values for all pairs exhibit fluctuations over the entire sample period, suggesting that the assumption of constant correlations is not appropriate. Moreover, we find a time-varying negative correlation between GCC sukuk returns and commodity price changes. The fact that commodity markets are more sensitive to global financial and macroeconomic conditions alters the dynamic conditional correlation path between commodities and the Islamic financial markets, signaling the process of financialization.
International investors, noncommercial traders (including individual investors, hedge funds, and financial institutions) and faith-based investors are interested in measuring cross-border dependence and dynamic changes between sukuk and global commodity markets. Portfolio managers can tap into our empirical results by combining the commodity and sukuk indices to hold optimal portfolio weights and hedge ratios for different market conditions. Moreover, investors could also obtain diversification benefits from including sukuk in a well-diversified commodity portfolio, given the time-varying negative correlation between sukuk returns and commodity prices.


