Testing Efficiency of the London Metal Exchange: New Evidence


Abstract
:1. Introduction
2. Literature Review
3. Research Design
3.1. Regression Model
3.2. Data and Sample Construction
4. Empirical Results
4.1. Regression Results
4.2. The Joint Hypothesis Test
4.3. Robustness Tests
5. Summary and Conclusions
Author Contributions
Conflicts of Interest
References
- Arouri, Mohamed El Hedi, Fredj Jawadi, and Prosper Mouak. 2011. The Speculative Efficiency of the Aluminum Market: A Nonlinear Investigation. International Economics 126–27: 73–89. [Google Scholar] [CrossRef]
- Beck, Stacie E. 1994. Cointegration and Market Efficiency in Commodities Futures Markets. Applied Economics 26: 249–57. [Google Scholar] [CrossRef]
- Canarella, Giorgio, and Stephen K. Pollard. 1986. The “Efficiency” of the London Metal Exchange: A Test with Overlapping and Non-Overlapping Data. Journal of Banking and Finance 10: 575–93. [Google Scholar] [CrossRef]
- Cheng, Ing-Haw, and Wei Xiong. 2014. Financialization of Commodity Markets. Annual Review of Financial Economics 6: 419–41. [Google Scholar] [CrossRef]
- Cheng, Ing-Haw, Andrei Kirilenko, and Wei Xiong. 2015. Convective Risk Flows in Commodity Futures Markets. Review of Finance 19: 1733–81. [Google Scholar] [CrossRef]
- Chinn, Menzie D., and Olivier Coibion. 2014. The Predictive Content of Commodity Futures. The Journal of Futures Markets 34: 607–636. [Google Scholar] [CrossRef]
- Ewing, Bradley T., and Farooq Malik. 2013. Volatility Transmission between Gold and Oil Futures under Structural Breaks. International Review of Economics and Finance 25: 113–21. [Google Scholar] [CrossRef]
- Fama, Eugene F. 1970. Efficient Capital Markets: A Review of Theory and Empirical Work. Journal of Finance 25: 383–417. [Google Scholar] [CrossRef]
- Figuerola-Ferretti, Isabel, and Christopher L. Gilbert. 2008. Commonality in the LME Aluminum and Copper Volatility Processes through a FIGARCH Lens. The Journal of Futures Markets 28: 935–62. [Google Scholar] [CrossRef]
- Goss, Barry A. 1981. The Forward Pricing Function of the London Metal Exchange. Applied Economics 13: 133–50. [Google Scholar] [CrossRef]
- Goss, Barry A., ed. 1985. The Forward Pricing Function of the London Metal Exchange. In Futures Markets: Their Establishment and Performance. London: Routledge, pp. 157–73. [Google Scholar]
- Gross, Martin. 1988. A Semi-Strong Test of the Efficiency of the Aluminum and Copper Markets at the LME. The Journal of Futures Markets 8: 67–77. [Google Scholar] [CrossRef]
- Hansen, Lars Peter, and Robert J. Hodrick. 1980. Forward Exchange Rates as Optimal Predictors of Spot Rates: An Econometric Analysis. Journal of Political Economy 88: 829–53. [Google Scholar] [CrossRef]
- Kenourgios, Dimitris, and Aristeidis Samitas. 2004. Testing Efficiency of the Copper Futures Market: New Evidence from London Metal Exchange. Global Business and Economics Review, Anthology. pp. 261–71. Available online: https://papers.ssrn.com/sol3/papers.cfm?abstract_id=869390 (accessed on 27 February 2018).
- MacDonald, Ronald, and Mark Taylor. 1988. Metal Prices, Efficiency and Cointegration: Some Evidence from the LME. Bulletin of Economic Research 40: 235–39. [Google Scholar] [CrossRef]
- Otto, Sascha Werner. 2011. A Speculative Efficiency Analysis of the London Metal Exchange in a Multi-Contract Framework. International Journal of Economics and Finance 3: 3–16. [Google Scholar] [CrossRef]
- Park, Jaehwan. 2017. Effect of Speculators’ Position Changes in the LME Futures Market, Working Paper, under review.
- Park, Jaehwan. 2018. Volatility Transmission between Oil and LME Futures. Applied Economics and Finance 5: 65–72. [Google Scholar] [CrossRef]
- Sephton, Peter S., and Donald K. Cochrane. 1990. A Note of the Efficiency of the London Metal Exchange. Economic Letters 33: 341–45. [Google Scholar] [CrossRef]
- Sephton, Peter S., and Donald K. Cochrane. 1991. The Efficiency of the London Metal Exchange: Another Look at the Evidence. Applied Economics 23: 669–74. [Google Scholar] [CrossRef]
- Tang, Ke, and Wei Xiong. 2012. Index Investment and the Financialization of Commodities. Financial Analysts Journal 68: 54–74. [Google Scholar] [CrossRef]
| 1 | The official settlement price is determined by each metal trading session. Each metal trading session is signaled by a bell sound, so the LME open outcry is called the ring market. |
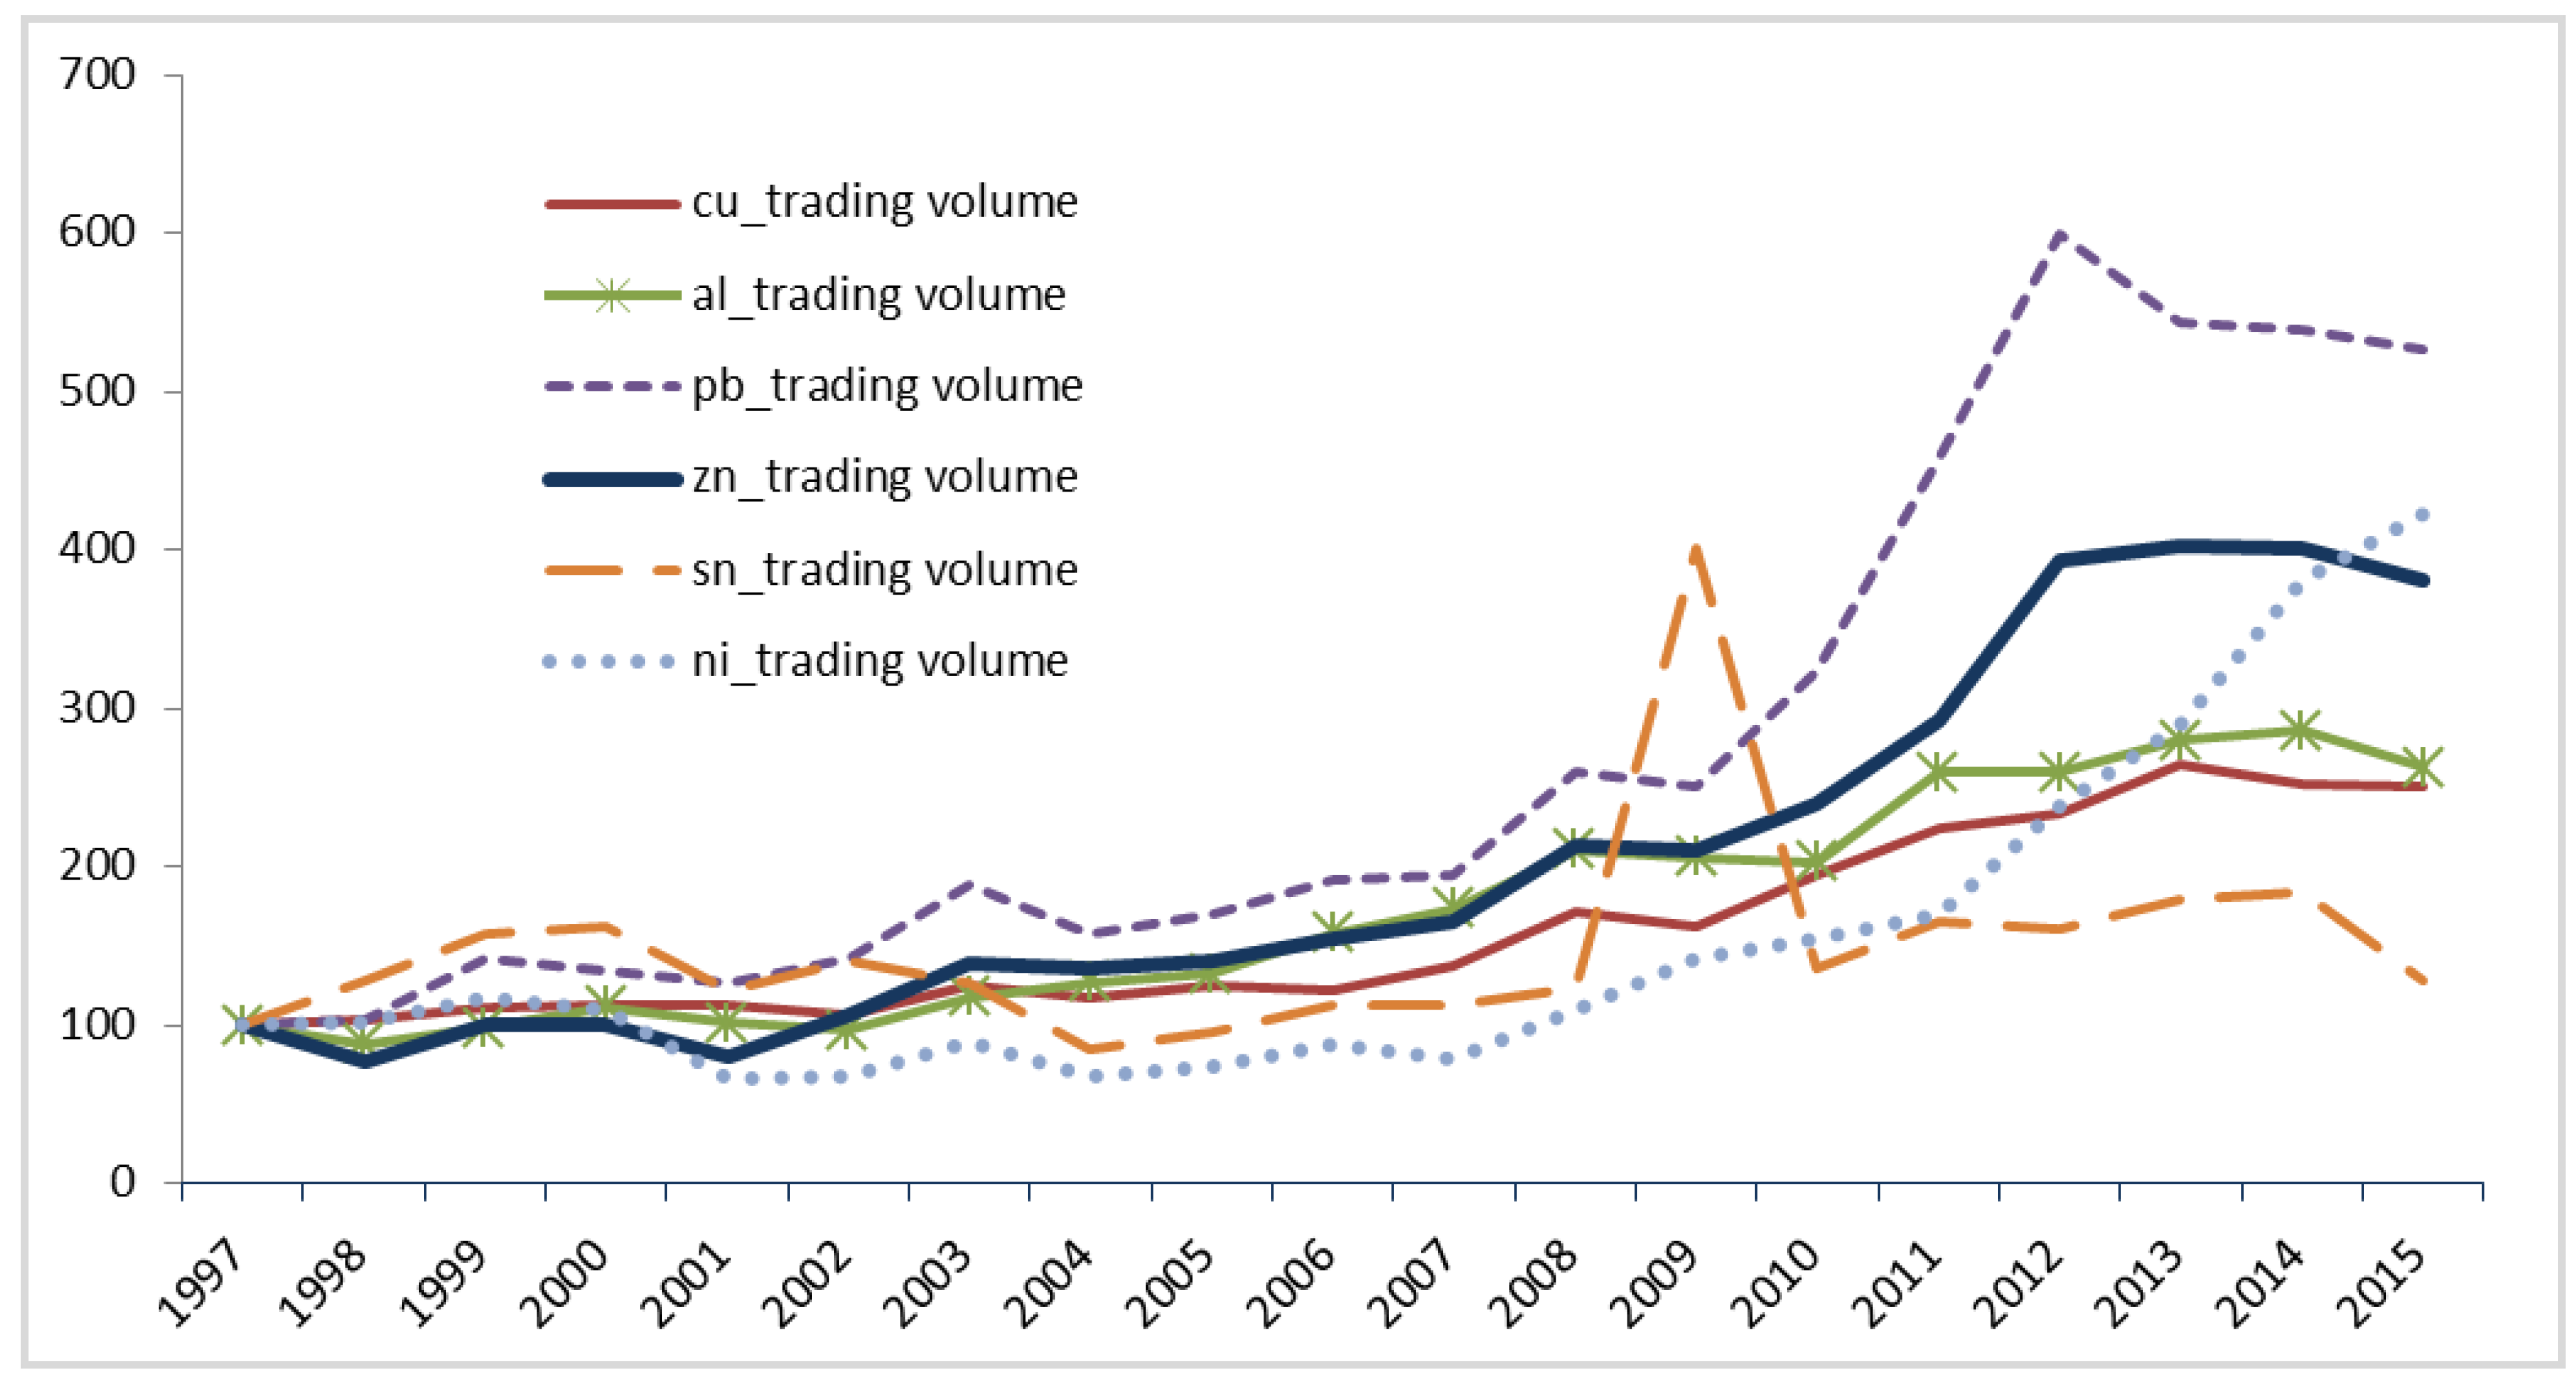
| 2 | Cheng and Xiong (2014) argued that commodity futures had become an important asset class for portfolio investors, much like stocks and bonds over the past decade. According to the CFTC’s (Commodity Futures Trading Commission) paper in 2008, investment money inflow rapidly increased to various commodity futures indices from early 2000 to 30 June 2008, totaling $200 billion. |
| 3 | The LME provides daily spot and 3-month futures prices. To test market efficiency, we can construct non-overlapping observations. This means spot price at time t and lagged t − 3 month futures price. This was obtained by mapping the synchrony between the sampling period and the contract period (see details in Canarella and Pollard (1986)). |
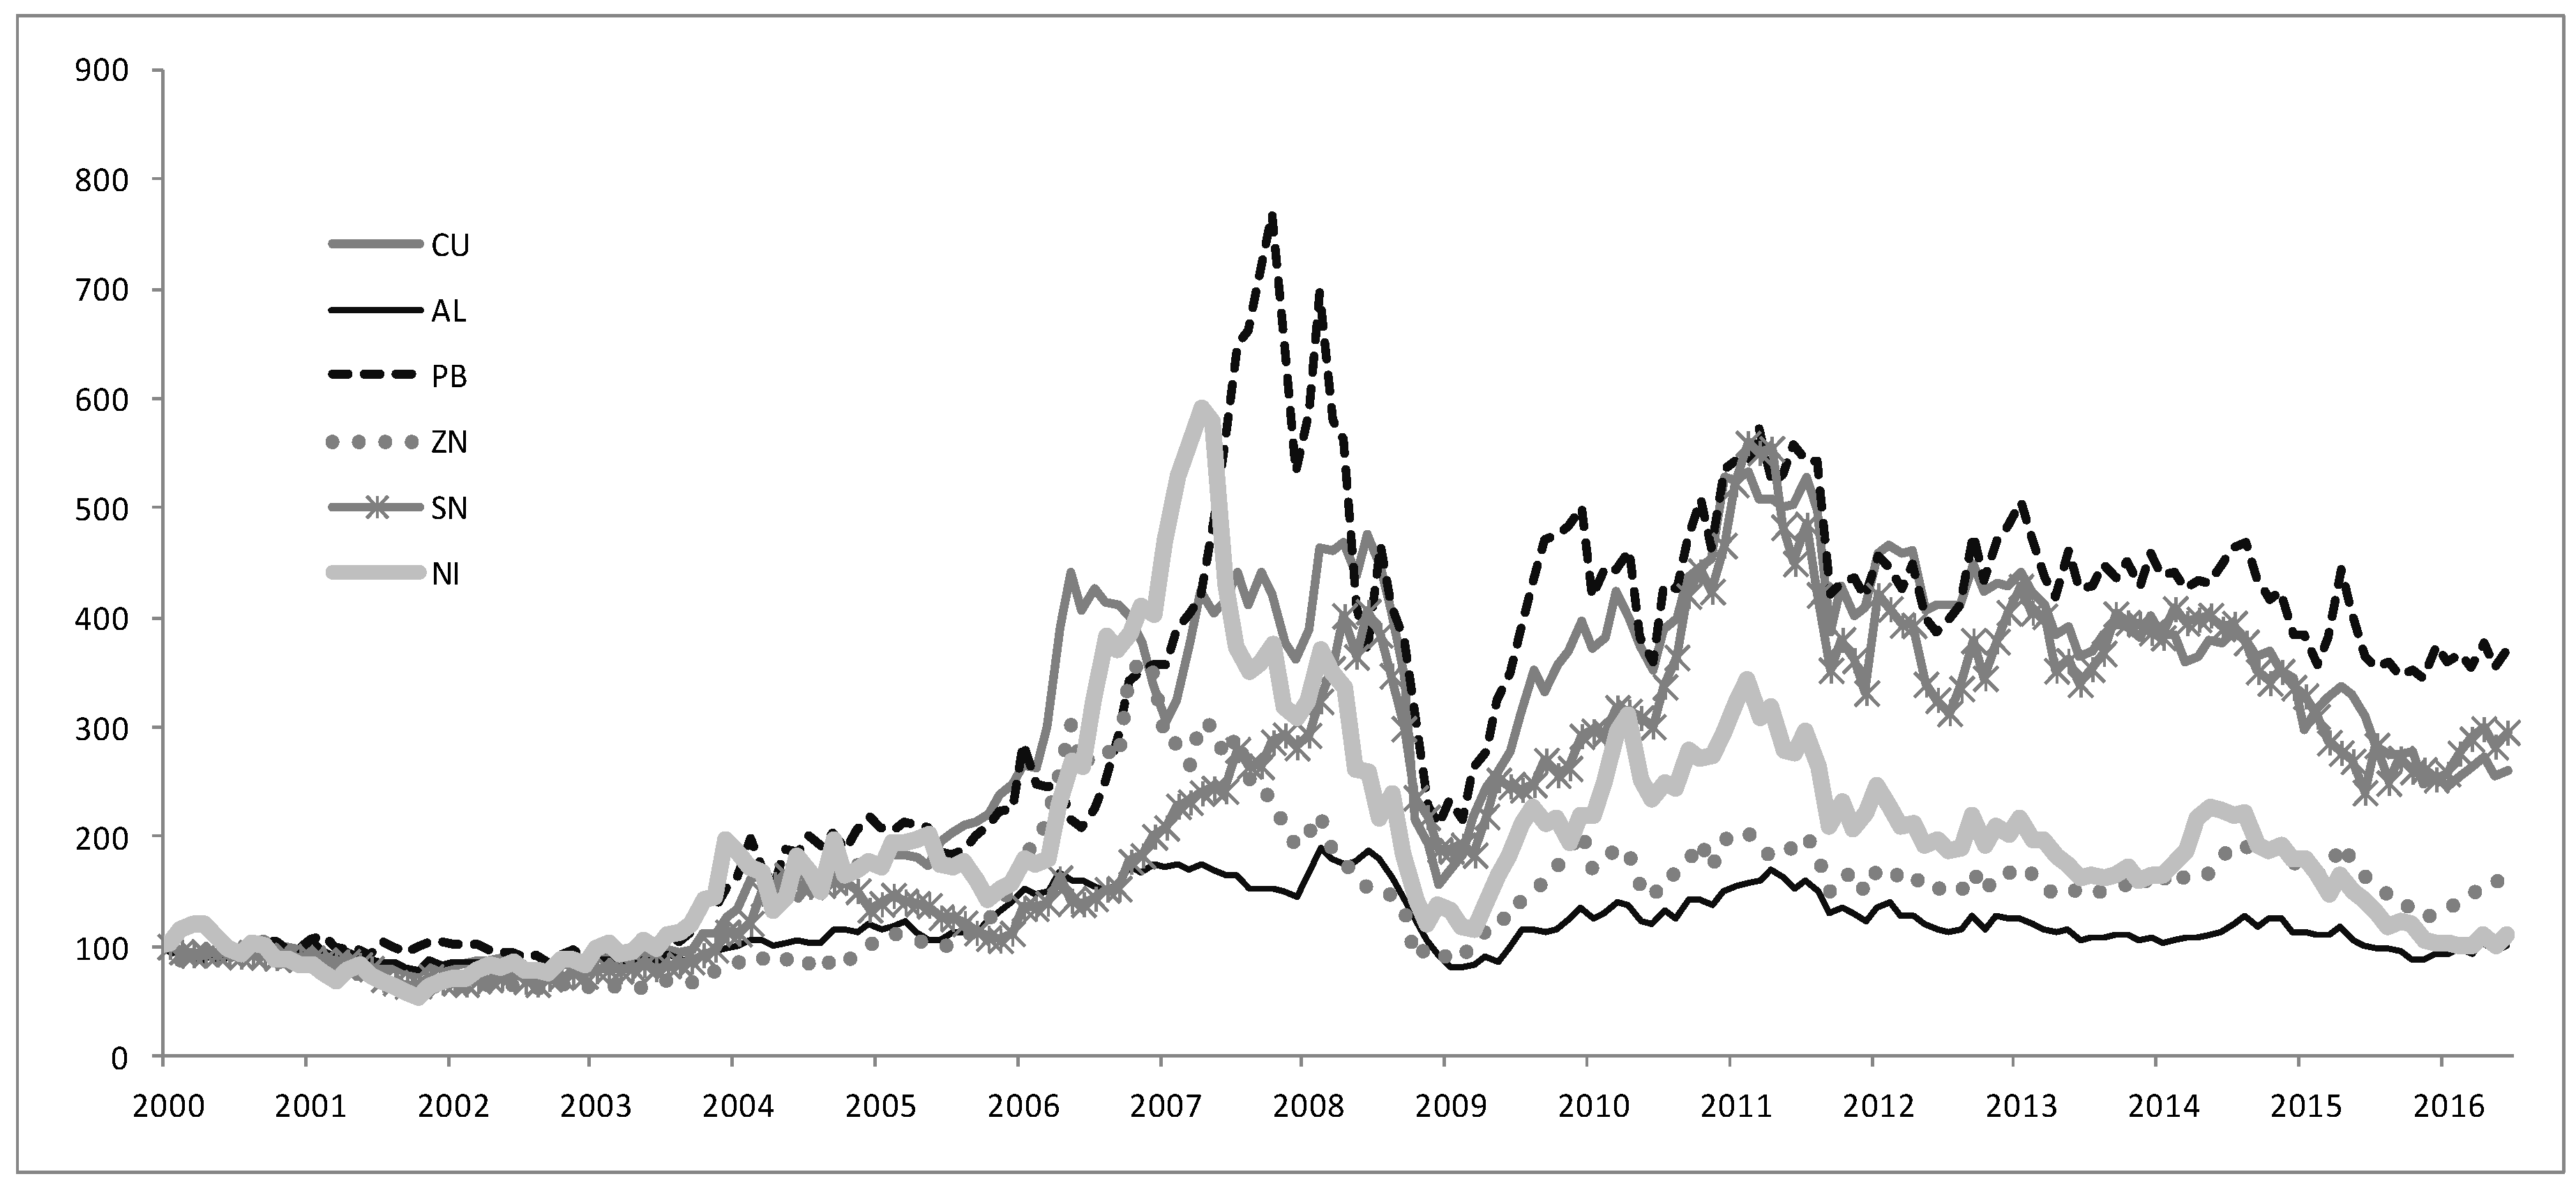
| 4 | Ewing and Malik (2013) found the linkage that existed between the volatilities in oil and gold, while Park (2018) found evidence of volatility transmission between oil and base metals thanks to the financialization of the commodity markets. This evidence suggests that there was a somewhat synchronized boom and bust cycle within the commodities. |


| Commodity | F-Value | MSE | |||
|---|---|---|---|---|---|
| Aluminum | 0.91 | 0.87 | 0.77 | 11,220 | 0.10 |
| (14.5) | (105.9) | ||||
| Copper | 0.39 | 0.95 | 0.93 | 46,716 | 0.15 |
| (10.7) | (216.1) | ||||
| Lead | 0.36 | 0.95 | 0.93 | 44,384 | 0.16 |
| (11.1) | (210.6) | ||||
| Zinc | 0.35 | 0.95 | 0.89 | 26,991 | 0.15 |
| (8.22) | (164.3) | ||||
| Tin | 0.31 | 0.97 | 0.94 | 56,226 | 0.14 |
| (8.04) | (237.1) | ||||
| Nickel | 0.70 | 0.93 | 0.85 | 18,827 | 0.19 |
| (10.9) | (137.2) |
| Statistics | Aluminum | Copper | Lead | Zinc | Tin | Nickel |
|---|---|---|---|---|---|---|
| F-statistic | 125.8 | 70.9 | 76.9 | 34.9 | 53.1 | 59.3 |
| p-value | 0.00 | 0.00 | 0.00 | 0.00 | 0.00 | 0.00 |
| Variables | Pre-Crisis | Post-Crisis | Difference Tests | |||
|---|---|---|---|---|---|---|
| Obs. | Pre-Mean | Obs. | Post-Mean | t-Stat. | p-Value | |
| Aluminum_abs. | 1483 | 0.902 | 1802 | 1.106 | 7.08 | 0.000 |
| Copper_abs. | 1483 | 1.149 | 1802 | 1.291 | 3.61 | 0.000 |
| Lead_abs. | 1483 | 1.295 | 1802 | 1.620 | 7.10 | 0.000 |
| Zinc_abs. | 1483 | 1.221 | 1802 | 1.491 | 6.41 | 0.000 |
| Tin_abs. | 1483 | 1.059 | 1802 | 1.340 | 6.75 | 0.000 |
| Nickel_abs. | 1483 | 1.741 | 1802 | 1.716 | −0.49 | 0.627 |
| Aluminum_sq. | 1483 | 1.502 | 1802 | 2.113 | 4.99 | 0.000 |
| Copper_sq. | 1483 | 2.573 | 1802 | 3.343 | 3.23 | 0.001 |
| Lead_sq. | 1483 | 3.183 | 1802 | 5.067 | 5.96 | 0.000 |
| Zinc_sq. | 1483 | 2.969 | 1802 | 4.138 | 4.66 | 0.000 |
| Tin_sq. | 1483 | 2.427 | 1802 | 3.779 | 4.82 | 0.000 |
| Nickel_sq. | 1483 | 5.540 | 1802 | 5.568 | 0.07 | 0.946 |
| Commodity | F-Value | MSE | |||
|---|---|---|---|---|---|
| Aluminum | 0.85 | 0.88 | 0.79 | 718.8 | 0.10 |
| (3.40) | (26.8) | ||||
| Copper | 0.39 | 0.95 | 0.93 | 2769 | 0.16 |
| (2.57) | (52.6) | ||||
| Lead | 0.36 | 0.95 | 0.93 | 2749 | 0.16 |
| (2.74) | (52.4) | ||||
| Zinc | 0.32 | 0.96 | 0.89 | 1680 | 0.14 |
| (1.86) | (40.9) | ||||
| Tin | 0.30 | 0.97 | 0.94 | 3592 | 0.14 |
| (2.00) | (59.9) | ||||
| Nickel | 0.65 | 0.93 | 0.86 | 1182 | 0.19 |
| (2.51) | (34.3) |
| Statistics | Aluminum | Copper | Lead | Zinc | Tin | Nickel |
|---|---|---|---|---|---|---|
| F-statistic | 6.76 | 4.44 | 4.86 | 1.75 | 3.32 | 3.18 |
| p-value | 0.00 | 0.00 | 0.00 | 0.18 | 0.03 | 0.04 |
| Commodity | Log Likelihood | |||
|---|---|---|---|---|
| Aluminum | 0.85 | 0.88 | 0.80 | 160.1 |
| (3.01) | (23.9) | |||
| Copper | 0.39 | 0.95 | 0.93 | 82.6 |
| (1.85) | (38.1) | |||
| Lead | 0.36 | 0.95 | 0.93 | 78.3 |
| (2.17) | (42.4) | |||
| Zinc | 0.32 | 0.96 | 0.88 | 100.8 |
| (1.56) | (35.1) | |||
| Tin | 0.30 | 0.96 | 0.94 | 104.6 |
| (1.74) | (52.8) | |||
| Nickel | 0.65 | 0.93 | 0.86 | 48.1 |
| (2.52) | (35.0) |
| Statistics | Aluminum | Copper | Lead | Zinc | Tin | Nickel |
|---|---|---|---|---|---|---|
| F-statistic | 13.6 | 5.04 | 5.66 | 2.97 | 4.71 | 6.69 |
| p-value | 0.00 | 0.08 | 0.06 | 0.22 | 0.09 | 0.03 |
© 2018 by the authors. Licensee MDPI, Basel, Switzerland. This article is an open access article distributed under the terms and conditions of the Creative Commons Attribution (CC BY) license (http://creativecommons.org/licenses/by/4.0/).
Share and Cite
Park, J.; Lim, B. Testing Efficiency of the London Metal Exchange: New Evidence. Int. J. Financial Stud. 2018, 6, 32. https://doi.org/10.3390/ijfs6010032
Park J, Lim B. Testing Efficiency of the London Metal Exchange: New Evidence. International Journal of Financial Studies. 2018; 6(1):32. https://doi.org/10.3390/ijfs6010032
Chicago/Turabian StylePark, Jaehwan, and Byungkwon Lim. 2018. "Testing Efficiency of the London Metal Exchange: New Evidence" International Journal of Financial Studies 6, no. 1: 32. https://doi.org/10.3390/ijfs6010032
APA StylePark, J., & Lim, B. (2018). Testing Efficiency of the London Metal Exchange: New Evidence. International Journal of Financial Studies, 6(1), 32. https://doi.org/10.3390/ijfs6010032