Article

Value Investing in the Stock Market of Thailand

by
Gerardo “Gerry” Alfonso Perez
Judge Business School, University of Cambridge, Cambridge CB2 1TN, UK
Int. J. Financial Stud. 2017, 5(4), 30; https://doi.org/10.3390/ijfs5040030
Submission received: 22 September 2017 / Revised: 14 November 2017 / Accepted: 15 November 2017 / Published: 20 November 2017

Abstract

:
Value investment and growth investment have attracted a large amount of research in recent decades, but most of this research focuses on the U.S. and Europe. This article covers the Thai stock market which has very different characteristics compared to western markets and even South East Asian countries such as Indonesia or Malaysia. Among South East Asian countries, Thailand has one of the most dynamic capital markets. In order to see if some well-known trends in other markets exist in Thailand the performance of value and growth stocks in the Thai market were analyzed for a period of 17 years using existing style indexes (MSCI) as well as creating portfolios using individual stocks. For this entire period, when using the indexes, returns are statistically significant superior for value stocks compared to growth stocks. However, when analyzing the performance of the market in any given calendar year from 1999 to 2016, the results are much more mixed with in fact growth stocks outperforming in several of those years. Interestingly, when building portfolios using criteria such as low P/E or low P/B the results are not statistically different. Suggesting perhaps that the classification into value or growth stocks is more complex than it would appear. One of the common assumptions of value investing is that those stocks outperform over long periods of time. It might well be that in the Thai case one year is not a long enough period for value stocks to outperform. While there have been some clear efforts over recent years to modernize the stock market of Thailand, it remains relatively underdeveloped, particularly when compared to markets such as the U.S. Hence, its behavior regarding value versus growth investment might be rather different.
JEL Classification:
G11; G15; F62

1. Introduction

1.1. Overview

Investors follow a multitude of different styles according to their own preferences, market characteristics, and many other factors and constraints. The issue of investing style has attracted a substantial amount of research, such as Barberis and Shleifer (Barberis and Shleifer 2003). Most investment strategies could be classified using the type of predictors that they use for future performance. There is a significant amount of work regarding identifying such predictors. One of the best known articles in this regard is (Fama and French 1995). In this article the authors studied size as well as the book to market ratio as predictors. There are many other articles analyzing potential predictors. Value investing and growth investing are among the most popular investment strategies and they use different predictors in an attempt to anticipate the future behavior of the related stock price. It is of clear practical as well as theoretical importance understanding what investment strategist have historically being successful in which markets. It should be noted that while historical performance does not necessarily translate into future investment opportunities, there could be some lessons learn from analyzing pervious patterns. In this context, there is the risk of oversimplifying by assuming that the techniques that have worked in some countries, such as value investment, are appropriate for other countries. The differences among countries might be rather significant even in the current globalized work. These differences might be even more extreme when comparing results in Western and Asian countries due to substantially different socioeconomically conditions, levels of development, as well as multiple other historical reasons. What follows is a very brief description of two of the most common investment strategies: value investing and growth investment.

1.2. Value Investing

Perhaps one the most studied investing strategy is value investing. Value investing is an investment style proposed by successful investors, such as Warren Buffet (Buffet 1976), Charles Munger or Willian Ruane, as well as by well-known scholars, such as Basu (Basu 1977). The core idea of value investing is that the price earnings ratio (P/E) of a company is a predictor of the future performance of the stocks with companies with low P/E outperforming. Benjamin Graham and David Dood are credited as one of the first proponents of such strategy (Graham and Dodd 1934). The concept of value investing has been frequently mentioned as an argument against the efficient market hypothesis. In its most strict version, the market hypothesis entails that all information, both public and nonpublic, is contained in security prices and hence there is no way for an investor to consistently outperform the market. Value investing suggests that the P/E of a stock can be used as a predictor of future performance, potentially allowing a skilled investor to outperform. Graham dedicates an entire chapter of his book (Graham 1949) to differentiating between investment and speculation with the author considering that investing requires adhering to a set of rules (value investment rules) and considering most other approaches of investment as speculation. This is perhaps one of the oldest systematic approaches to investment for the modern capital markets. Nevertheless, it should be mentioned that even under the relatively rigorous set of rules describing value investment there is some degree of subjectivity with Hanson and Dhanuka (Hanson and Dhanuka 2015) describing this approach of investment as a combination of science and art. While there is no small amount of value investment critics, it is perhaps one of the investment techniques with stronger theoretical and empirical backing. Some relatively recent articles such as (Bird and Gerlach 2003) show empirical support for value investing in the U.S., U.K., and Australia.

1.3. Growth Investing

Another common investment strategy is growth investment. Growth investment focuses on companies that are experiencing or might experience a high degree of growth. These companies typically have higher P/E levels than those selected by value investors. Hence these two investment disciplines are typically regarded as two intrinsically different ways of investing. One of the first proponents of growth investment was Thomas Row Price. While there is not a full consensus regarding which strategy is superior, most of the academic literature seems to favor value over growth. A prominent article supporting this view is (Fama and French 1998). These authors concluded that globally the tendency is for value stocks to outperform growth stocks. They studied data for the period from 1975 to 1995. Beneda (Beneda 2002) concluded that for long holding periods (over 14 years) growth stocks have outperformed value stocks. The author used portfolios created from 1983 to 1987 with holding periods of up to 18 years. Another article by Lee and Song (Lee and Song 2003) supports the outperformance of growth stocks under some set of conditions. This article focuses on an investment timeframe much shorter than the one used in (Beneda 2002). The majority of the existing literature comparing value and growth investment support the opposite idea of (Beneda 2002) i.e., value stocks outperforming growth stocks in the long term.

1.4. Results in Other Markets

The outperformance of value investing appears not to be just a U.S. specific behavior with studies in other countries such as Canada (Athanassakos 2009), New Zealand (Truong 2009), and U.K. (Bird and Gerlach 2003), pointing towards the same type of event. Gharghori et al. (Gharghori et al. 2012) found that in the Australian market the book to market value is a good predictor of stock performance, giving some support to the value investment approach. Truong (Truong 2009) reached a similar conclusion when analyzing the New Zealand market. In this article, the author used P/E values as a predictor of future performance and concluded that stocks with low P/E will outperform the market, particularly those who have reasonably high expected growth rates. As previously mentioned, there is less research regarding value investing or growth investing in Asian countries than in developed markets such the U.K. or the U.S. Nevertheless, what appears to be clear from the existing literature is that every country has their own circumstances and conditions which would seem to favor an individualized analysis rather than reaching conclusions across different markets.

1.5. Thailand

The Thai stock market is a relatively new one for western standards but among East Asian countries it has some of the longest track records. As a reflection of that is the fact that currently there are MSCI indexes covering subsectors in the Thai market such as the MCSI Thailand Value Index and the MSCI Thailand Growth Index. Nevertheless, there is clearly substantially less research covering the Thai stock market than developed markets. The Thai stock market seems to have some of the effects present in other market such as the small size effect (Alfonso Perez 2017). Given the differences between the Thai stock market and the U.S., where value investment was first proposed, it is not immediately evident if it would behave in the same way. The U.S. market has characteristics that are very different from the Thai market such as for instance a much larger size, number of listed stocks, and investor base. Another obvious difference is that the Thai market has a much longer track record and hence a shorter time to mature. In one of the very few articles covering the issue of the value investing in the Thai stock market (Sareewiwatthana 2012) concluded that there was an outperformance of value stocks. The author used PEG value for his comparison using data from 1999 to 2010. This article constructed portfolios selected after filtering for PEG ratios rather than use commercially available indexes. Our results are similar to those of (Sareewiwatthana 2012) when using available indexes but not when portfolios are created using individual stocks and criteria such as the PE ratio.

1.6. Initial Hypothesis

The initial hypothesis, to be tested in this article, is that there is no outperformance of value stocks over growth stocks. This is basically in line with the market efficiency hypothesis that suggest that for long periods of time investors should not be able to consistently outperform. It will be shown later in this article that this underlying assumption is rejected for long periods of time (the entire time series of 17 years) but not for the majority of individual calendar years.

2. Materials and Methods

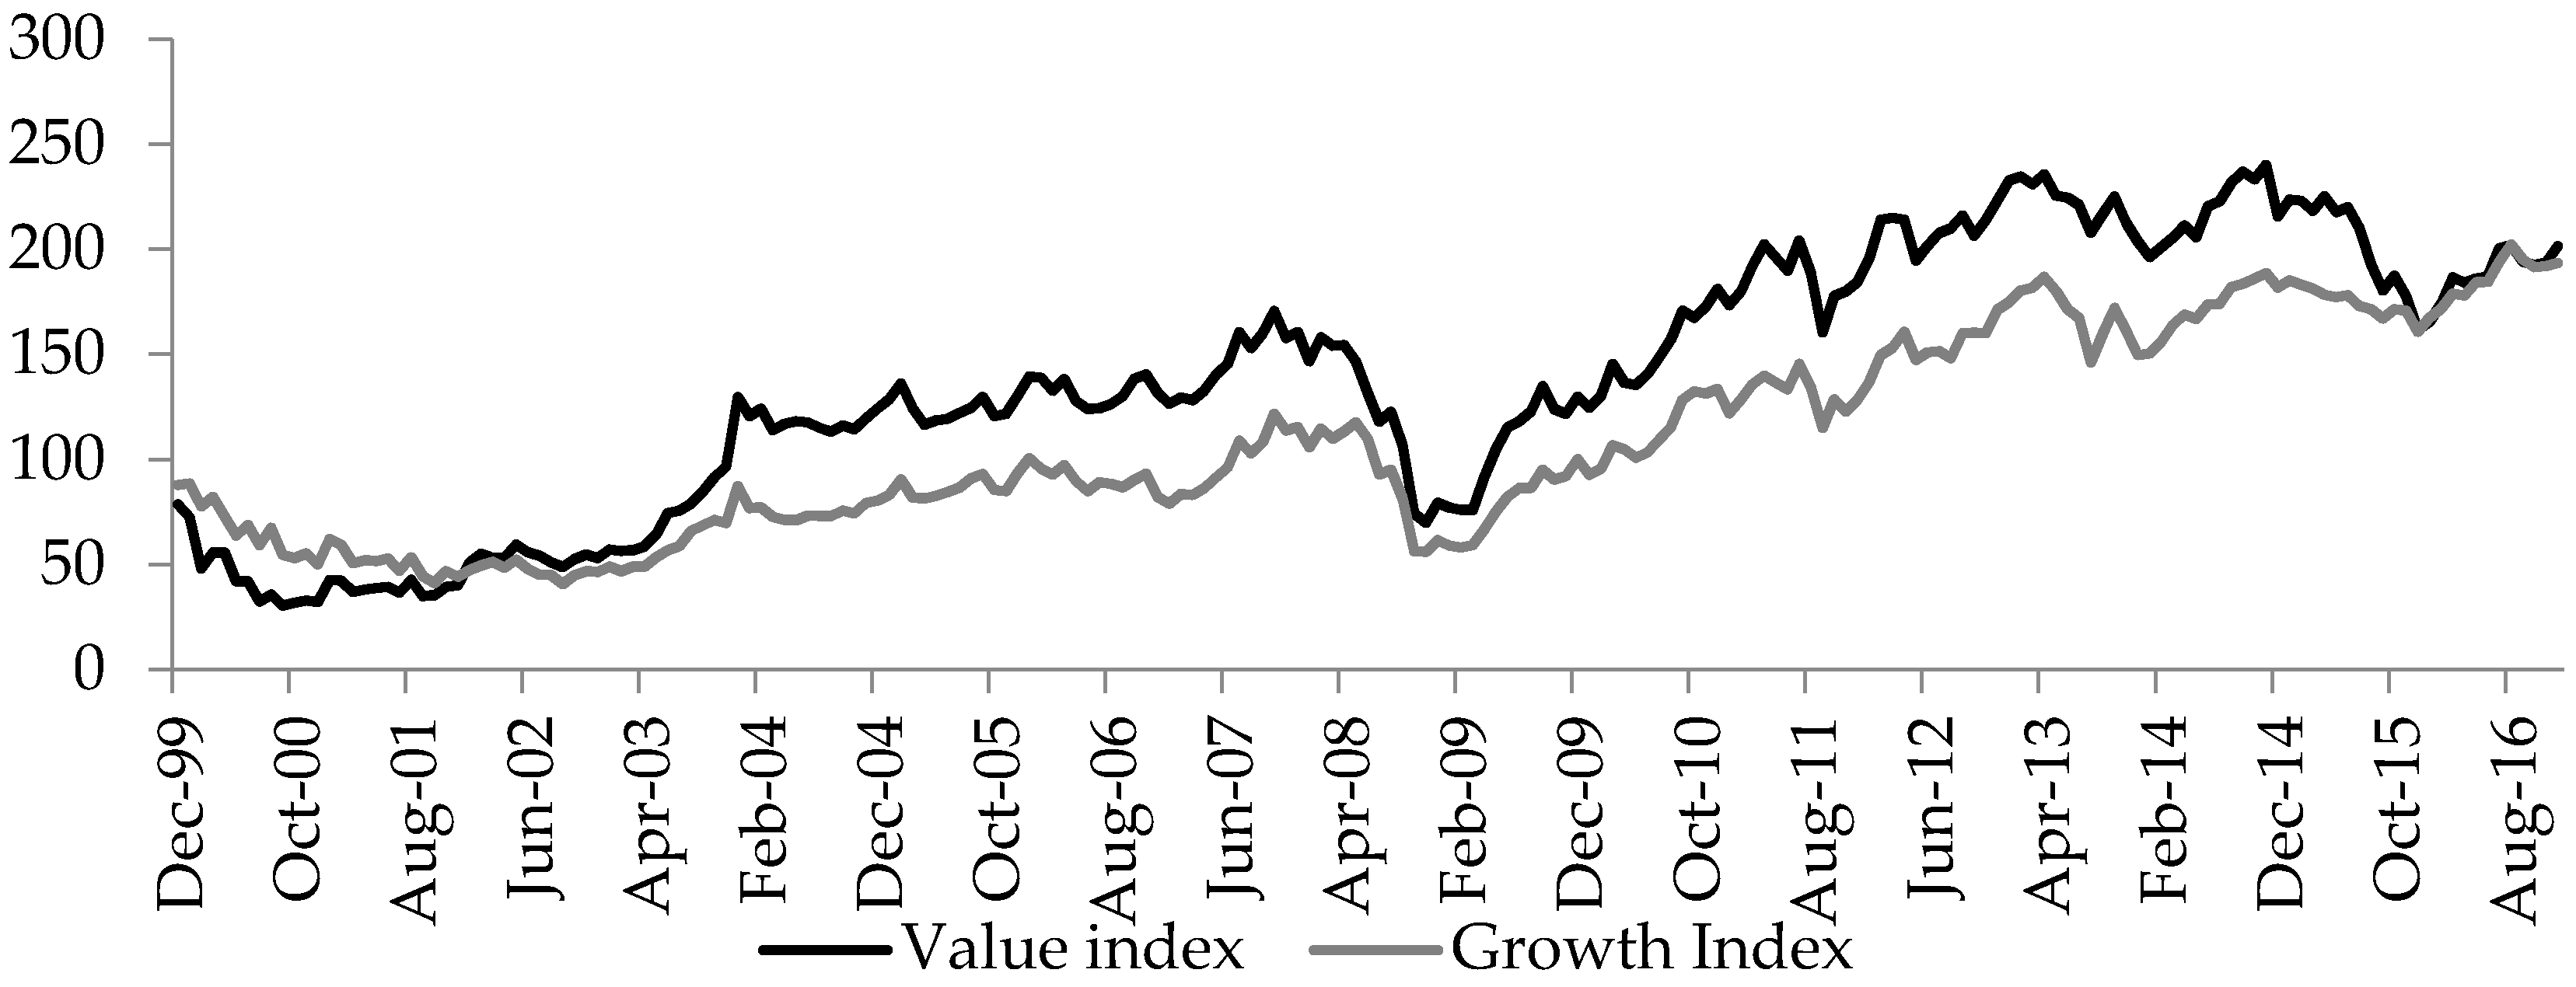
The indexes used for comparing the performance of value versus growth stocks in the Thai market were the MSCI Thailand Value Index and the MSCI Thailand Growth Index. All the data were extracted from the database Bloomberg. The end of month value for both indexes were collected for the period from December 1999 to December 2016. The risk free rates for Thailand for all these years were extracted from Bloomberg and equate to the 10 year local treasury bond yield (longest time series available in the data base). For the previously mentioned period the value index generated returns of approximately 156% while the growth index generated a return of 120%. The MSCI indexes are frequently used as benchmarks by actual institutional investors in this market. It seemed reasonable then to use these indexes, rather than creating an artificial basket of stocks representing value and growth investments. In the indexes used, there is no double counting, in other words, there are no companies included simultaneously in the value and the growth indexes.
The performance of both indexes can be seen in Figure 1 and the risk adjusted comparison in Table 1. There were only three years in which the indexes moved in opposite directions. These years were 2001, 2006, and 2011. In all these three years the growth indexes had negative returns while the value indexes had positive returns. Of the 17 years analyzed the value index outperformed the growth index in 10 years. On a risk adjusted basis, the results are similar with the point estimate for the Sharpe ratio being bigger for 9 out of the 17 years analyzed. The point estimate for the correlation between the two indexes for the entire period was rather high, 0.931, but this correlation did change over time (Table 2). The smallest correlation for these two indexes was in 2005 (0.683) while the highest correlation was in 2007 (0.986).
As a first step, the normality of the data was tested using an Anderson–Darling test. For the entire time series (from December 1999 to December 2017) the null assumption that the data follow a normal distribution is rejected as a 5% significance level. Nevertheless, it should be noted that when the test was performed for each individual year in the majority of the cases the Anderson–Darling test was unable to reject the hypothesis that the data follow a normal distribution (Table 3). As there are conflicting data regarding the issue of normality of distribution on these stocks returns and in accordance to the majority of the existing literature regarding this issue it was not assumed that the index returns follow a normal distribution. Hence, a non-parametric test was used. The non-parametric test used to compare both indexes was the Wilcoxon test. The null hypothesis of equal medians, comparing the MSCI Thailand Value and the MSCI Thailand Growth Index, was rejected in all cases (including when analyzing the entire time series together) with the exception of the 2016 period (Table 4).
Another option instead of using indexes is to create portfolios of stocks directly according to some of the characteristics of value and growth investing. The approach followed for the creation of these indexes is similar to the one used in (
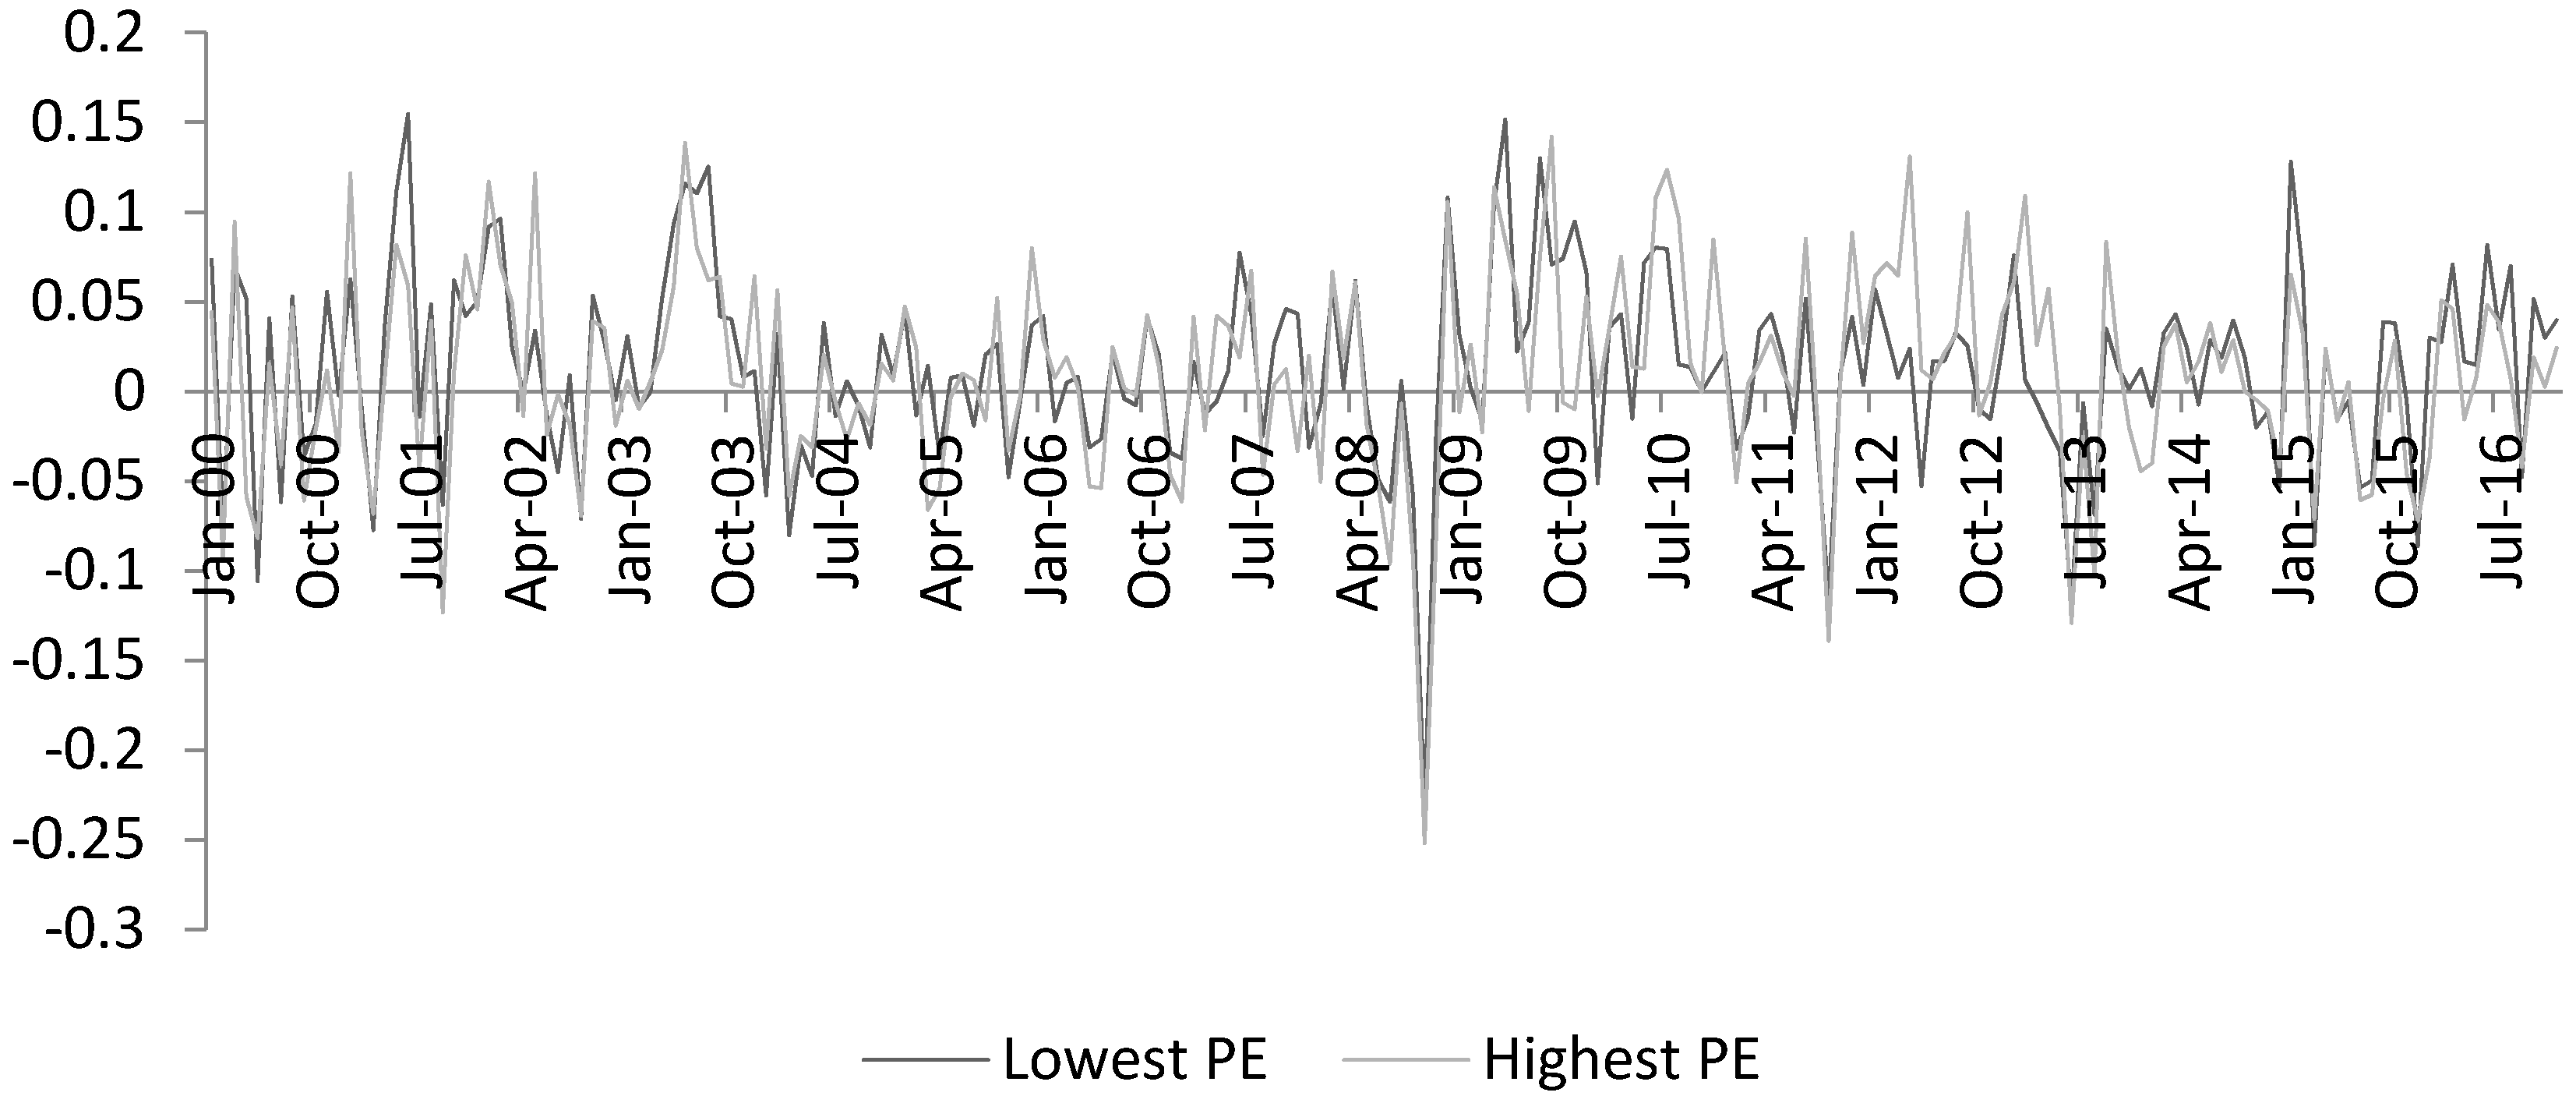
Lakonishok et al. 1994). These authors used four metrics to classify companies into two categories; value and growth. One of the metrics that they used, and of the most frequently mentioned in the literature is the P/E ratio. First, a list of all the companies listed in the Bangkok Stock Exchange with positive earning as of December 1999 was obtained. Companies with extensive suspension periods were excluded from the index. It should be noted that the liquidity in some of those names was not too high with some of them not having daily trading. Only companies with relatively liquid stocks were included in the analysis. Those companies were grouped into four different groups according to their respective P/E values. For instance, the highest 25% of companies, according to their P/E were included in group one, the following 25% in group two and thereof. Some authors chose to use more subgroups , for instance in 10% intervals, but given the relatively small amount of stocks that satisfied our criteria in the Thai market on that date it seemed preferable to use a classification into four groups. The top and bottom groups, according to their P/E values, were selected to represent growth and value stocks. Each of these groups contained 16 stocks. An equal weight index was then created with all these 16 components. The returns on both indexes can be seen in Figure 2 and the correlation data in Table 5. Low P/E stocks are typically associated with value investments while high P/E stocks are typically associated with growth stocks.
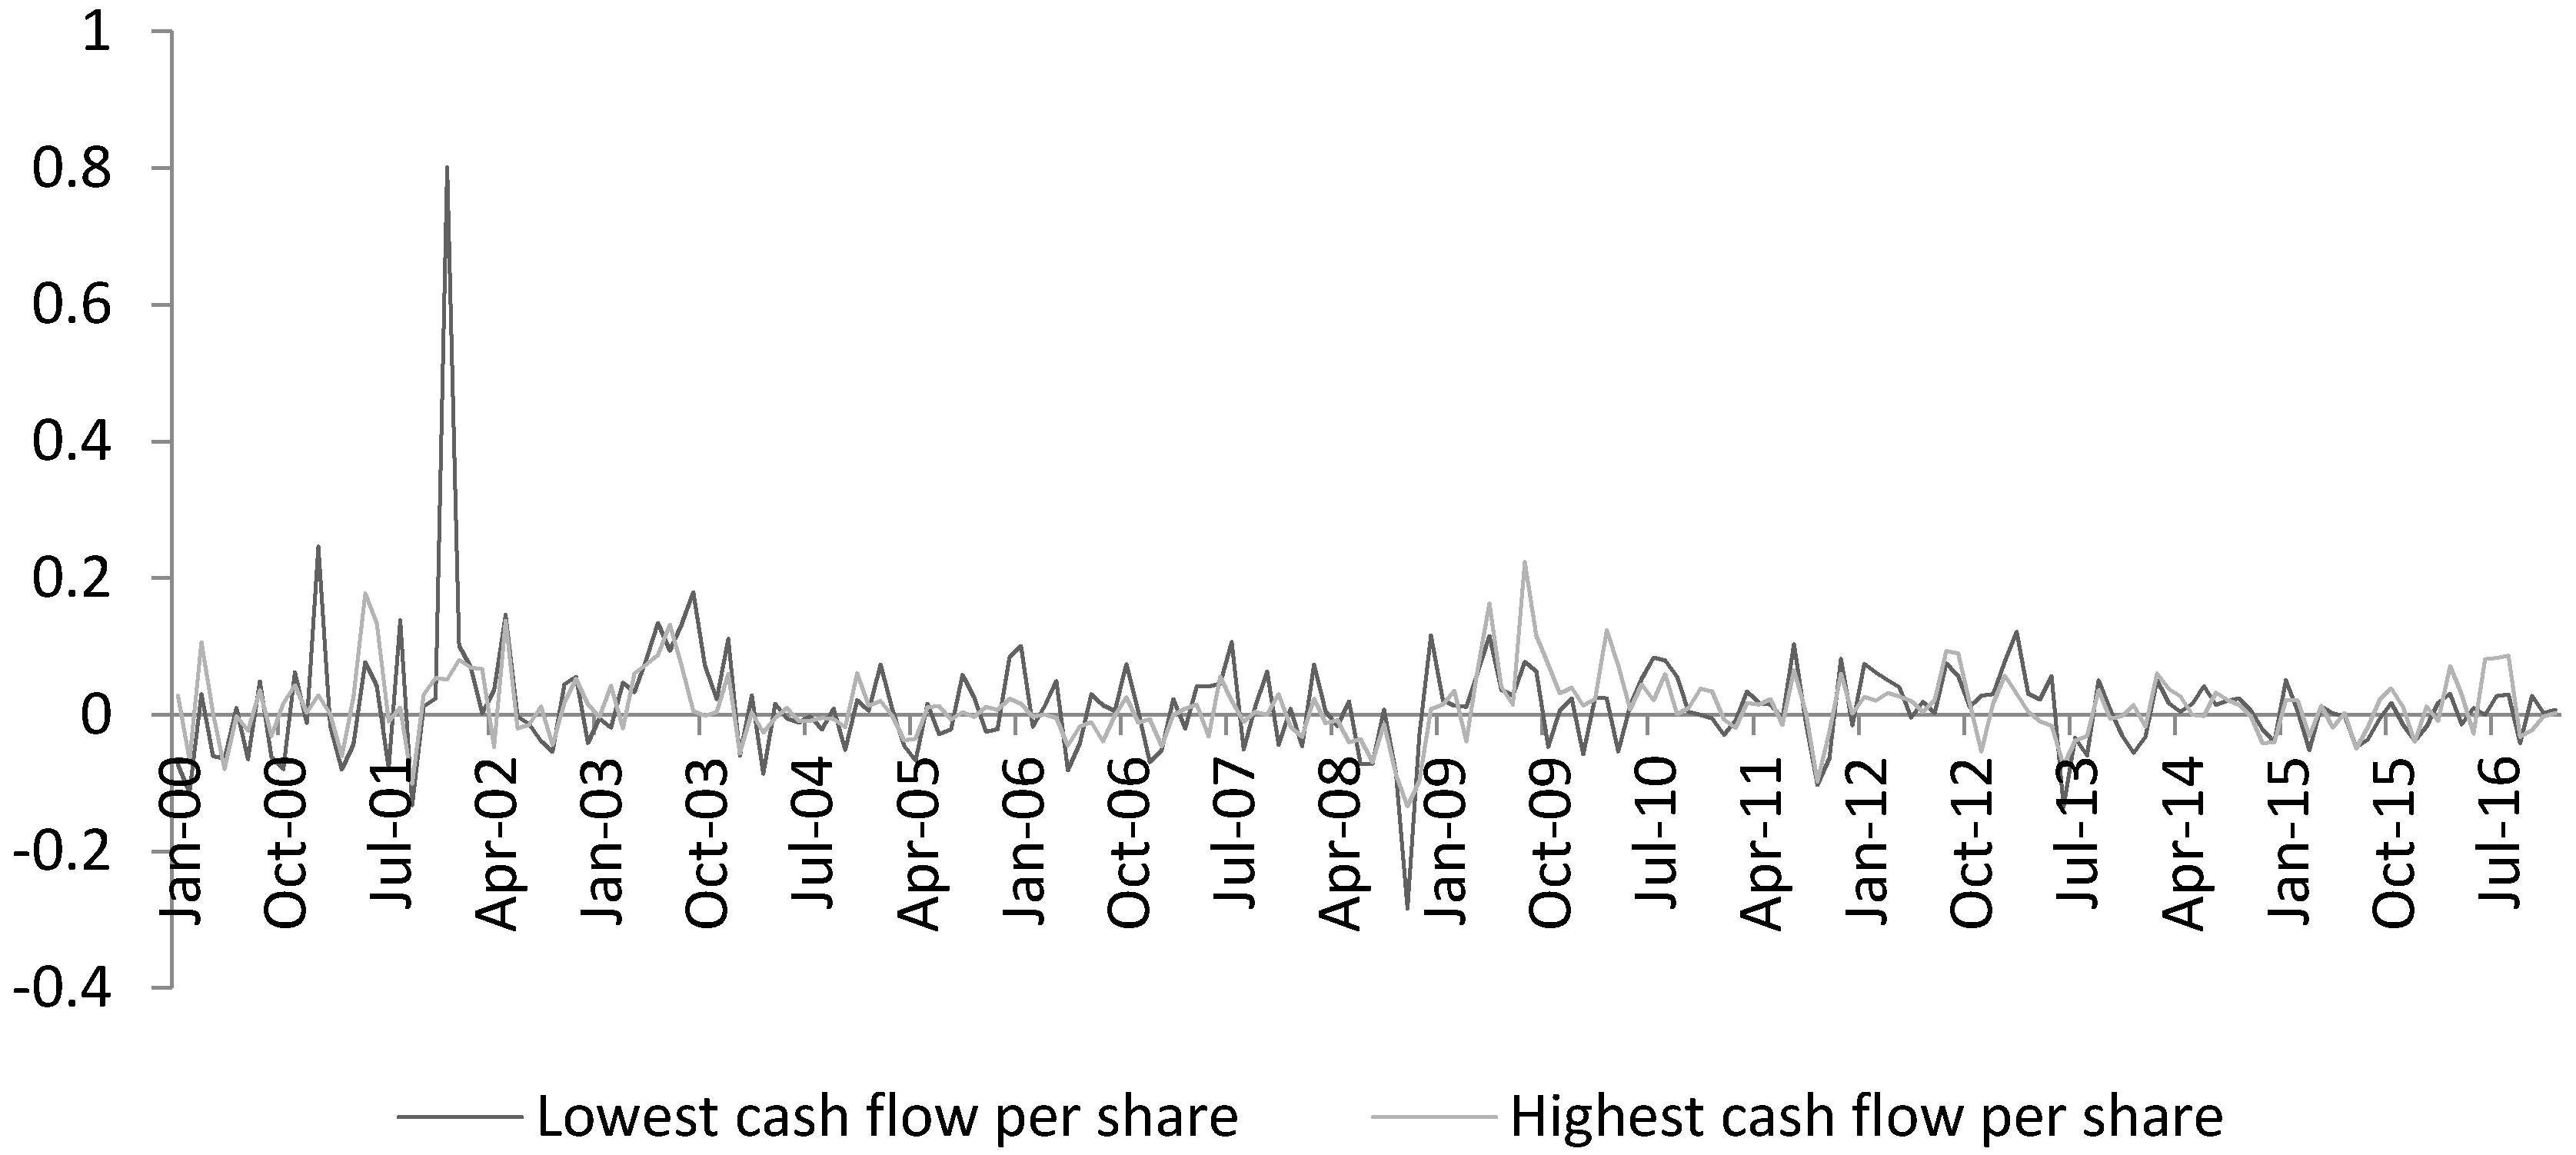
Portfolios were also created using the cash flow per share metric. Similarly to the previous case a list of the companies listed in the Bangkok Stock Exchange at the end of December 1999 was used as a starting point. Then the cash flow per share was extracted from the data base Bloomberg for each of those stocks and arranged into four buckets. Only companies with positive cash flows were included. Due to these limitations, only 50 companies were left on the overall list. The top and bottom buckets contained 12 companies each. The returns of the indexes created using this criteria can be seen in Figure 3 and the correlation data in Table 6.
A third approach used to construct portfolios was to use the price to book value metric. Like in the previous cases, the starting point was the list of companies listed in the Bangkok Stock Exchange as of the end of December 1999. Then the price to book value metric was obtained from Bloomberg for each of the companies and arrange accordingly. The top and bottom buckets each contained 14 companies. Low price-to-book value is typically associated with value investment strategies while high price-to-book value is normally associated with growth stocks. The returns of the indexes created using this criteria can be seen in Figure 4 and the correlation data in Table 7.
The final metric used for the classification of companies was the average five years sales growth for the companies. Due to data availability, the time series using this metric is shorter compared to the other metrics. This was necessary in order to maintain a reasonable number of stocks in each index. The starting data point, used for the classification of stocks was the end of December 2003, rather than the end of December of 1999 like in the previous cases. Also in this case 14 companies were included in the top and bottom buckets. The returns of the indexes created using this criteria can be seen in Figure 5 and the correlation data in Table 8.
Similarly to the previous cases, in which the MSCI indexes were used, the first step was to do a test regarding the normality of the portfolio returns built using the previously mentioned four different metrics. For consistency considerations the Anderson–Darling test was selected as the appropriate test. Similarly to the previous cases, when the entire data series is analyzed the hypothesis that the returns follow a normal distribution can be rejected at a 5% significance level for most of the indexes. However, for the majority of the individual years such assumption cannot be rejected (Table 9, Table 10, Table 11 and Table 12).
Wilcoxon tests were then performed, as in the previous cases, to compare the indexes built using the P/E, P/B, Cash flow per share and five-year growth rate. Interestingly, the results of these tests (Table 13, Table 14, Table 15 and Table 16) fail to reject the hypothesis that the returns come from distributions with the same median. This might relate to the fact that perhaps using only one of these criteria to allocate companies into the value or growth categories is not enough and further analysis is needed. The issue of poor liquidity of some of the stocks included in the analysis is also acknowledged. While significant efforts were made to include only liquid securities, given the limited number of stocks that satisfied the previously mentioned criteria, some not highly liquid stocks were included in the portfolios. This, while a factor to take into account, is unlikely to be the sole factor between the discrepancy of the MSCI indexes and the portfolios built from individual stocks satisfying some broad market criteria such as P/E ratios.

3. Results

For the entire period analyzed, from the end of December 1999 to the end of December 2016, value stocks in Thailand, represented by the MSCI Thailand Value Index, gained 156% while growth stocks, represented by the MSCI Thailand Growth Index, gained 120%. When applying a formal statistical test to the monthly returns during that period, such as the Wilcoxon test, and at a 5% significance level the hypothesis that the medians of the returns are equal is rejected, supporting the view that value stocks outperform growth stocks over the long term. However, when the performance of the individual years is compared, the results are more mixed. For 10 of the 17 years analyzed, the point estimate of the returns was higher for value stocks than for growth stocks. The results of the Wilcoxon test suggest that the median returns are statistically different every year with the only exception of 2016. When risk adjusted returns are used, using the Sharpe ratio, it is obtained that the point estimate of the Sharpe ration for value stocks is higher in 9 out of the 17 years analyzed. This would seem to indicate that while over long time frames, such as 17 years, value stocks did outperform growth stocks, over shorter time fames such as one calendar year that was not necessarily the case. In fact, in many occasions, over a one calendar year time frame, growth stocks statistically significantly outperformed value stocks. When using portfolios built according to P/E, P/B, cash flow per share, and five-year growth rates the results fail to reject the hypothesis that the medians of the returns are different. This is a surprising result and it might be related to the fact that classification of companies into the value and growth categories is a process more complex than just picking companies using a single criteria such as P/E. The poor liquidity of some of the stocks might also be a fact impacting comparisons of returns.

4. Discussion

In the Thai market, and for the period of time analyzed, value stocks seem to outperform growth stocks. There are discrepancies between the results using existing indexes, such as the MSCI Thailand Value index, and building portfolios according to some criteria, such as low P/E. This might be related to the fact that classifying companies into the value or growth buckets might require more analysis than just using a single criteria such as low P/E. The results obtained using the indexes, of outperformance of value stocks, is similar to the ones obtained in other markets. It is interesting that this result is obtained when analyzing the entire period (17 years) together but not when analyzing every year individually. When calendar years are analyzed individually, the results are much more mixed with growth stocks outperforming in some of those years. It might be that one year is too short of a time frame in the Thai market for value stock to be able to outperform growth stocks. It is possible that the outperformance of value stocks over growth stocks is related to some risks that the models do not fully reflect and this could be an interesting area of further research.

Conflicts of Interest

The author declares no conflict of interest.

References

  1. Alfonso Perez, Gerardo “Gerry”. 2017. Company size effect in the stock market in Thailand. International Journal of Financial Research 8. [Google Scholar] [CrossRef]
  2. Athanassakos, George. 2009. Value versus growth stock returns and the value premium: The Canadian experience 1985–2005. Canadian Journal of Administrative Sciences 26. [Google Scholar] [CrossRef]
  3. Barberis, Nicholas, and Andrei Shleifer. 2003. Style investing. Journal of Financial Economics 68. [Google Scholar] [CrossRef]
  4. Basu, Sanjoy. 1977. Investment performance of common stocks in relation to their price-earnings ratios: A test of the efficient market hypothesis. The Journal of Finance 32. [Google Scholar] [CrossRef]
  5. Beneda, Nancy. 2002. Growth stocks outperform value stocks over the long term. Journal of Asset Management 3. [Google Scholar] [CrossRef]
  6. Bird, Ronald, and Richard Gerlach. 2003. The good and the bad of value investing: Applying a Bayesian approach to develop enhancement models. Paper presented at EFMA 2003 Helsinki Meetings, Helsinki, Finland, June 25–28. [Google Scholar] [CrossRef]
  7. Buffet, Warren. 1976. Benjamin Graham. Financial Analyst Journal 32: 16–21. [Google Scholar]
  8. Fama, Eugene, and Kenneth French. 1995. Size and book to market factors in earnings and returns. The Journal of Finance 50: 131–55. [Google Scholar] [CrossRef]
  9. Fama, Eugene, and Kenneth French. 1998. Value versus growth: The international evidence. Journal of Finance 53: 1975–99. [Google Scholar] [CrossRef]
  10. Gharghori, Philip, Sebastian Stryjkowski, and Madhu Veeraghavan. 2012. Value versus growth: Australian evidence. Accounting and Finance 53: 393–417. [Google Scholar] [CrossRef]
  11. Graham, Benjamin. 1949. The Intelligent Investor. New York: Harper & Brothers. [Google Scholar]
  12. Graham, Benjamin, and David Dodd. 1934. Security Analysis. New York: Whittlesey House, McGraw Hill Book. [Google Scholar]
  13. Hanson, Dan, and Rohan Dhanuka. 2015. The “Science” and “Art” of high quality investing. Journal of Applied Corporate Finance 27: 73–86. [Google Scholar] [CrossRef]
  14. Lakonishok, Josef, Andrei Shleifer, and Robert Vishny. 1994. Contrarian investment, extrapolation, and risk. Journal of Finance 49: 1541–78. [Google Scholar] [CrossRef]
  15. Lee, Yul W., and Zhiyi Song. 2003. When do Value Stocks Outperform Growth Stocks? Investor Sentiment and Equity Style Rotation Strategies. Paper presented at EFMA 2003 Helinski Meetings, Helsinki, Finland, June 25–28. [Google Scholar] [CrossRef]
  16. Sareewiwatthana, Paibon. 2012. Value investing in Thailand: Evidence from the use of PEG. Technology and investment. Technology and Investment 3. [Google Scholar] [CrossRef]
  17. Truong, Cameron. 2009. Value investing using price earnings ratio in New Zealand. University of Auckland Business Review 11: 1–7. [Google Scholar]
Figure 1. Performance of MSCI Thailand Value Index and MSCI Growth Index (December 1999–December 2016).
Ijfs 05 00030 g001
Figure 2. P/E based indexes.
Ijfs 05 00030 g002
Figure 3. Cash flow per share indexes.
Ijfs 05 00030 g003
Figure 4. Price-to-book value indexes.
Ijfs 05 00030 g004
Figure 5. Growth rate based indexes.
Ijfs 05 00030 g005
Table 1. Value and growth index risk adjusted performance.
YearReturnVolatilitySharpe
ValueGrowthValueGrowthValueGrowth
2000−59.06−42.9425.3718.44−1.17−1.06
200124.74−11.70−2.891.371.83−0.80
200232.255.031.620.251.820.15
2003144.1487.88126.6777.231.851.93
2004−4.15−7.950.330.63−0.53−0.81
20054.7216.410.772.69−0.040.70
20061.14−12.32−0.141.52−0.20−1.00
200721.9940.638.9316.510.320.70
2008−50.62−46.7023.6421.81−0.46−0.61
200963.7662.4439.8138.990.771.10
201039.4133.6013.2411.290.550.59
20111.87−3.73−0.070.14−0.03−0.25
201221.0033.166.9711.000.470.77
2013−8.75−12.641.111.60−0.36−0.39
20145.7521.471.234.610.060.41
2015−25.01−11.512.881.32−0.37−0.58
201624.6420.274.994.110.490.42
Table 2. Correlation between value and growth index.
PeriodCorrelationPeriodCorrelation
2000–20160.93120080.979
20000.92620090.985
20010.76620100.984
20020.75220110.968
20030.98120120.781
20040.69320130.950
20050.68320140.934
20060.69920150.928
20070.98620160.951
Table 3. Anderson–Darling test results (p values).
Value IndexGrowth Index
Periodp ValuePeriodp ValuePeriodp ValuePeriodp Value
2000–20160.000520080.13562000–20170.000520080.0416
20000.045720090.058420000.717420090.1854
20010.672320100.548120010.687720100.1420
20020.714820110.954820020.870520110.9158
20030.141020120.288520030.234120120.3784
20040.464820130.601520040.426520130.5588
20050.567620140.688220050.175120140.6125
20060.163820150.048920060.9920150.8385
20070.200320160.344720070.505220160.5252
Table 4. Wilcoxon test results (p values).
Periodp ValuePeriodp Value
2000–20160.0000920080.02260
20000.0014020090.00610
20010.0000820100.00020
20020.0002020110.00004
20030.0304020120.00004
20040.0000420130.00004
20050.0000420140.00004
20060.0000420150.00240
20070.0000420160.54440
Table 5. Correlation between P/E based indexes.
PeriodCorrelationPeriodCorrelation
2000–20160.78174020080.975461
20000.81202620090.523414
20010.81698820100.602125
20020.82073820110.933659
20030.75461920120.527316
20040.87763320130.757883
20050.60647120140.832368
20060.89557420150.942001
20070.41767120160.672125
Table 6. Correlation between CF per share based index.
PeriodCorrelationPeriodCorrelation
2000–20160.485220080.8480
20000.672020090.6363
20010.29642010−0.0332
20020.758820110.9453
20030.318820120.4962
20040.700720130.7799
20050.696320140.7726
20060.669220150.8096
20070.330020160.4283
Table 7. Correlation between price-to-book based index.
PeriodCorrelationPeriodCorrelation
2004–20160.44186220100.907774
20040.59273320110.323907
20050.21593520120.375791
20060.71727220130.869932
20070.42132120140.672415
20080.74410120150.621149
20090.37338220160.593515
Table 8. Correlation between growth rate based indexes.
PeriodCorrelationPeriodCorrelation
2004–20160.528820100.4837
20040.764320110.8978
20050.610520120.3383
20060.709420130.8642
2007−0.019220140.7182
20080.915220150.9297
20090.554520160.4420
Table 9. Anderson–Darling test results (p values)—P/E indexes.
High P/E (Growth) IndexLow P/E (Value) Index
Periodp ValuePeriodp ValuePeriodp ValuePeriodp Value
2000–20160.085620080.61972000–20170.026620080.7659
20000.758920090.588220000.163620090.1152
20010.917420100.218820010.505120100.9869
20020.423420110.049720020.900120110.6515
20030.089820120.105820030.204220120.2395
20040.638720130.638120040.861020130.1410
20050.970220140.896820050.953220140.2548
20060.058820150.499520060.787820150.2732
20070.634520160.383620070.239520160.8480
Table 10. Anderson–Darling test results (p values)—CF indexes.
High CF (Growth) IndexLow CF (Value) Index
Periodp ValuePeriodp ValuePeriodp ValuePeriodp Value
2000–20160.000520080.58512000–20170.000520080.1400
20000.795720090.111520000.094020090.4685
20010.333620100.115620010.001220100.6809
20020.729520110.277120020.800320110.6201
20030.301420120.004920030.990020120.8733
20040.089920130.970720040.190220130.9433
20050.059420140.820820050.470320140.2981
20060.281320150.304420060.894820150.6345
20070.972220160.079120070.583420160.3376
Table 11. Anderson–Darling test results (p values)—P/B indexes.
High P/B (Growth) IndexLow P/B (Value) Index
Periodp ValuePeriodp ValuePeriodp ValuePeriodp Value
2000–20160.088720080.18672000–20170.000520080.0634
20000.561220090.935920000.133920090.8552
20010.923120100.934920010.000520100.4962
20020.628920110.863620020.805820110.1498
20030.184220120.821120030.197920120.3646
20040.108620130.661520040.700720130.4188
20050.972520140.709320050.248820140.5870
20060.216220150.364320060.333420150.6184
20070.430220160.967720070.485920160.9822
Table 12. Anderson–Darling test results (p values)—growth indexes.
High 5-Year Growth IndexLow 5-Year Growth Index
Periodp ValuePeriodp ValuePeriodp ValuePeriodp Value
2003–20160.000520100.98792000–20170.000520100.7783
20030.853620110.325720000.379620110.3355
20040.990020120.519520010.921620120.7945
20050.260920130.897320020.224520130.1647
20060.937220140.128920030.202620140.7564
20070.633420150.688820050.207020150.6352
20080.283620160.625120060.358820160.6175
20090.3180 20070.4816
Table 13. Wilcoxon Test results (p values)—P/E indexes.
Periodp ValuePeriodp Value
2000–20160.527520080.5834
20000.402520090.3123
20010.623620100.3123
20020.931020110.8399
20030.665020120.1410
20040.885220130.6650
20050.999920140.7508
20060.977020150.6650
20070.665020160.3123
Table 14. Wilcoxon Test results (p values)—CF indexes.
Periodp ValuePeriodp Value
2000–20160.934820080.5834
20000.260220090.1939
20010.885220100.4025
20020.997020110.8852
20030.236620120.4357
20040.977020130.6650
20050.977020140.8852
20060.285520150.4357
20070.435720160.6650
Table 15. Wilcoxon Test results (p values)—P/B indexes.
Periodp ValuePeriodp Value
2000–20160.578020080.6650
20000.236620090.8399
20010.623620100.6650
20020.470520110.8852
20030.931020120.0999
20040.885220130.6650
20050.435720140.9770
20060.583420150.3708
20070.340820160.5067
Table 16. Wilcoxon Test results (p values)—five-year growth indexes.
Periodp ValuePeriodp Value
2000–20160.834120100.9310
20030.665020110.9990
20040.370820120.4025
20050.665020130.9970
20060.707520140.9310
20070.312320150.3408
20080.583420160.7950
20090.8399

