Article

A Soft Intelligent Risk Evaluation Model for Credit Scoring Classification

Department of Industrial Engineering, Isfahan University of Technology (IUT), Isfahan 84156-83111, Iran
*
Author to whom correspondence should be addressed.
Int. J. Financial Stud. 2015, 3(3), 411-422; https://doi.org/10.3390/ijfs3030411
Submission received: 27 June 2015 / Revised: 21 August 2015 / Accepted: 25 August 2015 / Published: 8 September 2015

Abstract

:
Risk management is one of the most important branches of business and finance. Classification models are the most popular and widely used analytical group of data mining approaches that can greatly help financial decision makers and managers to tackle credit risk problems. However, the literature clearly indicates that, despite proposing numerous classification models, credit scoring is often a difficult task. On the other hand, there is no universal credit-scoring model in the literature that can be accurately and explanatorily used in all circumstances. Therefore, the research for improving the efficiency of credit-scoring models has never stopped. In this paper, a hybrid soft intelligent classification model is proposed for credit-scoring problems. In the proposed model, the unique advantages of the soft computing techniques are used in order to modify the performance of the traditional artificial neural networks in credit scoring. Empirical results of Australian credit card data classifications indicate that the proposed hybrid model outperforms its components, and also other classification models presented for credit scoring. Therefore, the proposed model can be considered as an appropriate alternative tool for binary decision making in business and finance, especially in high uncertainty conditions.

1. Introduction

Credit risk analysis is an important topic in financial risk management. Several different applications are presented in the finance and banking literature for credit risk analysis, such as bank loans, credit cards, mortgages, hire purchase, etc. [1]. Credit scoring is generally concerned with evaluating the potential risks corresponding to granting scores. Credit scoring models help lenders to decide who will get credit, how much credit they should get, and what additional strategies will enhance the profitability of the borrowers to lenders. Some of the most important obtained advantages of a reliable credit-scoring model include [2,3]:
  • Improving cash flows;
  • Insuring proper credit collections;
  • Reducing possible credit losses;
  • Reducing cost of credit analysis, enabling credit decision almost instantaneously;
  • Allowing to offer credit products geared to different risk levels;
  • Analyzing the purchasing behavior of existing customers.
Durand [4] posited that the procedure includes collecting, analyzing, and classifying different credit elements and variables, in order to make credit-granting decisions. He noted that, to classify a firm’s customers, the objective of the credit evaluation process is to reduce current and expected risk of a customer being “bad” for credit. Thus, credit scoring is an important technology for banks and other financial institutions as they seek to minimize risk [5]. Credit scoring can be considered as a quantitative method of measuring the risk attached to a potential customer, by analyzing their data to determine the likelihood that the prospective borrower will default on a loan [6]. Credit scoring can also be described as a data mining technique, employed to convert data into rules that can be used to guide credit-granting decisions.
The data mining methods for credit scoring were invented in the 1950s. Thus far, different data mining methods have been proposed and developed for credit scoring [7,8]. These methods can be generally divided into two main categories: hard and soft models. Soft data mining models, in contrast to the hard models, use the fuzzy data and/or fuzzy functions for credit scoring, instead of using crisp. In such that models, uncertainties in data and relationships are modeled by fuzzy logic and fuzzy operators. The hard data mining models can be also categorized in two major categories: statistical and intelligent models.
In the literature, a variety of statistical techniques have been proposed and developed for credit scoring. Some of the most well-known and widely-used of statistical credit scoring models include logistic regression [9,10], linear discriminant analysis [11,12,13], quadratic discriminant analysis, probit regression [14], nearest neighbor analysis [15], and Bayesian network [16,17]. Although statistical models have some valuable advantages in the explanatory purpose of credit scoring, the performances of these models can not satisfy financial managers and decision makers. Therefore, researchers are trying to find and develop more accurate scoring models. This leads to the investigation of new methods in artificial intelligence (AI), such as artificial neural network (ANNs). Several researchers have argued that using artificial neural networks can be an effective way of improving the accuracy in credit scoring. Paliwal and Kumar [18] reported that such advanced techniques can be superior alternatives to traditional statistical models in practical tasks.
Although statistical and intelligent techniques are precise and accurate classification models, both of them are crisp models that use classical logic in their modeling procedures. Therefore, they cannot effectively model the uncertainties existing in the data and relationships [19]. Therefore, in order to overcome these shortcomings, a second category of credit scoring models has been proposed to the financial industry, soft models. Fuzzy forecasting and classification models, such as fuzzy time series and fuzzy linear regression, are suitable under uncertainty and complexity; however, their performance is not always satisfactory. Therefore, it is not wise to apply them blindly to any type of data. In the literature, several researchers have tried to overcome some of the disadvantages of the traditional fuzzy models for approximating real-world systems [20].
It is an area in which even a small performance improvement can mean a tremendous increase in profit to the lender because of the volume of lending made by using scores. Thus, these efforts lead to the proposal of hybrid methods, which use the advantages of various models. In the literature, using hybrid models, or combining several models, has become a common practice in order to overcome the limitations of single models and improve classification accuracy. Many researchers have argued that performance improves in hybridization. In combined models, the main aim is to reduce the risk of using an inappropriate model and failure by combining several models and obtain results that are more accurate. On the other hand, the motivation for using hybrid models comes from the assumption that neither can completely identify the data generating process. Hence, a single model may not be sufficient in order to identify all the characteristics of the data [21]. A great deal of effort has been devoted in the literature in order to develop and improve hybrid classification models.
In their pioneering work, Bates and Granger showed that a linear combination of forecasts would give a smaller error variance than any of the individual models. Since then, the studies on this topic have expanded dramatically. The basic idea of model combination in classification is to use the unique features of each classification model in order to capture different patterns in the data. Both theoretical and empirical findings suggest that combining different models can be an effective and efficient way to improve classification accuracy [22]. In recent years, more hybrid classification models have also been proposed, integrating different models together in order to improve accuracy. Lee et al. [23] have presented credit scoring by integrating back propagation neural networks with linear discriminate analysis. Hsieh [24] has presented a hybrid mining approach in the design of an effective credit-scoring model, integrating clustering algorithms and artificial neural networks. Luo et al. [25] have employed support vector machines (SVMs) and clustering-launched classification models for credit scoring.
Hung et al. [26] have also adopted three strategies to build hybrid SVM-based credit scoring models to evaluate an applicant’s credit score from their features. Li et al. [27] have introduced a linear combination of kernel functions to enhance the interpretability of credit classification models, and proposed an alternative model to optimize the parameters based on the evolution strategy. Celikyilmaz and Turksen [20] have introduced a type II fuzzy function system for uncertainty modeling using evolutionary algorithms (ET2FF), and used it in real-life applications, such as financial market modeling. In this model, an improved fuzzy clustering is initially used to find the hidden structures, and then the genetic algorithm is applied to optimize the interval type II fuzzy sets. Chen and Li [28] have proposed a class of hybrid-SVM models. In these models, a support vector machine classifier is, respectively, combined with conventional LDA, decision tree, F-score, and Rough sets, as pre-processing steps to optimize feature space by removing both redundant and irrelevant features.
Bijak and Thomas [29] have proposed a two-step and simultaneous approach, in which both segmentation and scorecards are optimized at the same time by using Logistic Trees. Chi and Hsu [30] have combined a bank’s internal behavioral scoring model with the external credit bureau scoring model to construct the dual scoring model for credit risk management of mortgage accounts. Ping and Yongheng [31] have proposed a hybrid model by using the neighborhood rough set to select input features, and grid search to optimize RBF kernel parameters. Finally, they used hybrid optimal input features and model parameters to solve the credit-scoring problem. Kim and Han [32] have presented a hybrid method of Self-Organizing Map (SOM) and case-based reasoning (CBR) for the prediction of corporate bond rating. Park and Han [33] have attempted to integrate analytic hierarchy process with case-based reasoning as a tool of feature weighting to improve predictive performance of CBR in business failure predictions.
Ahn and Kim [34] have proposed a novel hybrid approach using genetic algorithm (GA) for case-based reasoning in corporate bankruptcies. Capotorti and Barbanera [35] have proposed a hybrid methodology for classification, based on the methodologies of fuzzy sets, partial conditional probability assessments, and rough sets. Akkoc [36] proposed a three-stage hybrid adaptive neuro-fuzzy inference system (ANFIS) for credit scoring, which is based on statistical techniques, artificial neural networks, and fuzzy logic. Laha [37] has proposed a hybrid soft credit-scoring model using fuzzy rule based classifiers. In this model, the rule base is first learned from the training data using a Self-Organizing Map (SOM), and then the fuzzy K-nearest neighbor rule is incorporated to design a contextual classifier that integrates the context information from the training set. Yao [38] proposed a hybrid fuzzy support vector machine (FSVM) for credit scoring using three strategies: (1) using classification and regression trees (CART) to select input features; (2) using multivariate adaptive regression splines (MARS) to select input features; (3) using GA to optimize model parameters.
In this paper, a soft intelligent hybrid classification model of traditional multi-layer perceptrons (MLPs) is proposed in order to yield more accurate results in credit scoring. In the proposed model, a multi-layer perceptron is first used to preprocess the raw data and provide a necessary background in order to apply a fuzzy regression model. Then, the obtained parameters of the first stage are considered in the form of fuzzy numbers and the optimum values of the parameters are calculated using the basic concept of fuzzy regression. In order to show the effectiveness and appropriateness of the proposed model, its performance in the Australian credit data set is compared with those of some fuzzy and nonfuzzy, linear and nonlinear, and intelligent classification models. Empirical results indicate that the proposed model is an effective method to improve classification accuracy.
The rest of the paper is organized as follows: In the next section, the formulation of the proposed hybrid model for classification tasks is introduced. In Section 3, the Australian credit data set is illustrated. In Section 4, the proposed model is applied to the Australian credit data set. In Section 5, the performance of the proposed model is compared to some other classification models, presented in the literature for Australian credit scoring. Finally, the conclusions are discussed.

2. Formulation of the Proposed Hybrid Model

Multi-layer perceptrons (MLPs) are flexible computing frameworks and universal approximators that can be applied to a wide range of classification problems with a high degree of accuracy. Several distinguishing features of multi-layer perceptrons make them valuable and attractive for classification tasks. The most important of these is that MLPs, as opposed to the traditional model-based techniques, are data-driven self-adaptive methods in that there are a priori assumptions about the models for problems under study [39]. The parameters of multi-layer perceptrons (MLPs) (weights and biases) are crisp ( w i , j ( i = 0 , 1 , 2 , ... , p j = 1 , 2 , ... , q ) , w j ( j = 0 , 1 , 2 , ... , q ) ). In the proposed model, instead of using crisp, fuzzy parameters, triangular fuzzy numbers are used ( w ˜ i , j ( i = 0 , 1 , 2 , ... , p j = 1 , 2 , ... , q ) , w ˜ j ( j = 0 , 1 , 2 , ... , q ) ). The model is described using a fuzzy function with a fuzzy parameter [40]:
y ˜ t = f ( w ˜ 0 + j = 1 q w ˜ j g ( w ˜ 0 , j + i = 1 p w ˜ i , j y t i ) ) ,
where, y t are observations, w ˜ i , j ( i = 0 , 1 , 2 , ... , p j = 1 , 2 , ... , q ) , w ˜ j ( j = 0 , 1 , 2 , ... , q ) are fuzzy numbers. Equation (1) is modified as follows:
y ˜ t = f ( w ˜ 0 + j = 1 q w ˜ j X ˜ t , j ) = f ( j = 0 q w ˜ j X ˜ t , j ) ,
where, X ˜ t , j = g ( w ˜ 0 , j + i = 0 p w ˜ i , j y t i ) . Fuzzy parameters in the form of triangular fuzzy numbers w ˜ i , j = ( a i , j , b i , j , c i , j ) are used:
μ w ˜ i , j ( w i , j ) = { 1 b i , j a i , j ( w i , j a i , j ) a i , j w i , j b i , j , 1 b i , j c i , j ( w i , j c i , j ) b i , j w i , j c i , j , 0 o t h e r w i s e ,
where, μ w ˜ ( w i , j ) is the membership function of the fuzzy set that represents parameter w i , j . By applying the extension principle, the membership of X ˜ t , j = g ( w ˜ 0 , j + i = 1 p w ˜ i , j y t i ) in Equation (2) is given as shown in Equation (4) [40]:
μ X ˜ t , j ( X t , j ) { ( X t , j g ( i = 0 p a i , j y t , i ) ) g ( i = 0 p b i , j y t , i ) g ( i = 0 p a i , j y t , i ) i f g ( i = 0 p a i , j y t , i ) X t , j g ( i = 0 p b i , j y t , i ) , ( X t , j g ( i = 0 p c i , j y t , i ) ) g ( i = 0 p b i , j y t , i ) g ( i = 0 p c i , j y t , i ) i f g ( i = 0 p b i , j y t , i ) X t , j g ( i = 0 p c i , j y t , i ) , 0 o t h e r w i s e ,
where, y t , i = 1 ( t = 1 , 2 , ... , k i = 0 ) , y t , i = y t i ( t = 1 , 2 , ... , k i = 1 , 2 , ... , p ) . Considering triangular fuzzy numbers, X ˜ t , j with membership function in Equation (3) and triangular fuzzy parameters w ˜ j the membership function of y ˜ t = f ( w ˜ 0 + j = 1 q w ˜ j X ˜ t , j ) = f ( j = 0 q w ˜ j X ˜ t , j ) is given as:
μ Y ˜ ( y t ) { B 1 2 A 1 + [ ( B 1 2 A 1 ) 2 C 1 f 1 ( y t ) A 1 ] 1 2 i f C 1 f 1 ( y t ) C 3 , B 2 2 A 2 + [ ( B 2 2 A 2 ) 2 C 2 f 1 ( y t ) A 2 ] 1 2 i f C 3 f 1 ( y t ) C 2 , 0 o t h e r w i s e ,
where,
A 1 = j = 0 q ( e j d j ) ( g ( i = 0 p b i , j y t , i ) g ( i = 0 p a i , j y t , i ) ) , B 1 = j = 0 q ( d j ( g ( i = 0 p b i , j y t , i ) g ( i = 0 p a i , j y t , i ) ) + g ( i = 0 p a i , j y t , i ) ( e j d j ) ) ,
A 2 = j = 0 q ( f j e j ) ( g ( i = 0 p c i , j y t , i ) g ( i = 0 p b i , j y t , i ) ) , B 2 = j = 0 q ( f j ( g ( i = 0 p c i , j y t , i ) g ( i = 0 p b i , j y t , i ) ) + g ( i = 0 p c i , j y t , i ) ( f j e j ) ) ,
C 1 = j = 0 q ( d j g ( i = 0 p a i , j y t , i ) )
C 2 = j = 0 q ( f j g ( i = 0 p c i , j y t , i ) ) ,
C 3 = j = 0 q ( e j g ( i = 0 p b i , j y t , i ) ) ,
The final point is that the output of the proposed model is fuzzy and continuous, while our classification problem differs in that its output is discrete and nonfuzzy. Therefore, in order to apply the proposed model to classification, certain modifications to the model needed to be made. For this purpose, each class is first assigned a numeric value, and then the membership probability of the output in each class is calculated as follows:
P A = 1 P B = m f ( x ) d x + f ( x ) d x = 1 m + f ( x ) d x + f ( x ) d x
where P A and P B are the membership probability of class A and B , respectively, and m is the mean of the class values. Finally, the sample is put in the class with which its output has the largest probability. In the proposed model, due to the fact that output is fuzzy, it may be better to apply large class values. The larger class values expand small differences in the output, helping the model to become more sensitive to variations in the input.

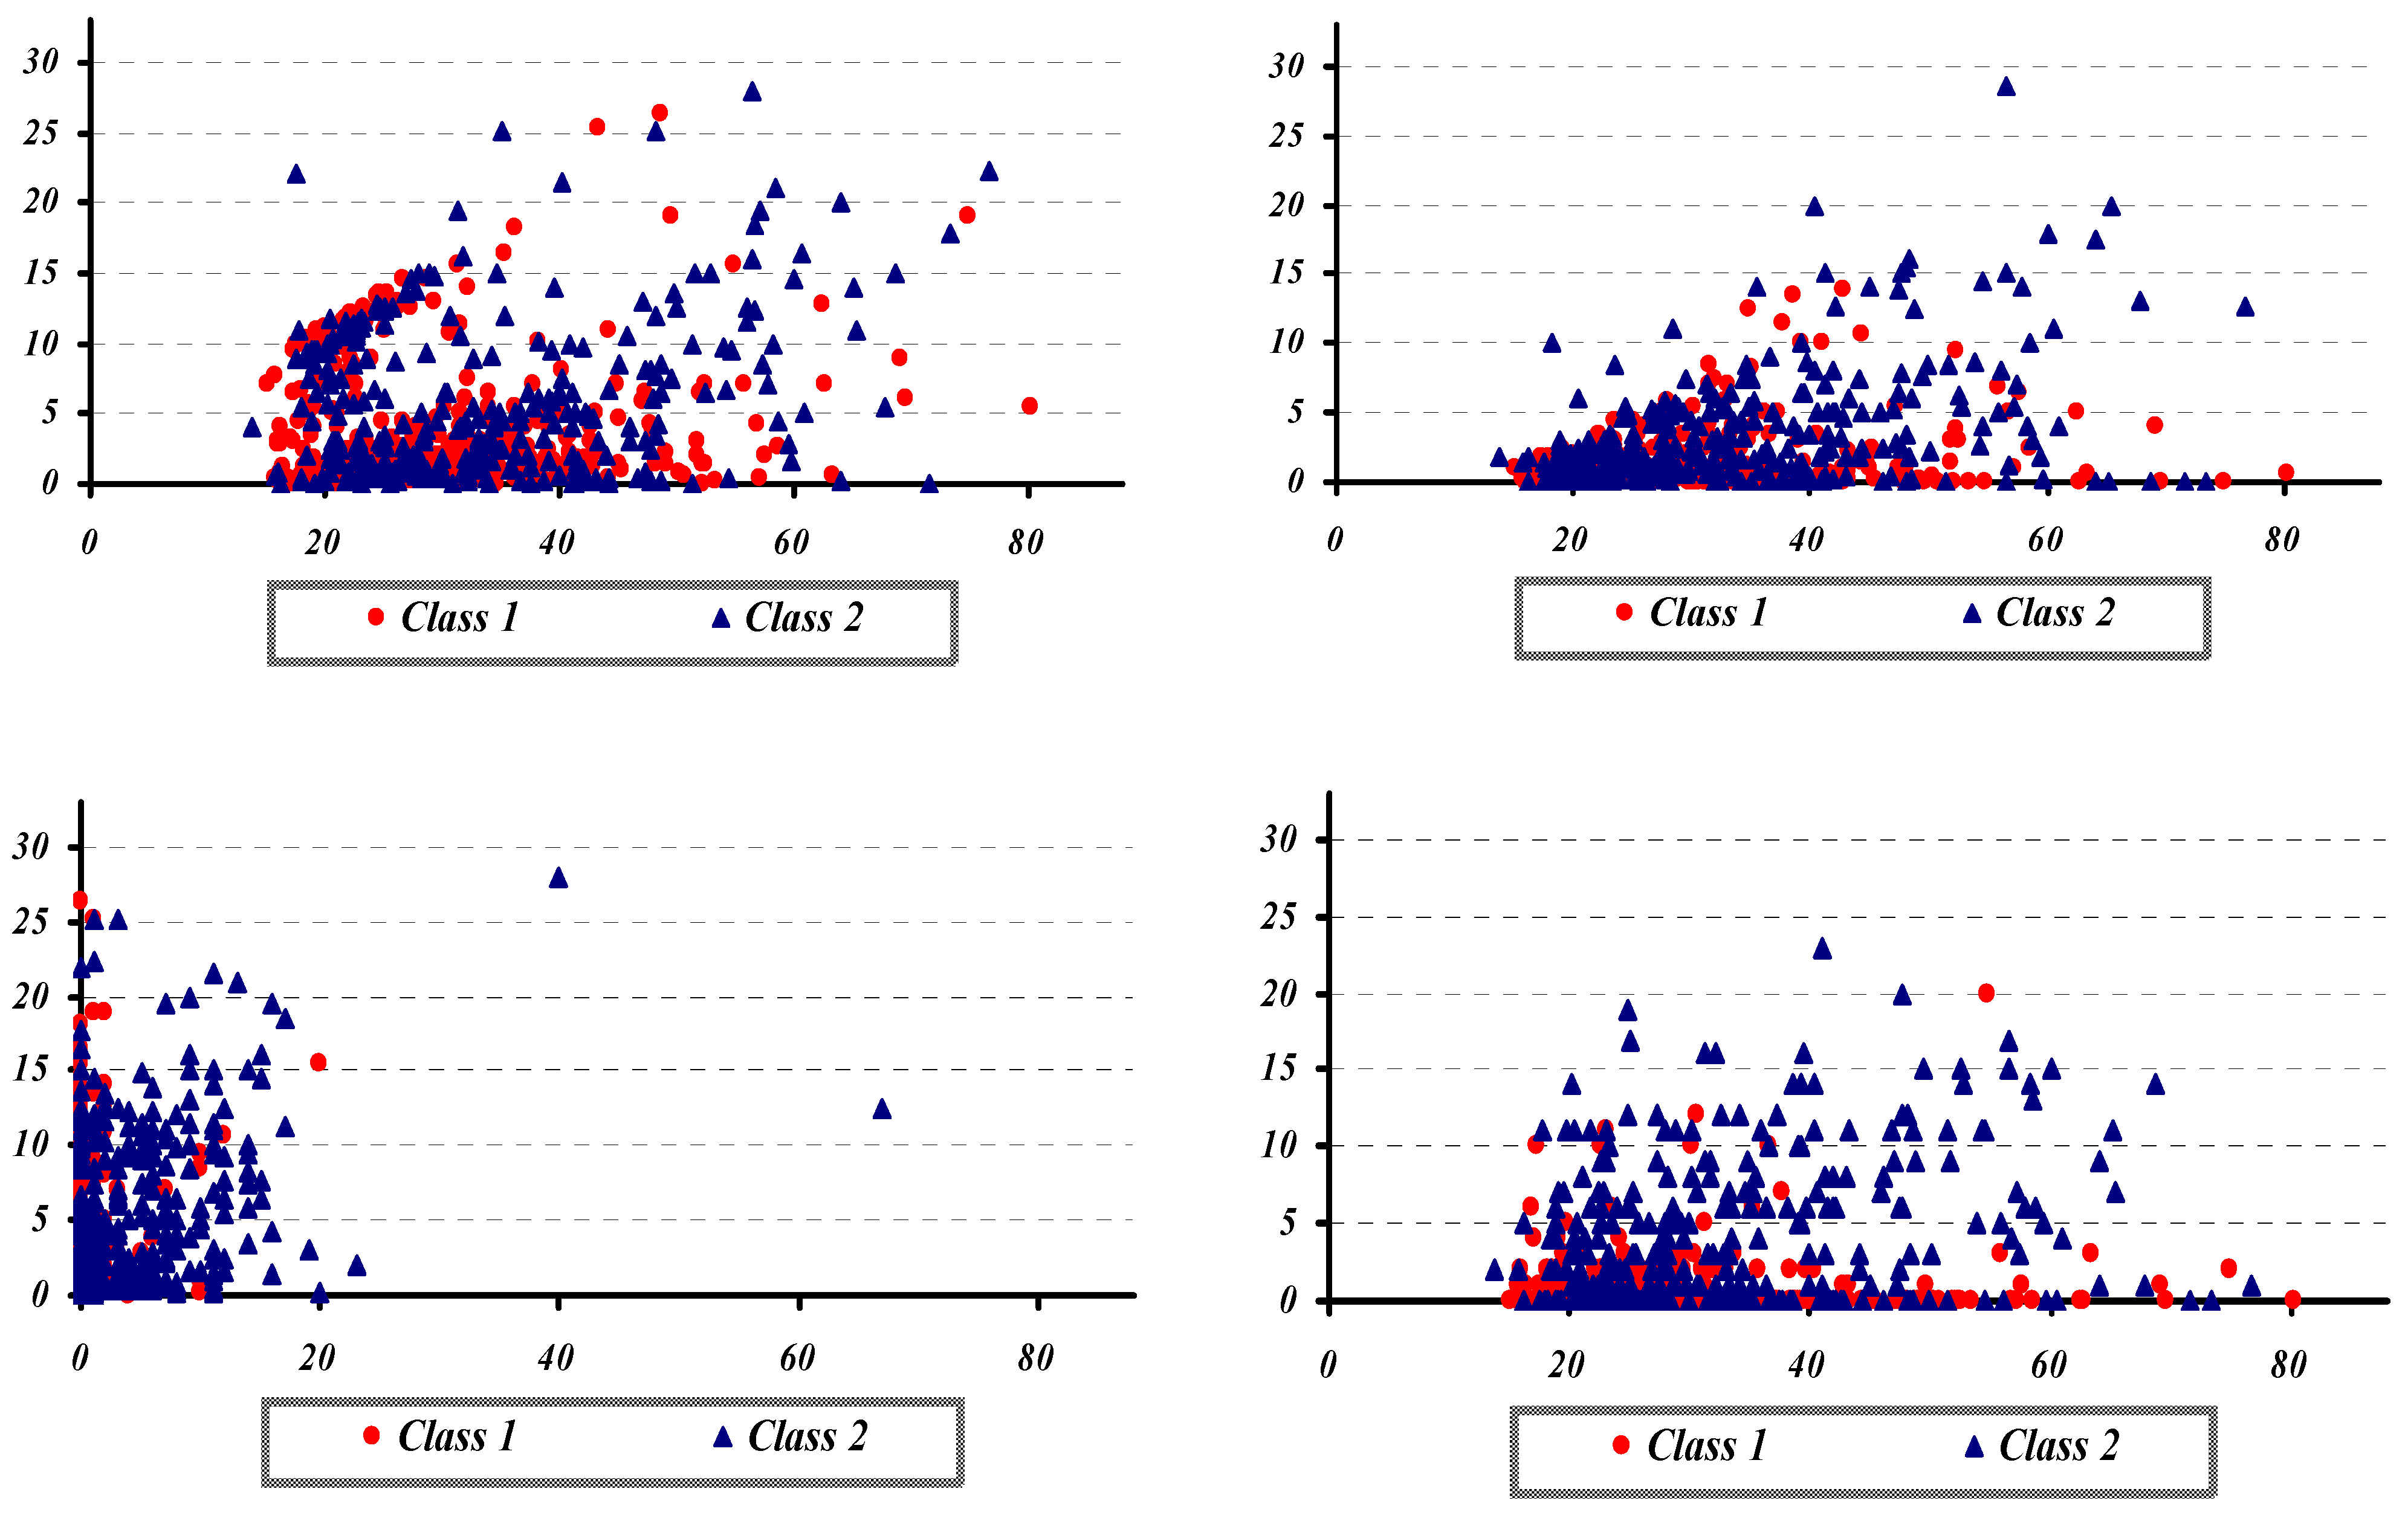
3. The Australian Credit Data Sets

In this section, in order to show the appropriateness and effectiveness of the proposed model for two-class real-life financial data classification, the Australian credit data set has been used. This data set is very interesting for financial researchers because there is a good mix of attributes, including continuous, nominal with small numbers of values, and nominal with larger numbers of values. A brief description of the data set is presented below.

Australian Credit Data Set

The Australian credit data set contains 690 observations with fourteen attributes in total. Eight of these attributes are discrete, with two to fourteen values, and six of them are continuous attributes. There are 307 positive instances (approximately 44.5%) and 383 negative instances (approximately 55.5%) in this data set. All attribute names and values have been changed to meaningless symbols in order to protect the confidentiality of the data. The data set is summarized in Table 1. In this paper, this data set is randomly divided into training and test data, in which 50% were training and 50% were test examples. The two-dimensional distribution of these two classes against the (A2, A3), (A2, A7), (A3, A10), and (A2, A10), as an example, is shown in Figure 1.
Table 1. Australian credit data set.
AttributesTypeValuesValues (Formerly)
Attribute 1Discrete0,1a,b
Attribute 2Continuous13.75−80.2513.75−80.25
Attribute 3Continuous0−280−28
Attribute 4Discrete1,2,3p,g,gg
Attribute 5Discrete1,2,3,…,14ff,d,i,k,j,aa,m,c,w,e,q,r,cc,x
Attribute 6Discrete1,2,3,…,9ff,dd,j,bb,v,n,o,h,z
Attribute 7Continuous0−28.50−28.5
Attribute 8Discrete0,1t,f
Attribute 9Discrete0,1t,f
Attribute 10Continuous0−670−67
Attribute 11Discrete0,1t,f
Attribute12Discrete1,2,3s,g,p
Attribute13Continuous0−20000−2000
Attribute14Continuous0−100,0000−100,000
ClassDiscrete0,1−,+
Figure 1. The two-dimensional distribution of the Australian credit cards classes.
Ijfs 03 00411 g001

4. Application the Proposed Hybrid Model to Australian Credit Scoring

In this section, the procedure of the hybrid proposed model for the Australian credit data set is illustrated. Therefore, in the first stage, in order to obtain the optimum network architecture, based on the concepts of multi-layer perceptrons design [41] and using pruning algorithms in the MATLAB 7 package software, different network architectures are evaluated to compare performance. The best fitted network is selected, and, therefore, the architecture that presented the best accuracy with the test data, is composed of fourteen inputs, fourteen hidden, and one output neuron (in abbreviated form, N(14−14−1)). Then, in the second stage, the minimal fuzziness of the fuzzy parameters is determined using Equation (5) with h = 0. As mentioned previously, the h-level value influences the width of the fuzzy parameters. In this case, we consider h = 0 in order to yield parameters with a minimum width. The misclassification rate of each model and improvement percentages of the proposed model, in comparison with the models in the test data are summarized in Table 2 and Table 3, respectively. The improvement percentage of the proposed model in comparison with the other classification models, is calculated as follows:
I m   p r o v e m e n t ( % ) = ( M i s c l a s s i f i c a t i o n R a t e o f d e s i r e d m o d e l M i s c l a s s i f i c a t i o n R a t e o f p r o p o s e d m o d e l ) M i s c l a s s i f i c a t i o n R a t e o f d e s i r e d m o d e l × 100 %
Table 2. Misclassification rate of classification models for Australian credit data set.
ModelClassification Error (%)
Test Data
Linear Discriminant Analysis (LDA)14.0
Quadratic Discriminant Analysis (QDA)19.9
K-Nearest Neighbor (KNN)14.2
Support Vector Machines (SVM)22.5
Artificial Neural Networks (ANN)12.3
Proposed Hybrid Model10.9
Table 3. Improvement of the proposed model in comparison with those of other classification models.
ModelImprovement (%)
Test Data
Linear Discriminant Analysis (LDA)22.14
Quadratic Discriminant Analysis (QDA)45.23
K-Nearest Neighbor (KNN)23.24
Support Vector Machines (SVM)51.56
Artificial Neural Networks (ANN)11.38

Comparison with Other Classifiers

According to the obtained results (Table 2 and Table 3), our proposed model has the lowest error on the test portion of the data set in comparison with the other models used for the Australian credit data set, with a misclassification rate of 10.9%. Several different architectures of artificial neural network are designed and examined. The best performing architecture for a traditional multi-layer perceptron (MLP) produces a 12.3% error rate, which, in the proposed model, improves by 11.38%. The linear discriminant analysis (LDA) has the second best performance. The linear discriminant analysis model produces an error rate of 14.0%. The proposed model improves upon this by 22.14% for linear discriminant analysis. As K-nearest neighbor (KNN) scores can be sensitive to the relative magnitude of different attributes, all attributes are scaled by their z-scores before using the K-nearest neighbor model. The best K-nearest neighbor model has an error rate of 14.2%, which is 23.24% higher than the proposed model error. Quadratic discriminant analysis (QDA) has an error rate of 19.9%, which is 45.23% higher than the proposed model. Support vector machine (SVM) with C = 0 misclassifies 22.5% of the test samples, which is 51.56% worse than the proposed model.

5. Conclusions

In recent years, credit risk analysis has been an active research area. Risk management and credit scoring is one of the key analytical techniques in credit risk evaluation. Therefore, generating both accurate, as well as explanatory, classification models is becoming increasingly important. In this paper, a soft version of traditional multi-layer perceptrons is proposed as an alternative classification model, using the unique soft computing advantages of fuzzy logic. In the proposed model, instead of crisp weights and biases, fuzzy numbers are used in multi-layer perceptrons for better modeling of the uncertainties in financial markets. The proposed model, in contrast to linear and quadratic discriminant analyses, does not assume the shape of the partition or the relation between dependent and independent variables. This model does not require storage of training data, unlike the K-nearest neighborhood classifier. Support vector machines require setting a penalty parameter and selecting the kernel function, whereas this classifier, without parameter setting, leans on the training process in order to identify the final classifier. Finally, it does not need a large amount of data to yield accurate results, as with traditional multi-layer perceptrons. In order to indicate the appropriateness and effectiveness of the proposed model, five well-known statistical and intelligent classification models are used for credit scoring classifications. The obtained results show that the proposed model is superior to all alternative models.

Author Contributions

Both authors contributed equally to all aspects of this paper.

Conflicts of Interest

The authors declare no conflict of interest.

References

  1. E.M. Lewis. An Introduction to Credit Scoring. San Rafael, CA, USA: Athena Press, 1992. [Google Scholar]
  2. D. West. “Neural network credit scoring models.” Comput. Oper. Res. 27 (2000): 1131–1152. [Google Scholar] [CrossRef]
  3. K. Lee, D. Booth, and P. Alam. “A comparison of supervised and unsupervised neural networks in predicting bankruptcy of Korean firms.” Expert Syst. Appl. 29 (2005): 1–16. [Google Scholar] [CrossRef]
  4. D. Durand. Risk Elements in Consumer Instalment Financing. New York, NY, USA: National Bureau of Economic Research, 1941. [Google Scholar]
  5. T. Harris. “Credit scoring using the clustered support vector machine.” Expert Syst. Appl. 42 (2015): 741–750. [Google Scholar] [CrossRef] [Green Version]
  6. H.A. Abdou, and J. Pointon. “Credit Scoring, Statistical Techniques and Evaluation Criteria: A Review of the Literature.” Intell. Syst. Account. Financ. Manag. 18 (2011): 59–88. [Google Scholar] [CrossRef]
  7. D. Lando. Credit risk modeling: Theory and applications. Princeton Series in Finance; Princeton, NJ, USA: Princeton University Press, 2004. [Google Scholar]
  8. L.C. Thomas, D.B. Edelman, and J.N. Crook. Credit Scoring and its Applications. SIAM Monographs on Mathematical Modeling and Computation; Philadelphia, PA, USA: SIAM, 2002. [Google Scholar]
  9. C. Bolton. “Logistic Regression and its Application in Credit Scoring.” MSc Dissertation, University of Pretoria, Pretoria, South Africa, 2009. [Google Scholar]
  10. J.C. Wiginton. “A note on the comparison of logit and discriminant models of consumer credit behaviour.” J. Financ. Quant. Anal. 15 (1980): 757–770. [Google Scholar] [CrossRef]
  11. G. Lee, T.K. Sung, and N. Chang. “Dynamics of modeling in data mining: Interpretive approach to bankruptcy prediction.” J. Manag. Inform. Syst. 16 (1999): 63–85. [Google Scholar]
  12. T.S. Lee, and I.F. Chen. “A two-stage hybrid credit scoring model using artificial neural networks and multivariate adaptive regression splines.” Expert Syst. Appl. 28 (2005): 743–752. [Google Scholar] [CrossRef]
  13. T. Bellotti, and J. Crook. “Support vector machines for credit scoring and discovery of significant features.” Expert Syst. Appl. 36 (2008): 3302–3308. [Google Scholar] [CrossRef]
  14. B.J. Grablowsky, and W.K. Talley. “Probit and discriminant functions for classifying credit applicants: A comparison.” J. Econ. Bus. 33 (1981): 254–261. [Google Scholar]
  15. W.E. Henley, and D.J. Hand. “Nearest neighbor analysis in credit scoring.” Statistician 45 (1996): 77–95. [Google Scholar] [CrossRef]
  16. B. Baesens, M. Egmont-Petersen, R. Castelo, and J. Vanthienen. “Learning Bayesian network classifiers for credit scoring using Markov chain Monte Carlo search.” In Proceedings of the 16th International Conference on Pattern Recognition (ICPR’02), Quebec, Canada, 2002; Volume 3, p. 30049.
  17. T. Pavlenko, and O. Chernyak. “Credit risk modeling using Bayesian networks.” Int. J. Intell. Syst. 25 (2010): 326–344. [Google Scholar] [CrossRef]
  18. M. Paliwal, and U.A. Kumar. “Neural networks and statistical techniques: A review of applications.” Expert Syst. Appl. 36 (2009): 2–17. [Google Scholar] [CrossRef]
  19. M. Khashei, M. Bijari, and G.A. Raissi. “Improvement of auto-regressive integrated moving average models using fuzzy logic and artificial neural networks (ANNs).” Neurocomputing 72 (2009): 956–967. [Google Scholar] [CrossRef]
  20. A. Celikyilmaz, and I.B. Turksen. “Uncertainty modeling of improved fuzzy functions with evolutionary systems.” IEEE Trans. Syst. Man Cybern. 38 (2008): 1098–1110. [Google Scholar] [CrossRef] [PubMed]
  21. M. Khashei, M. Bijari, and S.R. Hejazi. “Combining seasonal ARIMA models with computational intelligence techniques for time series forecasting.” Soft Comput. 16 (2012): 1091–1105. [Google Scholar] [CrossRef]
  22. M. Khashei, A.Z. Hamadani, and M. Bijari. “A novel hybrid classification model of artificial neural networks and multiple linear regression models.” Expert Syst. Appl. 39 (2012): 2606–2620. [Google Scholar] [CrossRef]
  23. T.S. Lee, C.C. Chiu, C.J. Lu, and I.F. Chen. “Credit scoring using the hybrid neural discriminant technique.” Expert Syst. Appl. 23 (2002): 245–254. [Google Scholar] [CrossRef]
  24. N.-C. Hsieh. “Hybrid mining approach in the design of credit scoring models.” Expert Syst. Appl. 28 (2005): 655–665. [Google Scholar] [CrossRef]
  25. S.-T. Luo, B.-W. Cheng, and C.-H. Hsieh. “Prediction model building with clustering-launched classification and support vector machines in credit scoring.” Expert Syst. Appl. 36 (2009): 7562–7566. [Google Scholar] [CrossRef]
  26. C.L. Hung, M.C. Chen, and C.J. Wang. “Credit scoring with a data mining approach based on support vector machines.” Expert Syst. Appl. 33 (2007): 847–856. [Google Scholar] [CrossRef]
  27. J. Li, L. Wei, G. Li, and W. Xu. “An evolution strategy-based multiple kernels multi-criteria programming approach: The case of credit decision making.” Decis. Support Syst. 51 (2011): 292–298. [Google Scholar] [CrossRef]
  28. F.-L. Chen, and F.-C. Li. “Combination of feature selection approaches with SVM in credit scoring.” Expert Syst. Appl. 37 (2010): 4902–4909. [Google Scholar] [CrossRef]
  29. K. Bijak, and L.C. Thomas. “Does segmentation always improve model performance in credit scoring.” Expert Syst. Appl. 39 (2012): 2433–2442. [Google Scholar] [CrossRef]
  30. B.-W. Chi, and C.-C. Hsu. “A hybrid approach to integrate genetic algorithm into dual scoring model in enhancing the performance of credit scoring model.” Expert Syst. Appl. 39 (2012): 2650–2661. [Google Scholar] [CrossRef]
  31. Y. Ping, and L. Yongheng. “Neighborhood rough set and SVM based hybrid credit scoring classifier.” Expert Syst. Appl. 38 (2011): 11300–11304. [Google Scholar] [CrossRef]
  32. K.S. Kim, and I. Han. “The cluster-indexing method for case based reasoning using self-organizing maps and learning vector quantization for bond rating cases.” Expert Syst. Appl. 21 (2001): 147–156. [Google Scholar] [CrossRef]
  33. C. Park, and I. Han. “A case-based reasoning with the feature weights derived by analytic hierarchy process for bankruptcy prediction.” Expert Syst. Appl. 23 (2002): 255–264. [Google Scholar] [CrossRef]
  34. H. Ahn, and K.-J. Kim. “Bankruptcy prediction modeling with hybrid case-based reasoning and genetic algorithms approach.” Appl. Soft Comput. 9 (2009): 599–607. [Google Scholar] [CrossRef]
  35. A. Capotorti, and E. Barbanera. “Credit scoring analysis using a fuzzy probabilistic rough set model.” Comput. Stat. Data Anal. 56 (2012): 981–994. [Google Scholar] [CrossRef]
  36. S. Akkoc. “An empirical comparison of conventional techniques, neural networks and the three stage hybrid Adaptive Neuro Fuzzy Inference System (ANFIS) model for credit scoring analysis: The case of Turkish credit card data.” Eur. J. Oper. Res. 222 (2012): 168–178. [Google Scholar] [CrossRef]
  37. A. Laha. “Building contextual classifiers by integrating fuzzy rule based classification technique and k-NN method for credit scoring.” Adv. Eng. Inform. 21 (2007): 281–291. [Google Scholar] [CrossRef]
  38. P. Yao. “Hybrid fuzzy SVM model using CART and MARS for credit scoring.” In Proceedings of the International Conference on Intelligent Human-Machine Systems and Cybernetics, IHMSC’09, Hangzhou, China, 26–27 August 2009; pp. 392–395.
  39. M. Khashei, and M. Bijari. “An artificial neural network (p, d, q) model for time series forecasting.” Expert Syst. Appl. 37 (2010): 479–489. [Google Scholar] [CrossRef]
  40. M. Khashei, S.R. Hejazi, and M. Bijari. “A new hybrid artificial neural networks and fuzzy regression model for time series forecasting.” Fuzzy Sets Syst. 159 (2008): 769–786. [Google Scholar] [CrossRef]
  41. M. Khashei. “Forecasting the Isfahan Steel Company Production Price in Tehran Metals Exchange Using Artificial Neural Networks (ANNs).” Master of Science Thesis, Isfahan University of Technology, Isfahan, Iran, 2005. [Google Scholar]

