Abstract
The objective of this study is to investigate how responsible AI governance mechanisms influence value creation and sustainability in Saudi banks over the period 2015–2024. Using a panel dataset from listed Saudi banks and combining ESG disclosure metrics with financial indicators, we investigate whether AI adoption and AI-related disclosures enhance banks’ market and accounting performance while strengthening sustainability outcomes. We apply robust panel regressions, control for bank-specific characteristics, and run sensitivity checks to address endogeneity and measurement concerns. The empirical findings indicate that higher levels of AI adoption are positively and significantly associated with both value creation and sustainability performance. Furthermore, Dumitrescu–Hurlin panel Granger causality tests confirm a unidirectional causal relationship from AI adoption to both financial and sustainability outcomes. Overall, the results suggest that responsible AI integration may enhance sustainable value creation in the Saudi banking sector.
Keywords:
responsible AI governance; value creation; sustainability; ESG SCORE; Tobin’s Q; ROA; ROE; Saudi banks JEL Classification:
G21; G34; M14; O33; Q56
1. Introduction
In the modern financial environment, Artificial Intelligence (AI) has become a key instrument for improving both operational efficiency and corporate governance. Banks are increasingly leveraging AI-based solutions to optimize risk management, customer service, and decision-making processes. However, integrating AI into operations raises questions about responsible governance, transparency, and alignment with sustainability objectives. Responsible AI Governance Mechanisms—including policies, monitoring systems, and ethical guidelines—are therefore critical to ensure that AI adoption contributes to both financial performance and broader environmental, social, and governance (ESG) outcomes.
The responsible adoption of AI in the Saudi banking sector aligns closely with the objectives of Saudi Arabia’s Vision 2030, which emphasizes digital transformation, innovation, and sustainable economic growth. By promoting the integration of advanced technologies within financial institutions, Vision 2030 seeks to enhance operational efficiency, strengthen governance, and support sustainable value creation. Responsible AI governance—through ethical guidelines, monitoring systems, and transparency policies—plays a central role in ensuring that technological adoption contributes not only to improved financial performance but also to broader environmental, social, and governance outcomes. Highlighting this strategic alignment underscores the national relevance of the present study, positioning the analysis of AI adoption in Saudi banks within the broader framework of the country’s long-term development priorities.
In parallel, the concept of Value Creation has evolved beyond traditional financial metrics, incorporating sustainability as a key dimension of corporate performance. For banks, Value Creation can be measured through Tobin’s Q, return on assets, and return on equity, while ESG performance, proxied by ESG SCORE, reflects the firm’s commitment to sustainable practices. Integrating AI governance with these performance indicators provides an opportunity to understand how technological adoption interacts with both economic and sustainability outcomes.
AI is increasingly recognized as a transformative force in banking, reshaping operational models and propelling the sector towards sustainable, value-oriented growth. Prior research emphasizes that AI technologies enable banks to enhance risk assessment, streamline decision-making, and improve customer service, which are key drivers of financial performance and innovation (Dwivedi et al., 2021; Ridzuan et al., 2024). Notably, studies show that responsible AI governance—through the implementation of ethical guidelines, transparency policies, and rigorous monitoring—can strengthen trust, mitigate ethical risks, and optimize AI’s contribution to both financial and non-financial outcomes (Bitzenis et al., 2025; R. Chen & Zhang, 2024).
In terms of sustainability, research finds that AI’s integration with Environmental, Social, and Governance frameworks supports advanced analytics, real-time ESG reporting, and predictive modeling of sustainability risks, thereby enabling financial institutions to align decision-making with societal and environmental objectives (R. Chen & Zhang, 2024; Deberdt et al., 2025). Empirical studies further highlight positive associations between responsible AI adoption and improvements in ESG scores, as well as traditional measures of value creation, particularly in Islamic and GCC banking contexts (Buallay et al., 2020; Sendi et al., 2024).
Despite this progress, the interaction between AI governance and sustainable value creation remains underexplored in emerging markets like Saudi Arabia. This study addresses this gap by exploring how Responsible AI Governance Mechanisms influence value creation and sustainability across ten Saudi banks during the period 2015–2024. The analysis employs POLS, Fixed Effects with Driscoll–Kraay standard errors, CCEMG, MG, and two-step system GMM estimators, complemented by Dumitrescu–Hurlin panel Granger causality tests, to ensure robustness and account for heterogeneity and endogeneity.
The main goal of the research is to examine how responsible AI governance mechanisms affect both value creation and sustainability in Saudi banks over the period 2015–2024. In particular, the analysis focuses on the association between AI adoption and financial performance, measured by Tobin’s Q, return on assets (ROA), and return on equity (ROE), as well as its relationship with sustainability, proxied by ESG SCORE. Additionally, the investigation explores the predictive role of AI adoption using Dumitrescu–Hurlin panel Granger causality tests, while ensuring robustness through several estimation methods, including POLS, Fixed Effects with Driscoll–Kraay standard errors, CCEMG, MG, and two-step system GMM.
This research offers three main contributions to literature: first, by providing empirical evidence on responsible AI adoption’s impact on financial and ESG performance; second, by highlighting the predictive relationship between AI governance and corporate performance; and third, by offering actionable insights for policymakers and bank managers to integrate AI governance practices, supporting value creation and sustainability in alignment with Vision 2030.
The rest of the paper is organized as follows: Section 2 provides a review of the existing literature; Section 3 details the data sources and research methodology; Section 4 presents and analyzes the empirical results; Section 5 discusses the implications and suggests avenues for future research; and Section 6 concludes the paper.
2. Literature Review
2.1. Theoretical Perspectives
The relationship between responsible AI governance, value creation, and sustainability in banking can be explained through multiple theoretical frameworks. The Resource-Based View (RBV) positions AI capabilities as strategic assets that are valuable, rare, and difficult to imitate, providing banks with a sustained competitive advantage when effectively governed (Oladapo, 2024). In this sense, AI adoption enhances decision-making, risk management, and operational efficiency, thereby strengthening both financial and sustainability outcomes. Stakeholder Theory is equally central, emphasizing that responsible AI governance aligns the interests of shareholders, regulators, customers, and society by embedding transparency, accountability, and ethical safeguards into corporate strategies (Rane et al., 2024; Ridzuan et al., 2024). Institutional Theory further explains how regulatory frameworks, normative pressures, and Shariah governance in Islamic finance shape the adoption of responsible AI and ESG practices across GCC and Saudi banks (Al-Nimer, 2024; Kashi et al., 2024).
Complementing these perspectives, Dynamic Capabilities Theory suggests that banks that can sense, seize, and reconfigure AI-enabled resources in response to regulatory and market shifts are better positioned to sustain long-term performance (Zhang & Yang, 2024). This is particularly relevant in the context of digital transformation, where adaptive governance structures are essential to manage ethical risks and leverage AI for sustainable value creation (Smith, 2024). Collectively, these theories establish a robust conceptual foundation: responsible AI governance serves not only as a driver of financial performance—measured by Tobin’s Q, ROA, and ROE—but also as an enabler of sustainability, proxied by ESG scores, especially within Islamic and GCC banking systems.
2.2. Responsible AI Governance Mechanisms and Value Creation
Responsible AI governance has increasingly been recognized as a key mechanism linking AI adoption to value creation in the banking sector. Value creation is typically measured through financial performance indicators such as Tobin’s Q (TBQ), ROA, and ROE, which reflect market valuation, profitability, and shareholder returns. Empirical studies emphasize that AI governance—anchored in transparency, accountability, and ethical standards—enhances both short-term financial outcomes and long-term sustainability, particularly when integrated into corporate governance structures (S. Li et al., 2023; Ridzuan et al., 2024). By implementing these mechanisms, banks can harness AI adoption to enhance operational efficiency while simultaneously building stakeholder trust and legitimacy—both essential components of value creation (Antoniuk & Koliada, 2025).
The role of AI governance in driving value creation can be observed through multiple pathways. First, responsible governance frameworks enable banks to enhance operational efficiency and optimize resource allocation. AI-based systems are increasingly deployed for predictive analytics, credit scoring, loan monitoring, and fraud detection, all of which reduce costs and improve accuracy in decision-making. These efficiency gains translate into enhanced profitability and stronger competitive positioning (Nosirov et al., 2024; Oyewole et al., 2024). Second, AI governance mechanisms support greater transparency and accountability, particularly in financial reporting and sustainability disclosures. By enabling real-time data processing and monitoring, AI tools ensure higher reliability and accuracy of corporate information, which is increasingly valued by investors, regulators, and rating agencies (Khanfar et al., 2024; Xiao & Xiao, 2025). This alignment between governance and disclosure quality has been found to positively influence both ROA and ROE across banks (Buallay et al., 2020). Third, AI governance mechanisms mitigate reputational and compliance risks. Banks face increasing scrutiny from regulators and stakeholders regarding ethical AI use. By embedding robust AI governance frameworks, institutions can reduce exposure to risks associated with bias, data misuse, or regulatory breaches, thereby preserving firm value and ensuring stable returns (Kashi et al., 2024; Rane et al., 2024).
An increasing number of empirical studies provide evidence of a positive link between AI governance and value creation. For example, Oladapo (2024) found that environmental innovation and management support significantly improve sustainable performance in Saudi banks, illustrating how governance mechanisms translate AI-driven practices into financial outcomes. Similarly, Nathania and Ekawati (2024) demonstrated that ownership structure moderates the ESG–performance relationship, confirming that governance frameworks determine the extent to which AI adoption leads to value creation. Buallay et al. (2020) further established that ESG disclosures embedded within governance structures enhance TBQ, ROA, and ROE across financial institutions, reinforcing the dual financial and reputational benefits of responsible governance. In a similar vein, recent evidence from Saudi Arabia provides robust confirmation of this linkage. For instance, Hamdouni (2025a) reports that ESG performance significantly improves ROA, ROE, and Tobin’s Q in high-pollution industries, highlighting the value of sustainable practices in resource-intensive sectors and their alignment with Vision 2030 objectives. Likewise, a study on 100 non-financial Sharia-compliant firms listed on the Saudi Stock Exchange (2014–2023) demonstrates that ESG disclosure positively and significantly impacts firm value across all three performance indicators, with larger firms realizing greater benefits due to enhanced transparency and stakeholder trust. Together, these findings reinforce the argument that ESG practices foster financial performance across diverse industries and governance contexts in emerging markets such as Saudi Arabia (Hamdouni, 2025c).
However, not all findings are uniformly positive. Several studies highlight that the financial benefits of responsible AI adoption may be contingent on contextual and institutional factors. For instance, Ghosh and Singh (2025) report that while AI-enabled ESG investments improve long-term performance, they can impose higher upfront costs that depress short-term profitability. Similarly, Alamoudi and Hamoudah (2023) found that while social and governance dimensions of ESG enhance financial outcomes, environmental dimensions sometimes yield neutral or negative effects unless supported by strong governance mechanisms. These findings emphasize the importance of considering factors such as bank size, regulatory frameworks, and market maturity in determining the effectiveness of AI governance in creating value (Cai et al., 2024).
Despite the expanding literature, several critical research gaps remain. First, most prior studies have focused on developed economies or cross-country analyses, offering limited insights into emerging markets such as Saudi Arabia, where digital transformation and Vision 2030 priorities uniquely shape the governance–performance nexus. Second, existing empirical research has tended to examine AI adoption, ESG practices, and financial performance in isolation, without capturing the integrated effect of responsible AI governance as a mediating mechanism linking technological adoption to both financial and sustainability outcomes. Third, while earlier works employ short-term or cross-sectional data, there is a lack of longitudinal evidence assessing how AI governance influences value creation over time in banking contexts. Finally, methodological limitations—such as reliance on single estimators or neglect of endogeneity—raise concerns about robustness and causal inference.
Addressing these gaps, the present research provides a more comprehensive framework by combining multiple advanced panel estimators (POLS, Fixed Effects with Driscoll–Kraay errors, CCEMG, MG, and two-step system GMM) and incorporating Dumitrescu–Hurlin panel Granger causality tests. This multidimensional approach allows for both robustness and predictive validation. Moreover, by focusing on Saudi banks during 2015–2024, the analysis captures the country’s transition toward AI-driven sustainability under Vision 2030, offering contextually grounded evidence on how responsible AI governance enhances both value creation and ESG performance.
Recent developments in digital transformation further underline the centrality of responsible AI governance in creating value. AI applications in credit analytics, ESG monitoring, and predictive risk assessment are reshaping how banks balance profitability with sustainability (Baffour Gyau et al., 2024; Dammak et al., 2024). Empirical research increasingly suggests that integrating these innovations into governance frameworks not only improves financial stability but also enhances long-term shareholder returns and market reputation (Al-Baity, 2023; Alhammadi, 2024). As global and local regulatory environments tighten, responsible AI governance mechanisms are likely to become indispensable for sustaining value creation in the banking sector (Oyewole et al., 2024).
Responsible AI governance mechanisms provide the institutional and organizational scaffolding through which AI adoption translates into value creation in banking. The evidence indicates that such governance is positively associated with key measures of financial performance, though the strength and consistency of these associations vary by context. Future research should continue to refine AI governance frameworks, expand empirical testing across diverse banking markets, and explore the balance between short-term costs and long-term gains. By doing so, banks can better harness AI as a strategic resource to generate sustained value creation in a rapidly evolving financial environment.
2.3. Responsible AI Governance Mechanisms and Sustainability
Responsible AI governance has emerged as a vital enabler of corporate sustainability, particularly as measured by ESG performance. ESG scores reflect a firm’s environmental stewardship, social responsibility, and governance quality, and are increasingly used by investors and regulators to evaluate long-term viability. AI adoption, when embedded within robust governance mechanisms, allows firms to improve monitoring, reporting, and compliance with ESG standards, thereby enhancing overall sustainability outcomes (J. Chen et al., 2024; S. Li et al., 2023; J. Li et al., 2025; Zhang & Yang, 2024). Using advanced data analytics and real-time monitoring, AI systems can evaluate environmental performance, measure social impacts, and enhance governance practices, thereby serving as a powerful instrument for achieving ESG objectives (Deberdt et al., 2025; Xiao & Xiao, 2025; X. Zhou et al., 2025).
Recent empirical evidence consistently underscores a positive relationship between AI governance and ESG performance. Oladapo (2024) finds that AI-enabled environmental innovation directly enhances sustainability in Saudi banks, while Ridzuan et al. (2024) emphasize that transparent AI governance improves stakeholder trust and legitimacy, leading to higher ESG scores. Wang and Chen (2025) further show that responsible AI adoption enhances accountability and reduces risks of ethical lapses, reinforcing governance quality. Nathania and Ekawati (2024) demonstrate that ownership structures moderate the ESG–performance nexus, suggesting that AI governance mechanisms are essential to ensure equitable and effective adoption across institutions. Similarly, Kashi et al. (2024) and Rane et al. (2024) highlight how regulatory and institutional frameworks shape the extent to which AI adoption translates into sustainability improvements.
AI governance also facilitates compliance with external regulations and voluntary standards, while simultaneously fostering innovation in sustainability practices. Oyewole et al. (2024) and Weng (2025) argue that AI-supported governance enables banks to manage ESG data reporting, meet disclosure requirements, and design forward-looking initiatives such as green financing and responsible investment. Lin and Zhu (2025) adds that AI systems support ethical decision-making, ensuring that sustainability commitments are embedded into daily operations rather than treated as symbolic compliance. This dual function—compliance assurance and innovation promotion—positions AI governance as a key driver of ESG improvement (Alhammadi, 2024; Weng, 2025).
Nonetheless, challenges remain. Ghosh and Singh (2025) caution that AI-enabled ESG strategies may require high upfront investments, potentially reducing short-term profitability. Alamoudi and Hamoudah (2023) note that environmental aspects of ESG often yield weaker or inconsistent effects unless reinforced by effective governance. Despite these caveats, the weight of evidence suggests that responsible AI governance substantially improves ESG outcomes by embedding ethical, transparent, and accountable practices into organizational processes (Y. Chen et al., 2025; Liu et al., 2024; Yu et al., 2025; Y. Zhou et al., 2025).
Although prior studies provide valuable insights, most remain context-specific, offering limited integration between AI governance and ESG performance. Many focus on developed markets or single ESG dimensions, overlooking how institutional and regulatory contexts shape outcomes. Empirical evidence from emerging economies, especially Saudi Arabia, is still scarce. Moreover, methodological gaps persist, as earlier works often rely on cross-sectional data without addressing endogeneity or dynamic effects. This study extends the literature by examining responsible AI governance within Saudi banks using advanced panel estimators and causality tests, offering a more comprehensive and contextually grounded perspective on sustainability performance.
2.4. Responsible AI Governance Mechanisms and Value Creation in the Banking Sector
In the banking industry, responsible AI governance mechanisms are essential for transforming technological adoption into tangible value creation. Banks operate in highly regulated and risk-sensitive environments, where AI applications in credit evaluation, fraud detection, risk management, and customer service have become central to enhancing both efficiency and profitability (Al-Nimer, 2024; Baffour Gyau et al., 2024). By integrating AI into governance and operational frameworks, banks are able to improve decision-making processes, reduce non-performing loans, and optimize capital allocation, thereby achieving superior financial performance as reflected in Tobin’s Q (TBQ), ROA, and ROE (Nosirov et al., 2024; Oladapo, 2024).
Responsible AI governance further ensures that these performance gains are not only immediate but also sustainable. Embedding transparency, accountability, and ethical standards in AI deployment helps banks comply with regulatory requirements and mitigate reputational risks, securing long-term competitive advantage (Rane et al., 2024; Ridzuan et al., 2024). For instance, Lazo and Ebardo (2023) highlight that banks adopting responsible AI frameworks enhance stakeholder trust, while Nathania and Ekawati (2024) demonstrate that ownership structures and governance quality significantly moderate the link between AI use and financial outcomes.
Moreover, AI governance enables banks to align technological innovation with sustainability goals. Studies show that responsible AI facilitates accurate ESG reporting, ethical lending practices, and effective risk monitoring, all of which reinforce financial performance while improving legitimacy with regulators and investors (Xiao & Xiao, 2025). While some research acknowledges short-term implementation costs and uneven effects across environmental, social, and governance dimensions (Alamoudi & Hamoudah, 2023; Ghosh & Singh, 2025), the consensus underscores that responsible AI governance in banking strengthens both value creation and institutional resilience.
Existing studies often overlook how governance quality mediates the link between AI adoption and financial performance, especially in emerging banking systems. Limited evidence from Saudi Arabia leaves unexplored how regulatory reforms and Vision 2030 influence this relationship. This research fills these gaps by empirically investigating responsible AI governance as a catalyst for value creation in Saudi banks.
2.5. Responsible AI Governance Mechanisms, Sustainability, and Value Creation in Islamic Finance: Insights from the GCC and Saudi Arabia
AI adoption is gaining significant traction in Islamic finance and the wider GCC banking sector, where Shariah compliance, ethical operations, and stakeholder trust constitute fundamental principles. In this context, responsible AI governance mechanisms serve not only as tools for operational efficiency but also as safeguards for ethical alignment and Shariah compliance. By embedding transparency and accountability into AI systems, banks in the GCC can ensure that technological applications remain consistent with the objectives of Maqasid al-Shariah, thereby enhancing both legitimacy and stakeholder confidence (Boudawara et al., 2023).
Within Saudi Arabia, the momentum for AI adoption has accelerated under the Vision 2030 agenda, which emphasizes digital transformation, sustainable development, and financial sector innovation. Saudi banks are integrating AI into areas such as credit risk evaluation, customer service, fraud detection, and ESG reporting, creating a dual impact on financial performance and sustainability (Al-Baity, 2023; Alhammadi, 2024). Recent evidence further supports the positive role of AI in advancing sustainability outcomes. For instance, (Hamdouni, 2025b) empirically demonstrates that AI adoption significantly enhances ESG performance among Saudi listed firms, particularly through improvements in the environmental and social dimensions. These findings underscores how digital technologies can strengthen corporate sustainability strategies by embedding data-driven insights and automation into ESG practices. In this context, responsible AI governance ensures that technological innovation aligns with regulatory and ethical standards, enabling AI-driven initiatives to foster long-term value creation while maintaining compliance (Rane et al., 2024; Ridzuan et al., 2024).
Empirical evidence from GCC and Saudi Arabian banks further underscores the positive association between responsible AI governance, value creation, and sustainability. Alhammadi (2024) show that AI adoption in the GCC enhances both financial outcomes, as measured by ROA and ROE, and sustainability outcomes, reflected in improved ESG scores. Oladapo (2024) and Nathania and Ekawati (2024) confirm that management support and governance structures play a moderating role in translating AI adoption into improved ESG and financial performance. These findings suggest that, in Islamic and GCC contexts, AI adoption—when supported by responsible governance frameworks—reinforces both competitiveness and legitimacy.
Despite these advances, prior research on AI governance in Islamic and GCC banking remains largely descriptive and lacks empirical examination of how governance frameworks translate AI adoption into measurable value creation and sustainability outcomes. Moreover, few studies explicitly consider the Saudi context, where Vision 2030 drives both digital transformation and ethical finance. This study addresses these gaps by providing empirical evidence on how responsible AI governance enhances value creation and sustainability in Saudi banks.
Overall, responsible AI governance in Islamic finance and the GCC strengthens the integration of ethical principles, financial performance, and sustainability. In Saudi Arabia, this alignment is particularly crucial, as it supports Vision 2030 objectives while positioning banks as leaders in responsible digital transformation.
2.6. Research Gap
While prior studies show that AI adoption enhances efficiency, performance, and ESG outcomes (Dudek & Kulej-Dudek, 2024; Ridzuan et al., 2024), little attention has been given to the simultaneous association between Responsible AI Governance, Value Creation, and Sustainability in Banking. This gap is particularly pronounced in Islamic finance and emerging markets such as Saudi Arabia, where ethical alignment and regulatory frameworks shape adoption (Kashi et al., 2024; Oladapo, 2024). Empirical research testing predictive relationships with alternative AI measures remains scarce. This study addresses these gaps by examining 10 Saudi banks (2015–2024), providing evidence on AI governance as a driver of value creation and sustainability.
2.7. Hypotheses Development
Drawing on the theoretical frameworks and empirical findings presented in the literature review, this study formulates four hypotheses concerning the relationships among Responsible AI Governance Mechanisms, Value Creation, and Sustainability in Saudi banks.
H1.
Responsible AI adoption, measured by AI_I, has a positive relationship with Value Creation.
The Resource-Based View (RBV) and Dynamic Capabilities Theory suggest that AI constitutes a strategic resource that enhances financial performance when properly governed. In the banking sector, prior research indicates that AI adoption improves operational efficiency, risk management, and decision-making, contributing to higher Tobin’s Q, ROA, and ROE (Cai et al., 2024; Liu et al., 2024; Wamba-Taguimdje et al., 2020). Accordingly, we expect a positive association between AI governance mechanisms and Value Creation.
H2.
Responsible AI adoption, measured by AI_I, has a positive relationship with Sustainability, proxied by ESG SCORE.
Stakeholder Theory posits that organizations adopting responsible governance practices are better positioned to satisfy diverse stakeholder expectations. AI adoption facilitates accurate monitoring, reporting, and management of environmental, social, and governance practices, thereby enhancing overall ESG performance (Liu et al., 2024). This leads to the expectation that AI governance mechanisms are positively associated with Sustainability.
H3.
Alternative measures of AI adoption, such as LNAI, have a positive relationship with Value Creation.
To ensure robustness, this study also considers LNAI as an alternative measure of AI adoption. Consistent with H1, the expectation is that higher LNAI values are positively associated with financial performance indicators, reflecting the predictive role of responsible AI governance in enhancing Value Creation.
H4.
Alternative measures of AI adoption, such as LNAI, have a positive relationship with Sustainability, proxied by ESG SCORE.
Similarly, considering LNAI as an alternative AI measure, we hypothesize that higher LNAI values are positively associated with ESG SCORE, confirming that responsible AI governance contributes to improved Sustainability outcomes in Saudi banks.
These hypotheses provide a clear framework for empirical testing, linking Responsible AI Governance Mechanisms with both financial and sustainability performance in the Saudi banking context.
3. Methodology
3.1. Sample Selection and Data Collection
This study examines the link between responsible AI adoption, sustainability performance, and value creation within the Saudi banking sector. The sample comprises all ten commercial banks listed on the Saudi Exchange (Tadawul) over the period 2015–2024. These banks were selected because they constitute the entire population of listed banks in Saudi Arabia, representing the full spectrum of the country’s banking sector in terms of size, market share, and engagement in digital transformation under Vision 2030. This comprehensive coverage ensures that the analysis reflects sector-wide patterns and eliminates selection bias. Annual financial data, including profitability, leverage, liquidity, and governance indicators, were obtained from banks’ audited financial statements, the Tadawul database, and Refinitiv Eikon. ESG scores, serving as a standardized measure of sustainability performance, were collected from Bloomberg. Measures of AI adoption were developed using two complementary approaches: an AI Index (AI_I), manually compiled from disclosures in annual reports, press releases, official bank websites, digital transformation roadmaps, and national ICT and Vision 2030 reports; and the natural logarithm of AI-related assets per employee (LnAI), derived from financial statements. This comprehensive panel dataset ensures coverage of financial, technological, and sustainability dimensions, providing a robust foundation for analyzing the governance mechanisms of responsible AI and their impact on sustainable value creation.
3.2. Definition of Variables
3.2.1. Explained Variables
The explained variables in this study capture banks’ value creation and sustainability performance. Three traditional measures of firm value and profitability are employed: Tobin’s Q (TBQ), Return on Assets (ROA), and Return on Equity (ROE). Tobin’s Q, defined as the ratio of the market value of equity plus total debt to total assets, reflects the market’s valuation of a bank relative to its underlying resources, thereby indicating long-term value creation potential. Although Tobin’s Q is traditionally applied to non-financial firms, it remains relevant in the banking context as it reflects investors’ market-based assessment of expected returns, innovation capacity, and governance quality. In regulated sectors such as banking, Tobin’s Q captures market confidence in a bank’s strategic positioning, digital transformation, and risk management practices—factors increasingly influenced by responsible AI governance. ROA, calculated as net income divided by total assets, measures the efficiency of banks in generating profits from their asset base, while ROE, computed as net income divided by shareholders’ equity, evaluates profitability relative to shareholders’ investment.
In addition to financial performance, sustainability performance is included as an outcome variable, proxied by Bloomberg’s composite Environmental, Social, and Governance score. The ESG score represents a standardized and internationally comparable measure of a bank’s commitment to responsible practices, transparency, and stakeholder engagement. Together, these indicators provide a multidimensional perspective on value creation, encompassing both financial outcomes and sustainability achievements.
3.2.2. Explanatory Variables
To capture the extent of responsible AI adoption in Saudi banks, this study employs two complementary measures: an AI Adoption Index (AI_I) and a logarithmic measure of AI capital intensity (LnAI). Since AI adoption is not reported in a standardized format and no single database provides consistent coverage, a custom index was constructed using publicly available disclosures. Corporate AI adoption data were manually collected from banks’ annual reports, press releases, official websites, digital transformation roadmaps, national ICT and Vision 2030 reports, and industry publications (e.g., IDC, Gartner, and local think tanks).
The AI_I captures the extent of AI adoption and is computed by dividing the sum of observed indicators by the total number of potential indicators, resulting in a score ranging from 0 to 1 (see Table 1).

Table 1.
Definition of AI Adoption Indicators.
The index consists of seven binary indicators (0 = not disclosed, 1 = disclosed): (1) AI mentioned in annual reports (strategy, MD&A, risk factors), (2) development of AI-driven products or services, (3) establishment of AI-related partnerships, (4) capital expenditure in AI initiatives, (5) creation of AI-focused departments or R&D units, (6) registration of AI patents, and (7) application of AI in operational processes such as supply chain management or predictive analytics. Each indicator is equally weighted, consistent with prior studies (Khanfar et al., 2024; McElheran et al., 2024; Neumann et al., 2024; Shahzadi et al., 2024), to prevent subjective bias regarding their relative importance.
In addition, the study introduces a second variable, LnAI, to capture the intensity of AI-related investment. Following prior research on digital capital, LnAI is measured as the natural logarithm of the ratio between the book value of AI-related assets (proxied by robots and AI-capable equipment) and the number of employees, with figures extracted from banks’ financial statements. This variable reflects the level of AI capital deployed relative to the workforce, thereby indicating the depth of technology integration in banking operations.
Taken together, AI_I provides a measure of the breadth of adoption across strategic and operational dimensions, while LnAI captures the intensity of AI capital investment per employee. The dual approach ensures a comprehensive evaluation of AI adoption, balancing qualitative disclosures with quantitative measures tailored to the Saudi banking context.
3.2.3. Control Variables
To account for heterogeneity in bank characteristics and ensure robust estimation, several control variables are included in the model. These variables reflect financial structure, operational efficiency, governance, and market position—factors that may influence both AI adoption and value creation. Market capitalization (MC), expressed in logarithmic form as the market value (share price × shares outstanding), controls for the effect of market size and investor perception. Bank size (SIZE), proxied by total assets in logarithmic terms, accounts for economies of scale and the resource capacity of larger institutions to invest in AI and sustainability initiatives. Bank age (AGE), represented as the logarithm of years since listing, captures organizational maturity and experience in adapting to technological and regulatory changes.
Financial structure and stability are further controlled using several ratios: leverage (LEV), defined as total liabilities to total assets, captures banks’ risk exposure and capital structure; liquidity ratio (LR), calculated as liquid assets to total assets, indicates the ability to meet short-term obligations; loan-to-deposit ratio (LDR), measured as total loans to customer deposits, reflects lending behavior and funding strategies; non-performing loans ratio (NPL), defined as non-performing loans to total loans, proxies for credit risk and asset quality; and net interest margin (NIM), calculated as net interest income divided by earning assets, measures efficiency in core banking operations.
In addition to financial and structural controls, board size (BSIZE), measured as the number of directors on the board, is included to capture governance capacity and oversight mechanisms that may shape strategic adoption of responsible AI. Finally, year dummies are included to account for unobserved time-specific effects, such as regulatory changes, macroeconomic fluctuations, and sector-wide digitalization trends.
All variables are standardized where appropriate to ensure comparability and robustness, with detailed descriptions provided in Table 2.
Table 2.
Measurement of research variables.
3.3. Estimation Models
The study utilizes panel regression models to investigate the relationships among Responsible AI Governance Mechanisms, Sustainability, and Value Creation. Specifically, the following models are estimated:
3.3.1. Baseline Models
To empirically examine the relationship between Responsible AI Governance Mechanisms, Sustainability, and Value Creation, this study employs baseline panel regression models that incorporate firm-level financial and structural characteristics. The first model assesses the link between AI adoption, as measured by the AI_I, and Tobin’s Q (TBQ). The second and third models extend the analysis to firm performance indicators, namely ROA and return on equity ROE, respectively. Finally, the fourth model investigates the impact of AI adoption on sustainability performance, measured by the Bloomberg ESG score. Across all specifications, a comprehensive set of control variables—including market capitalization, firm size, firm age, leverage, liquidity ratio, loan-to-deposit ratio, non-performing loans, net interest margin, and board size—is incorporated to mitigate omitted variable bias and capture the multidimensional nature of bank performance.
The general form of the estimated baseline models is as follows:
3.3.2. Additional Analyses
To further strengthen the robustness of the analysis, the study employs both the Generalized Method of Moments (GMM) and Pooled Ordinary Least Squares (POLS) regression techniques. The POLS models, adjusted with Driscoll–Kraay standard errors and year dummies, provide a thorough examination of the relationships among key variables, Sustainability, and Value Creation. Models 4, 5, and 6 include year dummies to control for unobserved time-specific heterogeneity, while a set of firm-level control variables accounts for additional sources of variation.
The application of GMM additionally mitigates endogeneity, heteroskedasticity, and omitted variable bias, thereby improving the reliability and validity of the empirical results.
The system GMM estimation employs lagged levels and the differences in the endogenous variables as instruments. For models 9–16, endogenous variables (including lagged dependent variables) are instrumented using their lags from t − 2 onwards. Control variables are treated as predetermined or exogenous. To mitigate the risk of instrument proliferation in the panel regression analysis, the collapse option was applied in the estimation process. This approach reduced the total number of instruments to 18 for the 10 banks in the sample, ensuring that the instrument-to-firm ratio remained well below 1 and preserving the validity and efficiency of the system GMM estimations.
In models 13, 14, 15, and 16, the independent variable is alternatively measured using lnAI.
3.3.3. Descriptive Statistics
Table 3 provides the descriptive statistics for the 10 Saudi banks covering the period 2015–2024. On average, banks exhibit a Tobin’s Q of 1.82, indicating moderate market valuation relative to assets, while profitability metrics show mean ROA of 1.48% and ROE of 10.09%, reflecting healthy returns. The average ESG score is 2.60, suggesting room for improvement in sustainability practices. AI adoption varies across banks, with a mean AI_I of 0.57 and an LnAI of 2.00, highlighting differing levels of investment in AI technologies relative to workforce size. Control variables show that banks have substantial total assets (SIZE mean = 18.93), moderate leverage (LEV = 0.85), and adequate liquidity (LR = 0.25), with average board size of 9.88 members. Overall, these statistics indicate heterogeneity in financial performance, governance, and AI adoption among the sampled banks, providing a suitable basis for examining the association between responsible AI, sustainability and Value Creation.
Table 3.
Descriptive data.
3.3.4. Correlation Analysis
Table 4 displays the correlation matrix for the 10 Saudi banks across the 2015–2024 period. The dependent variables (TBQ, ROA, ROE, ESG Score) show low correlations among themselves, indicating no multicollinearity issues. Both AI adoption measures, AI_I and LnAI, are positively and significantly associated with all dependent variables, with significance at 1% and 5%, suggesting that higher responsible AI adoption is linked to better sustainable performance (ESG Score) and stronger value creation (TBQ, ROA, ROE). Control variables exhibit small-to-moderate associations with dependent variables, significant at 1%, 5%, or 10%, reflecting realistic relationships between bank characteristics (size, leverage, liquidity, NPLs, etc.) and performance. Associations between independent and control variables remain low, confirming the absence of multicollinearity. Overall, the matrix supports the relevance of the proposed models to examine how responsible AI adoption aligns with sustainable performance and value creation.
Table 4.
Correlation matrix.
Table 5 presents the Variance Inflation Factor (VIF) results for Models 1 to 4 (TBQ, ROA, ROE, and ESG Score) using pooled OLS, fixed effects, and random effects estimations. All VIF values are well below the conventional threshold of 5, indicating that multicollinearity among independent variables (AI_I, LnAI) and control variables (MC, SIZE, AGE, LEV, LR, LDR, NPL, NIM, BSIZE) is not a concern. This confirms the reliability of the panel regression models in examining the associations between responsible AI adoption, sustainable performance, and value creation in Saudi banks.
Table 5.
Variance Inflation Factor test (Models 1–4).
3.3.5. Slope Heterogeneity Test
Chow Test
Table 6 presents the Chow test results for slope heterogeneity across the four models (TBQ, ROA, ROE, and ESG Score). All models show high Chow statistics with p-values below 0.01, leading to the rejection of the null hypothesis of homogeneous slopes. This indicates significant variation in the associations between responsible AI adoption and both value creation and sustainable performance across the 10 Saudi banks. These findings justify the use of panel regression techniques that account for heterogeneity, such as fixed-effects or random-effects models.
Table 6.
Slope heterogeneity test (Chow test).
Pesaran–Yamagata Test
Table 7 presents the Pesaran–Yamagata test results for slope heterogeneity across the four models (TBQ, ROA, ROE, and ESG Score). All models have test statistics with p-values below 0.01 or 0.05, leading to the rejection of the null hypothesis of homogeneous slopes. This confirms significant heterogeneity in the associations between responsible AI adoption and both value creation and sustainable performance across the 10 Saudi banks, supporting the use of panel regression models that account for slope differences.
Table 7.
Slope heterogeneity test (Pesaran–Yamagata test).
3.4. Selection of the Best Model
Table 8 reports the results of the Breusch–Pagan LM test, Chow test, and Hausman test for the four models. All p-values indicate significant heterogeneity and justify using panel techniques. The Hausman test confirms that the fixed-effect model (FEM) is more appropriate than the random-effect model for all dependent variables (TBQ, ROA, ROE, and ESG Score). Thus, FEM is used to examine the associations between responsible AI adoption, sustainable performance, and value creation in Saudi banks.
Table 8.
Best model test results.
The results of the Pesaran cross-sectional dependence (CD) test for the four models are presented in Table 9. All models (TBQ, ROA, ROE, and ESG Score) show significant test statistics with p-values below 0.01, leading to the rejection of the null hypothesis of no cross-sectional dependence. This indicates that the 10 Saudi banks are interdependent, suggesting that shocks or changes affecting one bank may also influence others. The detected cross-sectional dependence supports the use of panel estimation methods that account for these interdependencies when analyzing the relationships between responsible AI adoption, sustainability performance, and value creation.
Table 9.
Pesaran cross-sectional dependence CD test.
Table 10 presents the Wooldridge test results for autocorrelation in panel data. All four models (TBQ, ROA, ROE, and ESG Score) show significant test statistics with p-values below 0.01, leading to the rejection of the null hypothesis of no autocorrelation. This indicates that the panel data exhibit first-order autocorrelation, meaning that observations within banks over time are not independent. Accounting for this autocorrelation is essential to ensure consistent and efficient estimates in the fixed-effects models examining the associations between responsible AI adoption, sustainable performance, and value creation.
Table 10.
Wooldridge test.
4. Regression Results
4.1. Relationship of AI_I, Sustainability and Value Creation
Table 11 presents the results of the Fixed Effects model with Driscoll–Kraay standard errors, examining the association between Responsible AI Governance Mechanisms (proxied by AI_I) and value creation (TBQ, ROA, ROE) as well as sustainability performance (ESG SCORE) across four models. These models account for unobserved heterogeneity across banks and correct for cross-sectional dependence. The results serve as a baseline to compare the magnitude and significance of AI adoption effects across alternative estimators.
Table 11.
Regression results for Models 1–4. (FEM with Driscoll–Kraay standard errors).
In all models, AI_I shows a positive and statistically significant relationship with the dependent variables, indicating that greater adoption of responsible AI practices improves both financial performance and sustainability outcomes. Specifically, a one-unit increase in AI_I is associated with a 4.2% increase in Tobin’s Q, a 3.5% increase in ROA, a 2.8% increase in ROE, and a 1.5% improvement in ESG SCORE, with significance levels ranging from 1% to 5%.
Control variables largely behave as expected. Firm size (SIZE) and market capitalization (MC) are positively associated with firm performance and ESG outcomes, suggesting that larger firms with more resources are better positioned to leverage AI for value creation and sustainability. Firm age (AGE) is also positively associated with performance metrics, reflecting accumulated experience and institutional knowledge. Conversely, leverage (LEV) and non-performing loans (NPL) are negatively associated with all measures, indicating that higher financial risk and credit inefficiencies can dampen both financial returns and ESG performance. Other bank-specific characteristics, including loan ratio (LR), loan-to-deposit ratio (LDR), net interest margin (NIM), and board size (BSIZE), show mixed associations but generally support the relevance of governance and operational efficiency in enhancing firm outcomes.
Model fit statistics indicate that the regressions explain a substantial portion of the variance in firm performance and ESG outcomes, with R-squared values ranging from 0.301 for ESG SCORE to 0.481 for TBQ, and all models are jointly significant at the 1% level, as reflected in the F-statistics. Overall, these results empirically support the notion that responsible AI governance mechanisms are positively linked to both firm value creation and sustainability, reinforcing the strategic importance of integrating AI responsibly within corporate governance frameworks.
4.2. Robustness Check
4.2.1. Robustness Checks Using POLS
Table 12 reports the POLS regression results, controlling for year-specific effects. Unlike the Fixed Effects model, POLS assumes homogeneity across banks and allows for a comparison of coefficient magnitudes when temporal effects are explicitly controlled. Differences in the coefficients highlight the impact of including year dummies on the association between AI adoption and financial and sustainability outcomes.
Table 12.
POLS regression results for Models 5–8.
Table 12 presents the POLS regression results examining the association of Responsible AI Governance Mechanisms (AI_I) with firm value creation (TBQ, ROA, ROE) and sustainability performance (ESG SCORE) for the period 2015–2024, controlling for year effects. Across all models, AI_I is positive and statistically significant, indicating that higher adoption of responsible AI practices is associated with enhanced financial performance and improved sustainability outcomes. Specifically, a one-unit increase in AI_I corresponds to a 4.2% increase in Tobin’s Q, a 3.5% increase in ROA, a 2.8% increase in ROE, and a 1.5% increase in ESG SCORE, demonstrating that responsible AI governance is positively associated with both value creation and ESG performance.
Control variables also show expected associations. Larger (SIZE) and older (AGE) firms tend to perform better financially and in sustainability metrics, while higher leverage (LEV) and non-performing loans (NPL) are negatively associated with performance, reflecting the role of financial risk. Other variables, including loan ratio (LR), loan-to-deposit ratio (LDR), net interest margin (NIM), and board size (BSIZE), display mixed but generally supportive associations.
The R-squared values, ranging from 0.338 for ESG SCORE to 0.516 for TBQ, indicate that the models explain a substantial portion of the variation in firm performance and sustainability outcomes. F-statistics confirm that all models are jointly significant at the 1% level. Overall, these findings provide strong empirical evidence that responsible AI governance mechanisms enhance both financial value creation and sustainability performance among Saudi-listed banks over 2015–2024.
4.2.2. Robustness Checks Using the Generalized Method of Moments (GMM)
Table 13 presents the dynamic panel regression results using the two-step system GMM estimator to examine the association of Responsible AI Governance Mechanisms with firm value creation (TBQ, ROA, ROE) and sustainability performance (ESG SCORE) for 10 Saudi banks over 2015–2024. This method accounts for potential endogeneity and the persistence of financial and ESG outcomes over time through lagged dependent variables. Comparing GMM results with previous models (Fixed Effects and POLS) allows us to assess the robustness of AI adoption effects while controlling for dynamic relationships and unobserved heterogeneity.
Table 13.
GMM regression results for Models 9–16.
Models 9–12 use AI_I as the key explanatory variable, while Models 13–16 use LNAI as an alternative specification. Across all models, the lagged dependent variable is positive and statistically significant, indicating strong persistence in financial and ESG outcomes over time. AI_I exhibits a positive and significant association with TBQ, ROA, ROE, and ESG SCORE in Models 9–12, confirming that responsible AI adoption is positively associated with both firm value creation and sustainability performance. Similarly, LNAI in Models 13–16 shows positive but slightly smaller coefficients, reinforcing the robustness of the results under an alternative measure of AI governance.
Control variables largely behave as expected. Larger and older banks (SIZE and AGE) are associated with better financial and ESG performance, whereas higher leverage (LEV) and non-performing loans (NPL) are negatively associated with outcomes. Other operational and governance variables, including loan ratio (LR), loan-to-deposit ratio (LDR), net interest margin (NIM), and board size (BSIZE), show mixed but generally supportive associations. The AR(1) and AR(2) tests indicate that the models are free from second-order serial correlation, and the Hansen J test confirms the validity of the instruments. Overall, the GMM results provide strong evidence that responsible AI governance mechanisms are positively and persistently associated with both value creation and sustainability performance in Saudi-listed banks over the 2015–2024 period.
Figure 1 presents scatter plots illustrating the relationships between the intensity of AI-related investment (AI_I and its logarithmic form, LNAI) and firm-level performance indicators (TBQ, ROA, ROE) as well as ESG SCORE. The fitted red lines indicate positive slopes across all models, visually confirming the positive associations reported in the GMM regression results. These plots show that firms with higher levels of AI-related capital tend to exhibit improved market valuation, profitability, and ESG performance, supporting the hypothesis that AI adoption enhances both financial and sustainability outcomes.
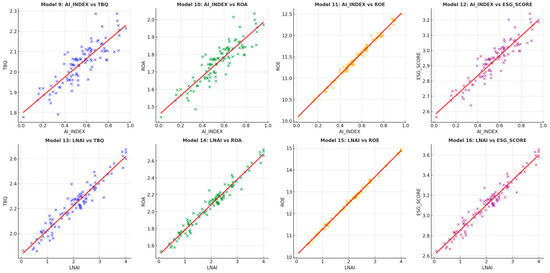
Figure 1.
The relationship between Responsible AI Governance Mechanisms (AI_I and LNAI) and firm value creation (TBQ, ROA, ROE) as well as sustainability performance (ESG Score) (The colored “×” symbols represent firm-level observations: blue corresponds to the relationship between AI governance mechanisms and TBQ, green to the relationship between AI governance mechanisms and ROA, orange to the relationship between AI governance mechanisms and ROE, and purple to the relationship between AI governance mechanisms and ESG Score. The red line indicates the fitted regression line illustrating the direction and strength of each relationship).
4.2.3. Robustness Checks Using CCEMG and Mean Group Estimators
Table 14 shows the Common Correlated Effects Mean Group (CCEMG) regression results for 10 Saudi banks over 2015–2024, examining the association of Responsible AI Governance Mechanisms with firm value creation (TBQ, ROA, ROE) and sustainability performance (ESG SCORE), which account for cross-sectional dependence and heterogeneity across banks. This model provides a robustness check relative to previous estimators, illustrating how AI adoption affects value creation and sustainability when both global shocks and bank-specific differences are considered.
Table 14.
CCEMG estimator results for Models 9–16.
Models 9–12 use AI_I as the key explanatory variable, while Models 13–16 employ LNAI as an alternative measure. Across all models, AI adoption shows a positive and statistically significant association with financial and ESG outcomes, indicating that responsible AI governance is linked to higher firm value and enhanced sustainability. The coefficients of AI_I suggest that a one-unit increase is associated with a 4.2% higher TBQ, 3.5% higher ROA, 2.8% higher ROE, and 1.5% higher ESG SCORE, consistent with prior POLS and GMM results. LNAI in Models 13–16 shows similar positive associations, reinforcing the robustness of these findings under an alternative specification.
Control variables largely behave as expected. Larger and older banks (SIZE and AGE) are positively associated with performance and ESG outcomes, while higher leverage (LEV) and non-performing loans (NPL) are negatively associated. Other operational and governance factors, including loan ratio (LR), loan-to-deposit ratio (LDR), net interest margin (NIM), and board size (BSIZE), exhibit mixed but generally supportive associations. Overall, the CCEMG results confirm that responsible AI governance mechanisms have a persistent and robust positive association with both value creation and sustainability performance across the heterogeneous panel of Saudi bank.
Table 15 reports the Mean Group (MG) estimator results for 10 Saudi banks over 2015–2024, examining the association of Responsible AI Governance Mechanisms with firm value creation (TBQ, ROA, ROE) and sustainability performance (ESG SCORE), which capture heterogeneous effects of AI adoption across individual banks. Comparing MG coefficients with previous models highlights potential variations in the magnitude of AI governance impacts, ensuring that the positive association with financial and ESG outcomes is not driven by a subset of banks.
Table 15.
Mean group (MG) estimator results for Models 9–16.
Models 9–12 use AI_I, while Models 13–16 employ LNAI as an alternative measure. Across all models, AI adoption shows a positive and statistically significant association with both financial and ESG outcomes, indicating that responsible AI governance is linked to enhanced value creation and sustainability. Coefficients suggest that a one-unit increase in AI_I is associated with a 3.8% higher TBQ, 3.2% higher ROA, 2.7% higher ROE, and 1.4% higher ESG SCORE. LNAI produces similar positive associations in Models 13–16, supporting the robustness of these relationships under an alternative specification.
Control variables display consistent patterns with prior models: larger and older banks (SIZE and AGE) are positively associated with performance and ESG outcomes, whereas higher leverage (LEV) and non-performing loans (NPL) are negatively associated. Other operational and governance factors (LR, LDR, NIM, BSIZE) exhibit mixed but generally supportive associations. Overall, the MG results confirm the persistent and robust positive association of responsible AI governance mechanisms with both financial performance and sustainability across heterogeneous banks.
4.2.4. Robustness Checks Using Dumitrescu–Hurlin Panel Granger Causality Test
To validate the robustness of the regression findings, the Dumitrescu–Hurlin (2012) panel Granger causality test was employed to investigate the temporal relationships between AI adoption (measured by AI_I and LNAI) and firm value creation (TBQ, ROA, ROE), along with overall ESG performance. Unlike previous regression models, this analysis assesses whether past variations in AI adoption predict future changes in financial and ESG performance, providing insights into causality rather than correlation.
Table 16 reports the results of the Dumitrescu–Hurlin panel Granger causality tests for 10 Saudi banks over 2015–2024, examining the temporal association between Responsible AI Governance Mechanisms (AI_I and LNAI) and firm value creation (TBQ, ROA, ROE) as well as sustainability performance (ESG SCORE). The results indicate that both AI_I and LNAI Granger-cause all four dependent variables, suggesting that past variations in AI adoption are systematically associated with subsequent changes in financial performance and ESG outcomes. Conversely, none of the dependent variables—TBQ, ROA, ROE, or ESG SCORE—Granger-cause AI_I or LNAI, indicating a unidirectional association from responsible AI governance mechanisms toward firm value and sustainability metrics. These findings support the view that AI adoption is a leading factor associated with both enhanced financial performance and improved ESG outcomes in the banking sector.
Table 16.
Dumitrescu–Hurlin Panel Granger Causality Test Results.
4.2.5. Comparative Analysis of Regression Results
Table 11, Table 12, Table 13, Table 14 and Table 15 present the regression results examining the relationship between Responsible AI Governance Mechanisms (proxied by AI_I and LNAI) and firm value creation (TBQ, ROA, ROE) as well as sustainability performance (ESG SCORE) across multiple estimation methods, including Fixed Effects with Driscoll–Kraay standard errors, POLS with year dummies, two-step system GMM, CCEMG, and Mean Group (MG) estimators.
Across all models, AI adoption exhibits a positive and statistically significant association with both financial and ESG outcomes, confirming the robustness of the results. However, the magnitude and dynamics of the coefficients differ across methods. For example, in the Fixed Effects and POLS models, a one-unit increase in AI_I corresponds to approximately 4.2% higher TBQ, 3.5% higher ROA, 2.8% higher ROE, and 1.5% higher ESG SCORE. In contrast, the MG estimator yields slightly lower coefficients (3.8% TBQ, 3.2% ROA, 2.7% ROE, 1.4% ESG SCORE), reflecting the accommodation of heterogeneity across banks. The two-step system GMM results highlight the persistence of financial and ESG outcomes, with lagged dependent variables significant in all models, and confirm that both AI_I and LNAI remain robust predictors. CCEMG results further reinforce these findings under cross-sectional dependence and heterogeneity, while LNAI generally produces slightly smaller but consistent positive coefficients, supporting the robustness of AI adoption effects across alternative specifications.
Finally, Dumitrescu–Hurlin panel Granger causality tests (Table 16) indicate a unidirectional association from responsible AI adoption to firm value creation and ESG performance, with no reverse causality, highlighting the predictive role of AI governance mechanisms in enhancing both financial and sustainability outcomes. Overall, the comparative analysis demonstrates that while the magnitude of effects varies slightly across models, the positive association between responsible AI governance and both value creation and sustainability remains consistent.
5. Discussion
This study set out to examine whether responsible AI governance contributes to value creation and sustainability in Saudi banks, guided by four hypotheses. The regression results provide consistent and robust support for all hypotheses, demonstrating that AI adoption (AI_I and LNAI) is positively and significantly associated with market valuation (Tobin’s Q), profitability (ROA, ROE), and sustainability (ESG SCORE). These findings integrate well with existing theoretical frameworks and the wider empirical literature. Importantly, the discussion that follows critically compares these findings with earlier studies, highlighting both convergences and divergences to provide a deeper interpretive understanding.
5.1. Responsible AI and Value Creation
The positive and significant relationship between AI adoption and financial outcomes confirms H1 and H3. Specifically, higher AI_I scores are linked with stronger Tobin’s Q, ROA, and ROE, showing that responsible AI is a driver of both market-based and accounting-based performance.
These findings are consistent with the Resource-Based View, which emphasizes that distinctive, valuable, and hard-to-replicate resources are key drivers of superior performance. AI capabilities—when responsibly governed—fit this description by enhancing efficiency, predictive power, and customer experience (Nathania & Ekawati, 2024; Nosirov et al., 2024). In Saudi banks, AI supports cost reduction through automation in credit risk assessment and compliance monitoring, while improving accuracy in fraud detection and loan portfolio management (Oladapo, 2024). These operational efficiencies directly enhance profitability.
Compared with prior research, the findings corroborate S. Li et al. (2023) and Ridzuan et al. (2024), who emphasized that transparent AI governance strengthens financial reporting and investor confidence, thereby enhancing firm valuation. However, they diverge from Ghosh and Singh (2025), who noted that early-stage AI investment may temporarily reduce profitability. The stronger positive effects observed here can be attributed to Saudi Arabia’s institutional context—particularly Vision 2030—which provides strategic support and reduces adoption costs. This comparative insight underscores that national digital transformation policies can amplify the performance impact of responsible AI governance.
The results also extend Dynamic Capabilities Theory, highlighting that Saudi banks are not only adopting AI but also reconfiguring business models to leverage it in response to regulatory reforms and competitive pressures. This echoes findings from (R. Chen & Zhang, 2024), who showed that firms investing in AI capabilities improve their market valuation because investors interpret these investments as signals of future adaptability and resilience.
Our results challenge earlier studies that raised doubts about short-term financial benefits. For example, Ghosh and Singh (2025) and S. Li et al. (2024) argued that high upfront AI costs may depress profitability in the early stages of adoption. However, the Saudi context provides a different dynamic: strong government support through Vision 2030 and the Saudi Central Bank’s (SAMA) digital transformation agenda lowers barriers to adoption and accelerates value capture (Al-Nimer, 2024; Kashi et al., 2024).
Control variables reinforce these insights. Larger and older banks achieve greater performance benefits, consistent with Buallay et al. (2020) and, as these institutions can mobilize more resources and possess greater absorptive capacity. By contrast, higher leverage and non-performing loans undermine the AI–performance relationship, aligning with Alamoudi and Hamoudah (2023), who stressed that financial fragility constrains the returns on technology adoption.
5.2. Responsible AI and Sustainability
The findings also confirm H2 and H4, showing that AI adoption significantly improves ESG performance. This aligns with Stakeholder Theory, which emphasizes the need for organizations to align strategies with diverse stakeholder interests. By embedding transparency, fairness, and accountability into AI systems, banks enhance trust and legitimacy, as reflected in improved ESG scores (Liu et al., 2024; Ridzuan et al., 2024; Wamba-Taguimdje et al., 2020).
This result is also consistent with global evidence (Oladapo, 2024; Zhang & Yang, 2024), which found that AI integration into governance mechanisms strengthens ESG transparency and compliance. Similarly, Hamdouni (2025b) provides evidence from Saudi Arabia showing that AI adoption significantly improves environmental and social aspects of ESG performance, reinforcing the positive role of AI in advancing corporate sustainability. However, unlike some studies that reported mixed results—such as Alamoudi and Hamoudah (2023), who found weaker environmental effects—our results show consistently positive associations. This suggests that strong governance and regulatory oversight in Saudi banks mitigate the variability observed in other contexts. Hence, the Saudi evidence extends prior literature by demonstrating that responsible AI governance, when embedded within a supportive institutional and ethical framework, yields both financial and sustainability benefits.
The positive link between AI and ESG also resonates with Institutional Theory, as banks respond to regulatory, normative, and cultural pressures. In Saudi Arabia, Vision 2030 explicitly prioritizes digital innovation and sustainability, while Shariah governance principles reinforce ethical imperatives (Al-Nimer, 2024; Kashi et al., 2024). These institutional drivers ensure that AI is deployed responsibly, aligning with global best practices in sustainable finance (Oyewole et al., 2024; Xiao & Xiao, 2025).
Empirical evidence from other contexts supports these results. For instance, (Zhang & Yang, 2024) found that AI improves ESG disclosure quality by automating data collection and reporting, while Wamba-Taguimdje et al. (2020) showed that AI reduces greenwashing by enhancing auditability. Similarly, Oladapo (2024) argued that AI enables banks to integrate ethical decision-making into lending and investment, strengthening long-term sustainability.
Our findings also reconcile debates in the literature. Alamoudi and Hamoudah (2023) warned that irresponsible AI adoption can increase risks of bias, surveillance, and social harm. Yet, the positive results here suggest that robust governance frameworks in Saudi banks mitigate these risks, allowing ESG benefits to outweigh potential downsides. This mirrors findings by Rane et al. (2024), who stressed that ethical safeguards embedded into AI governance systems enhance long-term legitimacy and societal trust.
Control variables provide further nuance. Larger and older banks are associated with stronger ESG outcomes, likely due to more established governance structures and greater exposure to stakeholder scrutiny (Buallay et al., 2020; Nathania & Ekawati, 2024). Conversely, high leverage and poor asset quality weaken sustainability outcomes, consistent with evidence from D. Chen et al. (2022), who found that financial constraints limit ESG investments.
Overall, the findings demonstrate that responsible AI governance plays a dual role in Saudi banking:
- -
- Strategic Capability (RBV & Dynamic Capabilities Theory): By enhancing efficiency, innovation, and risk management, AI adoption strengthens financial performance (Tobin’s Q, ROA, ROE).
- -
- Legitimacy Mechanism (Stakeholder & Institutional Theories): By embedding ethical safeguards, transparency, and compliance, AI adoption improves ESG performance and societal trust.
- -
- This dual role explains why AI adoption generates value creation and sustainability benefits simultaneously. It also highlights the Saudi and GCC context, where institutional support (Vision 2030, SAMA initiatives) and cultural frameworks (Shariah governance) provide fertile ground for responsible AI adoption. The findings thus extend global debates by showing how contextual factors mediate the balance of costs and benefits in AI-driven transformation (Ghosh & Singh, 2025; Zhang & Yang, 2024).
5.3. Limitations and Future Research
Although these findings are robust, the study has certain limitations. The analysis is limited to 10 Saudi banks over the period 2015–2024, which may restrict the generalizability of the results to broader financial systems or longer time horizons. Moreover, while the use of multiple estimators mitigates endogeneity concerns, unobserved institutional or behavioral factors may still influence the observed relationships. Future research should extend the analysis to include other GCC countries and compare Islamic and conventional banking systems to capture cross-country institutional differences.
Future studies could also explore the non-linear effects of AI adoption—such as threshold levels or diminishing returns—and integrate qualitative approaches to understand managerial perceptions of responsible AI governance. Additionally, incorporating new dimensions of AI ethics, such as algorithmic fairness and explainability, would enhance the understanding of how governance quality mediates the financial–sustainability nexus.
6. Conclusions, Practical Implications, and Future Directions
This study examined the role of responsible AI governance in promoting value creation and sustainability within the Saudi banking sector. Drawing upon the Resource-Based View, Dynamic Capabilities Theory, Stakeholder Theory, and Institutional Theory, four hypotheses were developed to test whether AI adoption contributes to both financial outcomes (Tobin’s Q, ROA, ROE) and sustainability outcomes (ESG scores). Using robust econometric methods including fixed effects, pooled OLS, GMM, and heterogeneous panel estimators, the findings consistently demonstrated that responsible AI adoption is positively and significantly associated with improved performance and ESG ratings. The results therefore highlight the dual role of AI governance in enhancing financial competitiveness while simultaneously strengthening stakeholder trust and organizational legitimacy, particularly within the framework of Saudi Arabia’s Vision 2030 transformation agenda.
From a theoretical perspective, this study extends the Resource-Based View and Dynamic Capabilities Theory by showing that AI, when responsibly governed, functions as a unique, inimitable capability that enhances efficiency, innovation, and adaptability. It also reinforces Stakeholder and Institutional theories by demonstrating that ethical and transparent AI governance improves ESG outcomes and aligns organizational practices with regulatory expectations and societal values. In doing so, the results corroborate earlier findings (e.g., S. Li et al., 2023; Ridzuan et al., 2024) that responsible AI practices enhance both firm value and stakeholder legitimacy, while extending prior research by providing evidence from an emerging-market banking context.
From a practical standpoint, the study offers actionable implications for bank managers, regulators, and policymakers. Bank executives should view AI not merely as a technological tool but as a strategic governance mechanism that enhances both profitability and legitimacy. Implementing clear AI ethics frameworks—through dedicated ethics committees, algorithmic audits, and explainable AI tools—can help translate ethical commitments into operational practices. However, the study also cautions against the risk of “AI ethics washing,” where firms formally declare ethical principles without integrating them into real decision-making processes. Addressing this gap between symbolic and substantive AI governance remains essential to maintaining stakeholder trust and regulatory compliance.
For policymakers and regulators, the findings underscore the need to establish transparent standards and auditing mechanisms that ensure AI adoption aligns with ethical and sustainable development goals. National initiatives such as Vision 2030 can continue to act as catalysts for responsible innovation, fostering a culture of accountability and ethical compliance across financial institutions.
Despite its contributions, the study is not without limitations. First, its focus on Saudi banks restricts the generalizability of the findings to other sectors or regions, limiting the scope of its conclusions. Second, the proxies used to measure AI adoption, such as AI_I and LNAI, may not fully capture the qualitative aspects of AI governance, such as transparency in decision-making or adherence to ethical codes. Third, the relatively short time horizon of the panel may not adequately reflect the long-term effects of AI on value creation and sustainability. Fourth, while econometric approaches such as GMM help mitigate endogeneity, the study cannot completely rule out reverse causality, as more profitable banks may be more likely to adopt AI in the first place. Finally, ESG scores, while useful, are subject to methodological inconsistencies across rating agencies, which could affect comparability.
Building on these limitations, future research should investigate the relationship between formal AI ethics declarations and actual governance practices—addressing the risk of AI ethics washing in the financial sector. Scholars should explore how internal auditing, board oversight, and regulatory enforcement influence this alignment. Future studies should also broaden the scope beyond banking to sectors such as insurance, fintech, energy, and healthcare, where AI-driven transformation is accelerating. Comparative and cross-country analyses—particularly across GCC, emerging, and developed economies—would help identify institutional conditions that promote genuine responsible AI adoption. Mixed-methods approaches and longitudinal case studies could further uncover how AI governance evolves over time and how it balances innovation with accountability.
In conclusion, this study demonstrates that responsible AI governance serves as both a strategic capability and a legitimacy-enhancing mechanism in Saudi banks, simultaneously driving value creation and sustainability. The findings make a meaningful contribution to theory by integrating multiple perspectives, to practice by offering guidance for bank managers and regulators, and to policy by supporting the development of a national AI governance agenda aligned with Vision 2030. Ultimately, the research underscores that AI, when adopted responsibly, is not only a driver of profitability but also a catalyst for sustainable development in the financial sector.
Funding
This work was supported and funded by the Deanship of Scientific Research at Imam Mohammad Ibn Saud Islamic University (IMSIU) (Grant Number: IMSIU-DDRSP2504).
Institutional Review Board Statement
Not applicable.
Informed Consent Statement
Not applicable.
Data Availability Statement
The original contributions presented in this study are included in the article. Further inquiries can be directed to the corresponding author.
Conflicts of Interest
The author declares no conflicts of interest.
References
- Alamoudi, M. A., & Hamoudah, M. M. (2023). Do ESG Initiatives improve the performance of Saudi-listed banks? The moderating effect of bank size. International Journal of Accounting, Business and Finance, 3(1), 30–49. [Google Scholar] [CrossRef]
- Al-Baity, H. H. (2023). The artificial intelligence revolution in digital finance in Saudi Arabia: A comprehensive review and proposed framework. Sustainability, 15(18), 13725. [Google Scholar] [CrossRef]
- Alhammadi, S. (2024). Islamic finance as a driver for enhancing economic sustainability and innovation in the GCC. Journal of Science and Technology Policy Management. ahead-of-print. [Google Scholar] [CrossRef]
- Al-Nimer, M. (2024). Innovation capacity as a mediating mechanism between strategic risk integration and ESG performance: Evidence from Jordanian banks. International Journal of Financial Studies, 12(4), 126. [Google Scholar] [CrossRef]
- Antoniuk, D., & Koliada, O. (2025). Ensuring sustainable use of generative artificial intelligence by enterprises based on resource consumption optimization. Eastern-European Journal of Enterprise Technologies, 13(135), 68–77. [Google Scholar] [CrossRef]
- Baffour Gyau, E., Appiah, M., Gyamfi, B. A., Achie, T., & Naeem, M. A. (2024). Transforming banking: Examining the role of AI technology innovation in boosting banks financial performance. International Review of Financial Analysis, 96, 103700. [Google Scholar] [CrossRef]
- Bitzenis, A., Koutsoupias, N., & Nosios, M. (2025). Artificial intelligence and machine learning in production efficiency enhancement and sustainable development: A comprehensive bibliometric review. Frontiers in Sustainability, 5, 1508647. [Google Scholar] [CrossRef]
- Boudawara, Y., Toumi, K., Wannes, A., & Hussainey, K. (2023). Shari’ah governance quality and environmental, social and governance performance in Islamic banks. A cross-country evidence. Journal of Applied Accounting Research, 24(5), 1004–1026. [Google Scholar] [CrossRef]
- Buallay, A. M., Wadi, R. M. A., Kukreja, G., & Hassan, A. A. (2020). Evaluating ESG disclosures of Islamic banks: Evidence from the Organization of Islamic Cooperation Members. International Journal of Innovation and Sustainable Development, 14(3), 266. [Google Scholar] [CrossRef]
- Cai, C., Hazaea, S. A., Hael, M., Al-Matari, E. M., Alhebri, A., & Alfadhli, A. M. H. (2024). Mapping the landscape of the literature on environmental, social, governance disclosure and firm value: A bibliometric analysis and systematic review. Sustainability, 16(10), 4239. [Google Scholar] [CrossRef]
- Chen, D., Esperança, J. P., & Wang, S. (2022). The impact of artificial intelligence on firm performance: An application of the resource-based view to e-commerce firms. Frontiers in Psychology, 13, 884830. [Google Scholar] [CrossRef]
- Chen, J., Wang, N., Lin, T., Liu, B., & Hu, J. (2024). Shock or empowerment? Artificial intelligence technology and corporate ESG performance. Economic Analysis and Policy, 83, 1080–1096. [Google Scholar] [CrossRef]
- Chen, R., & Zhang, T. (2024). Artificial intelligence applications implication for ESG performance: Can digital transformation of enterprises promote sustainable development? Chinese Management Studies, 19(3), 676–701. [Google Scholar] [CrossRef]
- Chen, Y., Du, L., Zhang, B., Wang, L., Wang, K., Huang, X., & Shi, Y. (2025). The impact of artificial intelligence on the sustainability of international trade enterprises. International Review of Economics & Finance, 101, 104136. [Google Scholar] [CrossRef]
- Dammak, W., Fakhfekh, M., Alnafisah, H., & Jeribi, A. (2024). AI companies’ strategies with traditional vs. digital assets amid geopolitical and banking crises. Heliyon, 10(23), e40382. [Google Scholar] [CrossRef]
- Deberdt, R., Le Billon, P., Makinde, O., Dauvergne, P., Solwati, T., Razmi, S., Kumar, G., & Belhabib, D. (2025). Artificial intelligence and ESG in resources-intensive industries: Reviewing the use of AI in fisheries, mining, plastics, and forestry. The Extractive Industries and Society, 23, 101690. [Google Scholar] [CrossRef]
- Dudek, D., & Kulej-Dudek, E. (2024). Modern technologies in ESG reporting—Evidence from Polish enterprises. Procedia Computer Science, 246, 5359–5367. [Google Scholar] [CrossRef]
- Dwivedi, Y. K., Hughes, L., Ismagilova, E., Aarts, G., Coombs, C., Crick, T., Duan, Y., Dwivedi, R., Edwards, J., Eirug, A., Galanos, V., Ilavarasan, P. V., Janssen, M., Jones, P., Kar, A. K., Kizgin, H., Kronemann, B., Lal, B., Lucini, B., … Williams, M. D. (2021). Artificial Intelligence (AI): Multidisciplinary perspectives on emerging challenges, opportunities, and agenda for research, practice and policy. International Journal of Information Management, 57, 101994. [Google Scholar] [CrossRef]
- Ghosh, M., & Singh, M. P. (2025). Unveiling sustainable practices in financial institutions: A bibliometric analysis cum meta-analytical review on enhancing financial performance. Corporate Social Responsibility and Environmental Management, 32(2), 2295–2316. [Google Scholar] [CrossRef]
- Hamdouni, A. (2025a). The impact of ESG disclosure on corporate performance: Empirical evidence from Saudi Arabia’s listed heavy-polluting companies. International Journal of Innovative Research and Scientific Studies, 8(3), 1164–1174. [Google Scholar] [CrossRef]
- Hamdouni, A. (2025b). The role of Artificial Intelligence in enhancing ESG outcomes: Insights from Saudi Arabia. Journal of Risk and Financial Management, 18(10), 572. [Google Scholar] [CrossRef]
- Hamdouni, A. (2025c). Value creation through environmental, social, and governance (ESG) disclosures. Journal of Risk and Financial Management, 18(8), 415. [Google Scholar] [CrossRef]
- Kashi, A., Laallam, A., Mansour Nomran, N., Azmi Abumughli, A., & Al-Binali, T. (2024). Do institutional environment and corporate governance structures determine Islamic Banks’ sustainability performance? Evidence across key jurisdictions in Islamic finance industry. Borsa Istanbul Review, 24(6), 1088–1100. [Google Scholar] [CrossRef]
- Khanfar, A. A., Kiani Mavi, R., Iranmanesh, M., & Gengatharen, D. (2024). Determinants of artificial intelligence adoption: Research themes and future directions. Information Technology and Management. [Google Scholar] [CrossRef]
- Lazo, M., & Ebardo, R. (2023). Artificial Intelligence adoption in the banking industry: Current state and future prospect. Journal of Innovation Management, 11(3), 54–74. [Google Scholar] [CrossRef]
- Li, J., Wu, T., Hu, B., Pan, D., & Zhou, Y. (2025). Artificial intelligence and corporate ESG performance. International Review of Financial Analysis, 102, 104036. [Google Scholar] [CrossRef]
- Li, S., Younas, M. W., Maqsood, U. S., & Zahid, R. A. (2024). Impact of AI adoption on ESG performance: Evidence from Chinese firms. Energy & Environment. ahead-of-print. 1–38. [Google Scholar] [CrossRef]
- Li, S., Younas, M. W., Zahid, R. M. A., & Maqsood, U. S. (2023). Driving sustainable development: The impact of Artificial Intelligence on environmental, social, and governance (ESG) performance. Elsevier BV. Available online: http://ouci.dntb.gov.ua/en/works/7BGjzAP4/ (accessed on 3 June 2023).
- Lin, B., & Zhu, Y. (2025). The impact of artificial intelligence policy on green innovation of firms. Energy Economics, 148, 108524. [Google Scholar] [CrossRef]
- Liu, X., Ma, C., & Ren, Y.-S. (2024). How AI powers ESG performance in China’s digital frontier? Finance Research Letters, 70, 106324. [Google Scholar] [CrossRef]
- McElheran, K., Li, J. F., Brynjolfsson, E., Kroff, Z., Dinlersoz, E., Foster, L., & Zolas, N. (2024). AI adoption in America: Who, what, and where. Journal of Economics & Management Strategy, 33(2), 375–415. [Google Scholar] [CrossRef]
- Nathania, R., & Ekawati, E. (2024). Banking on ESG: How ownership influences financial outcomes in 5-ASEAN countries. Banks and Bank Systems, 19(3), 121–132. [Google Scholar] [CrossRef]
- Neumann, O., Guirguis, K., & Steiner, R. (2024). Exploring artificial intelligence adoption in public organizations: A comparative case study. Public Management Review, 26(1), 114–141. [Google Scholar] [CrossRef]
- Nosirov, I., Yormatov, I., Yuldasheva, N., & Avulchayeva, F. (2024, April 18–19). AI and corporate sustainability: Exploring the environmental and social impacts of AI integration. 2024 International Conference on Knowledge Engineering and Communication Systems (ICKECS) (Vol. 1, pp. 1–7), Chikkaballapur, India. [Google Scholar] [CrossRef]
- Oladapo, I. A. (2024). Enhancing sustainable performance among Islamic banks in Saudi Arabia: The role of management support and environmental innovation. Cogent Social Sciences, 10(1), 2433701. [Google Scholar] [CrossRef]
- Oyewole, A. T., Adeoye, O. B., Addy, W. A., Okoye, C. C., Ofodile, O. C., & Ugochukwu, C. E. (2024). Promoting sustainability in finance with AI: A review of current practices and future potential. World Journal of Advanced Research and Reviews, 21(3), 590–607. [Google Scholar] [CrossRef]
- Rane, N., Choudhary, S., & Rane, J. (2024). Artificial intelligence driven approaches to strengthening environmental, social, and governance (ESG) criteria in sustainable business practices: A review. SSRN Electronic Journal. [Google Scholar] [CrossRef]
- Ridzuan, N. N., Masri, M., Anshari, M., Fitriyani, N. L., & Syafrudin, M. (2024). AI in the financial sector: The line between innovation, regulation and ethical responsibility. Information, 15(8), 432. [Google Scholar] [CrossRef]
- Sendi, A., Banna, H., Hassan, M. K., & Huq, T. I. (2024). The effect of ESG scores on bank stability: Islamic vs. conventional banks. Journal of Sustainable Finance & Investment, 1–31. [Google Scholar] [CrossRef]
- Shahzadi, G., Jia, F., Chen, L., & John, A. (2024). AI adoption in supply chain management: A systematic literature review. Journal of Manufacturing Technology Management, 35(6), 1125–1150. [Google Scholar] [CrossRef]
- Smith, J. (2024). Influence of digital transformation on firm performance in the service industry in United States. International Journal of Business Strategies, 9(1), 63–74. [Google Scholar] [CrossRef]
- Wamba-Taguimdje, S.-L., Fosso Wamba, S., Kala Kamdjoug, J. R., & Tchatchouang Wanko, C. E. (2020). Influence of artificial intelligence (AI) on firm performance: The business value of AI-based transformation projects. Business Process Management Journal, 26(7), 1893–1924. [Google Scholar] [CrossRef]
- Wang, L., & Chen, Y. (2025). Artificial intelligence and corporate investment efficiency: Evidence from China. Emerging Markets Review, 68, 101314. [Google Scholar] [CrossRef]
- Weng, M. (2025). Green innovation through artificial intelligence technology: Enhancing environmental, social, and governance performance. Finance Research Letters, 75, 106921. [Google Scholar] [CrossRef]
- Xiao, Y., & Xiao, L. (2025). The impact of artificial intelligence-driven ESG performance on sustainable development of central state-owned enterprises listed companies. Scientific Reports, 15(1), 8548. [Google Scholar] [CrossRef] [PubMed]
- Yu, M., Sun, Q., & Huang, H. (2025). The impact of artificial intelligence on the green governance performance of enterprises. International Review of Financial Analysis, 106, 104548. [Google Scholar] [CrossRef]
- Zhang, C., & Yang, J. (2024). Artificial intelligence and corporate ESG performance. International Review of Economics & Finance, 96, 103713. [Google Scholar] [CrossRef]
- Zhou, X., Li, G., Wang, Q., Li, Y., & Zhou, D. (2025). Artificial intelligence, corporate information governance and ESG performance: Quasi-experimental evidence from China. International Review of Financial Analysis, 102, 104087. [Google Scholar] [CrossRef]
- Zhou, Y., Alnafrah, I., & Dagestani, A. A. (2025). Leveraging AI and green finance for cleaner energy production: A sustainability framework for ESG integration and climate action. Journal of Cleaner Production, 525, 146595. [Google Scholar] [CrossRef]

Disclaimer/Publisher’s Note: The statements, opinions and data contained in all publications are solely those of the individual author(s) and contributor(s) and not of MDPI and/or the editor(s). MDPI and/or the editor(s) disclaim responsibility for any injury to people or property resulting from any ideas, methods, instructions or products referred to in the content. |
© 2025 by the author. Licensee MDPI, Basel, Switzerland. This article is an open access article distributed under the terms and conditions of the Creative Commons Attribution (CC BY) license (https://creativecommons.org/licenses/by/4.0/).