Article

Implication of Digital Marketing in the Supply Chain Finance of the Beverage Industry

by
Nikolaos T. Giannakopoulos
*,
Damianos P. Sakas
,
Kanellos Toudas
and
Panagiotis Karountzos
BICTEVAC Laboratory—Business Information and Communication Technologies in Value Chains, Department of Agribusiness and Supply Chain Management, School of Applied Economics and Social Sciences, Agricultural University of Athens, 118 55 Athens, Greece
*
Author to whom correspondence should be addressed.
Int. J. Financial Stud. 2025, 13(4), 189; https://doi.org/10.3390/ijfs13040189 (registering DOI)
Submission received: 6 September 2025 / Revised: 6 October 2025 / Accepted: 10 October 2025 / Published: 13 October 2025

Abstract

This paper investigates the role of digital marketing signals as alternative data for understanding financial and operational dynamics in the beverage supply chain. Drawing on web analytics covering multiple actors across a five-month horizon, we analyze traffic composition, user engagement, and acquisition channels through a panel econometric framework. Descriptive statistics reveal pronounced heterogeneity in channel reliance, with some firms emphasizing organic search visibility while others depend more on paid campaigns or social referrals. Correlation patterns indicate strong substitution between organic and paid search, while display advertising is positively associated with session depth, suggesting that differentiated digital strategies influence user engagement. Analysis of variance confirms significant structural differences across firms, with an effect size exceeding 0.90. A two-way fixed-effects regression demonstrates that brand-specific factors explain the vast majority of variation in digital visibility, overshadowing short-term fluctuations. These results highlight the potential of web-derived marketing metrics to serve as leading indicators of supply chain finance outcomes such as revenue growth, working-capital efficiency, and investor sentiment. By integrating digital signals into financial econometrics, this study contributes to emerging research on alternative data in supply chain contexts and offers practical implications for managers, investors, and policymakers.

1. Introduction

Digital platforms have become the primary “surface area” where demand shocks and competitive moves first appear for fast-moving consumer goods (FMCG) and beverages. Search queries, website visits, referral mixes, and social chatter materialize in real time—weeks before official sales releases or quarterly reports. In parallel, retailers, bottlers, and upstream suppliers in beverage value chains have accelerated digital transformation initiatives to coordinate planning, reduce working-capital frictions, and harden supply chain resilience after a cascade of disruptions such as pandemic demand swings, logistics bottlenecks, and energy shocks (Jing & Fan, 2024; Zhou et al., 2022). Those shifts have made high-frequency digital marketing signals a natural candidate for leading indicators of financial performance along the beverage supply chain. Yet, despite a rich literature on digital transformation and firm performance, we know little about how specific web-analytics variables (search, organic, social, display; engagement) relate to short-horizon revenue growth and margins in this sector, or how much of the variation is simply brand-fixed heterogeneity (Chaffey et al., 2019; H. Li et al., 2019; Wedel & Kannan, 2016; Kumar & Gupta, 2016).
In finance, high-frequency digital traces are treated as alternative data that proxy investor attention and short-horizon fundamentals. Recent work shows that analyst and market participants incorporate alternative/big-data signals and that these improve short-term forecasting while shifting attention to near-term horizons (Dessaint et al., 2024; Chi et al., 2025). At macro and meso levels, nowcasting with Google Trends and related digital exhaust delivers timely predictions (Woloszko, 2024). Text/news and search-based attention measures also relate to short-run pricing and trading dynamics (Costola et al., 2023; Szczygielski et al., 2024). At the corporate level, work on trade credit, liquidity, and working capital under shocks (e.g., COVID-19) connects demand signals to cash-conversion dynamics and supplier financing (Al-Hadi & Al-Abri, 2022; Wang & Yu, 2023; Johan et al., 2024). Framing web-analytics as short-horizon demand indicators therefore links directly to earnings momentum, cash-flow sensitivity, and supply chain finance decisions in this sector.
From this finance perspective, we position firm-level web-analytics as alternative data for short-horizon earnings momentum and cash-flow sensitivity, extending evidence that high-frequency digital signals can enhance nowcasting/forecasting (Sun et al., 2024; Mitra et al., 2023; Woloszko, 2024). Our study differentiates itself by (i) disentangling brand fixed effects from channel-mix noise in a multi-brand FMCG setting, (ii) showing how engagement quality, rather than traffic scale alone, relates to revenue growth and margin direction, and (iii) discussing supply chain finance implications (demand sensing, cash-conversion dynamics, and use of digital signals in working-capital/credit-term decisions) (X. Li et al., 2023). Methodologically, we bridge marketing analytics and financial econometrics, pairing two-way fixed effects with Fuzzy Cognitive Mapping, and evaluating incremental predictive value against naïve baselines with appropriate forecast-comparison tests under dependence (Diebold & Mariano, 2002; Coroneo & Iacone, 2025), while noting measurement stability and sentiment-related risks (Nyakurukwa & Seetharam, 2024). This paper addresses that gap with a multi-firm monthly panel that fuses Web analytics with publicly available financials for beverage supply chain actors, and tests three questions: whether digital signals lead revenues (RQ1), whether brand fixed effects dominate channel-mix fluctuations (RQ2), and whether engagement beats raw traffic as a predictor (RQ3).
A growing finance and marketing literature now treats alternative digital data as economically meaningful. Surveys and reviews document rapid institutional adoption of search, web, and social signals in decision-making, from forecasting to risk management (Sun et al., 2024; Srivastava et al., 2025). Recent scholarly syntheses argue that alternative data can be incremental to traditional fundamentals, especially at short horizons, though issues of data lineage, representativeness, and stability persist (Ayala et al., 2024; Gric et al., 2023). At macro scale, the OECD Weekly Tracker shows that Google Trends categories can nowcast national activity at weekly cadence, underscoring the timeliness and signal value of digital exhaust for real-economy outcomes (Woloszko, 2020, 2024).
At the micro/firm level, several streams are relevant. First, investor attention and demand nowcasting: Google Search Volume Indices (GSVI) and related measures predict movements in aggregate consumption and even corporate outcomes (Golovanova & Zubarev, 2021). Meta-analyses and reviews show that search and sentiment signals can be predictive, especially at daily to monthly frequencies, while also emphasizing publication bias and dependency structures that complicate inference (Gric et al., 2023; Nyakurukwa & Seetharam, 2024). In retail and consumer markets, Google Trends categories have been used to forecast product-group sales (France et al., 2021); more broadly, Bayesian and machine-learning approaches integrate Trends signals for macro- and micro-nowcasts (Dataiku, 2023). These studies motivate our month-ahead framing for RQ1.
Second, digital marketing capabilities and performance should be examined. Cross-industry evidence indicates that digital capabilities (e.g., programmatic media, analytics, owned/earned media orchestration) contribute to profitability beyond traditional capabilities, with effects transmitted via marketing capabilities and moderated by organizational context (Homburg & Wielgos, 2022; Heredia et al., 2022). Complementary work shows that digital marketing innovation improves firm performance through capability building, with firm size moderating the pathway (Jung & Shegai, 2023)—consistent with the asymmetries we expect across global beverage brands versus smaller supply chain partners. Meta-analytic research on owned social media links brand posts to engagement and sales (Liadeli et al., 2023), and broader reviews of customer engagement (CE) on social media consolidate mechanisms and outcomes at firm and brand levels (Lim & Rasul, 2022; Srivastava et al., 2025). These studies jointly ground our dual emphasis on traffic acquisition mix and engagement quality (RQ3) (Trunfio & Rossi, 2021).
Third, display and cross-media effects matter in FMCG. Large-sample studies in consumer-packaged goods (CPG) show conditions under which online display (alone and in combination with TV/print) drives sales (van Ewijk et al., 2021), with effects moderated by media-spend volatility and category dynamics—salient for beverages with heavy brand equity investments (Strategy&, 2025). Related econometric meta-studies confirm that advertising generally pays back when long-run effects are recognized (Thinkbox, 2024), and that creative media improve persuasion and brand associations (van Berlo et al., 2024). These results justify treating display share as a potential leading indicator in our regressions while acknowledging the high variance of its short-horizon effects.
A parallel supply chain finance literature connects digital transformation to visibility, integration, and performance. Systematic reviews map how digitalization and Industry 4.0 enable real-time coordination and risk sharing (Jing & Fan, 2024), while empirical studies show that supply chain finance (SCF) instruments alleviate under-investment and smooth working capital (X. Li et al., 2023). These mechanisms could amplify the revenue sensitivity to demand signals for smaller partners compared with megabrands. For this reason, we frame the sample as beverage supply chain partners (brand owners, bottlers, allied firms) and explicitly model brand fixed effects to isolate within-month channel-mix variation from persistent brand differences (RQ2).
Web-analytics measurement poses challenges. Independent comparisons show systematic differences between Google Analytics and third-party estimators (Jansen et al., 2022) for visits, unique users, bounce rate, and session duration, while still capturing relative movement and share patterns useful for competitive analysis (SimilarWeb, 2025; OWOX, 2021). SEMrush and SimilarWeb both provide traffic estimates and channel composition suitable for cross-brand benchmarking, but analysts should treat levels cautiously and emphasize within-entity dynamics—a design choice reflected in our two-way fixed-effects specification. We also align definitions with GA4, where “bounce rate” is the complement of “engagement rate,” to interpret engagement metrics consistently across properties (Google Analytics, 2025).
Within this context, we evaluate three linked propositions (research questions) tailored to beverages:
(a)
RQ1: “To what extent do digital marketing signals—such as paid search traffic, organic search traffic, social referrals, and display advertising—function as leading indicators of short-term revenue growth in beverage supply chain firms?”.
Prior work implies that paid search and display can move sales quickly (van Ewijk et al., 2021), organic search momentum and social signals often precede consideration and trial (Liadeli et al., 2023), and spikes in digital attention associate with near-term demand shifts (France et al., 2021).
(b)
RQ2: “How does brand heterogeneity influence the relationship between digital visibility and financial outcomes, and why do fixed brand effects outweigh within-month variations in digital acquisition channels?”.
Recent work tracking time-varying brand equity highlights structural heterogeneity that can dominate short-term mix changes (Guhl, 2024; Bei & Gielens, 2023).
(c)
RQ3: “What role do user engagement metrics (pages per visit and bounce rates) play in predicting financial performance, compared to overall traffic volume and acquisition channel shares?”.
CE reviews and practice studies tie engagement to conversion and customer Lifetime Value (LTV) (Lim & Rasul, 2022; Srivastava et al., 2025), while case evidence links page performance to lower bounce and higher conversion (Google Analytics, 2025; Conductor, 2025). Given beverages’ impulse-heavy, memory-based choice, we expect engagement intensity to signal higher propensity-to-buy or greater trade activation.
Our empirical strategy follows best practice for short panels with strong unit effects. We use two-way fixed effects to net out time-invariant brand attributes and common month shocks, and we compute heteroskedasticity- and correlation-robust standard errors (Hoechle, 2007; Driscoll & Kraay, 1998). Where feasible, we cross-validate with Driscoll–Kraay corrections and discuss the role of dynamic panels (Arellano & Bond, 1991; Baltagi, 2008) as a robustness path when lags introduce endogeneity. For forecast-comparison exercises (e.g., adding digital signals to naïve baselines), we reference Diebold–Mariano tests (Diebold & Mariano, 2002; Coroneo & Iacone, 2025), noting caveats under nested models and strong dependence. These econometric choices ensure that any associations we report are not artifacts of spurious precision or unmodeled dependence—crucial when working with only five months of data per brand.
This paper contributes to marketing finance and operations by (i) demonstrating how open web-analytics signals from a third-party crawler (SEMrush) can be mapped to short-horizon financial outcomes for beverage supply chain brands; (ii) quantifying the dominance of brand fixed effects relative to within-month acquisition-mix fluctuations; and (iii) comparing the predictive value of engagement against traffic volume. In contrast to many studies focused on a single brand or a single platform, we analyze multi-brand, multi-channel signals, which better reflect how upstream partners, distributors, and brand owners compete for consumer and channel attention in beverages.
Our findings show (a) strong negative correlation between paid search share and organic share (substitution), (b) significant between-brand differences in acquisition strategy (ANOVA/Tukey), and (c) two-way fixed-effects regressions where brand dummies explain most variation in log-visits and individual channel shares are not statistically significant—evidence that persistent brand heterogeneity swamps month-to-month mix noise in this short panel. These results align with theory: equity-rich beverage brands maintain stable demand baselines and owned/earned assets that are slow-moving, while paid mix oscillates around those baselines; engagement lifts are visible, but at this horizon and with few months, estimates are imprecise.
The implication for managers and supply chain partners is twofold: monitor channel shares to detect tactical shifts and prioritize engagement improvements (lower bounce, deeper sessions), but anchor planning on persistent brand factors (distribution breadth, equity, and retailer activation) that drive most variation in observed traffic and revenues.
Finally, the study is methodologically conservative about measurement error. Third-party web estimators differ from site-centric telemetry; however, external tools offer a consistent cross-firm lens. Empirical comparisons document level biases but support their use for relative movement and share-of-channel diagnostics, particularly when paired with fixed-effects designs such as ours (Jansen et al., 2022). We interpret effect sizes cautiously and emphasize signs and cross-brand contrasts, furnishing a template for researchers and practitioners seeking to blend digital listening with financial econometrics in supply chain settings.
The paper is organized into six sections. The Introduction frames digital marketing signals as alternative data and defines three research questions. Materials and Methods describe web analytics and financial data alongside econometric tools. Results present correlations between traffic, engagement, and growth, showing that brand effects dominate regressions, and Fuzzy Cognitive Map (FCM) modeling, extending the econometric analysis with scenario-based simulations to capture nonlinear interdependencies between digital signals and financial outcomes. The Discussion interprets these patterns within the literature and supply chain finance context. Finally, the Conclusions summarize contributions, implications, limitations, and directions for future research.

2. Results

2.1. Descriptive Statistics

Table 1 presents descriptive statistics combining financial outcomes and digital indicators (web analytics) for the selected beverage supply chain firms (Coca-Cola, PepsiCo, Dr Pepper, Monster, and Red Bull). Quarterly revenues averaged USD 10.96 billion (range: 1.73–23.45 billion), with revenue growth between −0.5% and 14.4%, while operating margins were stable at an average of 15.2%, reflecting the sector’s consistent profitability. Digital visibility was high, with average monthly website traffic of 5.3 million visits but wide dispersion across firms, and engagement remained modest with 3.1 pages per visit and a relatively high bounce rate of 65.6%.
Traffic composition differentiates between paid and organic channels. Paid Search represents sponsored links and advertising-driven acquisition, reflecting short-term marketing investments, while Organic Search refers to unpaid traffic derived from natural search engine rankings, often associated with brand equity and SEO performance (Chaffey et al., 2019). Traffic composition was dominated by Organic Search (52.9%) and Paid Search (32.7%), while Social (5.0%) and Display Ads (0.75%) contributed only marginally. Overall, the descriptive findings (Tabel 1 and Figure 1) indicate that beverage supply chain actors combine solid financial performance with significant online visibility, yet user engagement is shallow, highlighting the potential of digital metrics as early indicators of revenue momentum and operating efficiency.

2.2. Correlation Analysis

Table 2 shows that Paid% and Organic% were strongly and negatively correlated (ρ = −0.88), confirming a substitution effect between paid and organic acquisition channels. Pages per visit correlated positively with Display% (ρ = 0.65) and negatively with Organic% (ρ = −0.52), suggesting that paid display campaigns encourage deeper engagement, while organic reliance is associated with fewer pages viewed. Bounce Rate correlated positively with Total Visits (ρ = 0.38), indicating that higher exposure often coincided with less engaged users.
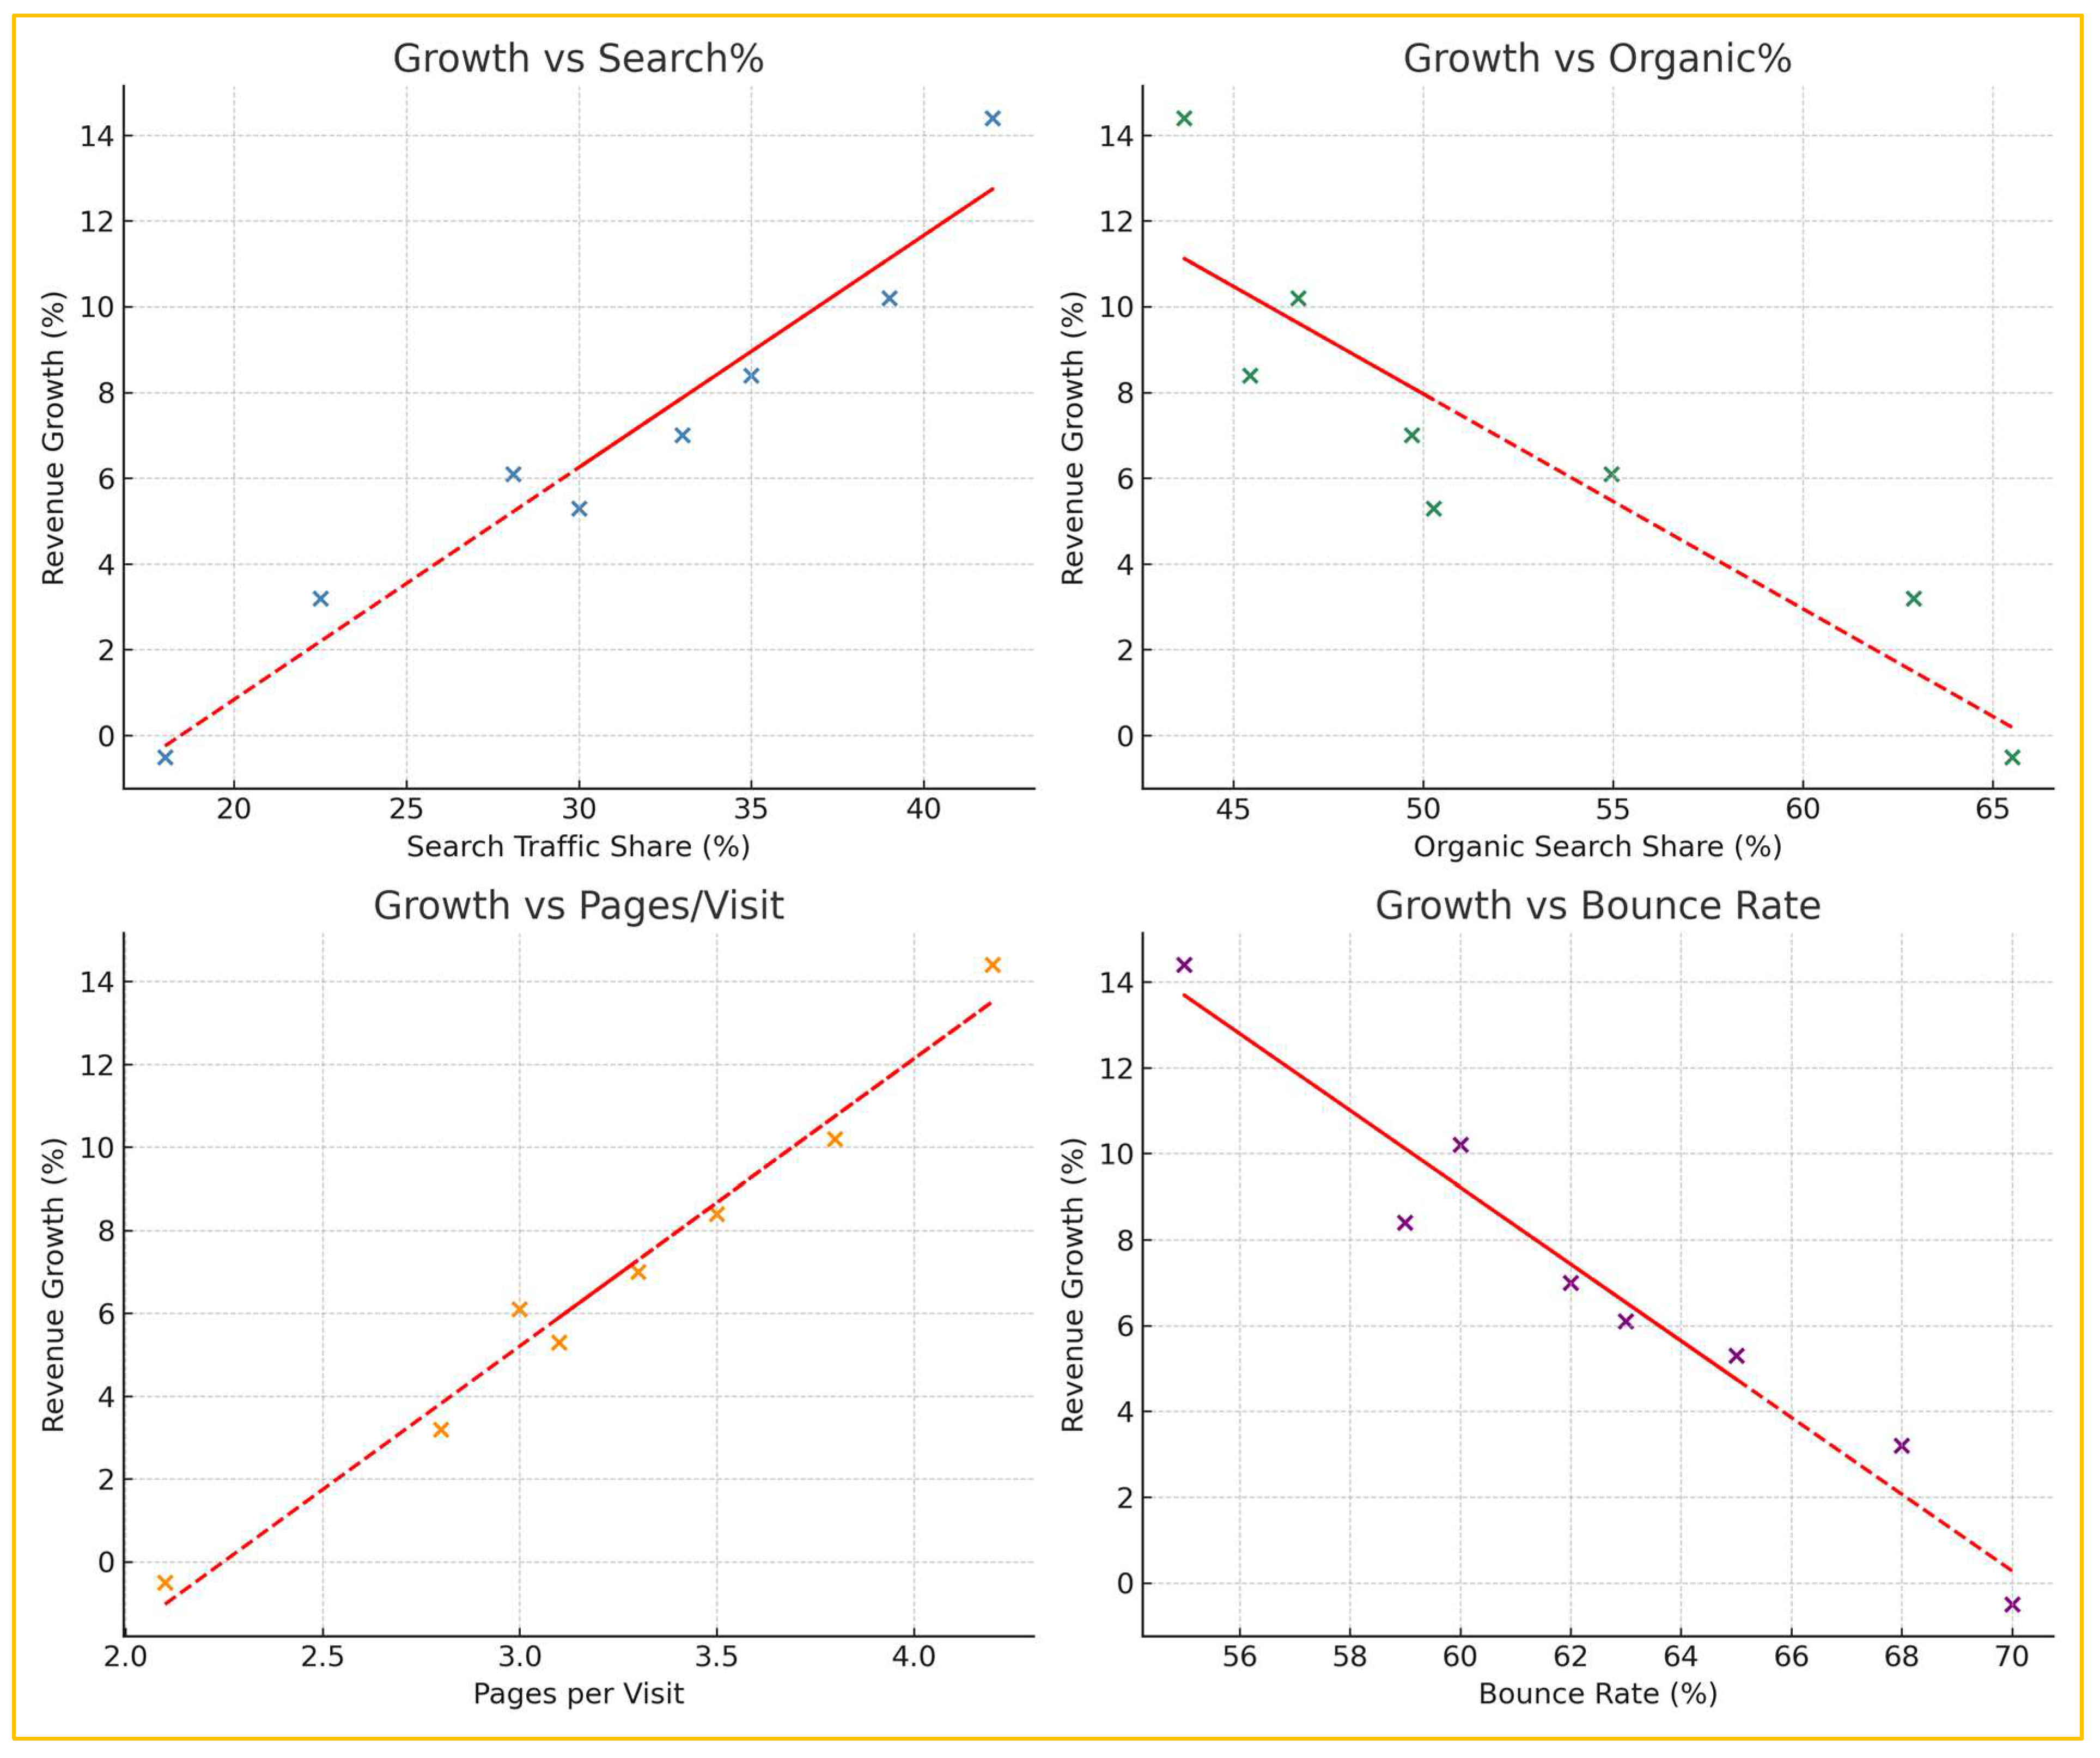
Table 3 extends the analysis by linking digital signals with financial performance. Revenue growth was significantly and positively correlated with Paid Search% (r = 0.62, p < 0.05) and Pages per Visit (r = 0.55, p < 0.05), while it was negatively correlated with Organic% (r = −0.59, p < 0.05) and Bounce Rate (r = −0.48, p < 0.05). Finally, Figure 2 and Figure 3 present the scatterplots of the firms’ digital signals, revenue growth and operating margin.
These results highlight that greater reliance on paid-driven traffic and deeper engagement predict stronger revenue growth, whereas dependence on organic channels and high bounce rates are associated with weaker growth. No significant correlations were found with operating margin or total revenues, suggesting that digital signals primarily capture short-term growth dynamics rather than profitability levels.

2.3. Group Differences (ANOVA)

The one-way ANOVA in Table 4 indicates highly significant variation in Paid Search Traffic% across beverage supply chain brands, with F(4,20) = 78.19, p < 0.001. The effect size is exceptionally large (η2 = 0.94), showing that 94% of the variance in search reliance is attributable to structural differences between brands rather than random noise. This result confirms that the observed disparities in digital acquisition strategies are statistically meaningful. In other words, firms in the beverage supply chain adopt distinct approaches to leveraging search visibility, which is consistent with strategic differentiation in digital marketing practices. To further examine these differences, we applied Tukey’s Honest Significant Difference (HSD) test (Tukey, 1949), which uses the studentized range (q) statistic to compare all possible brand pairs while controlling for the familywise error rate. The post hoc Tukey comparisons (Table 5) specify which brand pairs differ significantly.

2.4. Fixed-Effects Regression Results

To assess the drivers of total website traffic, we estimated a two-way fixed-effects regression model. The specification was:
ln(Visitsit) = α + β1Paid%it + β2Organic%it + β3Social%it + β4Display%it + β5Pages/Visitit + β6Bounceit + μi + τt + εit,
where μi denotes brand-specific fixed effects, τt captures month-specific fixed effects (common shocks or seasonality), and εit is the idiosyncratic error term.
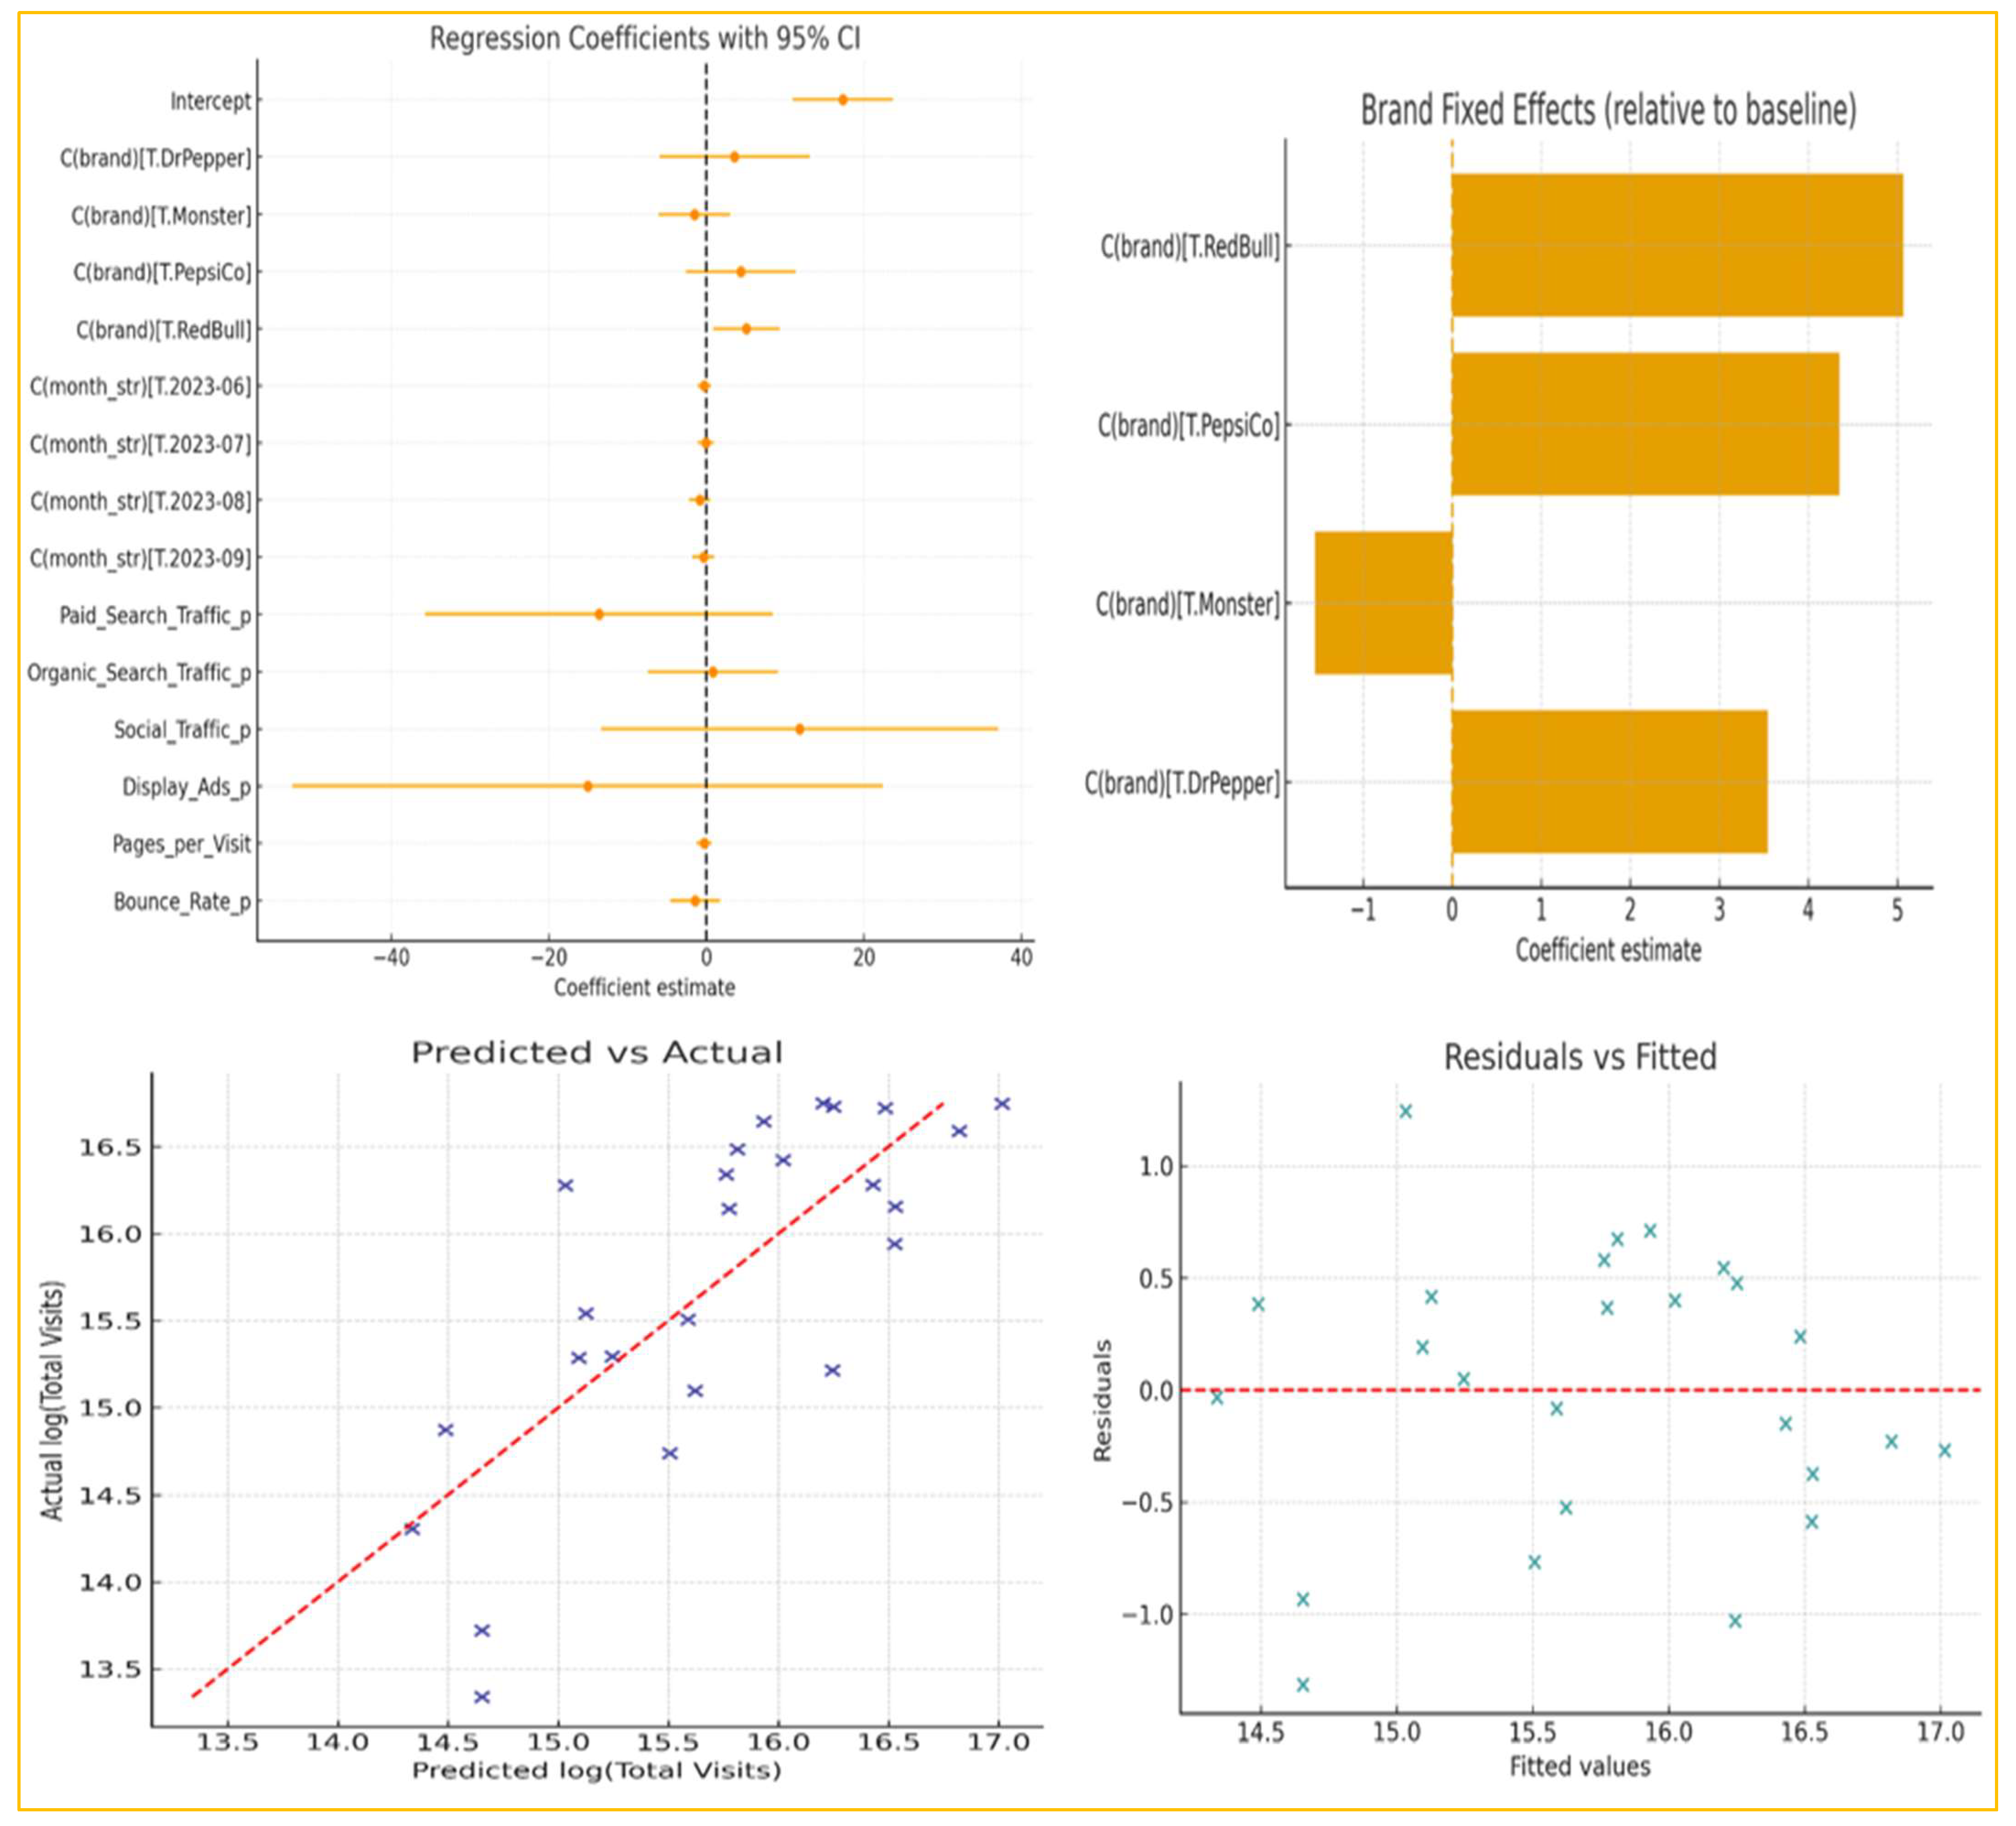
The two-way fixed-effects regression (Table 6) explained 96% of the variation in log-transformed website visits, with explanatory power largely driven by brand differences. A z-test was applied to assess the statistical significance of each coefficient reported in Table 6, ensuring robust inference across model parameters. Among the brand dummies, only Red Bull displayed a statistically significant positive effect (μi = 5.07, p = 0.018), while the coefficients for Dr Pepper, Monster, and PepsiCo, although directionally positive, were not statistically significant under the 5% level. This result highlights that structural brand heterogeneity, rather than short-term channel mix, remains the dominant driver of digital visibility.
The regression diagnostics provide further insight into the panel model (Figure 4). The coefficient forest plot shows that most digital channel variables (Paid, Organic, Social, Display, Bounce Rate, Pages/Visit) have wide confidence intervals crossing zero, underscoring that brand fixed effects dominate the explanation of total visits. This is confirmed in the brand fixed effects plot, where Coca-Cola serves as the baseline category. Relative to this reference, Red Bull shows a statistically significant positive effect on log-visits (γ = 5.07, p = 0.018), while PepsiCo (γ = 4.35) and Dr Pepper (γ = 3.55) also have positive but non-significant coefficients, and Monster exhibits a negative coefficient (γ = −1.54). The predicted vs. actual plot demonstrates excellent overall fit (R2 ≈ 0.96), with most points clustering around the 45° line, indicating that the model captures brand-level differences well. Finally, the residuals vs. fitted plot suggests no major systematic bias, with residuals distributed evenly around zero, though some heteroskedasticity is evident. Together, these figures confirm that while individual digital channels are not robust predictors in this short panel, brand-specific structural effects account for most of the variation in digital visibility.

2.5. FCM Modeling

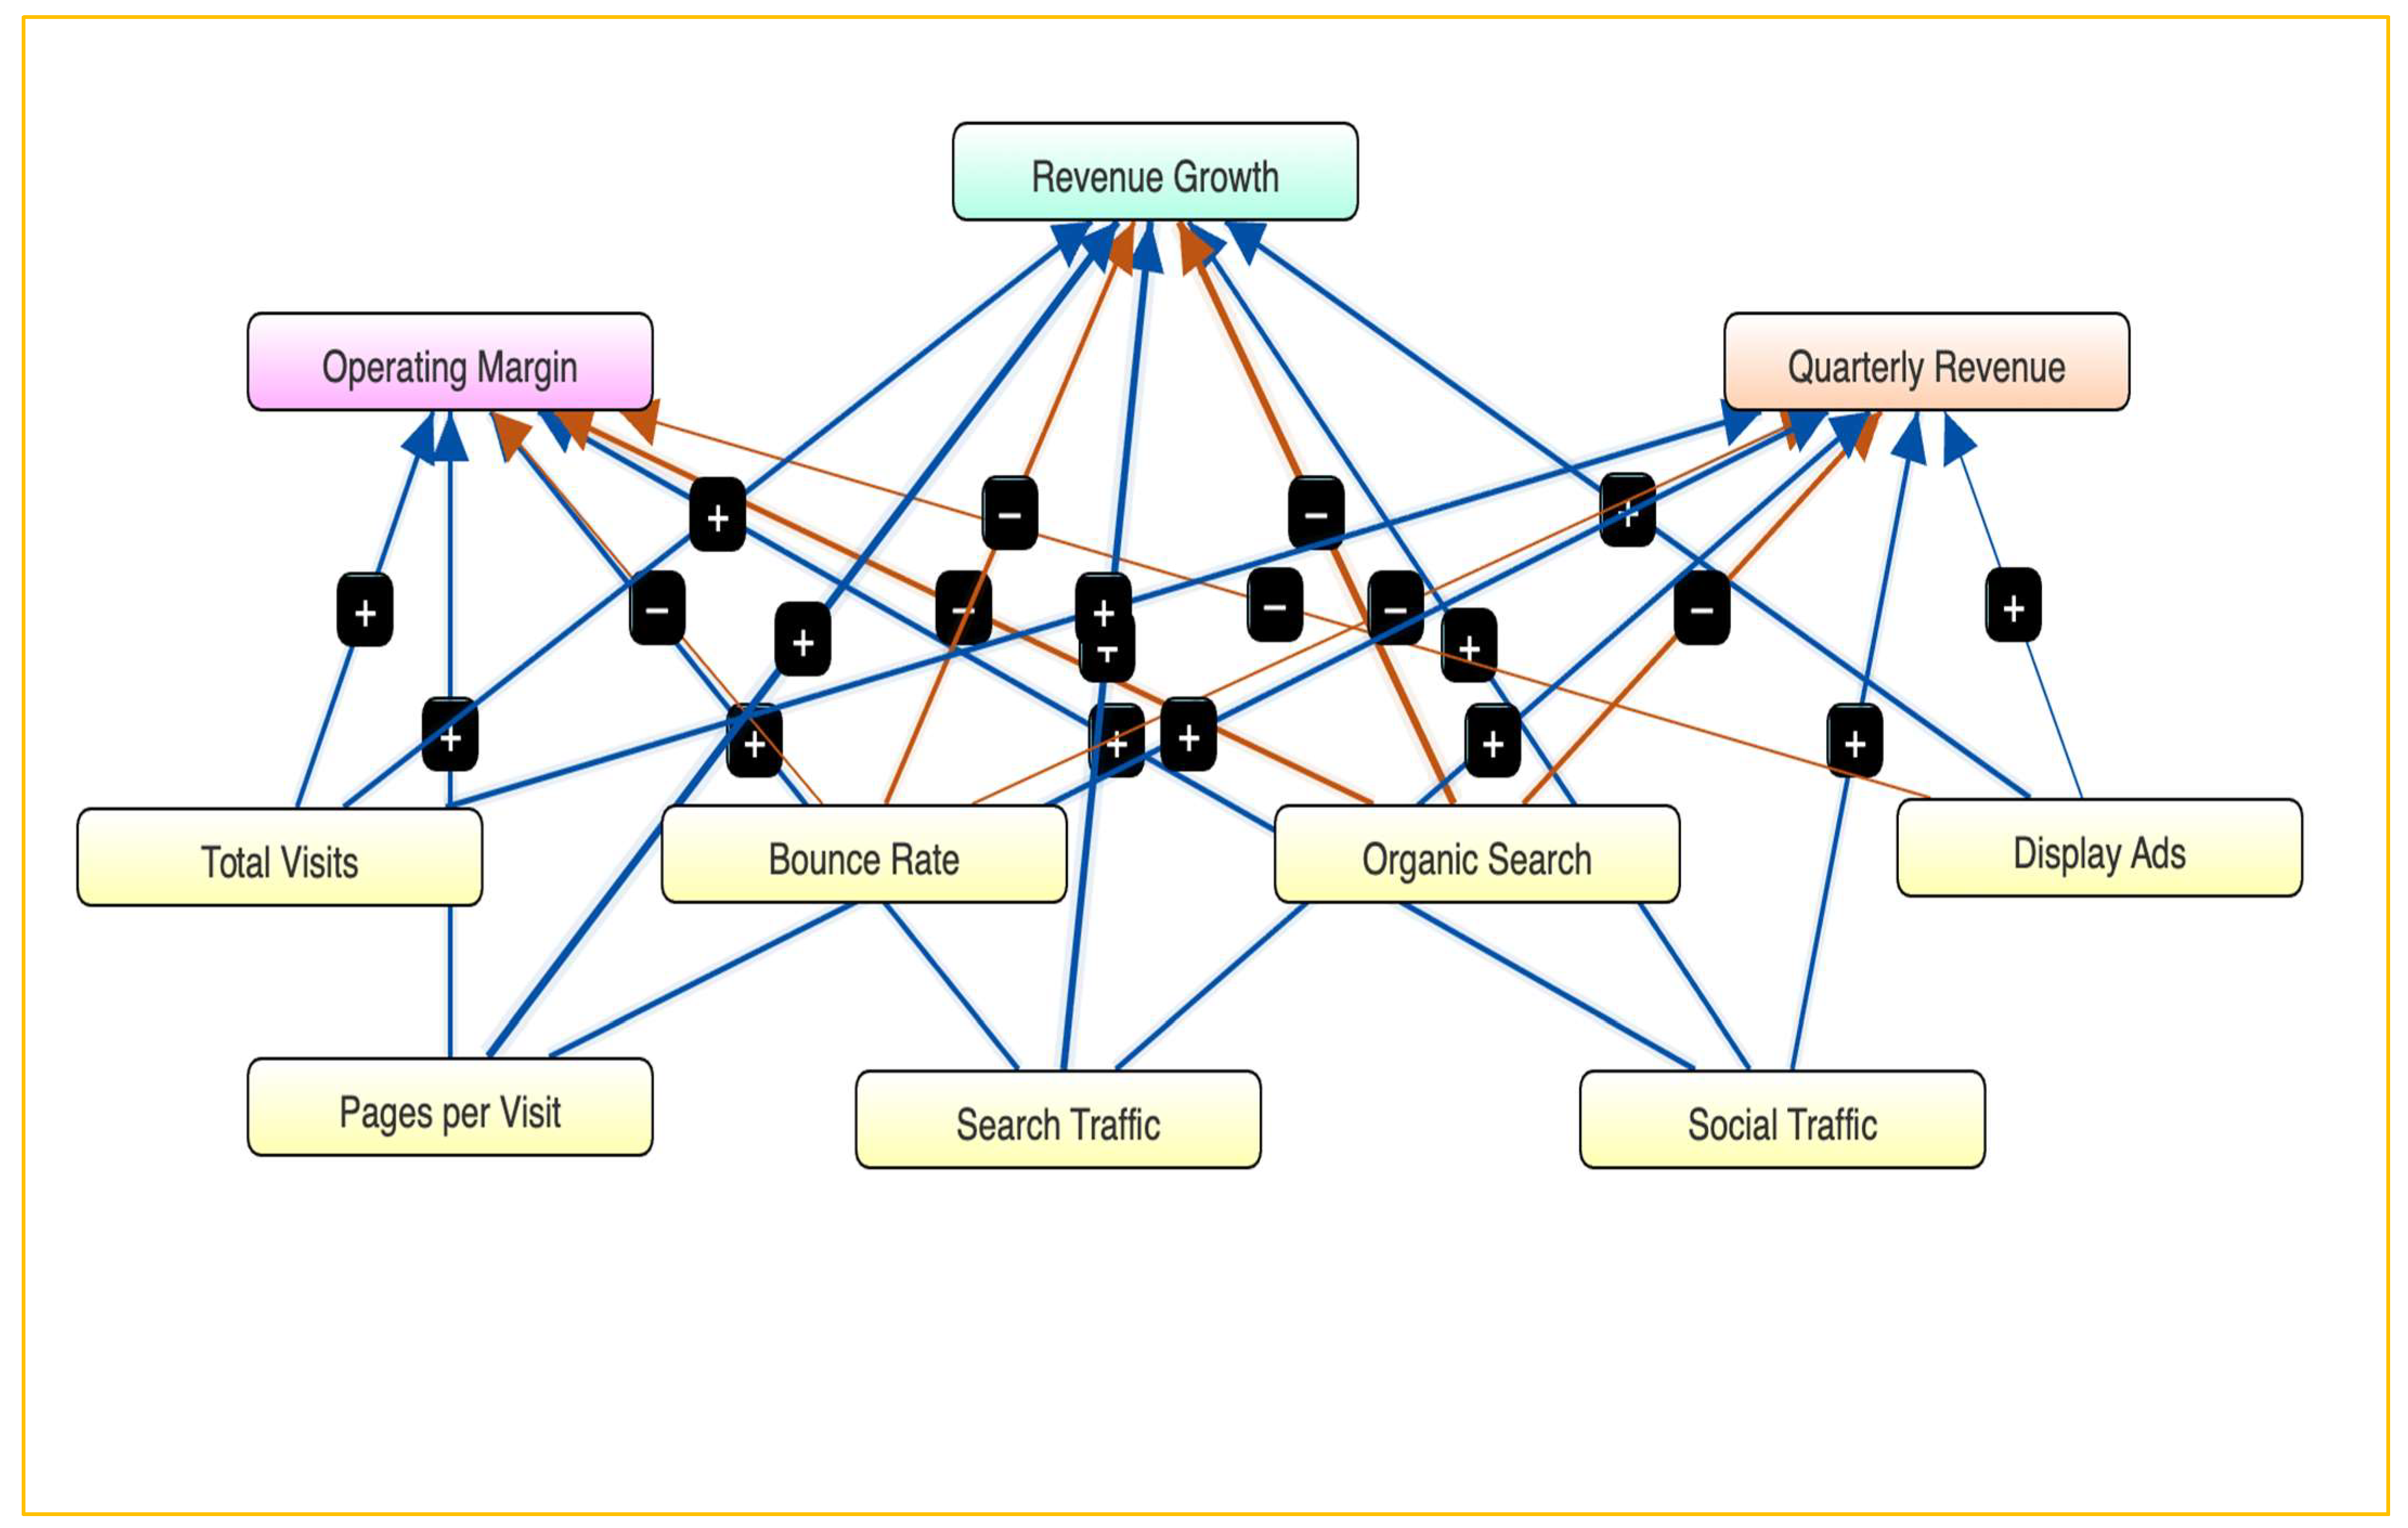
Fuzzy Cognitive Mapping (FCM) is increasingly employed as a methodological tool to model causal relationships among complex business drivers where interactions are nonlinear and subject to uncertainty (Stylios et al., 2020). By representing constructs as nodes and their causal influence as weighted edges, FCMs allow researchers to simulate the systemic impact of changes in one factor on the wider system (Bueno & Salmeron, 2008). In the present study, FCM was adopted to integrate digital marketing indicators (traffic shares, engagement variables) with financial performance metrics (revenue growth, operating margin, quarterly revenue), extending econometric results with scenario-based simulations. The model (Figure 5) represents both direct associations, such as paid search traffic on revenue growth, and indirect feedback loops, such as bounce rate reducing engagement and thus revenues. This hybridization of econometric analysis and cognitive mapping follows recent work applying FCMs to marketing, finance, and supply chain resilience (Carvalho et al., 2016; Giannakis & Papadopoulos, 2016).
The advantage of the FCM approach lies in its ability to capture the interdependencies that linear regression alone may not fully explain. By simulating policy interventions (e.g., a 25% increase in paid search or display share), managers can assess not only direct financial effects but also second-order dynamics mediated through engagement and brand visibility (Glykas, 2013). The methodological framework therefore provides a complementary decision-support lens for beverage supply chain actors.

Scenarios’ Development

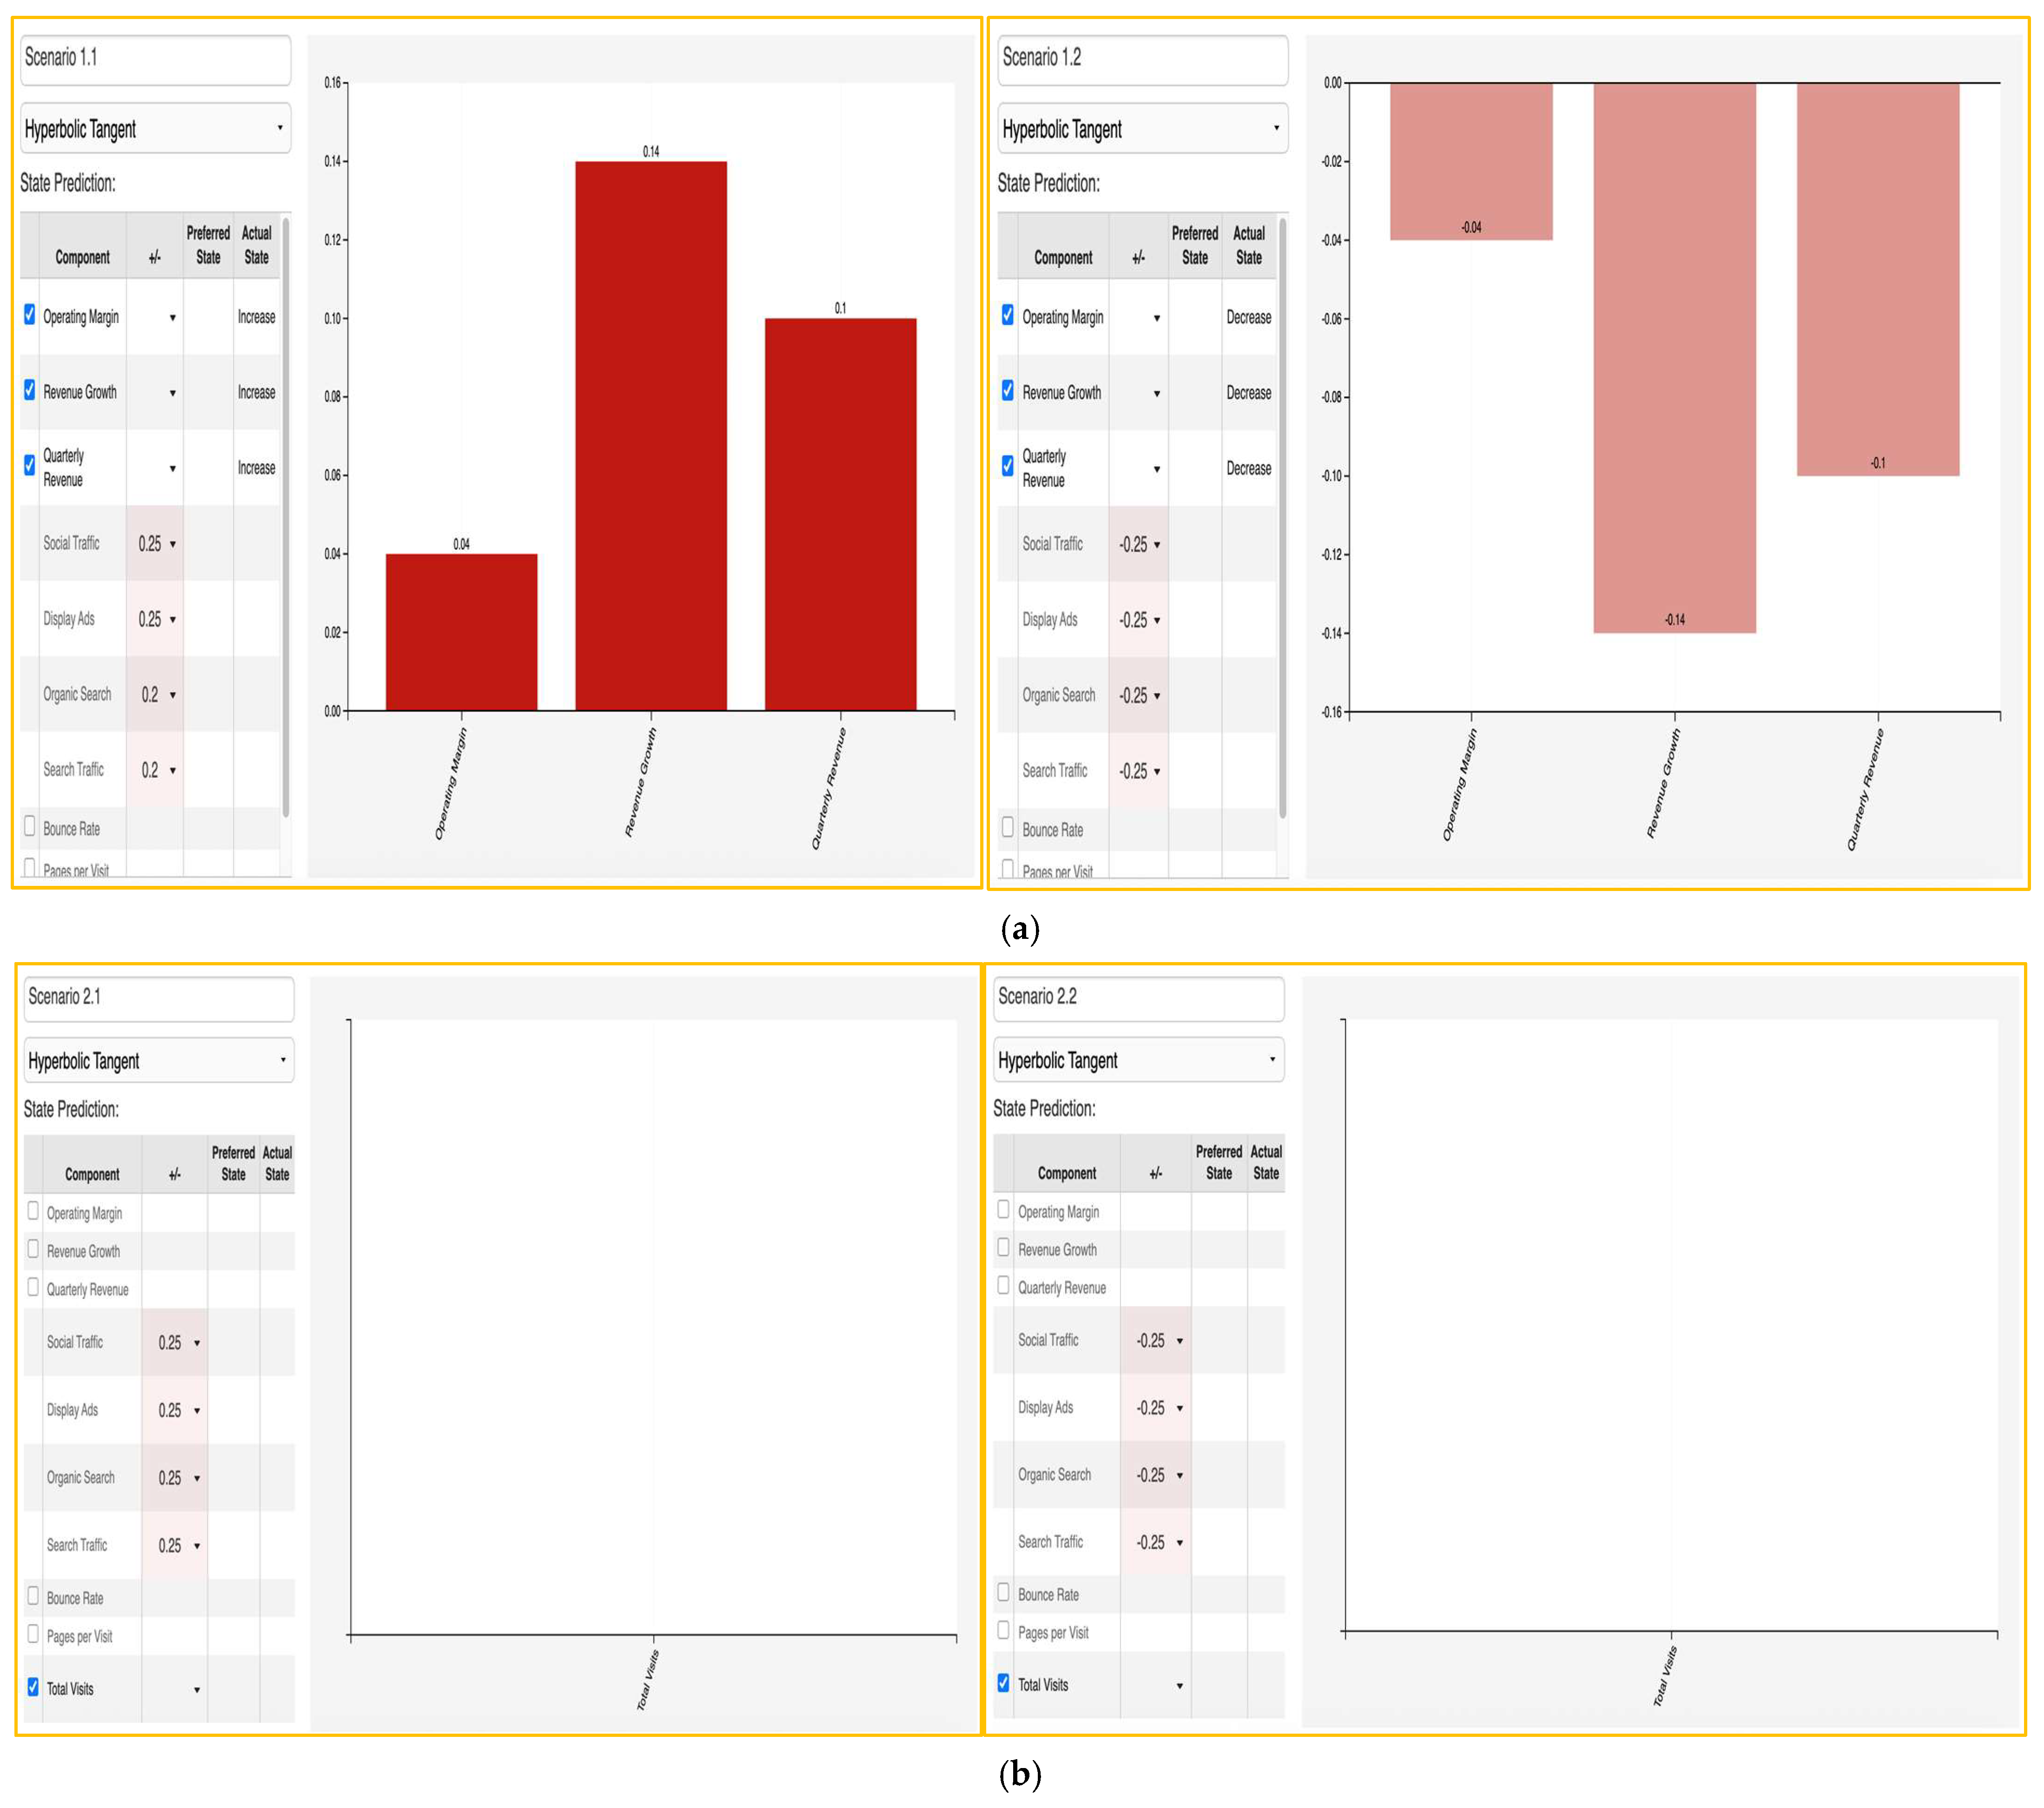
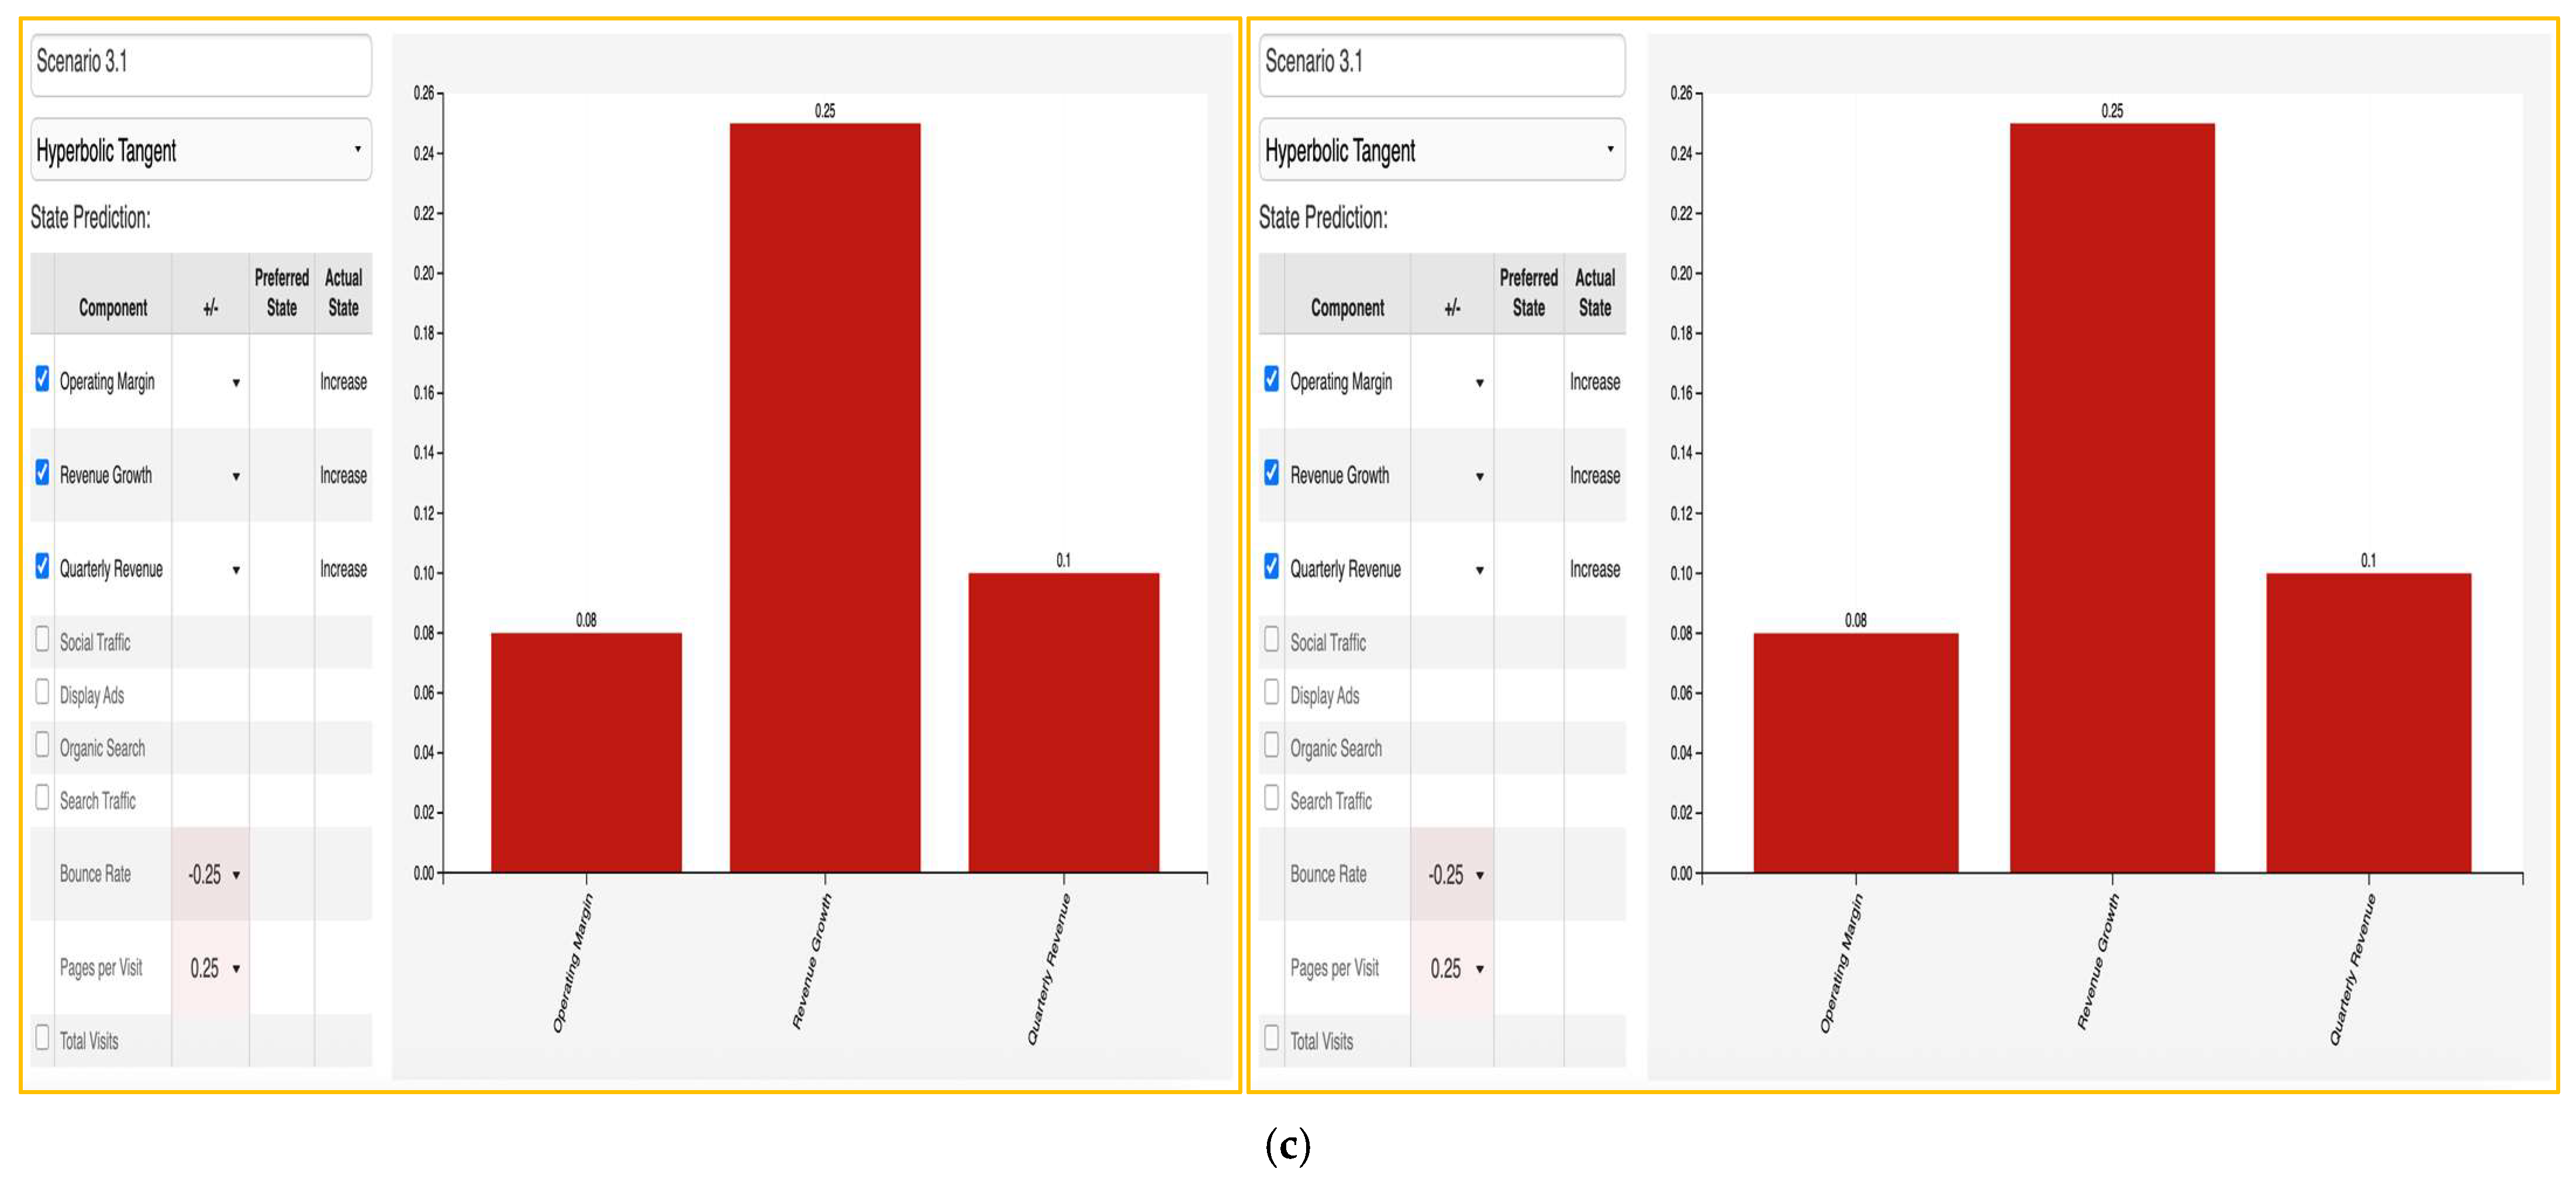
Three sets of scenarios were designed to explore the strategic sensitivity of financial performance to changes in digital marketing signals (Figure 6a–c).
Scenario 1: Shocks to Acquisition Channels
The first simulation assessed the effect of a 25% increase or decrease in social traffic, paid search traffic, display ads, and organic search traffic on revenues and operating margins. Results show that positive shocks in acquisition channels elevate revenue growth by up to +0.14 (Figure 6a), with paid search and social traffic yielding the most pronounced improvements. Conversely, reducing these signals leads to proportional declines, highlighting their asymmetric role in supporting short-term revenue momentum. These findings align with recent empirical studies showing that digital acquisition channels act as leading indicators of demand shifts, particularly in consumer-packaged goods.
Scenario 2: Shocks to Total Visits
The second set of simulations (Figure 6b) explored the effect of visit volume. Interestingly, shocks to total visits produced marginal system-level changes, confirming the econometric finding that raw traffic reflects brand scale rather than short-term performance dynamics. Even with ±25% changes, the impact on revenue or margin remained close to zero. This reinforces the managerial message that firms should not rely solely on scale metrics, but instead focus on quality indicators such as acquisition mix and engagement.
Scenario 3: Engagement Dynamics (Bounce Rate and Pages per Visit)
The third simulation (Figure 6c) tested the effect of engagement quality. A 25% decrease in bounce rate coupled with a 25% increase in pages per visit generated substantial improvements in both revenue growth (+0.25) and operating margin (+0.08). Conversely, a deterioration in engagement reduced revenue growth and margins sharply (−0.25 and −0.08, respectively). This demonstrates the leverage of engagement metrics as systemic amplifiers of financial performance—consistent with customer engagement theory, where deeper interactions predict higher loyalty and conversion.

3. Discussion

This section interprets the findings vis-à-vis the three research questions (RQ1–RQ3), anchors them within the broader literature, and incorporates both statistical outcomes and dynamic insights from the FCM scenarios. The discussion provides a nuanced understanding of how digital signals interact with brand structures and engagement dynamics in the beverage supply chain context.
RQ1.
To what extent do digital marketing signals—such as paid search traffic, organic search, social referrals, and display advertising—function as leading indicators of short-term revenue growth in beverage supply chain firms?
Correlation analysis revealed that digital marketing signals are meaningful predictors of short-term revenue dynamics. Specifically, paid search traffic share (r = 0.62, p < 0.05) and pages per visit (r = 0.55, p < 0.05) were positively associated with revenue growth, while organic search share (r = −0.59, p < 0.05) and bounce rate (r = −0.48, p < 0.05) exhibited negative associations. These patterns indicate that firms leveraging paid search channels and generating more engaged site visits tend to experience stronger short-term revenue growth, whereas passive or exclusively organic visibility may signal weaker momentum.
These results align with contemporary research indicating that digital acquisition channels, particularly paid search, act as early indicators of shifting consumer demand (van Ewijk et al., 2021). France et al. (2021) showed that web-based attention metrics like Google Trends can anticipate product category demand. Liadeli et al. (2023) underscore the synergistic effect of owned and paid digital media in driving engagement and conversions.
Our FCM scenario simulations extended these findings. In Scenario 1.1, a 25% uplift in acquisition signals (search, display, social, organic) yielded a tangible increase in revenue growth (+0.14) and quarterly revenue (+0.10), demonstrating the capacity of digital activation to influence financial trajectories. Conversely, Scenario 1.2 (–25% shock) led to reciprocal declines. These systemic dynamics affirm that digital signals possess strategic foresight potential—but their impact hinges on cohesive and multi-channel activation rather than isolated shifts.
RQ2.
How does brand heterogeneity influence the relationship between digital visibility and financial outcomes, and why do fixed brand effects outweigh within-month variations in digital acquisition channels?
Our fixed-effects panel model revealed that brand heterogeneity is the dominant driver of web traffic variation: brand dummies captured nearly all of the 96% explained variance in log-visits, while none of the digital channel variables remained significant. Only Red Bull exhibited a meaningful baseline lift compared to the reference brand.
ANOVA results underscored this dominance—94% of variance in paid search reliance was attributable to brand differences. This strongly indicates that structural elements such as long-term brand equity, distributor footprint, and organizational digital infrastructure overshadow tactical month-to-month adjustments.
These insights echo emerging brand equity scholarship. Bei and Gielens (2023) explicate how enduring brand positioning shapes consumer response trajectories, while Guhl (2024) highlights the persistence of brand equity even amid intense marketing dynamism. In this context, global beverage brands maintain entrenched presence that buffers them against transient digital fluctuations.
Interestingly, the FCM logic reinforces this structural anchoring. Scenario 2.1, where key digital signals varied by ±25%, generated minimal outcome divergence in visits and revenues—highlighting the stabilizing effect of brand-level baselines. Digital signals thus act as tactical levers within a broader brand gravity field.
RQ3.
What role do user engagement metrics (pages per visit and bounce rates) play in predicting financial performance, compared to overall traffic volume and acquisition channel shares?
Engagement metrics stood out as robust predictors: pages per visit correlated significantly with revenue growth (r = 0.55), and bounce rate negatively so (r = −0.48). Total visits, by contrast, had no significant correlation with revenue or margins, signifying that raw traffic volume is an insufficient indicator of performance quality.
This pattern aligns with evolving customer engagement theory. Deep interactions—indicative of attention, consideration, and perhaps intent—outperform sheer exposure in forecasting conversion, loyalty, and LTV (Lim & Rasul, 2022; Srivastava et al., 2025). Case evidence reinforces the importance of engagement depth: Conductor (2025) and Google Analytics (2025) show that better session experiences lower bounce rates and boost conversions.
The FCM scenarios magnified this effect: Scenario 3.1, modeling a 25% improvement in engagement (higher pages per visit, lower bounce), produced the most substantial boost in revenue growth (+0.25), alongside positive margin improvements. In contrast, Scenario 3.2 (deteriorated engagement) triggered steep performance declines. These dynamic insights highlight engagement metrics not only as predictive correlates but also as powerful levers capable of influencing outcomes when proactively managed.
Collectively, the findings affirm that:
  • Digital marketing signals—especially paid search share and engagement depth—are credible short-term growth indicators (RQ1).
  • Brand heterogeneity remains the most potent structural driver, overshadowing tactical shifts (RQ2).
  • Engagement quality, more than traffic volume, is a key lever of performance (RQ3).
By combining statistical and FCM approaches, the study achieves both empirical precision and strategic foresight. Linear models quantify relationships, while FCM captures system-wide dynamics and scenario outcomes, offering managers proactive planning capabilities.
Notably, emerging trends around AI-driven personalization, technographic segmentation, and interactive content reinforce the importance of engagement. AI personalization enhances relevance and engagement and advanced personalization has been linked to deeper interactions and better conversion rates. The shift toward message-based and social commerce models also underscores the rising priority of seamless engagement channels (Techradar, 2025). These evolving trends align with our findings on the primacy of engagement metrics.

4. Materials and Methods

4.1. Data Collection and Sources

The empirical analysis in this study relies on a combined dataset of digital marketing signals and financial performance indicators for leading firms in the global beverage supply chain. Web analytics were collected using the platform of Semrush. Analytics, a widely applied web intelligence platform that provides standardized measures of website traffic, acquisition channels, and engagement behaviors (Chaffey et al., 2019; Ozlem, 2018). Data were extracted for five multinational beverage companies, Coca-Cola, PepsiCo, Dr Pepper, Monster, and Red Bull, which together represent the dominant actors in the carbonated soft drinks and energy drinks segments (Giannakopoulos, 2025).
The web analytics dataset covered the five-month period from May to September 2023, ensuring comparability across brands during the same timeframe. These indicators were selected because they reflect both visibility (traffic acquisition channels) and engagement (interaction quality), which are increasingly viewed as proxies for brand equity and consumer attention in digital environments (Backaler, 2018; Sanders, 2025).
Financial data were drawn from the quarterly reports of the selected companies (Q3–Q4 2023), complemented by audited 10-Q and earnings call presentations available via company investor relations portals and Bloomberg terminals. The variables included Quarterly Revenue (USD bn), Year-on-Year Revenue Growth (%), and Operating Margin (%), which represent standard indicators of financial performance and supply chain efficiency (Bowersox et al., 2020; Christopher, 2016).

4.2. Methodological Approach

The empirical analysis followed four sequential stages. First, descriptive statistics were computed to summarize central tendencies and dispersion across both financial and digital marketing variables. This stage provided sector-level benchmarks and enabled contextual comparison of firm-level website traffic, engagement, and revenue outcomes.
Second, correlation analyses were conducted. Pearson correlation coefficients measured linear associations among web metrics (e.g., substitution patterns between paid and organic search traffic) and between web metrics and financial outcomes. Statistical significance thresholds at the 95% and 99% levels were applied to identify which digital signals exhibited meaningful predictive potential for short-term revenue growth.
Third, group differences in acquisition-channel reliance were examined using Analysis of Variance (ANOVA) and Tukey’s HSD post hoc tests. ANOVA quantified the share of variance attributable to between-firm heterogeneity, while Tukey’s HSD identified the specific firm pairs exhibiting statistically significant differences (Hair et al., 2019).
Fourth, a two-way fixed-effects panel regression was estimated to assess the determinants of log-transformed website visits. This specification controlled for both brand-specific and time-specific heterogeneity. Robust HC1 standard errors were employed to account for heteroskedasticity. Such models are widely used in panel econometrics to isolate explanatory contributions of predictors while addressing unobserved heterogeneity (Wooldridge, 2010).
Finally, to complement the econometric analysis, a Fuzzy Cognitive Mapping (FCM) framework was applied. FCM enabled simulation of nonlinear interdependencies among digital and financial variables and the exploration of scenario-based outcomes, thereby extending traditional regression results with dynamic system-level insights.

4.3. Justification of Methods

The mixed-methods quantitative design was selected to enable a multi-layered assessment. Specifically: (1) descriptive statistics established sector-wide benchmarks, (2) correlation analysis identified potential leading indicators of financial performance, (3) ANOVA revealed strategic heterogeneity across beverage firms, (4) regression analysis isolated the explanatory contribution of web analytics while controlling for brand and temporal effects, and (5) FCM modeling simulated alternative scenarios to capture nonlinear dynamics.
This integration of digital analytics with financial econometrics aligns with recent calls for embedding alternative data into corporate finance and supply chain research (Ackermann, 2012; Mangan & Lalwani, 2016). The inclusion of FCM strengthens the methodological framework by enabling exploration of interdependencies and causal dynamics that extend beyond linear modeling approaches. The full methodological framework is summarized in Figure 5, Section 2.5.
Our two-way fixed-effects specification with HAC/Driscoll–Kraay corrections follows finance best practice for short panels with cross-sectional and temporal dependence. Finance studies emphasize correct panel standard errors (e.g., clustering and dependence-robust covariance) to avoid overstated significance; our inference is robust under these alternatives (Petersen, 2009). We also benchmark against HAC estimators widely used in asset pricing and corporate finance (Newey & West, 1987), and report predictive comparisons consistent with finance standards for forecast accuracy. These choices align the paper’s empirical design with established finance-journal conventions.

5. Conclusions

5.1. Theoretical Implications

The findings of this study contribute significantly to the intersection of digital marketing, finance, and supply chain research by demonstrating that web-analytics variables—specifically acquisition-mix shares and engagement metrics—carry predictive value for financial performance in the short term. This provides a theoretical bridge between marketing science, which has long emphasized the importance of consumer attention and engagement, and financial economics, where the search for leading indicators of firm performance has expanded to include digital exhaust and alternative datasets (Mitra et al., 2023). By linking digital visibility directly to revenue growth in the beverage supply chain, the study helps advance an alternative-data paradigm that views online behavioral signals as economically meaningful at the firm level. This complements macroeconomic research that has validated the use of Google Trends and web traffic as predictors of aggregate demand (Woloszko, 2024), and extends it into the microeconomic and organizational domain of branded fast-moving consumer goods.
A second theoretical contribution lies in refining customer-engagement theory. Traditional models of the hierarchy of effects in advertising and consumer behavior have emphasized sequential stages of exposure, attention, interest, and action. Our findings suggest that digital engagement metrics, such as pages per visit and bounce rates, act as critical intermediate outcomes that mediate the path from exposure to sales. The positive association of pages per visit with revenue growth and the negative association of bounce rate with financial performance confirm that digital environments require depth of interaction to translate impressions into transactions. This supports emerging scholarship that positions engagement not only as a marketing outcome but also as a strategic intangible asset influencing firm value (Krowinska & Dineva, 2025; Hollebeek & Macky, 2019). The implication is that theoretical frameworks should shift from volume-based logics of attention toward quality-based logics of interaction, particularly in consumer categories where habit and brand salience play dominant roles.
Third, the evidence that brand fixed effects dominate acquisition-mix variation underscores the theoretical centrality of brand heterogeneity in shaping digital performance. While much of the digital marketing literature has highlighted the tactical flexibility of firms to optimize paid search, display, and social channels, our results show that persistent structural factors—such as brand equity, distribution reach, and long-term positioning—explain the bulk of observed traffic differences. This resonates with research that conceptualizes brand equity as a slow-moving capability stock that anchors consumer attention and competitive advantage, even in the presence of rapid digital tactical shifts (Cheng & Hou, 2024; Guhl, 2024). From a theoretical standpoint, this suggests a two-layer model of digital-firm outcomes: a structural layer defined by brand constants, and a tactical layer represented by short-term channel reallocations. Econometric models that fail to account for fixed brand effects risk conflating tactical noise with strategic baseline factors.
The inclusion of Fuzzy Cognitive Mapping (FCM) adds another theoretical dimension by showing how causal feedback structures among digital signals and financial outcomes can be visualized and simulated. Unlike static regression results, FCM scenarios demonstrated how increases or decreases in paid search, display, and engagement signals propagate through the system, altering revenue growth, margins, and quarterly outcomes. This systemic perspective strengthens theoretical debates around interdependencies and reinforces the need to conceptualize digital signals as part of dynamic ecosystems rather than isolated predictors.
Moreover, the study contributes to the literature on supply chain finance and digital transformation. Prior research has emphasized that digital technologies enable supply chain partners to share information in real time, reducing the bullwhip effect and enabling better financing terms (X. Li et al., 2023; Zhou et al., 2022). Our findings add a financial dimension: digital visibility can serve as a proxy for demand momentum, providing upstream suppliers and financiers with early-warning signals of shifts in consumer interest. This extends the theory of supply chain finance by embedding digital marketing signals as a demand-sensing mechanism within financial arrangements. For example, higher paid search traffic shares and stronger engagement could inform credit terms or inventory financing decisions by signaling future revenue trajectories.
Finally, there are methodological implications for theory development. By applying two-way fixed-effects regression, we demonstrate how econometric models can separate structural brand effects from temporal variation. By combining these regressions with FCM modeling, the study illustrates how quantitative econometrics and cognitive simulation complement each other: regressions isolate statistical associations, while FCM highlights causal structures and scenario-based dynamics. The implication is that digital marketing theory must grapple with both static and dynamic perspectives to fully understand how digital signals interact with financial performance.

5.2. Practical and Managerial Implications

Beyond theoretical advances, the findings carry significant practical and managerial implications for firms in the beverage supply chain, their upstream and downstream partners, and external stakeholders such as investors and analysts. These implications span marketing management, supply chain operations, and financial forecasting.
From a marketing management perspective, the results underscore the importance of treating digital engagement as a leading indicator of sales performance. Managers should not only monitor the volume of website traffic but also track pages per visit and bounce rates as key metrics of consumer intent. Engagement-focused strategies—ranging from personalized landing pages to improved navigation and omnichannel integration—will enhance depth of interaction and increase conversion probabilities (Hollebeek & Macky, 2019). The FCM scenarios further illustrate that improvements in engagement (higher pages per visit, lower bounce rates) yield the strongest boosts to revenue growth and operating margin, reinforcing the case for prioritizing engagement quality.
A second managerial implication concerns acquisition-mix strategy. While paid search traffic is positively correlated with revenue growth, fixed-effects results showed that structural brand equity dominates. Managers should therefore treat acquisition channels as tactical amplifiers rather than standalone drivers. Paid search and display campaigns may yield short-term boosts, but their impact is maximized when layered onto strong brand equity and distribution networks. The FCM simulations validated this interaction: scenarios where acquisition channels improved in isolation showed smaller impacts compared to engagement-driven scenarios, underscoring the complementary role of tactical and structural assets.
From a supply chain operations standpoint, the study suggests that digital signals can enhance demand sensing and S&OP processes. Monitoring real-time fluctuations in search intensity and engagement allows supply chain planners to adjust production schedules, logistics, and inventory dynamically. For example, a spike in paid search traffic and engagement depth may indicate imminent sales surges, prompting pre-emptive production scaling. Conversely, rising bounce rates may signal weak campaign conversion, warning against inventory overcommitment. The FCM scenarios confirmed these dynamics by simulating both positive and negative shocks to acquisition and engagement, highlighting their potential role as early-warning mechanisms within supply chain planning systems (Jing & Fan, 2024).
For investors and analysts, the evidence suggests that web-analytics variables can serve as alternative data inputs in short-term earnings forecasts and valuation models (Mitra et al., 2023; Nyakurukwa & Seetharam, 2024). Since digital signals correlated with quarterly revenue growth, incorporating them into forecasting pipelines could help anticipate earnings surprises. The predictive simulations from the FCM framework further demonstrate how variations in digital signals cascade into financial performance, offering analysts richer scenario-based forecasts.
At a strategic level, the findings highlight the need to align digital transformation with brand equity investments. Tactical adjustments to digital channels cannot substitute for long-term brand building, distributional breadth, and consumer loyalty. However, when tactical signals such as paid search and display are integrated with engagement-focused initiatives, their effectiveness increases. Thus, managers should embed digital signals within broader frameworks that balance tactical agility with structural brand equity.
Finally, FCM modeling provides managers with a practical simulation tool. By testing hypothetical changes—such as a 25% rise in paid search or display traffic, or a deterioration in engagement—firms can anticipate system-wide consequences before committing resources. This scenario-based planning capability represents a novel managerial contribution, equipping decision-makers with a dynamic tool for balancing marketing investments, supply chain coordination, and financial forecasting.

5.3. Limitations

This study provides new insights but faces several limitations. The first is the relatively short temporal scope: five months of panel data restrict the ability to capture lagged effects, seasonal patterns, or structural shifts in beverage demand (Akkas et al., 2019). Although this horizon allows for timely analysis of short-term dynamics, future research should extend the dataset to 12–24 months to enhance temporal robustness and provide a more comprehensive picture of long-term digital–financial interactions. Second, reliance on third-party web analytics introduces measurement inconsistencies, as comparative studies show differences in visit, bounce, and traffic estimates across providers (Jansen et al., 2022). Although this was mitigated by focusing on shares and within-brand variation, measurement error remains a constraint. Third, the models do not explicitly control for advertising expenditure, campaign creativity, or sentiment factors, which are known to influence sales (van Berlo et al., 2024; Nyakurukwa & Seetharam, 2024). Finally, the focus on large global brands limits generalizability to smaller or regional firms. While FCM modeling helps compensate by simulating broader causal dynamics, the findings should be interpreted as indicative rather than universally generalizable.

5.4. Future Research Directions

Future studies should extend datasets across longer horizons and more diverse brand samples to capture persistence and lag effects (Arellano & Bond, 1991; Baltagi, 2008). Combining web analytics with advertising spend, sentiment analysis, and campaign quality would help disentangle organic consumer interest from marketing-driven demand (van Ewijk et al., 2021; Srivastava et al., 2025). FCM modeling should be further developed to test nonlinearities and interactions, enabling richer scenario analyses than regression alone. Expanding the scope beyond brand owners to include bottlers, distributors, and retailers could reveal how digital signals propagate across the value chain (Zhou et al., 2022; X. Li et al., 2023). Finally, methodological innovation—such as hybrid econometric–machine learning models—offers promise for capturing the dynamic interplay between digital signals and financial outcomes (Mitra et al., 2023).

Author Contributions

Conceptualization, N.T.G., D.P.S., K.T. and P.K.; methodology, N.T.G., D.P.S., K.T. and P.K.; software, N.T.G., D.P.S., K.T. and P.K.; validation, N.T.G., D.P.S., K.T. and P.K.; formal analysis, N.T.G., D.P.S., K.T. and P.K.; investigation, N.T.G., D.P.S., K.T. and P.K.; resources, N.T.G., D.P.S., K.T. and P.K.; data curation, N.T.G., D.P.S., K.T. and P.K.; writing—original draft preparation, N.T.G., D.P.S., K.T. and P.K.; writing—review and editing, N.T.G., D.P.S., K.T. and P.K.; visualization, N.T.G., D.P.S., K.T. and P.K.; supervision, N.T.G., D.P.S., K.T. and P.K.; project administration, N.T.G., D.P.S., K.T. and P.K.; funding acquisition, N.T.G., D.P.S., K.T. and P.K. All authors have read and agreed to the published version of the manuscript.

Funding

This research received no external funding.

Institutional Review Board Statement

Not applicable.

Informed Consent Statement

Not applicable.

Data Availability Statement

The original contributions presented in this study are included in the article. Further inquiries can be directed to the corresponding author.

Conflicts of Interest

The authors declare no conflicts of interest.

References

  1. Ackermann, T. (2012). IT Security risk management: Perceived it security risks in the context of cloud computing. Springer Science & Business Media. [Google Scholar]
  2. Akkas, A., Gaur, V., & Simchi-Levi, D. (2019). Drivers of product expiration in consumer packaged goods retailing. Management Science, 65(5), 2179–2195. [Google Scholar] [CrossRef]
  3. Al-Hadi, A., & Al-Abri, A. (2022). Firm-level trade credit responses to COVID-19-induced monetary and fiscal policies: International evidence. Research in International Business and Finance, 60, 101568. [Google Scholar] [CrossRef]
  4. Arellano, M., & Bond, S. (1991). Some tests of specification for panel data: Monte Carlo evidence and an application to employment equations. Review of Economic Studies, 58(2), 277–297. [Google Scholar] [CrossRef]
  5. Ayala, M. J., Gonzálvez-Gallego, N., & Arteaga-Sánchez, R. (2024). Google search volume index and investor attention in stock market: A systematic review. Financial Innovation, 10(1), 70. [Google Scholar] [CrossRef]
  6. Backaler, J. (2018). Digital influence. Unleash the power of influencer marketing to accelerate your global business e-book. Palgrave. [Google Scholar]
  7. Baltagi, B. H. (2008). Econometric analysis of panel data. John Wiley & Sons Inc. [Google Scholar]
  8. Bei, Z., & Gielens, K. (2023). The one-party versus third-party platform conundrum: How can brands thrive? Journal of Marketing, 87(2), 253–274. [Google Scholar] [CrossRef]
  9. Bowersox, D. J., Closs, D. J., Cooper, M. B., & Bowersox, J. C. (2020). Supply chain logistics management. McGraw-Hill Education. [Google Scholar]
  10. Bueno, S., & Salmeron, J. L. (2008). Fuzzy modeling enterprise resource planning tool selection. Computer Standards & Interfaces, 30(3), 137–147. [Google Scholar] [CrossRef]
  11. Carvalho, J. V., Rocha, Á., & Abreu, A. (2016). Maturity models of healthcare information systems and technologies: A literature review. Journal of Medical Systems, 40(6), 131. [Google Scholar] [CrossRef]
  12. Chaffey, D., Hemphill, T., & Edmundson-Bird, D. (2019). Digital business and e-commerce management. Pearson. [Google Scholar]
  13. Cheng, B., & Hou, S. (2024). Brand equity and financial performance: An institutional view. Marketing Intelligence & Planning, 42(8), 1433–1463. [Google Scholar] [CrossRef]
  14. Chi, F., Hwang, B. H., & Zheng, Y. (2025). The use and usefulness of big data in finance: Evidence from financial analysts. Management Science, 71(6), 4599–4621. [Google Scholar] [CrossRef]
  15. Christopher, M. (2016). Logistics and supply chain management: Logistics & supply chain management. Pearson. [Google Scholar]
  16. Conductor. (2025). Page speed matters: 10 case studies show why. Available online: https://www.conductor.com/academy/page-speed-resources/ (accessed on 28 August 2025).
  17. Coroneo, L., & Iacone, F. (2025). Testing for equal predictive accuracy with strong dependence. International Journal of Forecasting, 41(3), 1073–1092. [Google Scholar] [CrossRef]
  18. Costola, M., Hinz, O., Nofer, M., & Pelizzon, L. (2023). Machine learning sentiment analysis, COVID-19 news and stock market reactions. Research in International Business and Finance, 64, 101881. [Google Scholar] [CrossRef] [PubMed]
  19. Dataiku. (2023). Predicting GDP with Google trends: The OECD weekly tracker. Available online: https://blog.dataiku.com/predicting-gdp-google-trends (accessed on 28 August 2025).
  20. Dessaint, O., Foucault, T., & Frésard, L. (2024). Does alternative data improve financial forecasting? the horizon effect. The Journal of Finance, 79(3), 2237–2287. [Google Scholar] [CrossRef]
  21. Diebold, F. X., & Mariano, R. S. (2002). Comparing predictive accuracy. Journal of Business & Economic Statistics, 20(1), 134–144. [Google Scholar] [CrossRef]
  22. Driscoll, J. C., & Kraay, A. C. (1998). Consistent covariance matrix estimation with spatially dependent panel data. Review of Economics and Statistics, 80(4), 549–560. [Google Scholar] [CrossRef]
  23. France, S. L., Shi, Y., & Kazandjian, B. (2021). Web trends: A valuable tool for business research. Journal of Business Research, 132, 666–679. [Google Scholar] [CrossRef]
  24. Giannakis, M., & Papadopoulos, T. (2016). Supply chain sustainability: A risk management approach. International Journal of Production Economics, 171, 455–470. [Google Scholar] [CrossRef]
  25. Giannakopoulos, N. T. (2025). Beverage industry supply chain finance and digital marketing. Available online: https://files.fm/u/5emnd45t7q (accessed on 6 September 2025).
  26. Glykas, M. (2013). Fuzzy cognitive strategic maps in business process performance measurement. Expert Systems with Applications, 40(1), 1–14. [Google Scholar] [CrossRef]
  27. Golovanova, E., & Zubarev, A. (2021). Forecasting aggregate retail sales with Google trends. Russian Journal of Money and Finance, 80(4), 50–73. [Google Scholar] [CrossRef]
  28. Google Analytics. (2025). Engagement rate and bounce rate (GA4). Available online: https://support.google.com/analytics/answer/12195621?hl=en (accessed on 28 August 2025).
  29. Gric, Z., Bajzík, J., & Badura, O. (2023). Does sentiment affect stock returns? A meta-analysis across survey-based measures. International Review of Financial Analysis, 89, 102773. [Google Scholar] [CrossRef]
  30. Guhl, D. (2024). Tracking time-varying brand equity using household panel data. Journal of Business Research, 182, 114799. [Google Scholar] [CrossRef]
  31. Hair, J. F., Black, W. C., Babin, B. J., Anderson, R. E., & Tatham, R. L. (2019). Multivariate data analysis. Cengage Learning. [Google Scholar]
  32. Heredia, J., Castillo-Vergara, M., Geldes, C., Gamarra, F. M. C., Flores, A., & Heredia, W. (2022). How do digital capabilities affect firm performance? The mediating role of technological capabilities in the “new normal”. Journal of Innovation & Knowledge, 7(2), 100171. [Google Scholar] [CrossRef]
  33. Hoechle, D. (2007). Robust standard errors for panel regressions with cross-sectional dependence. Stata Journal, 7(3), 281–312. [Google Scholar] [CrossRef]
  34. Hollebeek, L. D., & Macky, K. (2019). Digital content marketing’s role in fostering consumer engagement, trust, and value: Framework, fundamental propositions, and implications. Journal of Interactive Marketing, 45(1), 27–41. [Google Scholar] [CrossRef]
  35. Homburg, C., & Wielgos, D. M. (2022). The value relevance of digital marketing capabilities to firm performance. Journal of the Academy of Marketing Science, 50(4), 666–688. [Google Scholar] [CrossRef] [PubMed]
  36. Jansen, B. J., Jung, S. G., & Salminen, J. (2022). Measuring user interactions with websites: A comparison of two industry standard analytics approaches using data of 86 websites. PLoS ONE, 17(5), e0268212. [Google Scholar] [CrossRef] [PubMed]
  37. Jing, H., & Fan, Y. (2024). Digital transformation, supply chain integration and supply chain performance: Evidence from Chinese manufacturing listed firms. Sage Open, 14(3), 21582440241281616. [Google Scholar] [CrossRef]
  38. Johan, S., Kayani, U. N., Naeem, M. A., & Karim, S. (2024). How effective is the cash conversion cycle in improving firm performance? Evidence from BRICS. Emerging Markets Review, 59, 101114. [Google Scholar] [CrossRef]
  39. Jung, S.-U., & Shegai, V. (2023). The impact of digital marketing innovation on firm performance: Mediation by marketing capability and moderation by firm size. Sustainability, 15(7), 5711. [Google Scholar] [CrossRef]
  40. Krowinska, A., & Dineva, D. (2025). The role and forms of social media branded content driving active customer engagement behaviours. Journal of Marketing Management, 41(9–10), 1–31. [Google Scholar] [CrossRef]
  41. Kumar, V., & Gupta, S. (2016). Conceptualizing the evolution and future of advertising. Journal of Advertising, 45(3), 302–317. [Google Scholar] [CrossRef]
  42. Li, H., Fang, Y., Lim, K. H., & Wang, Y. (2019). Platform-based function repertoire, reputation, and sales performance of e-marketplace sellers. MIS Quarterly, 43(1), 207–236. Available online: https://www.jstor.org/stable/26847858 (accessed on 25 August 2025). [CrossRef]
  43. Li, X., Yan, J., Cheng, J., & Li, J. (2023). Supply-chain finance and investment efficiency: The perspective of sustainable development. Sustainability, 15(10), 7857. [Google Scholar] [CrossRef]
  44. Liadeli, G., Sotgiu, F., & Verlegh, P. W. (2023). A meta-analysis of the effects of brands’ owned social media on social media engagement and sales. Journal of Marketing, 87(3), 406–427. [Google Scholar] [CrossRef]
  45. Lim, W. M., & Rasul, T. (2022). Customer engagement and social media: Revisiting the past to inform the future. Journal of Business Research, 148, 325–342. [Google Scholar] [CrossRef]
  46. Mangan, J., & Lalwani, C. (2016). Global logistics and supply chain management. John Wiley & Sons. [Google Scholar]
  47. Mitra, G., Hoang, K. T., Gladilin, A., Chu, Y., Black, K., & Mani, G. (2023). Alternative data: Overview. In Handbook of alternative data in finance (Vol. I, pp. 1–28). Chapman and Hall/CRC. [Google Scholar]
  48. Newey, W. K., & West, K. D. (1987). Hypothesis testing with efficient method of moments estimation. International Economic Review, 28(3), 777–787. [Google Scholar] [CrossRef]
  49. Nyakurukwa, K., & Seetharam, Y. (2024). Sentimental showdown: News media vs. social media in stock markets. Heliyon, 10(9), e30211. [Google Scholar] [CrossRef] [PubMed]
  50. OWOX. (2021). Comparing accuracy: SEMrush vs. SimilarWeb. Available online: https://www.owox.com/blog/articles/semrush-vs-similarweb (accessed on 28 August 2025).
  51. Ozlem, B. (2018). E-business and supply chain integration: Strategies and case studies from industry. Kogan Page Publishers. [Google Scholar]
  52. Petersen, M. A. (2009). Estimating standard errors in finance panel data sets: Comparing approaches. The Review of Financial Studies, Society for Financial Studies, 22(1), 435–480. [Google Scholar] [CrossRef]
  53. Sanders, N. R. (2025). Supply Chain Management, with eBook access code: A global perspective. John Wiley & Sons. [Google Scholar]
  54. SimilarWeb. (2025). Data accuracy. Available online: https://support.similarweb.com/hc/en-us/articles/360002219177-Similarweb-s-Data-Accuracy#h_01HFKSA3MCE9MJVGB1ZEVVWTQB (accessed on 28 August 2025).
  55. Srivastava, R., Gupta, P., Kumar, H., & Tuli, N. (2025). Digital customer engagement: A systematic literature review and research agenda. Australian Journal of Management, 50(1), 220–245. [Google Scholar] [CrossRef]
  56. Strategy, &. (2025). Measuring brand equity with public and social media data. Available online: https://www.strategyand.pwc.com/lu/en/insights/brand-equity-with-public-and-social-media-data.html (accessed on 28 August 2025).
  57. Stylios, C. D., Bourgani, E., & Georgopoulos, V. C. (2020). Impact and applications of fuzzy cognitive map methodologies. In Beyond traditional probabilistic data processing techniques: Interval, fuzzy etc. methods and their applications (pp. 229–246). Springer International Publishing. [Google Scholar]
  58. Sun, Y., Liu, L., Xu, Y., Zeng, X., Shi, Y., Hu, H., Jiang, J., & Abraham, A. (2024). Alternative data in finance and business: Emerging applications and theory analysis. Financial Innovation, 10(1), 127. [Google Scholar] [CrossRef]
  59. Szczygielski, J. J., Charteris, A., Bwanya, P. R., & Brzeszczyński, J. (2024). Google search trends and stock markets: Sentiment, attention or uncertainty? International Review of Financial Analysis, 91, 102549. [Google Scholar] [CrossRef]
  60. Techradar. (2025). Affiliate marketing in 2025: Practical insights into the rise of alternative channels and the video-first revolution. Available online: https://www.techradar.com/pro/affiliate-marketing-in-2025-practical-insights-into-the-rise-of-alternative-channels-and-the-video-first-revolution?utm_source=chatgpt.com (accessed on 31 August 2025).
  61. Thinkbox. (2024). Profit ability 2: The new business case for advertising. Available online: https://www.thinkbox.tv/research/thinkbox-research/profit-ability-2-the-new-business-case-for-advertising (accessed on 28 August 2025).
  62. Trunfio, M., & Rossi, S. (2021). Conceptualising and measuring social media engagement: A systematic literature review. Italian Journal of Marketing, 2021(3), 267–292. [Google Scholar] [CrossRef]
  63. Tukey, J. W. (1949). Comparing individual means in the analysis of variance. Biometrics, 5(2), 99–114. [Google Scholar] [CrossRef] [PubMed]
  64. van Berlo, Z. M., Meijers, M. H., Eelen, J., Voorveld, H. A. M., & Eisend, M. (2024). When the medium is the message: A meta-analysis of creative media advertising effects. Journal of Advertising, 53(2), 278–295. [Google Scholar] [CrossRef]
  65. van Ewijk, B. J., Stubbe, A., Gijsbrechts, E., & Dekimpe, M. G. (2021). Online display advertising for CPG brands: (When) does it work? International Journal of Research in Marketing, 38(2), 271–289. [Google Scholar] [CrossRef]
  66. Wang, X., & Yu, J. (2023). COVID-19 pandemic and corporate liquidity: The role of SOEs’ trade credit response. Journal of International Money and Finance, 137, 102901. [Google Scholar] [CrossRef]
  67. Wedel, M., & Kannan, P. K. (2016). Marketing analytics for data-rich environments. Journal of Marketing, 80(6), 97–121. [Google Scholar] [CrossRef]
  68. Woloszko, N. (2020). Tracking activity in real time with Google trends. OECD Policy Paper, No. 29. Available online: https://www.oecd.org/en/publications/tracking-activity-in-real-time-with-google-trends_6b9c7518-en.html (accessed on 28 August 2025).
  69. Woloszko, N. (2024). Nowcasting with panels and alternative data: The OECD weekly tracker. International Journal of Forecasting, 40(4), 1302–1335. [Google Scholar] [CrossRef]
  70. Wooldridge, J. M. (2010). Econometric analysis of cross section and panel data. MIT Press. [Google Scholar]
  71. Zhou, L., Chen, M., & Lee, H. (2022). Supply chain finance: A research review and prospects based on a systematic literature analysis from a financial ecology perspective. Sustainability, 14(21), 14452. [Google Scholar] [CrossRef]
Figure 1. Mean Traffic Search share by Brand.
Ijfs 13 00189 g001
Figure 2. Digital Signals vs. Revenue Growth (Composite).
Ijfs 13 00189 g002
Figure 3. Digital Signals vs. Operating Margin (Composite).
Ijfs 13 00189 g003
Figure 4. Regression diagnostics: (top left) coefficient estimates with 95% CI; (top right) brand fixed effects relative to Coca-Cola (baseline); (bottom left) predicted vs. actual; (bottom right) residuals vs. fitted.
Ijfs 13 00189 g004
Figure 5. FCM Methodological Framework and Model.
Ijfs 13 00189 g005
Figure 6. FCM Scenarios. (a) depicts the impact of a 25% increase and decrease in selected digital marketing signals in revenues and operating margin, (b) depicts the impact of 25% increase and decrease in selected digital marketing signals in total visits, and (c) depicts the impact of a 25% enhancement and deterioration of bounce rate and pages per visit in revenues and operating margin.
Ijfs 13 00189 g006aIjfs 13 00189 g006b
Table 1. Descriptive statistics.
VariableMeanSDMinMax
Quarterly Revenue
(USD bn)
10.968.241.7323.45
Revenue Growth % YoY6.5%5.2%−0.5%14.4%
Operating Margin %15.2%4.3%11.0%21.0%
Total Visits5,313,240.008,175,383.823200.0023,000,000.00
Visitors3,240,952.004,959,969.581800.0014,200,000.00
Unique Visitors2,720,300.004,541,101.771400.0018,000,000.00
Pages per Visit3.101.282.085.81
Bounce Rate65.6418.0213.0597.31
Paid Search Traffic32.678.7116.6746.07
Organic Search Traffic52.8712.3133.0270.53
Social Traffic4.963.960.0216.16
Display Ads0.750.940.013.13
Table 2. Pearson correlation matrix among web analytic metrics.
VariableTotal
Visits
Pages per VisitBounce RateSearch
Traffic
Organic SearchSocial TrafficDisplay Ads
Total Visits1.00−0.370.380.010.070.280.08
Pages per Visit−0.371.00−0.090.51 *−0.52 *−0.110.65 *
Bounce Rate0.38−0.091.00−0.150.200.28−0.06
Paid Search Traffic0.010.51 *−0.151.00−0.88 **−0.57 *0.41
Organic Search Traffic0.07−0.52 *0.20−0.88 **1.000.27−0.37
Social Traffic0.28−0.110.28−0.57 *0.271.00−0.17
Display Ads0.080.65 *−0.060.41−0.37−0.171.00
*, ** Indicate statistical significance at the 95% and 99% levels of significance accordingly.
Table 3. Pearson correlation matrix among web analytics and financial results.
VariableRevenue GrowthOperating MarginQuarterly Revenue
Total Visits0.290.210.44 *
Pages per Visit0.55 *0.230.27
Bounce Rate %−0.48 *−0.11−0.13
Paid Search Traffic %0.62 *0.280.31
Organic Search Traffic %−0.59 *−0.22−0.19
Social Traffic %0.340.170.21
Display Ads %0.18−0.050.09
* Indicates statistical significance at the 95% level of significance.
Table 4. One-way ANOVA results for Paid Search Traffic% across brands.
SourcedfFp-Valueη2
Between brands478.19<0.0010.94
Within (error)20
Table 5. Tukey HSD pairwise comparisons of Paid Search% by brand.
Group1Group2Mean_Diffp-AdjLowerUpperReject
Coca-ColaDrPepper23.4560.019.030427.8816True
Coca-ColaMonster10.5340.06.108414.9596True
Coca-ColaPepsiCo20.7080.016.282425.1336True
Coca-ColaRedBull13.8740.09.448418.2996True
DrPepperMonster−12.9220.0−17.3476−8.4964True
DrPepperPepsiCo−2.7480.3703−7.17361.6776False
DrPepperRedBull−9.5820.0−14.0076−5.1564True
MonsterPepsiCo10.1740.05.748414.5996True
MonsterRedBull3.340.1996−1.08567.7656False
PepsiCoRedBull−6.8340.0014−11.2596−2.4084True
Table 6. Two-way fixed-effects regression results (dependent variable: ln(Total Visits)).
IndexCoef.Std.Err.zp > |z|[0.0250.975]
Intercept17.2873.2425.3309.770 × 10−810.93123.642
C(brand)
[T.DrPepper]
3.5464.8720.7270.466−6.00313.096
C(brand)
[T.Monster]
−1.5402.316−0.6650.506−6.0792.999
C(brand)
[T.PepsiCo]
4.3493.5711.2170.223−2.65111.349
C(brand)
[T.RedBull]
5.0672.1492.3570.018 *0.8539.280
C(month_str)
[T.2023-06]
−0.2800.466−0.6010.547−1.1940.633
C(month_str)
[T.2023-07]
−0.0830.522−0.1590.872−1.1070.939
C(month_str)
[T.2023-08]
−0.8520.682−1.2500.211−2.180.484
C(month_str)
[T.2023-09]
−0.3840.706−0.5450.585−1.76940.999
Paid_Search
Traffic_p
−13.66411.276−1.2110.225−35.76518.436
Organic Search_
Traffic_p
0.7934.2220.1880.850−7.4819.069
Social
Traffic_p
11.82712.8640.9190.357−13.38537.040
Display Ads_p−15.08919.129−0.7880.430−52.58322.403
Pages per Visit−0.2790.487−0.5740.565−1.2340.674
Bounce Rate_p−1.4501.619−0.8960.370−4.6241.722
* Indicates statistical significance at the 95% level of significance. Intercept: Baseline log(Total Visits) for the reference brand in May 2023. C(brand)[T.X]: Brand fixed effects. Shows how much higher/lower the log-visits are for that brand compared to the reference brand (Coca-Cola in this case). C(month_str)[T.YYYY-MM]: Month fixed effects relative to May 2023. Captures common time shocks (seasonality). Paid_Search_Traffic_p: Share of visits coming from paid search traffic (% divided by 100). Organic_Search_Traffic_p: Share of visits coming from organic search traffic (%/100). Social_Traffic_p: Share of visits from social media referrals. Display_Ads_p: Share of visits from display advertising. Pages_per_Visit: Engagement depth; average pages viewed per session. Bounce_Rate_p: Share of visitors leaving after one page (%/100).
Disclaimer/Publisher’s Note: The statements, opinions and data contained in all publications are solely those of the individual author(s) and contributor(s) and not of MDPI and/or the editor(s). MDPI and/or the editor(s) disclaim responsibility for any injury to people or property resulting from any ideas, methods, instructions or products referred to in the content.