Article

Estimating the Impact of ESG on Financial Forecast Predictability Using Machine Learning Models

Department of Finance, Accounting and Economic Theory, Faculty of Economic Sciences and Business Administration, Transilvania University of Brasov, 500036 Brasov, Romania
*
Author to whom correspondence should be addressed.
Int. J. Financial Stud. 2025, 13(3), 166; https://doi.org/10.3390/ijfs13030166
Submission received: 16 July 2025 / Revised: 29 August 2025 / Accepted: 30 August 2025 / Published: 4 September 2025

Abstract

This study examines whether the integration of Environmental, Social, and Governance (ESG) factors enhances the accuracy of financial forecasts. Using a dataset of 2548 publicly listed companies from 98 countries, we evaluate a range of machine learning models—from ARIMA to XGBoost—by comparing the forecast performance of firms with high and low ESG scores (based on the sample median). Model accuracy is assessed through MAE, RMSE, MSE, MAPE, and R2, complemented by statistical significance tests. Results show no consistent improvement in predictive performance for high-ESG firms, with only the Business Services sector displaying a marginal effect. These findings challenge the assumption that ESG integration inherently reduces forecast uncertainty, suggesting instead that ESG scores contribute little to predictive accuracy under long-term investment conditions. The study highlights the importance of model choice, careful control of exogenous variables, and rigorous testing, while underscoring the broader need for standardized ESG metrics in financial research.

1. Introduction

The prediction of stock prices (Ding & Qin, 2020; Long et al., 2020; Ravikumar & Saraf, 2020; Yu & Yan, 2020; Lu et al., 2021; Trierweiler Ribeiro et al., 2021; Soni et al., 2022) and their volatility (Dai et al., 2020; Fang et al., 2020; Liang et al., 2020; Li et al., 2020; Zhang et al., 2021) remains a challenging task for both academics and practitioners. In recent years, growing attention has been directed toward Environmental, Social, and Governance (ESG) factors (Dincă et al., 2022, 2023) as a key component of financial decision-making (Ran et al., 2021; Shah et al., 2021; Al-Refiay et al., 2022). This shift has encouraged companies to allocate greater resources to ESG-related practices, while modern finance (Faheem et al., 2021; Petrović et al., 2023) increasingly places investors at the core of corporate strategy (Alghizzawi et al., 2024). As concerns regarding corporate responsibility intensify (Alghizzawi et al., 2024), firms have strengthened their focus on sustainability, embedding ESG considerations into their operations and reshaping how investors evaluate financial performance and risk. Prior research has predominantly explored the relationship between ESG integration and financial performance (Dincă et al., 2022), highlighting a nuanced relationship that shapes investment strategies and corporate governance (Amole & Emedo, 2025). However, these studies rarely address the direct impact of ESG factors on the predictability of financial forecast.
The growing body of literature indicates that firms with strong ESG performance are often viewed positively by investors (Clementino & Perkins, 2021; Park & Jang, 2021; Kräussl et al., 2024), benefiting from enhanced reputation, reduced risk exposure, and frequently superior financial outcomes. While numerous studies highlight the correlation between ESG and overall financial success (Domanović, 2021), much less attention has been paid to the direct impact of ESG on the accuracy and reliability of financial forecasts. This omission is notable, as forecasting plays a central role in strategic planning and investment decision-making (Faheem et al., 2021).
To address this gap, the present article investigates whether ESG integration influences financial forecasting and examines the mechanisms through which ESG factors may enhance, hinder, or exert no measurable effect on predictive accuracy. More specifically, the study evaluates whether ESG considerations improve decision-making processes and strengthen the reliability of financial forecasts. In doing so, it aims to provide a more nuanced understanding of the role of ESG in shaping predictive financial models and investment outcomes, thereby offering valuable insights for both practitioners and researchers and contributing to the broader debate on ESG and corporate governance.
The central hypothesis is that firms with higher ESG ratings exhibit greater stock price predictability than those with lower ESG scores, meaning that their stock price volatility is more amenable to accurate forecasting.

2. Literature Review

The growing integration of Environmental, Social, and Governance (ESG) standards into corporate operations has attracted increasing attention, as stakeholders recognize the value of sustainable and ethical business practices. For investors and financial market participants, comprehensive ESG disclosure is essential to conduct due diligence and make informed investment decisions. The literature on ESG disclosure is primarily grounded in four theoretical perspectives: stakeholder theory, sustainable governance mechanisms, legitimacy theory, and signalling theory.

2.1. Theoretical Framework

Stakeholder Theory
In his 2023 article “The End of ESG,” Edmans examines the increasing demands that stakeholders are placing on corporations, particularly the expectation of comprehensive reporting on Environmental, Social, and Governance (ESG) performance. He argues that higher ESG scores tend to reduce information asymmetry, thereby fostering stakeholder trust and contributing to more predictable cash flows (Edmans, 2023). Supporting this view, Clementino and Perkins (2021) demonstrate that external stakeholders often perceive improved ESG performance as enhancing a firm’s reputation among investors.
Sustainable Governance Mechanisms
Research by Luo and Wu (2022) and Meng (2024) indicates that corporations with higher ESG ratings generally achieve more accurate earnings forecasts, as analysts are better able to evaluate their risks and opportunities. Complementing this, Ahmad et al. (2024) demonstrate that in emerging markets, the link between ESG performance and financial outcomes is strongly influenced by institutional quality and managerial capability.
Legitimacy and Signalling Theories
Legitimacy theory suggests that firms expand social and environmental disclosures in response to market and societal expectations, thereby narrowing legitimacy gaps (Del Gesso & Lodhi, 2025). In parallel, signalling theory interprets ESG disclosure as a demonstration of proactive engagement in sustainable practices, which can enhance long-term stakeholder value (Huang, 2022). At the managerial level, ESG-oriented strategies—such as educating stakeholders and strengthening board expertise—reinforce corporate responsibility and alignment with societal norms. Furthermore, firms with strong ESG performance may strengthen their reputation for reliability in both capital and debt markets (Bamahros et al., 2022).

2.2. Empirical Evidence on ESG and Financial Predictability

Guo et al. (2020) show that ESG-related news, combined with Bayesian inference, indicates that high ESG sentiment is associated with lower stock volatility, particularly in the medium term. In a similar vein, Banerjee et al. (2025) find that both ESG sentiment and investor sentiment significantly influence share prices. Capelli et al. (2021) demonstrate that integrating ESG risk measures into traditional financial risk models narrows the gap between ex ante risk and ex post volatility. ESG integration thus emerges as an effective risk management tool, mitigating diverse sources of uncertainty and contributing to higher expected returns (Agliardi et al., 2023). Kuzmina et al. (2023) further emphasize that this approach aligns with the European Taxonomy, which promotes the inclusion of ESG risks in forecasts and asset valuation. Evidence from Malaysia also suggests that comprehensive ESG practices enhance financial performance, particularly through improved Return on Assets (ROA) (Ming et al., 2024).
The relationship between ESG efficiency and financial performance, however, varies by sector. Cheng et al. (2023) show that ESG efficiency scores provide meaningful insights into firm performance, while Song et al. (2024) highlight that textual analysis of ESG reports in the energy sector improves the prediction of financial distress. Cheng et al. (2023) also note that technology firms face a trade-off between improving ESG performance and sustaining stock valuation, a dynamic less pronounced in non-technology sectors. Broadly, high ESG-rated firms tend to exhibit superior financial performance, a lower cost of capital, and improved risk-adjusted returns (Upadhyay, 2024). At the portfolio level, ESG scores are among the strongest predictors of mutual fund performance (Momparler et al., 2024).
Recent advances in machine learning further highlight the predictive potential of ESG data. Hsu et al. (2025) show that deep learning models such as LSTM and CNN outperform traditional approaches in forecasting financial performance when ESG metrics are included. Similarly, Song et al. (2024) demonstrate that Random Forest and Decision Tree algorithms effectively predict financial distress with ESG inputs, while CatBoost models that incorporate ESG-related textual variables improve predictive accuracy in the energy sector. Lee et al. (2024) provide further evidence, showing that combining ESG sentiment with technical indicators in deep learning models significantly enhances stock price prediction accuracy compared to models based solely on historical data.
Nevertheless, the literature also identifies important limitations. Song et al. (2024) report that while ESG performance predicts financial distress in energy firms, Ming et al. (2024) caution that strong environmental and social scores may impose short-term costs, creating trade-offs for firms. Jia and Ma (2024) find that incorporating ESG ratings into logistic regression and neural network models can actually reduce predictive accuracy, suggesting that ESG data do not always enhance financial forecasting. Likewise, Rossi and Candio (2023) argue that ESG disclosure, particularly in the environmental dimension, may increase forecast error, underscoring the need for more effective communication strategies to inform analysts and investors.

3. Methodology

The data collection, preprocessing, training, prediction, and results analysis procedures adopted in this study are outlined in this section. First, the required data was collected to support the empirical analysis. Next, preprocessing steps were applied to filter the dataset, assess quality, and ensure consistent formatting. The processed data was then used for model training and prediction. Finally, the results were analyzed to evaluate the research hypotheses and determine whether they should be accepted or rejected.

3.1. Data Collection

The datasets used in this study were obtained from the London Stock Exchange Group (LSEG) Workspace. This database was selected because the authors have full access to it, and its coverage is comparable to other leading financial data providers such as Yahoo Finance, MSCI, and Bloomberg.
First, the screener application was used to extract up to 100 companies per country that had reported an ESG score during the previous year, along with their ticker symbols, headquarters country, and industry sector. LSEG provides coverage for 98 countries; however, many of these (e.g., Malta, Ghana) did not have 100 publicly traded companies with available ESG data. Consequently, instead of the expected 9800 firms (98 × 100), the dataset contained only 3079 companies.
For these firms, we collected data on daily closing prices, Forward Enterprise Value to EBIT, Forward Enterprise Value to EBITDA, and Forward Enterprise Value to Sales. The sample period spans 1 January 2018 to 31 December 2024, encompassing a volatile era marked by the COVID-19 pandemic and the Russian invasion of Ukraine, both of which significantly disrupted global energy markets.
To measure ESG performance, we employed the LSEG (formerly Refinitiv) TR.TRESGScore—the Thomson Reuters ESG Score—which evaluates a firm’s Environmental, Social, and Governance performance on a 0–100 scale relative to its industry peers. This measure relies exclusively on publicly reported information and excludes controversy-related data. Scores are computed by aggregating and weighting pillar-level ratings according to sector-specific materiality. Because results may vary depending on the ESG metric used, robustness checks could draw on alternative LSEG measures or on scores from other providers such as MSCI or Sustainalytics.
We considered two ESG metrics: the ESG Score (TR.TRESGScore) and the ESG Combined Score (TR.TRESGCScore), the latter adjusting the base score for controversies such as fines, lawsuits, or scandals reported in the media. Among the 3079 firms with both measures available, the ESG Score showed a higher mean (58.60) than the ESG Combined Score (55.16), with a mean difference of +3.44 points. This indicates that incorporating controversies systematically lowers ratings. While penalizing controversies may provide useful information, it can also introduce volatility and potential bias against large, high-profile firms that are subject to greater media scrutiny, regardless of their underlying ESG performance.
This effect is particularly evident in extreme cases. Several global leaders with strong ESG policies and disclosures—such as Nestlé, Microsoft, Intel, and Shell—saw their combined scores reduced by more than 42 points when controversies were factored in, despite robust underlying ESG performance. Such sharp downward adjustments risk overemphasizing short-term reputational shocks at the expense of structural ESG practices. In contrast, the unadjusted ESG Score captures long-term ESG capabilities while avoiding noise from controversy-driven volatility.
Moreover, the standard deviation of the ESG Score (19.21) was slightly higher than that of the ESG Combined Score (18.23), suggesting broader dispersion and potentially stronger discriminative power across firms. The two measures remain highly correlated (ρ = 0.886), indicating that they convey broadly similar information. However, the ESG Score avoids the disproportionate penalization of firms facing isolated but highly publicized controversies.
Given this study’s focus on structural ESG performance rather than short-term reputational shocks, the unadjusted ESG Score was selected as the primary metric. The Combined Score can still be included as a robustness check, though such a check is not strictly necessary when the objective is to capture stable, long-term ESG capabilities rather than transient event-driven impacts.

3.2. Data Quality and Preprocessing

Prior to conducting the forecasting analysis, a comprehensive data quality assessment was carried out to ensure the reliability and validity of the 3079 company time series. This step was critical given the heterogeneous nature of financial time series data and its susceptibility to quality issues that could bias analytical outcomes.

3.2.1. Data Quality Methodology

The assessment employed a multi-dimensional evaluation framework that combined both basic and advanced quality checks. Each time series was examined across the following dimensions:
  • Basic quality metrics. For each series, we calculated the percentage of missing values, the total number of observations, and the data range. Series with more than 15% missing values were flagged for exclusion, in line with established practices in financial time series analysis, where excessive missingness can severely distort results.
  • Advanced quality checks. In addition to the basic metrics, several further assessments were performed:
    o
    Outlier detection using z-score analysis with a threshold of three standard deviations;
    o
    Constant value detection to flag series lacking temporal variation;
    o
    Coefficient of variation (CV) calculations to evaluate relative variability;
    o
    Temporal gap analysis to identify discontinuities exceeding seven days in datasets expected to be continuous.
  • Composite quality scoring. A composite score ranging from 0 to 100 was then constructed for each series. Deductions were applied based on percentage of missing data (1:1 penalty ratio), outlier prevalence (up to 20 points), constant series identification (50-point penalty), and temporal gaps (5 points per gap, capped at 15 points).

3.2.2. Data Preprocessing and Filtering

Following the quality assessment, a systematic preprocessing procedure was applied to ensure data consistency. Time series were resampled to a common frequency and aligned to standardized temporal boundaries. Duplicate columns and rows in the exogenous variables were identified and removed to avoid multicollinearity.
Series that did not meet quality thresholds—defined as containing more than 15% missing values or having composite quality scores below acceptable levels—were excluded from the analysis. For the retained series, missing values were imputed using linear interpolation, followed by forward and backward filling. This procedure preserved temporal consistency while minimizing information loss.

3.2.3. Train–Test Split

Additionally, the data was split into the train and test datasets, keeping 180 days for the test set. This ensured that there was enough data for both training and testing our models and ensuring that the results are relevant.

3.2.4. Min–Max Scaling

The last step was to scale all the closing price time series for all the companies using a min–max scaler between 0 and 1. This was carried out because the ML models employed require scaled data, comparing the company data without worrying about the stock price at that time.
After the data had been parsed through the preprocessing pipeline, the sample was left with 2548 companies with enough data points to cover the entire sample period, and which passed the imposed data quality check.

3.3. Modelling

The modelling strategy is to train a separate forecaster for each time series, using a forecast horizon of 180 business days. The idea is that each company will have its performance and particularities. However, using a single model for the whole dataset, or a separate model for each industry sector, are valid solutions which have their merit and need to be investigated further.
The models tested in this research include several time series forecasting models, including the following:
  • ARIMA: a combination of Auto Regressive and Moving Average models, with the addition of Integration capabilities.
  • Elastic Net: linear regression with Lasso (L1) and Ridge (L2) regularization.
  • K Neighbours Regressor: finds the K nearest data points to a given input and averages their target values.
  • SVR: Support Vector Regressor, transforms input features into high-dimensional spaces to locate the ideal hyperplane that accurately represents the data.
  • Random Forest: an ensemble of decision trees organized in parallel.
  • XGBoost (eXtreme Gradient Boosting): an ensemble of decision trees organized sequentially.
The initial plan was to employ an ensemble of the best-performing models. However, after evaluating the results of each model individually as well as in ensemble and stacking structures, ARIMA was ultimately selected as the sole forecasting method.
Although deep learning architectures such as LSTM and GRU represent the current state of the art, testing revealed that they underperformed compared to classical time series models in this context. ARIMA was preferred because it enables exogenous forecasting (ARIMAX), allowing the incorporation of external variables that influence the target series. To avoid data leakage, only forward-looking values of exogenous variables were included, ensuring that the model did not rely on information unavailable at the prediction date. This preserves temporal integrity and prevents overly optimistic estimates. By restricting inputs to variables observable or forecastable in real time, the model reflects a more realistic and deployable forecasting scenario.
For hyperparameter optimization, Bayesian methods were employed using the Python Optuna library. The Tree-structured Parzen Estimator (TPE) sampler combined with the Median Pruner over 50 trials produced the best results, with RMSE (Root Mean Squared Error) selected as the objective function. RMSE was chosen instead of metrics such as MAE or MAPE because it penalizes large errors more heavily, particularly failures to capture price spikes. This choice discourages the model from defaulting to constant forecasts that minimize MAE but fail to account for volatility and sudden price movements—elements that are critical in financial forecasting. By emphasizing RMSE, the model was encouraged to anticipate significant jumps, thereby producing more informative predictions.
Although tools such as auto-ARIMA exist for automated parameter selection, they typically rely on stepwise searches optimized for information criteria (AIC/BIC), which may not maximize out-of-sample forecast accuracy. By contrast, Bayesian optimization provided a broader and more flexible parameter search, directly optimized for RMSE, with the ability to fine-tune ARIMAX models and terminate poor configurations early. This approach delivered superior performance in capturing volatility and abrupt price changes relative to the default auto-ARIMA strategy.
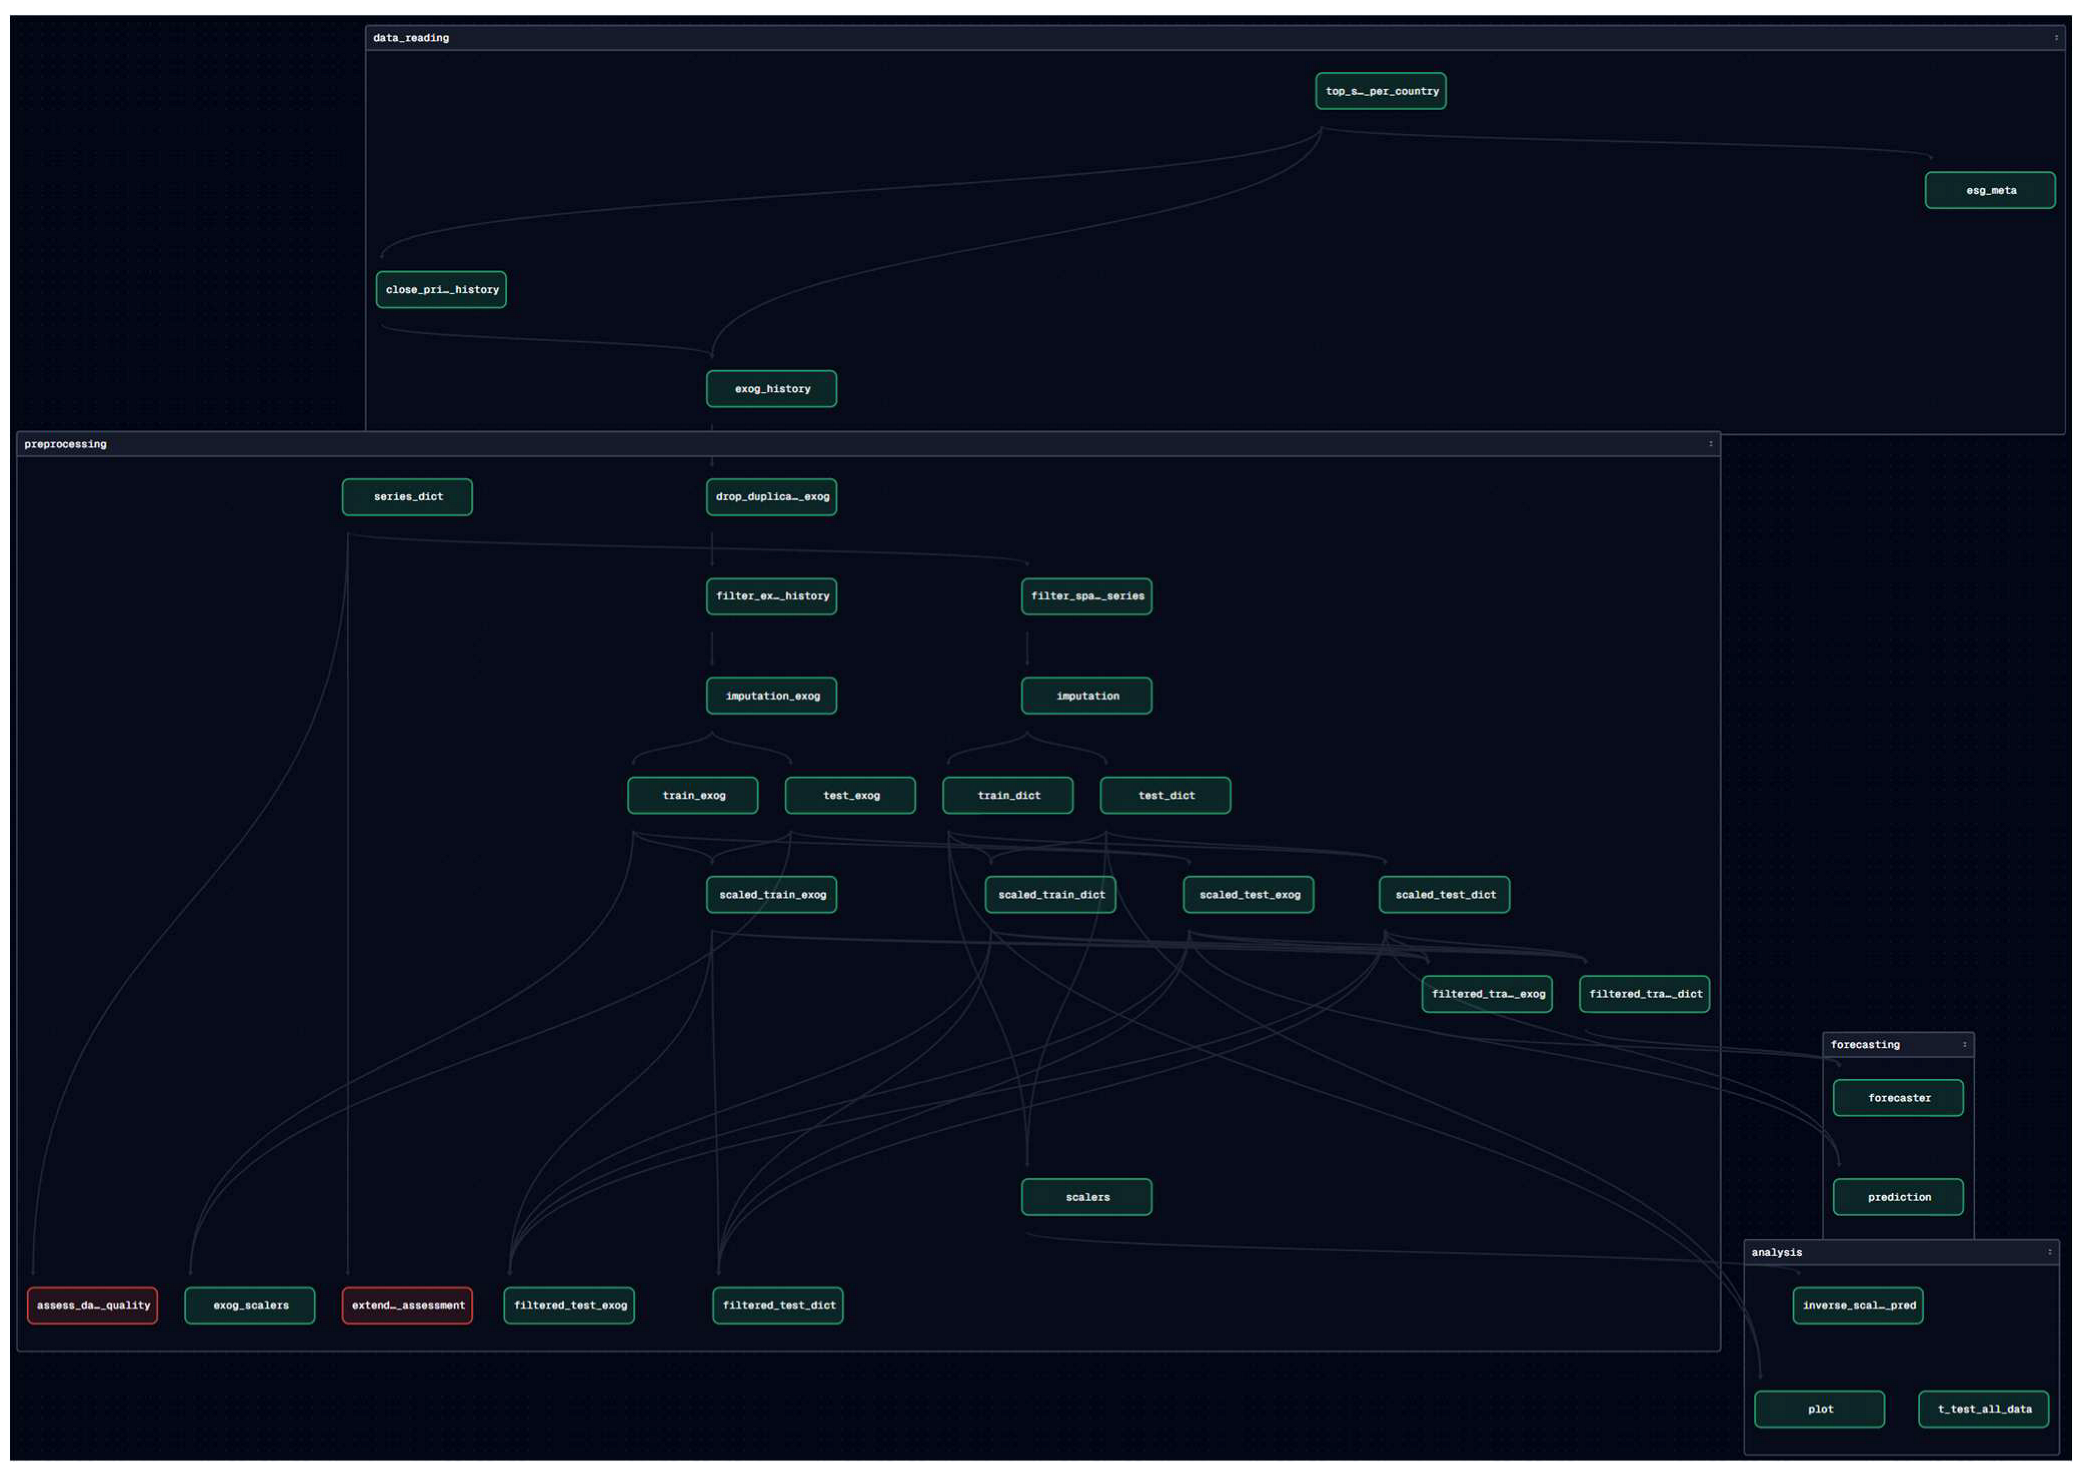
Appendix A provides a comprehensive list of the Python libraries employed in the development of this research. Appendix B presents the asset graph generated with Dagster, a data orchestrator designed for data-centric projects. All machine learning models were tested using Austrian firms, as this cohort offered a sufficiently large, high-quality, and internally consistent dataset for robust model comparison. Focusing on a single country controlled for cross-country differences in market structures, regulatory frameworks, and ESG reporting practices. This design ensured that observed performance differences were attributable to the forecasting models themselves rather than to country-level heterogeneity, thus providing a reliable benchmark for assessing predictive accuracy.
Elastic Net performed the worst due to its inability to capture complex nonlinear relationships within the data, leading to significantly higher error values across all metrics. Its reliance on linear combinations of input features, combined with regularization penalties, may have oversimplified the underlying structure of the financial time series, resulting in underfitting.
Support Vector Regression (SVR) also showed relatively poor performance, with high MAE and MAPE values. While SVR can handle nonlinearities through kernel functions, it may have struggled with feature scaling or the selection of hyperparameters, resulting in less accurate predictions.
K-Nearest Neighbours (KNN) performed moderately, but its errors were still higher than those of the tree-based models. KNN’s simplicity and reliance on local patterns may have been insufficient for capturing global trends in the data, particularly in high-dimensional or noisy environments.
Random Forest demonstrated good performance, benefiting from its ensemble approach and ability to model nonlinearities and interactions between features. However, it slightly underperformed compared to XGBoost, particularly in terms of MAE and RMSE.
XGBoost emerged as one of the top-performing models, achieving low error metrics across the board. Its use of gradient boosting, regularization, and tree pruning makes it well-suited for complex regression tasks, offering both accuracy and robustness.
ARIMA, despite being a classical statistical model, outperformed all other models in terms of MAE (0.1024) and RMSE (0.1301), and maintained a reasonable MAPE (0.1753). This indicates that ARIMA was highly effective for short-term, univariate time series forecasting in this setting, especially when augmented with exogenous variables (ARIMAX). These models’ average results are summarised in Table 1 below.

4. Results

4.1. Overall Results

To test the hypothesis, Student’s t-test was performed on the MAE and RMSE. The idea is to take all the forecasts, use the median to split the companies into high- and low-ESG-score company cohorts, and perform the t-test on the error metrics, specifically MAE. In theory, if the alternative hypothesis is true, there should be a difference between the two error distributions. Moreover, Levene’s test was performed beforehand to assess the equality of variances for a variable calculated for the two cohorts. The results of these tests are shown in Table 2 below.
Levene’s test was conducted on MAE, MSE, R-squared, and RMSE to assess the assumption of homogeneity of variances. Since all p-values exceeded the 0.05 threshold, the null hypothesis of equal variances could not be rejected for any metric, thereby validating the use of independent-samples t-tests to compare group means.
The subsequent t-tests for MAE, MSE, R-squared, and RMSE also returned p-values well above 0.05, indicating no statistically significant differences between low- and high-ESG groups. This finding suggests that model performance, as measured by these metrics, does not differ in a meaningful way across ESG classifications.
The relatively large degrees of freedom (2063) reflect the substantial sample size employed in the analysis. Higher degrees of freedom reduce the standard error and enhance the statistical power of the tests. Nevertheless, the absence of significant differences across all four performance measures strengthens the conclusion that ESG grouping has no meaningful impact on forecasting accuracy.

4.2. MAPE Comparison with Other Studies

In Table 3 below, we compared our results with several studies that also examined ESG scores in the context of financial forecasting. While none of them employed the same approach, we included them for comparative purposes.
Sattar et al. (2025) integrate ESG scores with other indicators as exogenous variables to forecast demand, inventory policies, and risk in supply chain management. Their approach achieved a remarkably low MAPE over an extended forecast horizon; however, the underlying time series was comparatively simple, characterized by a clear trend, strong seasonality, and low volatility. This simplicity is highlighted by the fact that a linear regressor substantially outperformed more sophisticated models, which typically demonstrate advantages in noisy, volatile, or structurally complex data.
Similarly, D’Amato et al. (2021, 2022) conduct related studies using the same dataset of 109 Euro Stoxx 600 companies with ESG scores. The 2021 paper focuses on forecasting balance sheet and income statement items, while the 2022 study predicts firm profitability. Although both report lower MAPE values than the present research, this outcome is largely explained by their use of a very short forecast horizon, which substantially reduces prediction complexity.

4.3. Overfitting Analysis

Overfitting was assessed by comparing the MAE, MSE, RMSE, and MAPE values of the validation and test sets. A threshold of 1.5 was applied: if the test error exceeded the validation error by more than 1.5 times, the time series was flagged as potentially overfit. Using this criterion, roughly 10% of forecasts were identified as overfit, with the highest incidence in Nigeria (38.5%), Tunisia (27.3%), South Korea (24.1%), and India (20.0%).
  • Nigeria. The closing price series and exogenous data were of poor quality, with frequent gaps. The aggressive imputation strategy used to reduce data loss introduced distortions that contributed to overfitting. A more conservative approach to imputation would likely have been more effective.
  • South Korea. Although some models appeared overfit, two main factors influenced the outcome: (i) validation data quality exceeded that of the test set, artificially inflating validation performance, and (ii) very small error values overall, where even minor differences triggered the ratio-based threshold.
  • Tunisia and India. In both cases, a sharp increase in stock prices during late 2024 was not captured by the exogenous variables available from LSEG, resulting in forecast errors flagged as overfitting.

4.4. Industry Grouping MAE Results

The industry-level analysis of the MAE t-test results, presented in Table 4, provides several key insights. For the majority of industries, no statistically significant differences are observed between high- and low-ESG groups, with most p-values exceeding the conventional 0.05 threshold. This indicates that ESG classification generally has little influence on predictive accuracy.
The main exception is Business Services, where a significant difference emerges (t = 2.03, p = 0.044). Given that this sector also represents one of the largest samples in the dataset, the result is more robust due to higher statistical power, suggesting that ESG ratings may indeed affect predictive performance in this industry.
Some additional sectors, including Machinery (p = 0.093) and Radio and Television Broadcasting Stations (p = 0.092), approach significance. While not conclusive under standard thresholds, these findings could be suggestive, particularly if supported by larger samples or complementary evidence.
The variation in the direction of t-statistics across industries is also notable: positive values indicate higher MAE for high-ESG firms, while negative values point to the opposite. Such inconsistency suggests that ESG-related effects on prediction error are likely industry-specific rather than generalizable.
Results for industries with small group sizes—such as Leather Products, Motion Picture Production, and Savings and Loans—should be interpreted cautiously, as limited sample sizes reduce statistical power and increase volatility in outcomes.
Overall, the evidence indicates that ESG characteristics may shape forecast errors in certain sectors, most prominently Business Services. However, across most industries, no systematic effect is detected, underscoring the need for further research with larger datasets or alternative performance measures to clarify the role of ESG in predictive modelling.
Finally, a Bonferroni test was performed to check for the potential inflation of Type I error due to multiple comparisons across the various industry groups. For all industries, the Bonferroni test was false, with adjusted p-values remaining considerably over 0.05. This indicates that after accounting for multiple testing, there were no statistically significant differences in MAE between the high- and low-ESG groups across any industry, reinforcing the conclusion that ESG classification does not have a strong impact on model prediction errors in this analysis.

4.5. Error Metrics Histograms

Figure 1, below, represents the distribution of mean absolute error values for firms with low ESG scores (blue) and high ESG scores (orange), based on forecasts generated using the ARIMAX model. The results indicate that firms with higher ESG scores exhibit a more concentrated error distribution, suggesting relatively stable predictive accuracy compared to firms with lower ESG scores, which show greater variability in forecast errors.
Figure 2 exhibits the distribution of mean squared error values for firms with low ESG scores (blue) and high ESG scores (orange), using forecasts generated by the ARIMAX model. While both groups show a high frequency of low-error outcomes, the distribution for high-ESG-score firms is more tightly clustered near zero, reflecting reduced prediction variance relative to low-ESG-score firms.
Figure 3 illustrates the distribution of root mean squared error values for firms with low ESG scores (blue) and high ESG scores (orange), based on forecasts generated by the ARIMAX model. Both groups display a concentration of low-error outcomes; however, the distribution for high-ESG-score firms is more densely clustered around smaller error values, indicating reduced forecast variance compared to firms with low ESG scores.
The histograms are asymmetric (right-skewed), which is actually quite common for error metrics like MAE, MSE, or RMSE in large-scale forecasting experiments. The reasons are multi-faceted, including the following:
  • Most forecasts are reasonably accurate: The majority of time series, both high-ESG and low-ESG, have relatively low forecast errors, so a high concentration of observations in the lower bins (close to zero) is obtained.
  • A small number of “hard-to-predict” series stretch the tail: Certain companies have very volatile, noisy, or irregular time series (e.g., sudden price jumps, poor data quality, structural breaks). These produce much larger forecast errors, but they are rare—which creates the long tail toward the right.
  • Non-negative metric constraint: MAE, MSE, RMSE are always ≥0, so there is a “hard wall” at zero and no negative side of the distribution. This forces any variability to extend only in the positive direction, inherently creating right-skewness.
  • Heterogeneity across companies: Since each company has its own forecast model, differences in sector dynamics, liquidity, and exogenous factor relevance mean that some series are naturally more predictable than others. This heterogeneity broadens the spread and reinforces the skew.

4.6. Time Series Forecast Examples

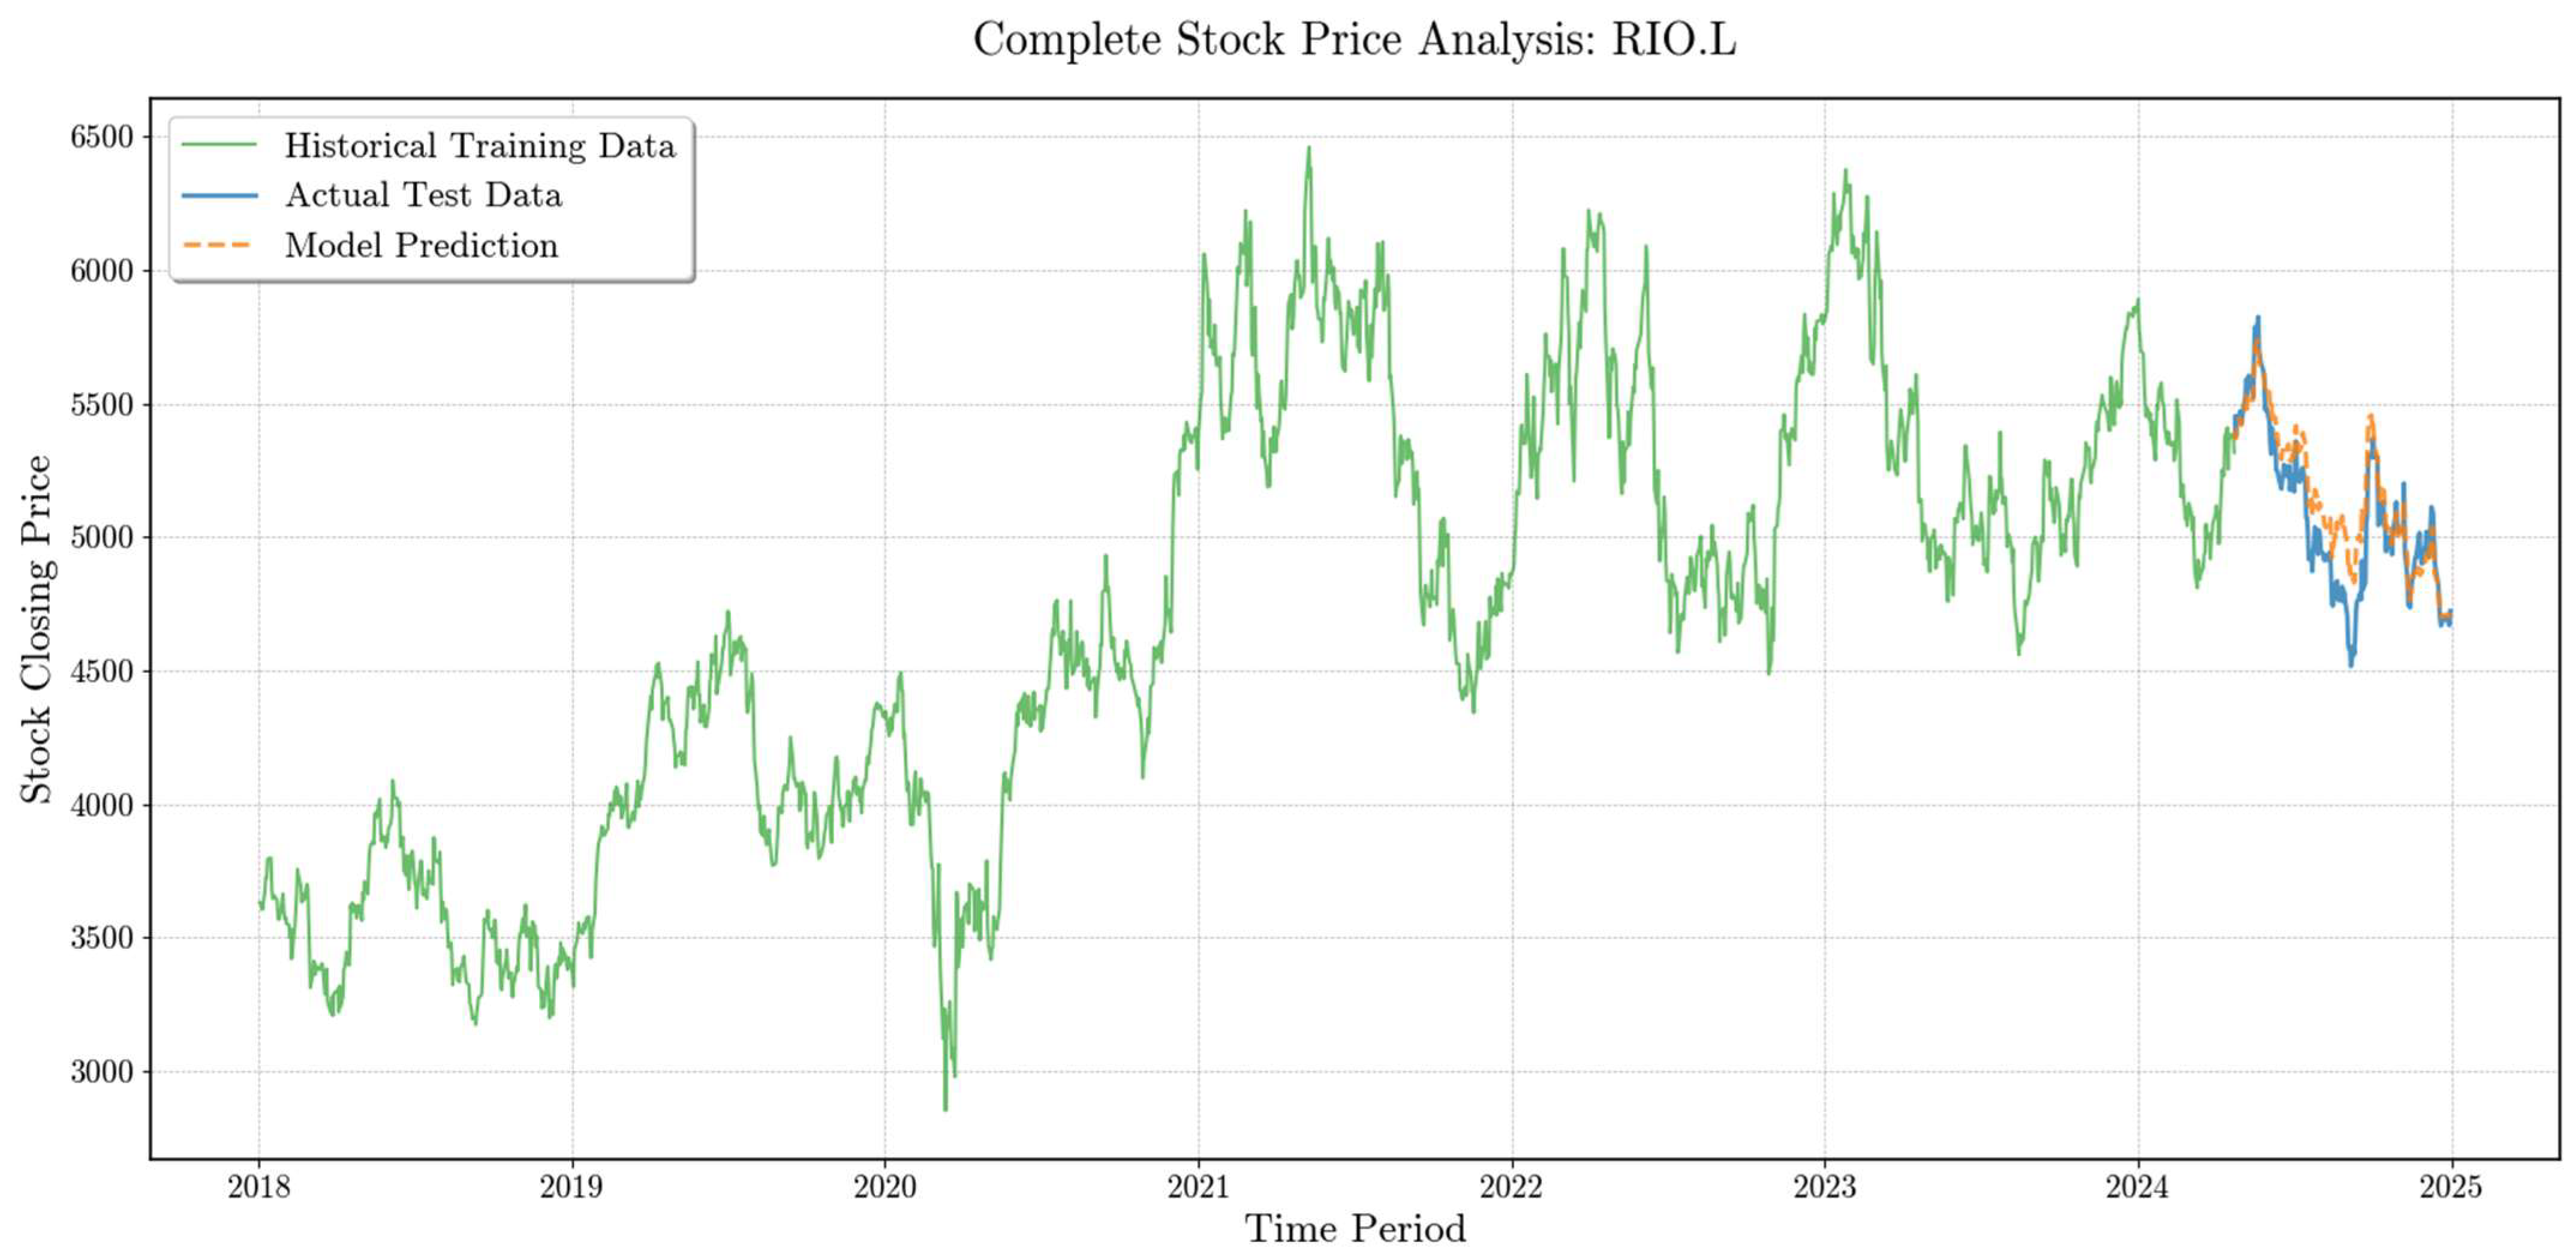
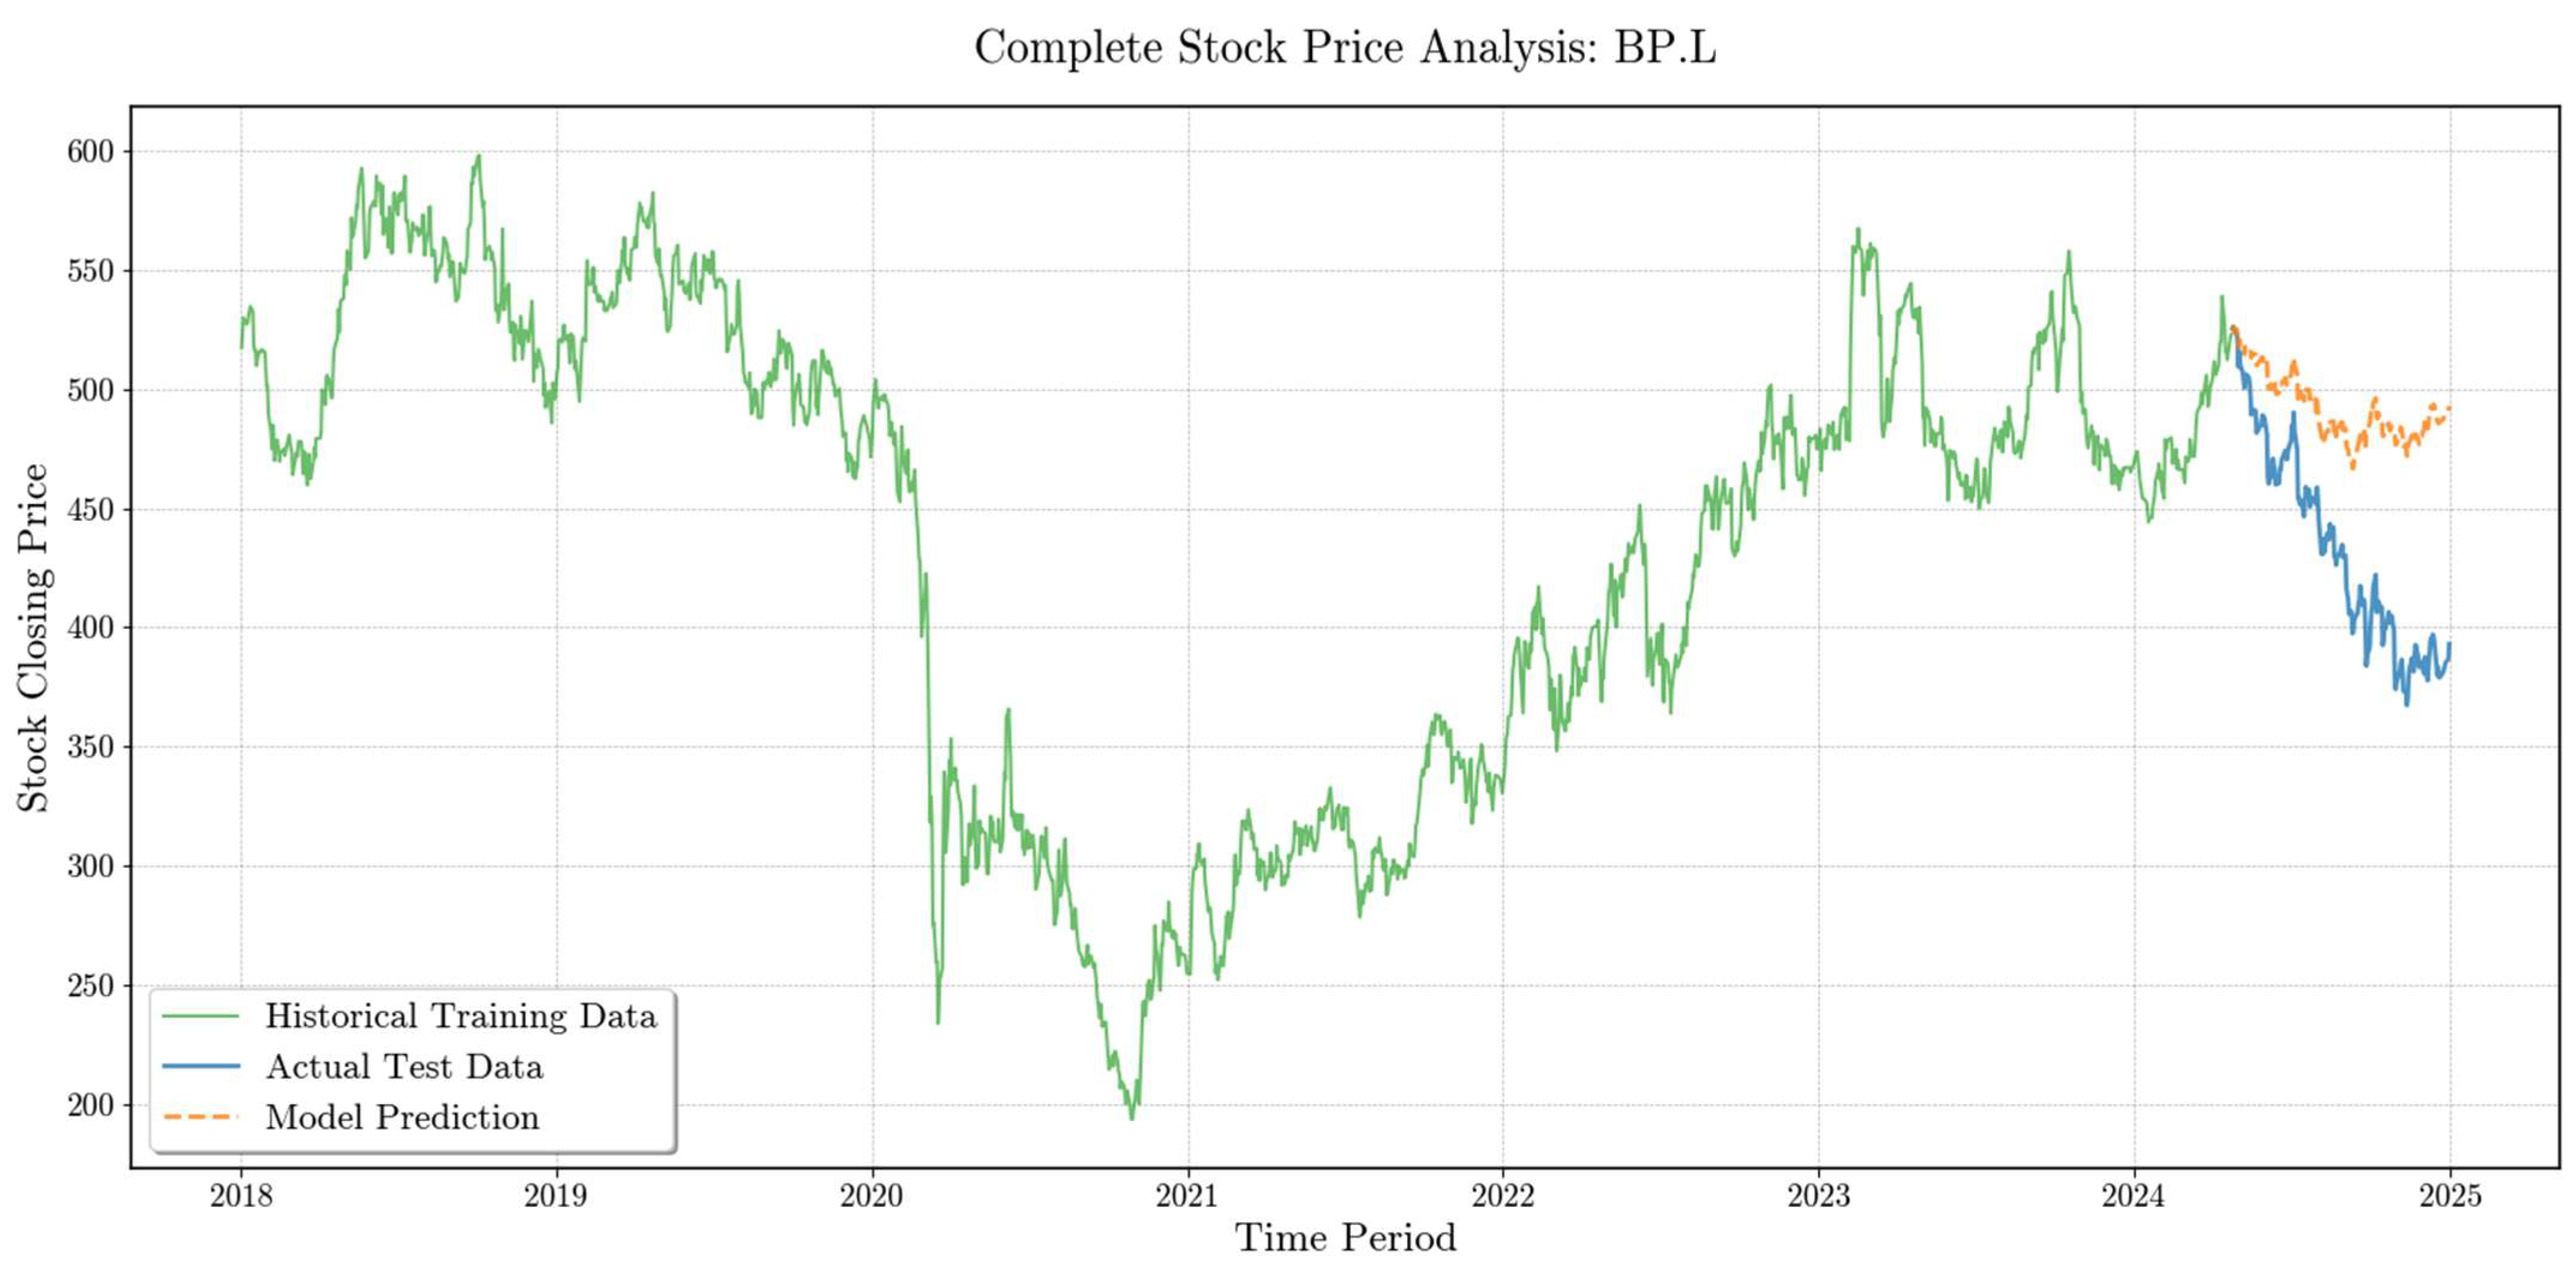
The following section presents a series of graphical representations illustrating temporal projections under three distinct scenarios, accompanied by detailed analyses of each case. The aim is to provide an overview of the model’s predictive performance from March to December 2024, highlighting both its strengths and its limitations.

4.6.1. RIO.L—Rio Tinto Group

Figure 4 represents historical daily closing prices (green) from January 2018 to March 2024, test data (blue) from April 2024 to January 2025, and model-generated predictions (orange dashed) for the same test period. The predictive model demonstrates a strong ability to anticipate the company’s performance, capturing short-term fluctuations and aligning closely with actual observed prices despite the inherent market volatility. Data was sourced from LSEG Workspace, and predictions were generated using the ARIMAX model.

4.6.2. BP.L—British Petroleum PLC

Figure 5 shows historical daily closing prices (green) from January 2018 to March 2024, test data (blue) from April 2024 to January 2025, and model-generated predictions (orange dashed) for the same period. The forecast highlights a significant limitation of the ARIMAX model, which, while anticipating the onset of a sharp price decline, failed to capture the full magnitude and duration of the downturn. This discrepancy underscores the challenges of modelling abrupt market shocks that deviate from historical patterns. Data was obtained from LSEG Workspace.

4.6.3. GLEN.L—Glencore PLC

Figure 6 illustrates historical daily closing prices (green) from January 2018 to March 2024, test data (blue) from April 2024 to January 2025, and model-generated predictions (orange dashed) for the same period. The results demonstrate the relatively weak forecast performance of the ARIMAX model, primarily due to the pronounced volatility in the company’s historical price data. The model failed to capture the erratic fluctuations in price movements, resulting in substantial prediction errors and a noticeable divergence from the actual market trend. Data was obtained from LSEG Workspace.

5. Discussion

This paper investigates whether, in real-world applications, companies with high ESG ratings are easier to forecast than those with low ESG ratings. The initial hypothesis proposed that, while high-ESG firms may not necessarily outperform their low-ESG counterparts, forecasts for these firms would be more reliable and provide greater certainty regarding performance (Pérez et al., 2022; Edmans, 2023). The null hypothesis states that high-ESG-rated companies do not exhibit greater financial predictability, whereas the alternative hypothesis posits the opposite. Since the p-values for all firms—and nearly all industry sectors, with the exception of Business Services—exceeded the 0.05 threshold, the alternative hypothesis cannot be accepted. Thus, no statistically significant difference is observed in the forecastability of high- versus low-ESG firms.
The analysis was designed to replicate long-term investment conditions. While machine learning models often perform well in predicting short-term (e.g., daily) price fluctuations, such results have limited relevance for investors focused on longer horizons rather than speculative trading. To mitigate potential biases and ensure robustness, the study involved the following:
  • Included companies from a broad range of countries;
  • Used a large sample to achieve statistical significance;
  • Grouped firms by industry sector to account for sector-specific effects;
  • Excluded companies with sparse closing price histories;
  • Applied a consistent modelling approach across firms, verifying assumptions with Levene’s test and applying a Bonferroni correction for industry-wise comparisons.
The findings highlight the importance of standardized ESG metrics to improve comparability across firms and sectors (Amole & Emedo, 2025). Policymakers should prioritize strengthening ESG disclosure systems and incentivizing voluntary initiatives, particularly in emerging markets (Luo & Wu, 2022; Ahmad et al., 2024). Looking ahead, advances in artificial intelligence and machine learning are expected to play a central role in ESG applications, improving both financial forecasting and investment decision-making (Lim, 2024; Hsu et al., 2025). Integrating ESG considerations into predictive models has the potential to enhance risk management and align investment strategies with sustainable, long-term performance (Faheem et al., 2021).

AI–ESG Synergies in Financial Markets

Artificial intelligence is increasingly pivotal in embedding ESG into financial decision-making. Natural language processing (NLP), for example, optimizes ESG disclosure processes by extracting insights from corporate sustainability reports, while machine learning (ML) enables the analysis of large ESG datasets, supporting more precise risk assessment and improving investment decisions (Vinothkumar et al., 2024).
The integration of AI with ESG principles represents not a passing trend, but a structural transformation of financial markets. It fosters the development of data-driven sustainability strategies that enhance profitability while strengthening resilience against diverse risks. As AI technologies continue to advance, their role in embedding ESG factors into financial systems will expand significantly, shaping the future of responsible and ethical investing (Addy et al., 2024a, 2024b).
In trading and portfolio management, AI applications are already widespread, particularly in predictive analytics and algorithmic trading aimed at optimizing sustainable portfolios (Lim, 2024). However, challenges remain. Poor data quality and the lack of standardized ESG metrics remain major obstacles to effective application in this field (Xu, 2024).

6. Conclusions

This research investigated whether companies with high ESG ratings are more predictable in financial forecasting than those with low ratings. The empirical analysis, which grouped firms by industry and evaluated multiple machine learning models, found no statistically significant difference in predictability between the two groups, except in the Business Services sector. These findings suggest that ESG factors alone do not enhance forecast accuracy, challenging the assumption that higher ESG ratings necessarily translate into more stable or predictable financial outcomes. This conclusion is supported by the small t-statistic and the high p-values and degrees of freedom observed in the full-sample analysis.
The study was designed to replicate real-world, long-term investment conditions rather than short-term market fluctuations. While machine learning models can capture short-term dynamics with reasonable accuracy, reliable long-term forecasts require the inclusion of exogenous factors such as macroeconomic indicators, corporate financial reports, and geopolitical developments. Future research should therefore explore the integration of alternative data sources and advanced AI techniques—particularly natural language processing (NLP) applied to financial news and sentiment analysis—to improve forecast robustness. Although ESG remains a central element of sustainable investment strategies, its contribution to forecast reliability appears less substantial than commonly assumed.

Practical and Policy Implications

  • Dynamic ESG thresholds: Firms should establish minimum ESG investment thresholds (e.g., a score of 60) to reduce volatility in financial forecasts.
  • Transparency in ESG scoring: Investors and regulators should examine not only the headline ESG scores but also the underlying data and methodologies to ensure that investment decisions are evidence-based rather than driven by scores alone.
  • Decision frameworks for investors: Structured portfolio allocation approaches (e.g., decision-tree models) should integrate ESG considerations alongside traditional financial and sectoral factors.
  • Standardized ESG auditing: Regulators and standard-setters should promote harmonized auditing standards for ESG disclosures, leveraging AI to reduce inconsistencies across metrics (Amole & Emedo, 2025).

Author Contributions

Conceptualization, M.S.D., V.C. and F.A.; methodology, V.C.; software, V.C.; validation, M.S.D., V.C. and F.A.; formal analysis, V.C. and F.A.; investigation, V.C. and F.A.; resources, M.S.D., V.C. and F.A.; data curation, V.C.; writing—original draft preparation, F.A. and V.C.; writing—review and editing, M.S.D.; visualization, F.A. and V.C.; supervision, M.S.D. All authors have read and agreed to the published version of the manuscript.

Funding

This research received no external funding.

Institutional Review Board Statement

Not applicable.

Informed Consent Statement

Not applicable.

Data Availability Statement

The original contributions presented in this study are included in the article. Further inquiries can be directed to the corresponding author.

Acknowledgments

During the preparation of this manuscript, the author(s) used Microsoft’s Copilot, Scispace 1.5.0, and ChatGPT-4.1 for the purposes of the code-writing process in Python 3.11, paraphrasing, and grammatical modifications. The authors have reviewed and edited the output and take full responsibility for the content of this publication.

Conflicts of Interest

The authors declare no conflicts of interest.

Appendix A

  • Software and Computational Environment
This analysis was conducted using Python as the primary programming language, leveraging a comprehensive ecosystem of specialized libraries for time series forecasting, statistical analysis, and data processing.
  • Core Software Platform
Python 3.10.16 served as the foundational programming environment, chosen for its extensive ecosystem of scientific computing and machine learning libraries, as well as its robust support for time series analysis workflows.
  • Key Software Libraries and Versions
Data Processing and Analysis:
  • NumPy 1.26.4: Fundamental package for numerical computing and array operations.
  • Pandas (via dependencies): Essential for time series data manipulation and preprocessing.
  • Matplotlib 3.10.0: Primary visualization library for generating statistical plots and time series visualizations.
  • Seaborn 0.13.2: Statistical data visualization built on matplotlib for enhanced plotting capabilities.
Time Series Forecasting:
  • sktime 0.35.0: Unified machine learning framework for time series analysis, providing consistent interfaces for forecasting models.
  • pmdarima 2.0.4: Auto-ARIMA implementation for automated model selection and parameter tuning.
  • XGBoost 2.1.4: Gradient boosting framework used for machine learning-based forecasting approaches.
Financial Data Access:
  • yfinance 0.2.54: Python library for accessing Yahoo Finance market data.
  • lseg-data 2.0.1: LSEG (formerly Refinitiv) data platform integration for professional financial data access.
Statistical Analysis and Optimization:
  • Optuna 4.1.0: Hyperparameter optimization framework for automated model tuning.
  • SciPy (via dependencies): Comprehensive scientific computing library for statistical tests and analysis.
Workflow Management and Reproducibility:
  • Dagster 1.10.3: Modern data orchestration platform for building and managing data pipelines.
  • Dagster-webserver 1.10.3: Web interface for monitoring and managing computational workflows.
Development and Quality Assurance:
  • Pre-commit 4.1.0: Framework for managing pre-commit hooks to ensure code quality.
  • Pylint 3.3.4: Static code analysis tool for maintaining code standards.
  • IPykernel 6.29.5: Jupyter notebook kernel for interactive analysis and documentation.
  • Data Visualization and Reporting
Interactive visualizations were generated using Plotly 6.0.0 with Kaleido 0.1.0.post1 for static image export capabilities. Additional data export functionality was provided through OpenPyXL 3.1.5 and xlrd 2.0.2 for Excel file handling.

Appendix B

Pipeline asset graph
Ijfs 13 00166 i001

References

  1. Addy, W. A., Ajayi-Nifise, A. O., Bello, B. G., Tula, S. T., Odeyemi, O., & Falaiye, T. (2024a). Algorithmic trading and AI: A review of strategies and market impact. World Journal of Advanced Engineering Technology and Sciences, 11(1), 258–267. [Google Scholar] [CrossRef]
  2. Addy, W. A., Ajayi-Nifise, A. O., Bello, B. G., Tula, S. T., Odeyemi, O., & Falaiye, T. (2024b). Machine learning in financial markets: A critical review of algorithmic trading and risk management. International Journal of Science and Research Archive, 11(1), 1853–1862. [Google Scholar] [CrossRef]
  3. Agliardi, E., Alexopoulos, T., & Karvelas, K. (2023). The environmental pillar of ESG and financial performance: A portfolio analysis. Energy Economics, 120, 106598. [Google Scholar] [CrossRef]
  4. Ahmad, S., Mohti, W., Khan, M., Irfan, M., & Bhatti, O. K. (2024). Creating a bridge between ESG and firm’s financial performance in Asian emerging markets: Catalytic role of managerial ability and institutional quality. Journal of Economic and Administrative Sciences, Preprint. [Google Scholar] [CrossRef]
  5. Alghizzawi, M., Al Shibly, M. S., Ezmigna, A. A. R., Shahwan, Y., & Binsaddig, R. (2024). Corporate social responsibility and customer loyalty from a literary perspective. In Studies in systems, decision and control (pp. 1083–1094). Springer Science and Business Media Deutschland GmbH. [Google Scholar] [CrossRef]
  6. Al-Refiay, H. A. N., Abdulhussein, A. S., & Al-Shaikh, S. S. K. (2022). The impact of financial accounting in decision making processes in business. International Journal of Professional Business Review, 7(4), 7. [Google Scholar] [CrossRef]
  7. Amole, O., & Emedo, M. (2025). Integrating environmental, social and governance (ESG) principles into financial planning for sustainable corporate growth. Asian Journal of Advanced Research and Reports, 19(1), 56–64. [Google Scholar] [CrossRef]
  8. Bamahros, H. M., Alquhaif, A., Qasem, A., Wan-Hussin, W. N., Thomran, M., Al-Duais, S. D., Shukeri, S. N., & Khojally, H. M. (2022). Corporate governance mechanisms and ESG reporting: Evidence from the Saudi stock market. Sustainability, 14(10), 6202. [Google Scholar] [CrossRef]
  9. Banerjee, S., Aggarwal, D., & Sengupta, P. (2025). Do stock markets care about ESG and sentiments? Impact of ESG and investors’ sentiment on share price prediction using machine learning. Annals of Operations Research. [Google Scholar] [CrossRef]
  10. Capelli, P., Ielasi, F., & Russo, A. (2021). Forecasting volatility by integrating financial risk with environmental, social, and governance risk. Corporate Social Responsibility and Environmental Management, 28(5), 1483–1495. [Google Scholar] [CrossRef]
  11. Cheng, L. T. W., Lee, S. K., Li, S. K., & Tsang, C. K. (2023). Understanding resource deployment efficiency for ESG and financial performance: A DEA approach. Research in International Business and Finance, 65, 101941. [Google Scholar] [CrossRef]
  12. Clementino, E., & Perkins, R. (2021). How do companies respond to environmental, social and governance (ESG) ratings? Evidence from Italy. Journal of Business Ethics, 171(2), 379–397. [Google Scholar] [CrossRef]
  13. Dai, Z., Zhou, H., Wen, F., & He, S. (2020). Efficient predictability of stock return volatility: The role of stock market implied volatility. The North American Journal of Economics and Finance, 52, 101174. [Google Scholar] [CrossRef]
  14. D’Amato, V., D’Ecclesia, R., & Levantesi, S. (2021). Fundamental ratios as predictors of ESG scores: A machine learning approach. Decisions in Economics and Finance, 44(2), 1087–1110. [Google Scholar] [CrossRef]
  15. D’Amato, V., D’Ecclesia, R., & Levantesi, S. (2022). ESG score prediction through random forest algorithm. Computational Management Science, 19(2), 347–373. [Google Scholar] [CrossRef]
  16. Del Gesso, C., & Lodhi, R. N. (2025). Theories underlying environmental, social and governance (ESG) disclosure: A systematic review of accounting studies. Journal of Accounting Literature, 47(2), 433–461. [Google Scholar] [CrossRef]
  17. Dincă, M. S., Vezeteu, C. D., & Dincă, D. (2022). The relationship between ESG and firm value. Case study of the automotive industry. Frontiers in Environmental Science, 10, 1059906. [Google Scholar] [CrossRef]
  18. Dincă, M. S., Vezeteu, C. D., & Dincă, D. (2023). Does withdrawal from/remaining in aggressor country affect companies’ ESG ratings? Case study of the Russia-Ukraine war. Frontiers in Environmental Science, 11, 1225084. [Google Scholar] [CrossRef]
  19. Ding, G., & Qin, L. (2020). Study on the prediction of stock price based on the associated network model of LSTM. International Journal of Machine Learning and Cybernetics, 11(6), 1307–1317. [Google Scholar] [CrossRef]
  20. Domanović, V. (2021). The relationship between ESG and financial performance indicators in the public sector: Empirical evidence from the Republic of Serbia. Management: Journal of Sustainable Business and Management Solutions in Emerging Economies, 27(1), 69–80. [Google Scholar] [CrossRef]
  21. Edmans, A. (2023). The end of ESG. Financial Management, 52(1), 3–17. [Google Scholar] [CrossRef]
  22. Faheem, M. A., Aslam, M., & Kakolu, S. (2021). Enhancing financial forecasting accuracy through AI-driven predictive analytics models. Iconic Research and Engineering Journals, 4(12), 322–328. [Google Scholar]
  23. Fang, T., Lee, T. H., & Su, Z. (2020). Predicting the long-term stock market volatility: A GARCH-MIDAS model with variable selection. Journal of Empirical Finance, 58, 36–49. [Google Scholar] [CrossRef]
  24. Guo, T., Jamet, N., Betrix, V., Piquet, L. A., & Hauptmann, E. (2020). ESG2Risk: A deep learning framework from ESG news to stock volatility prediction. arXiv, arXiv:2005.02527. [Google Scholar] [CrossRef]
  25. Hsu, W. L., Lin, Y. L., Lai, J. P., Liu, Y. H., & Pai, P. F. (2025). Forecasting corporate financial performance using deep learning with environmental, social, and governance data. Electronics, 14(3), 417. [Google Scholar] [CrossRef]
  26. Huang, D. Z. X. (2022). Environmental, social and governance factors and assessing firm value: Valuation, signaling and stakeholder perspectives. Accounting & Finance, 62(S1), 1983–2010. [Google Scholar] [CrossRef]
  27. Jia, Y., & Ma, J. (2024). Study on ESG performance and financial distress prediction of listed companies: Based on logistic regression and artificial neural network. International Business & Economics Studies, 6(6), 53. [Google Scholar] [CrossRef]
  28. Kräussl, R., Oladiran, T., & Stefanova, D. (2024). A review on ESG investing: Investors’ expectations, beliefs and perceptions. Journal of Economic Surveys, 38(2), 476–502. [Google Scholar] [CrossRef]
  29. Kuzmina, J., Maditinos, D., Norena-Chavez, D., Grima, S., & Kadłubek, M. (2023). ESG integration as a risk management tool within the financial decision-making process. In Digital transformation, strategic resilience, cyber security and risk management (pp. 105–113). Emerald Publishing Limited. [Google Scholar] [CrossRef]
  30. Lee, H., Kim, J. H., & Jung, H. S. (2024). Deep-learning-based stock market prediction incorporating ESG sentiment and technical indicators. Scientific Reports, 14(1), 10262. [Google Scholar] [CrossRef] [PubMed]
  31. Li, Y., Liang, C., Ma, F., & Wang, J. (2020). The role of the IDEMV in predicting European stock market volatility during the COVID-19 pandemic. Finance Research Letters, 36, 101749. [Google Scholar] [CrossRef]
  32. Liang, C., Ma, F., Li, Z., & Li, Y. (2020). Which types of commodity price information are more useful for predicting US stock market volatility? Economic Modelling, 93, 642–650. [Google Scholar] [CrossRef]
  33. Lim, T. (2024). Environmental, social, and governance (ESG) and artificial intelligence in finance: State-of-the-art and research takeaways. Artificial Intelligence Review, 57(4), 76. [Google Scholar] [CrossRef]
  34. Long, J., Chen, Z., He, W., Wu, T., & Ren, J. (2020). An integrated framework of deep learning and knowledge graph for prediction of stock price trend: An application in Chinese stock exchange market. Applied Soft Computing, 91, 106205. [Google Scholar] [CrossRef]
  35. Lu, W., Li, J., Wang, J., & Qin, L. (2021). A CNN-BiLSTM-AM method for stock price prediction. Neural Computing and Applications, 33(10), 4741–4753. [Google Scholar] [CrossRef]
  36. Luo, K., & Wu, S. (2022). Corporate sustainability and analysts’ earnings forecast accuracy: Evidence from environmental, social and governance ratings. Corporate Social Responsibility and Environmental Management, 29(5), 1465–1481. [Google Scholar] [CrossRef]
  37. Meng, Z. (2024). The impact of ESG reporting on analyst forecast accuracy: A cross-market review. Science, Technology and Social Development Proceedings Series, 2, 180–186. [Google Scholar] [CrossRef]
  38. Ming, K. L. Y., Vaicondam, Y., & Mustafa, A. M. A. A. (2024). ESG integration and financial performance: Evidence from Malaysia’s leading companies. International Journal of Energy Economics and Policy, 14(5), 487–494. [Google Scholar] [CrossRef]
  39. Momparler, A., Carmona, P., & Climent, F. (2024). Catalyzing sustainable investment: Revealing ESG power in predicting fund performance with machine learning. Computational Economics, Preprint. [Google Scholar] [CrossRef]
  40. Park, S. R., & Jang, J. Y. (2021). The impact of ESG management on investment decision: Institutional investors’ perceptions of country-specific ESG criteria. International Journal of Financial Studies, 9(3), 48. [Google Scholar] [CrossRef]
  41. Petrović, D., Radosavac, A., & Mashovic, A. (2023). Implications of applying fair value accounting to modern financial reporting. Journal of Process Management and New Technologies, 11(1–2), 22–33. [Google Scholar] [CrossRef]
  42. Pérez, L., Hunt, V., Samandari, H., Nuttall, R., & Biniek, K. (2022). Does ESG really matter-and why? Available online: http://www.registeredinvestor.com/ACCESS/Library/20220800_McKinsey.pdf (accessed on 18 March 2025).
  43. Ran, Z., Gul, A., Akbar, A., Haider, S. A., Zeeshan, A., & Akbar, M. (2021). Role of gender-based emotional intelligence in corporate financial decision-making. Psychology Research and Behavior Management, 14, 2231–2244. [Google Scholar] [CrossRef] [PubMed]
  44. Ravikumar, S., & Saraf, P. (2020, June 5–7). Prediction of stock prices using machine learning (regression, classification) algorithms. 2020 International Conference for Emerging Technology, INCET 2020, Belgaum, India. [Google Scholar] [CrossRef]
  45. Rossi, P., & Candio, P. (2023). The independent and moderating role of choice of non-financial reporting format on forecast accuracy and ESG disclosure. Journal of Environmental Management, 345, 118891. [Google Scholar] [CrossRef]
  46. Sattar, M. U., Dattana, V., Hasan, R., Mahmood, S., Khan, H. W., & Hussain, S. (2025). Enhancing supply chain management: A comparative study of machine learning techniques with cost–accuracy and ESG-based evaluation for forecasting and risk mitigation. Sustainability, 17(13), 5772. [Google Scholar] [CrossRef]
  47. Shah, S. F., Alshurideh, M. T., Al-Dmour, A., & Al-Dmour, R. (2021). Understanding the influences of cognitive biases on financial decision making during normal and COVID-19 pandemic situation in the United Arab Emirates. In The effect of coronavirus disease (COVID-19) on business intelligence (pp. 257–274). Springer International Publishing. [Google Scholar] [CrossRef]
  48. Song, Y., Li, R., Zhang, Z., & Sahut, J. M. (2024). ESG performance and financial distress prediction of energy enterprises. Finance Research Letters, 65, 105546. [Google Scholar] [CrossRef]
  49. Soni, P., Tewari, Y., & Krishnan, D. (2022). Machine Learning Approaches in Stock Price Prediction: A Systematic Review. Journal of Physics: Conference Series, 2161(1), 012065. [Google Scholar] [CrossRef]
  50. Trierweiler Ribeiro, G., Santos, A. A. P., Mariani, V. C., & dos Santos Coelho, L. (2021). Novel hybrid model based on echo state neural network applied to the prediction of stock price return volatility. Expert Systems with Applications, 184, 115490. [Google Scholar] [CrossRef]
  51. Upadhyay, S. (2024). Impact of environmental, social, and governance (ESG) factors on individual investor performance. International Journal of Scientific Research in Engineering and Management, 8(4), 1–5. [Google Scholar] [CrossRef]
  52. Vinothkumar, B., Janaki, A. N., & Lawrance, R. (2024). Futuristic trends in artificial intelligence AI and sustainable finance, AI and sustainable finance IIP series. AI and Sustainable Finance. [Google Scholar]
  53. Xu, J. (2024). AI in ESG for financial institutions: An industrial survey. Available online: https://arxiv.org/pdf/2403.05541 (accessed on 14 July 2025).
  54. Yu, P., & Yan, X. (2020). Stock price prediction based on deep neural networks. Neural Computing and Applications, 32(6), 1609–1628. [Google Scholar] [CrossRef]
  55. Zhang, Y., Wang, Y., & Ma, F. (2021). Forecasting US stock market volatility: How to use international volatility information. Journal of Forecasting, 40(5), 733–768. [Google Scholar] [CrossRef]
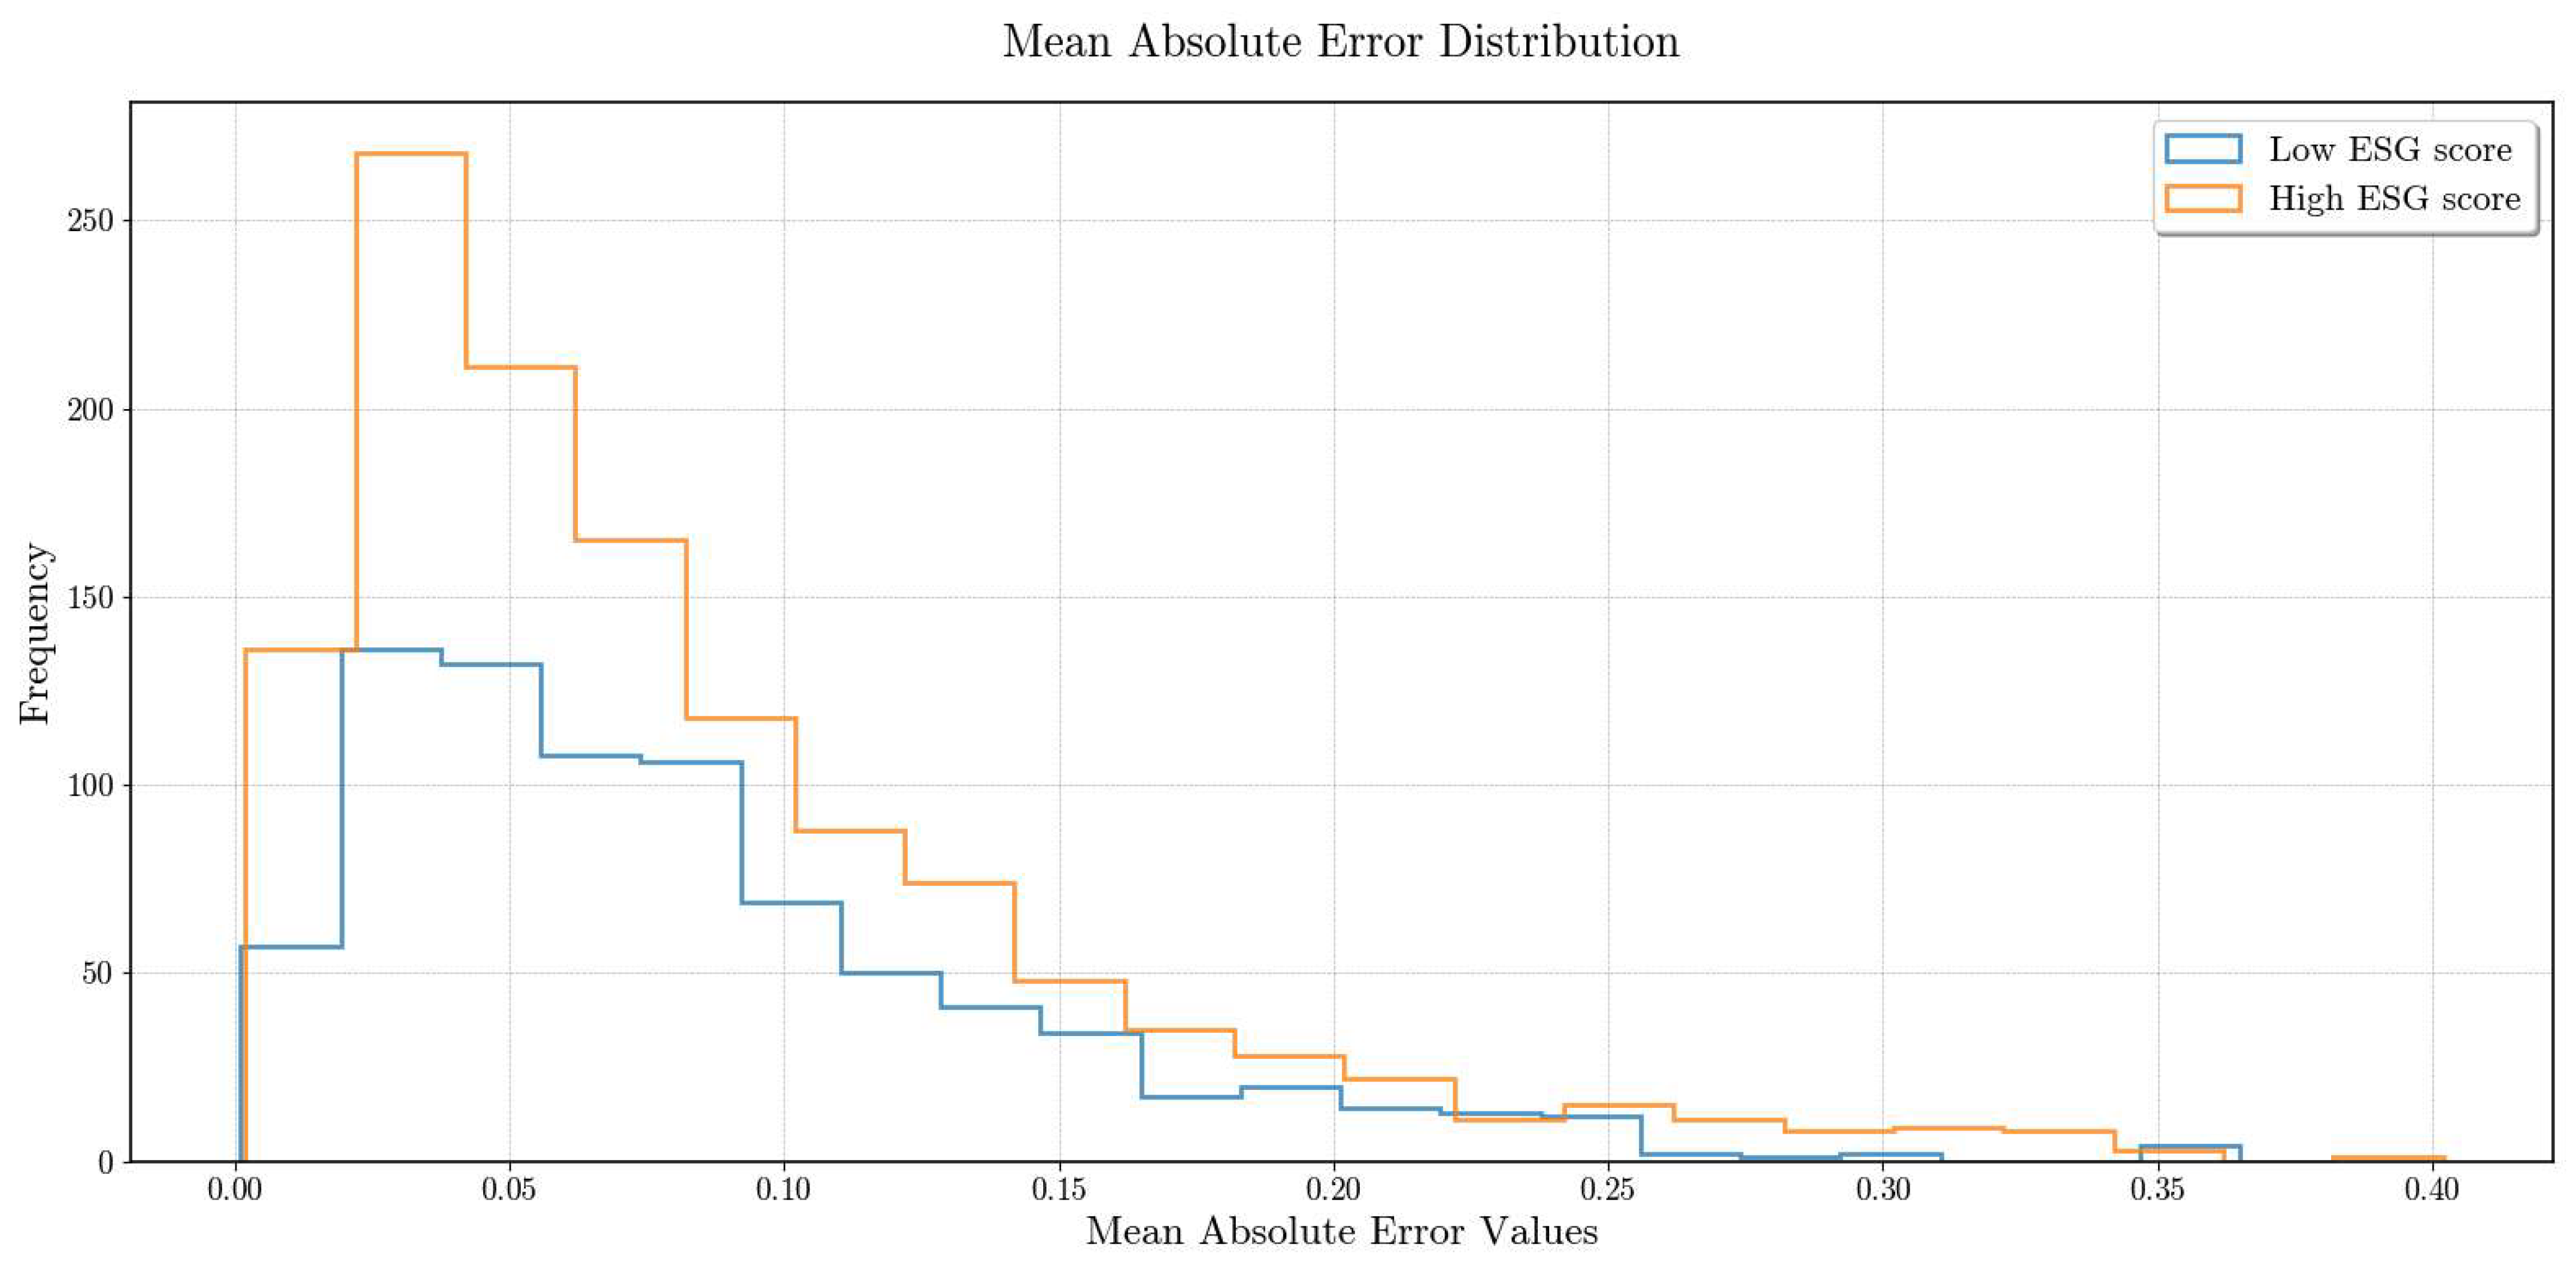
Figure 1. Mean Absolute Error Distribution.
Ijfs 13 00166 g001
Figure 2. Mean Squared Error Distribution.
Ijfs 13 00166 g002
Figure 3. Root Mean Squared Error Distribution.
Ijfs 13 00166 g003
Figure 4. Prediction for RIO.L—Rio Tinto PLC.
Ijfs 13 00166 g004
Figure 5. Prediction for BP.L—British Petroleum PLC.
Ijfs 13 00166 g005
Figure 6. Prediction for GLEN.L—Glencore PLC.
Ijfs 13 00166 g006
Table 1. Average results of all the ML models.
ModelMAEMAPEMSERMSE
ARIMA0.10240.17530.04290.1301
Elastic Net0.40510.51090.17440.4176
K-Nearest Neighbours0.19260.23350.04850.2202
Random Forest0.17120.20720.03870.1967
SVR 0.32200.40260.11400.3376
XGBoost0.16250.20270.03440.1856
Source: own elaboration.
Table 2. Student t-test and Levene’s test results on all error metrics.
MetricLow ESG High ESG Statistical TestValue
ESG Count15331533ESG Threshold61.2989
MAE
(Mean Absolute Error)
0.08390.0841Levene’s Test Statistic1.6751
Levene’s p-value0.1957
t-statistic−0.0666
p-value0.9469
Degree of freedom2063
MSE
(Mean Squared Error)
0.01460.0158Levene’s Test Statistic2.4673
Levene’s p-value0.1164
t-statistic−1.1044
p-value0.2695
Degree of freedom2063
R-squared−1.3091−1.2713Levene’s Test Statistic0.0433
Levene’s p-value0.8381
t-statistic−0.1556
p-value0.8764
Degree of freedom2063
RMSE
(Root Mean Squared Error)
0.09880.0987Levene’s Test Statistic1.9787
Levene’s p-value0.1597
t-statistic0.0261
p-value0.9792
Degree of freedom2063
Source: own elaboration.
Table 3. MAPE comparison with other studies.
PaperMAPEForecast Horizon (Days)
Our paper0.17530180
Sattar et al. (2025)0.00480365
D’Amato et al. (2021)0.037401
D’Amato et al. (2022)0.037351
Source: own elaboration.
Table 4. Student t-test on MAE across industrial sectors.
Industrial SectorNum. of CompaniesMAE
t-Stat
MAE
p-Value
MAE
Degrees of
Freedom
Business Services1402.03360.0438143
Real Estate; Mortgage Bankers and Brokers112−1.14600.2541117
Investment and Commodity Firms/Dealers/Exchanges1090.69920.4858114
Electronic and Electrical Equipment971.46120.1471100
Food and Kindred Products90−1.04730.297791
Commercial Banks, Bank Holding Companies86−0.58800.558090
Oil and Gas; Petroleum Refining810.74890.456084
Transportation and Shipping (except air)761.40060.165378
Drugs700.47320.637573
Metal and Metal Products680.90810.367069
Measuring, Medical, Photo Equipment; Clocks65−0.33870.736065
Machinery64−1.70520.092965
Telecommunications62−0.30130.764164
Prepackaged Software58−1.03910.302961
Insurance580.46650.642657
Transportation Equipment48−0.71940.475349
Wholesale Trade—Durable Goods44−0.35310.725646
Stone, Clay, Glass, and Concrete Products41−0.44860.656240
Wholesale Trade—Non-durable Goods351.13890.262535
Miscellaneous Retail Trade330.77090.446134
Computer and Office Equipment30−0.42870.671428
Retail Trade—General Merchandise and Apparel250.39270.698223
Health Services25−0.51680.610223
Printing, Publishing, and Allied Services170.72330.480615
Radio and Television Broadcasting Stations181.79100.092216
Communications Equipment16−0.51770.612814
Retail Trade—Eating and Drinking Places11−1.78640.10779
Retail Trade—Home Furnishings90.28600.78317
Motion Picture Production and Distribution7−0.08690.93425
Miscellaneous Manufacturing7−0.40910.69945
Leather and Leather Products6−0.38540.71964
Savings and Loans, Mutual Savings Banks30.15350.90301
Source: own elaboration.
Disclaimer/Publisher’s Note: The statements, opinions and data contained in all publications are solely those of the individual author(s) and contributor(s) and not of MDPI and/or the editor(s). MDPI and/or the editor(s) disclaim responsibility for any injury to people or property resulting from any ideas, methods, instructions or products referred to in the content.