Article

Time-Varying Efficiency and Economic Shocks: A Rolling DFA Test in Western European Stock Markets

by
Christophe Musitelli Boya
Haute École de Gestion de Genève, Universtiy of Applied Sciences and Arts of Western Switzerland (HES-SO), 1211 Geneva, Switzerland
Int. J. Financial Stud. 2025, 13(3), 157; https://doi.org/10.3390/ijfs13030157
Submission received: 22 June 2025 / Revised: 4 August 2025 / Accepted: 15 August 2025 / Published: 26 August 2025

Abstract

This paper investigates the time-varying efficiency of Western European stock markets and examines how macroeconomic events defined as endogenous and exogenous shocks influence the degree of efficiency by either long-range dependence or mean reverting. We apply a rolling-window detrended fluctuation analysis (DFA) with two window sizes, complemented by the Efficiency Index to synthetize multiple measures of market efficiency. The results confirm that efficiency evolves dynamically in response to macroeconomic disruptions. Specifically, endogenous shocks tend to generate anti-persistent behavior, while exogenous shocks are associated with long-memory effect. These shifts in efficiency are also reflected in rolling Kurtosis estimates, suggesting that only the most severe shocks produce spikes in Kurtosis, fat-tailed returns distributions, and structural inefficiencies. This dual approach allows us to classify shocks as major or minor based on their joint impact on both market efficiency and tail behavior. Overall, our findings support the adaptive market hypothesis and extend its implications through the fractal market hypothesis by underlining the role of heterogenous investment horizons during periods of turmoil. The combined use of dynamic DFA and Kurtosis offer a framework to assess how financial markets adapt to different types of macroeconomic shocks.

1. Introduction

The efficient market hypothesis (EMH), as introduced by Fama (1970), claims that “a market is efficient if prices always fully reflect all available information”, implying no consistent predictability or autocorrelation. Fama distinguishes three forms of efficiency based on the subset of information considered. The weak form relates to forecasting returns from past returns, the semi-strong form focuses on the speed of price adjustment to public announcements, and the strong form tests private information. In its weak form, the EMH implies that price movements are uncorrelated over time, following a random walk. However, this assumption has been widely questioned, and despite a growing literature on the subject, no consensus has emerged (Boya, 2017).
In this context, the adaptive markets hypothesis (AMH) proposed by Lo (2004) offers a valuable alternative to the EMH. Rather than assuming a fixed level of market efficiency, the AMH suggests that financial markets evolve over time, adapting to changing environments in a manner similar to biological systems. Under this framework, efficiency is not binary but continuous and context dependent. Market participants exhibit bounded rationality, follow self-interest, make mistakes, learn, and adapt to environments. Consequently, inefficiencies can emerge temporarily, persist for a while, fade, and potentially reappear as market conditions evolve. This perspective reconciles anomalies observed during crises by allowing efficiency to fluctuate dynamically in response to environmental changes.
Market behavior is shaped by external conditions, and adaptation depends on the type and intensity of environmental changes. Factors influencing market conditions include regulatory changes, investor learning, and macroeconomic disruptions such as bubbles, cycles, and crashes, which temporarily reduce or enhance efficiency. A key distinction in this context is between the nature of shocks. In economics, it is generally accepted to differentiate between two types of market shocks depending on their origins: first, exogenous shocks, which originate outside the economic and financial system (such as the COVID-19 pandemic) and typically arise abruptly and impact the entire market; and second, endogenous shocks, which emerge within the economic and financial structure itself (such as the subprime mortgage crisis) and are also sudden and destabilizing.
This adaptive view implies that empirical methods capable of capturing time-varying dynamics are particularly appropriate to assess market efficiency. While previous studies have tested the AMH using econometric tools (such as variance ratio tests) (Lo & MacKinlay, 1988), autocorrelation analysis, or the Hurst exponent (Hurst, 1951) (based on full-sample analysis), these approaches often fail to capture the evolving nature of efficiency under real market conditions. To address this limitation, recent studies have explored nonlinear, time-varying techniques designed to assess long-range dependence in non-stationary time series. Among these, the Hurst exponent and its derivatives (such as rolling modified rescaled range, detrended fluctuation analysis, multifractal analysis) have become widely used for measuring serial correlation beyond short-term noise. These tests allow for formal rejection of weak-form efficiency under the AMH framework and differentiate between long-range dependence (persistence) and anti-persistence (mean reversion), offering a nuanced view of market dynamics in response to economic shocks.
This paper investigates whether the degree of efficiency in Western European financial markets evolves over time in response to different types of macroeconomic shocks. Western European markets were selected for this study due to their high degree of financial integration, macroeconomic interdependence, and exposure to common regulatory frameworks, particularly within the Euro area. These markets have experienced a combination of significant endogenous (e.g., Eurozone crisis) and exogenous shocks (e.g., COVID-19 pandemic, geopolitical tensions), making them ideal for analyzing time-varying efficiency under different regimes. The availability of consistent historical data also facilitates robust application of the DFA methodology across comparable institutional settings. Specifically, we assess how endogenous and exogenous shocks influence the persistence or anti-persistence of financial returns during the period 2001–2024. The empirical analysis covers eight major European stock indices using a rolling-window DFA and the Efficiency Index (Kristoufek, 2012). In line with the AMH, we hypothesize that both exogenous or endogenous disturbances lead to persistent inefficiency characterized by either the presence of long-range dependence or mean reversion, as captured by DFA exponents and their t-statistics. This reflects the idea that the nature of shock affects not only the magnitude but also the temporal structure of market inefficiency. To our knowledge, the European literature applying rolling DFA to test the AMH is limited. Existing studies tend to focus on a single market or use static approaches that fail to capture the dynamic evolution of efficiency. For example, while Ferreira (2020), Tripathi et al. (2020), and Sensoy and Tabak (2016) documented efficiency fluctuations in Swiss, UK, and French markets, none employ a unified, cross-country rolling DFA with systematic classification of shocks as endogenous or exogenous.
This study contributes to the literature by (i) providing a comprehensive, dynamic comparative analysis of multiple European markets using daily data and a consistent methodology. While long-range dependence in European markets has been studied using multifractal analysis, or variance ratios tests, and static Hurst estimation, dynamic analysis using the DFA across a large sample of developed European markets remains scarce. We also assess the robustness of the DFA results across different window sizes. In addition to the Hurst exponent derived from the DFA, we compute the Efficiency Index (EI), which aggregates multiple efficiency indicators (long memory, entropy, autocorrelation) into a single standardized measure. This enables cross-market comparison and provides a synthetic perspective on resilience and recovery after major shocks. Then, (ii) we explicitly evaluate the impact of major global shocks on efficiency. The 20-year sample period allows us to study several macroeconomic disturbances and their heterogenous impacts on individual markets, enabling a ranking and classification of shocks based on their influence. Afterwards, (iii) we extend the analysis to the fractal market hypothesis (Peters, 1994), which complements the AMH by offering a microstructural explanation of time-varying efficiency. During crises, the dominance of short-term over long-term traders increases volatility, and reduces liquidity, leading to anti-persistence. We propose a new hypothesis on the role of different investment horizons in response to economics disruptions, building on Kristoufek (2012). Finally, (iv) we interpret these results through the lens of the adaptive markets hypothesis, offering new insights into the evolving nature of financial market behavior and the conditions under which market efficiency holds or fails. This dynamic pattern illustrates how the degree of market efficiency evolves in response to macroeconomic and financial events, in line with the AMH. Moreover, by employing a nonlinear dynamic, we bridge the AMH and FMH by revealing how fractal properties of each market adjust to different types of shocks.
Our results align with the adaptive markets hypothesis (Lo, 2004, 2005), demonstrating that markets adapt differentially depending on the type and severity of environmental changes. Efficiency evolves dynamically in response to major disturbances, with adjustment patterns varying across markets and shock types. While major endogenous crises often generate mean-reverting behavior, major exogenous shocks are associated with stronger long-range dependence. These heterogeneous reactions highlight the crucial role of structural characteristics in shaping market responses. Furthermore, the results reinforce the adaptive nature of financial markets and provide empirical support for the FMH, showing that major economic disruptions create specific dependence structures linked to the varying roles of long-term and short-term investors.
The remainder of this paper is organized as follows. Section 2 reviews the related literature and outlines the theoretical background. Section 3 describes the methodological framework through the DFA methodology and the dynamic approach using different rolling windows. Section 4 reports the empirical findings for the DFA exponents, the t-statistics, and the Efficiency Index. Section 5 discusses the results in light of the adaptive markets hypothesis and the fractal market hypothesis. Section 6 concludes the paper.

2. Literature Review

The EMH has long served as a cornerstone of financial theory, through the definition of Fama (1970). Nevertheless, the rigidity of this framework has been increasingly challenged by empirical evidence, notably from the early contributions of Mandelbrot (1972) and the fractal approach, which highlighted the presence of long-range dependence in financial markets. Empirical studies have since documented time-varying degrees of efficiency, particularly during periods of financial instability. In response, Lo (2004, 2005) introduced the AMH, which combines principles of rationality with insights from behavioral finance and evolutionary theory. According to the AMH, financial markets are not perpetually efficient; rather, they evolve dynamically as investors adapt to changing environments and learn from their mistakes. Market efficiency thus becomes context-dependent, influenced by factors such as technological innovation, investor psychology, regulatory changes, and macroeconomic shocks.
A growing body of empirical research supports the AMH by documenting time-varying behavior in market efficiency, especially surrounding major economic disruptions (Alvarez-Ramirez et al., 2008; Kim et al., 2011; Urquhart & Hudson, 2013; B. Zhang et al., 2013; Ferreira, 2020; Aslam et al., 2020; Aslam et al., 2021; Asif & Frömmel, 2022; Boya, 2023). Such shocks often lead to increased volatility, heightened information asymmetry, and behavioral biases, which collectively distort the adaptive capacity of financial markets (Balcilar et al., 2017; Akhtaruzzaman et al., 2021).
Most of these studies highlight the use of dynamic methodologies capable of capturing evolving market behavior over time, focusing on how markets respond and adapt to shocks. Among such approaches, the Hurst exponent and its derivatives, particularly the generalized Hurst exponent, detrended fluctuation analysis, and multifractal detrended moving average, have emerged as robust econometric tools for measuring dependence in financial time series. The Hurst exponent offers three main interpretations. A value near 0.5 indicates random walk behavior and informational efficiency. A value greater than 0.5 signals persistence (H > 0.5). A value below 0.5 indicates anti-persistence or mean-reversion (H < 0.5). Both persistence and anti-persistence imply deviations from efficiency (Peng et al., 1994; Kantelhardt et al., 2002). These tools have become prominent in financial econometrics due to their ability to detect power-law correlations in non-stationary data.
Findings across regions and methodologies generally support the AMH, suggesting that market efficiency evolves dynamically, particularly in response to major economic events. However, prior research has rarely distinguished between endogenous and exogenous shocks, and the impacts of these shocks on long-range dependence or mean-reversion remain ambiguous.
In North America (United States and Mexico), Cajueiro and Tabak (2004), Ammy-Driss and Garcin (2021), and Sensoy and Tabak (2016) document cyclical patterns in efficiency linked to crises and liquidity shifts using the Hurst exponent. These results are consistent with multifractal-based analyses by Kristoufek (2012) and Horta et al. (2014). In South America (Brazil and Chile) and South Asia (India), studies using a Hurst analysis report persistent inefficiencies during turbulent periods (Cajueiro & Tabak, 2004; Da Silva et al., 2007; Sensoy & Tabak, 2016). In East Asia, Ma et al. (2016), applying DFA to Chinese markets, and Takaishi (2022), using a multifractal framework for Japan, observe that both the Asian financial crisis and the 2008 subprime crisis triggered significant anti-persistent dynamics, findings also confirmed by Sensoy and Tabak (2016) and Cajueiro and Tabak (2004). Turning to European markets, empirical literature demonstrates that periods of heightened economic uncertainty coincide with clear deviations from informational efficiency. However, the application of rolling DFA to developed European markets remains limited, especially regarding robustness checks across multiple window lengths—a gap this study aims to address. Aslam et al. (2020) identify a strong relationship between multifractality in several central Eastern European stock markets and the macroeconomic disruptions. Horta et al. (2014), using a multifractal framework, find increased long-range dependence or anti-persistence during crises in France, the UK, and Portugal. Similarly, Ammy-Driss and Garcin (2021), Ferreira (2018, 2020)1, and Sensoy and Tabak (2016) report mean-reverting behavior during the subprime crisis and the COVID-19 pandemic in France, the UK, Sweden, and Switzerland.
Despite a general consensus on the dynamic nature of market efficiency, the literature remains divided regarding the mechanisms driving these changes, particularly how economic shocks influence market behavior post-disruptions. Regarding the endogenous subprime shock, Horta et al. (2014) observe an increasing Hurst exponent during the crisis, interpreted as reduced liquidity and diminished efficiency. Conversely, Kristoufek (2012, 2013), Ammy-Driss and Garcin (2021), and Ferreira (2018) highlight mean-reverting behavior. Kristoufek (2012, 2013) attributes anti-persistence to increased trading by short-horizon investors during turbulent times. During the exogenous COVID-19 shock, Aslam et al. (2020) report that markets shifted from persistent to anti-persistent. Ammy-Driss and Garcin (2021) and Ferreira (2018, 2020) similarly underline a mean-reverting phenomenon.
Recent studies have also highlighted significant disruptions to efficiency during the pandemic. For example, D. Zhang et al. (2020) report increased volatility and persistent inefficiencies in global stock markets during its initial stages. Ozkan (2021), using variance ratio tests on daily stock market data, finds that markets, particularly in major developed economies such as the US and UK, deviated from efficiency and became more speculative. These findings support the interpretation of COVID-19 as a major exogenous shock with adaptive consequences for financial markets.
To address the gap in the literature, this study applies a rolling-window DFA to examine how European stock markets adapt to different types of macroeconomic shocks, explicitly distinguishing between endogenous and exogenous events. By tracking time-varying Hurst exponents, we capture transitions between persistence and anti-persistence, thereby identifying shifts in market efficiency over time. To facilitate cross-market comparisons, we complement this analysis with Kristoufek’s Efficiency Index. The next section details the methodological framework.

3. Methodology

3.1. The Detrended Fluctuation Analysis and Efficiency Index

We follow the detrended fluctuation analysis by Peng et al. (1994), which removes the local trends through the least square regression fit. The first step involves transforming the returns time series x t into a cumulative profile y i , allowing one to examine the dynamics of fluctuations:
y i = t = 1 i x t x ¯ ,   f o r   i = 1 , 2 , , N
where x ¯ = N 1 · t = 1 N x t is the sample mean of the returns, and N is the length of the time series. Then, this new series is divided into N n = N n non-overlapping boxes of equal lengths n . In some cases, the length N of the series is not a multiple of the time scale n . Therefore, a short part at the end of the profile will remain. In order to consider this part of the series, the same procedure is repeated started from the end. Therefore, 2 N n boxes are obtained. In each box, a local trend function is fitted using ordinary least squares. The integrated time series y i is detrended by subtracting the local trend function in each box. The residual series ε i is divided into N n overlapped boxes with the same size n , where N n = N n 1 . Each box can be denoted as ε v = ε l + i for 1 i n , respectively, where l = v 1 n . The local fluctuation function F v n of the v t h box is defined as the root mean square of the residuals (RMS):
F v 2 n = n 1 · i = 1 n ε v 2 i
The overall fluctuation function F n is calculated as the root mean square of the detrended time series as a function of the segments size n .
F n = N n 1 · v = 1 N n F v 2 n 1 2
As the box size n varies in proper scaling ranges, the results display the power-law relation between the function F n and the box size n such that F n ~ n H , where H represents the DFA scaling exponent (or Hurst exponent). This parameter provides information about the existence or not of long-range dependence of the time series. Therefore, there are three different conclusions following the exponent value:
-
When H = 1 2 , the time series exhibits no long-range dependence, consistent with the unpredictability of returns and the efficient market hypothesis.
-
When 1 > H > 1 2 , the time series shows positive long-range dependance, indicating persistence or long memory in returns.
-
If H < 1 2 , the time series displays negative long-range dependance, characterized by a mean-reverting process or anti-persistence.
Given that the DFA exponent is derived from an ordinary least squares regression, it is possible to test the statistical significance of the Hurst exponent. Under the null hypothesis of H = 1 2 , the t-statistic is given by:
t = H ^ 1 2 σ H ^
where H ^ is the estimated parameter of the Hurst exponent, and σ H ^ the respective standard deviation. The t-statistic converges to a normal distribution. Lastly, to compare our analysis with those of Ferreira (2018) and Kristoufek and Vosvrda (2013a, 2013b), we apply their framework by evaluating the Efficiency Index, defined as:
E I = i = 1 n M ^ i M i * R i 1 2
where M i is the i-th measure of efficiency, M ^ i is an estimate of the i-th measure, M i * is an expected value of the i-th measure for the efficient market, and R i is a range of the i-th measure. The efficiency measure is defined as a distance from the efficient market specification based on various measures of the market efficiency, where the Hurst exponent is an expected value of 1/2 for the efficient market such that M H * = 1 2 . According to authors, the closer the efficiency index is to zero, the more efficient the market is.

3.2. Dynamic Approach Using Rolling Windows

In order to capture the evolution of time series dynamics, we employ a rolling window approach, which can detect the changing degree of market efficiency over time. This method has been widely used to investigate various aspects of efficiency. It enables cross-market comparisons; identification of market-specific reactions to major events such as crashes, bubbles, or crises; and an examination of efficiency during pre-crisis, crisis, and post-crisis periods. Thus, the rolling window procedure provides valuable insights into the dynamics of market efficiency and the evolving behavior of European stock markets across both stable and turbulent phases.
Choosing an appropriate rolling window size is crucial in a dynamic DFA framework, as it significantly affects the detection quantification of long-range dependence. Several studies have employed a 4-year time window, corresponding to approximatively 1000 trading day (Sensoy & Tabak, 2016; Ma et al., 2016; Ferreira, 2018, 2020; Boya, 2019; Tripathi et al., 2020). This duration aligns with the average length of political mandates in many countries, particularly in Europe or Noth America, which typically range from 4 to 5 years. For example, members of the European Parliament as well as French and Italian deputies serve 5-year terms, whereas deputies in the German Bundestag and the Spanish Congress are elected for 4 years. Similarly, in North America, the Canadian federal parliamentarians and the President of the United States also serve 4-year mandates. Other studies have used shorter or longer windows: some range between 64 and 736 observations (Rogério et al., 2003; Engelen et al., 2011; Hiremath & Narayan, 2016), while others have adopted windows of 1250 to 2500 observations (Cajueiro & Tabak, 2004; Morales et al., 2012; Boya, 2023).
Matos et al. (2004) found that exponents become more stable with larger windows, which is consistent with theoretical expectations since more observations reduce statistical dependence. Kristoufek (2010) compared rescaled range analysis and DFA, noting that longer windows reduce variance in the estimates but risk masking dynamic shifts in market behavior. Similarly, Alvarez-Ramirez et al. (2008) applied rolling DFA on US stock markets and found that smaller windows are more responsive to local fluctuations but produce greater variability in Hurst exponent estimates. Results indicate that larger windows stabilize estimates by incorporating more observations, reducing estimation noise, and smoothing out short-term variations. However, this increased stability may come at the expense of overlooking sudden structural changes in the data.
Grech and Mazur (2004) examined local Hurst exponent using sliding windows, observing that very short windows produce highly volatile estimates that can detect abrupt shifts but may also lead to false alarms due to noise.
Conversely, longer windows generate more stable estimates but may delay the detection of emerging trends. Zunino et al. (2009) studied Latin American market indices and applied a dynamic Hurst estimation. Their findings demonstrated that the estimated long-memory parameters are highly sensitive to the window size, with shorter windows capturing transient episodes of market inefficiency during periods of instability, whereas longer windows produced smoother, more persistent measures of long-range dependence. Boya (2019, 2023) highlighted some discrepancies in results depending on window size and statistics (modified Hurst exponents, variance ratio tests). Using Hurst exponents, inefficiency periods associated with major macroeconomic events are consistently observed regardless of the window size (1000, 1500, or 2000 observations). The author observed that with a 2000-observation sample, estimates became very stable, but this stability came at the expense of detecting short-term structural breaks, which tend to be smoothed out with larger windows. Ferreira (2018), using a DFA procedure, confirmed that results were not substantially different across window of 500, 1000, or 2000 observations. Grech and Mazur (2004) tested multiple window sizes and concluded that a window of approximatively 1000 trading days offers a reasonable compromise between sensitivity to local changes and statistical reliability.
Selecting an appropriate window size is therefore essential for accurately assessing market efficiency and long-range dependence. Based on these insights, we estimate DFA exponents using two different window sizes: 1000 and 1500 trading days. For a window length of w = 1000 observations, the analysis begins with the Hurst exponent H 1 from t = 1 , , w . The windows then rolls forward by one observation, and H 2 is estimated from t = 2 , , 1001 , continuing in this way until the final value H n w + 1 , estimated from t = i n w + 1 , , n . The same procedure applies to the 1500-day window ( w = 1500). Rolling windows thus generate a large set of Hurst exponent estimates and corresponding t-statistics, enabling a more robust comparison of the evolution of market efficiency across different stock markets.
Following standard practice in rolling window DFA (Sensoy & Tabak, 2016; Ferreira, 2020), the Hurst exponent estimate at time t corresponds to the window ending at time t, capturing the local memory behavior of returns up to day t.
This indexing reflects time series properties up to the most recent observation and is particularly appropriate when aligning changes in market efficiency with known economic or financial events. This convention ensures chronological coherence in the analysis and maintains comparability with previous empirical studies. Alternative labeling methods (e.g., midpoint-based, etc.) are not employed in the literature and would introduce unnecessary misalignment between estimated efficiency patterns and real-world timing of shocks. We therefore maintain the standard right-aligned indexation used in DFA studies.

4. Empirical Results

4.1. Data

This study analyzes daily adjusted closing prices of eight European stock market indices: France, Belgium, Germany, Italy, Spain, the Netherlands, Switzerland, and the UK. The dataset, obtained from “investing.com”, spans more than two (2001 to 2024), providing a long horizon to capture macroeconomic events and their impact on market efficiency. These events include the 2008 global financial crisis, the COVID-19 pandemic, the war in Ukraine, and the recent inflationary shock. Daily returns for each market index are estimated as the logarithmic differences between consecutive prices:
r t = l n p t l n p t 1
where r t is the daily rate return, and p t is the daily price of each index at time t. Descriptive statistics for these indices are represented in Appendix A. Across all markets, financial returns tend to fluctuate around zero, reflecting typical short-term behavior. The standard deviations suggest relatively homogenous levels, except for Italy, which appears more volatile. The minimum and maximum values indicate the presence of extreme fluctuations, consistent with the occurrence of major financial events during the sample period. All indices display negative skewness, indicating that large negative returns occur more frequently than large positive ones. Furthermore, kurtosis values exceed 3 across markets, highlighting heavy-tailed return distributions and the occurrence of extreme events. The Jarque–Bera test rejects the null hypothesis of normality for all indices, confirming the leptokurtic nature of financial returns. These results are consistent with stylized facts commonly observed in financial time series.
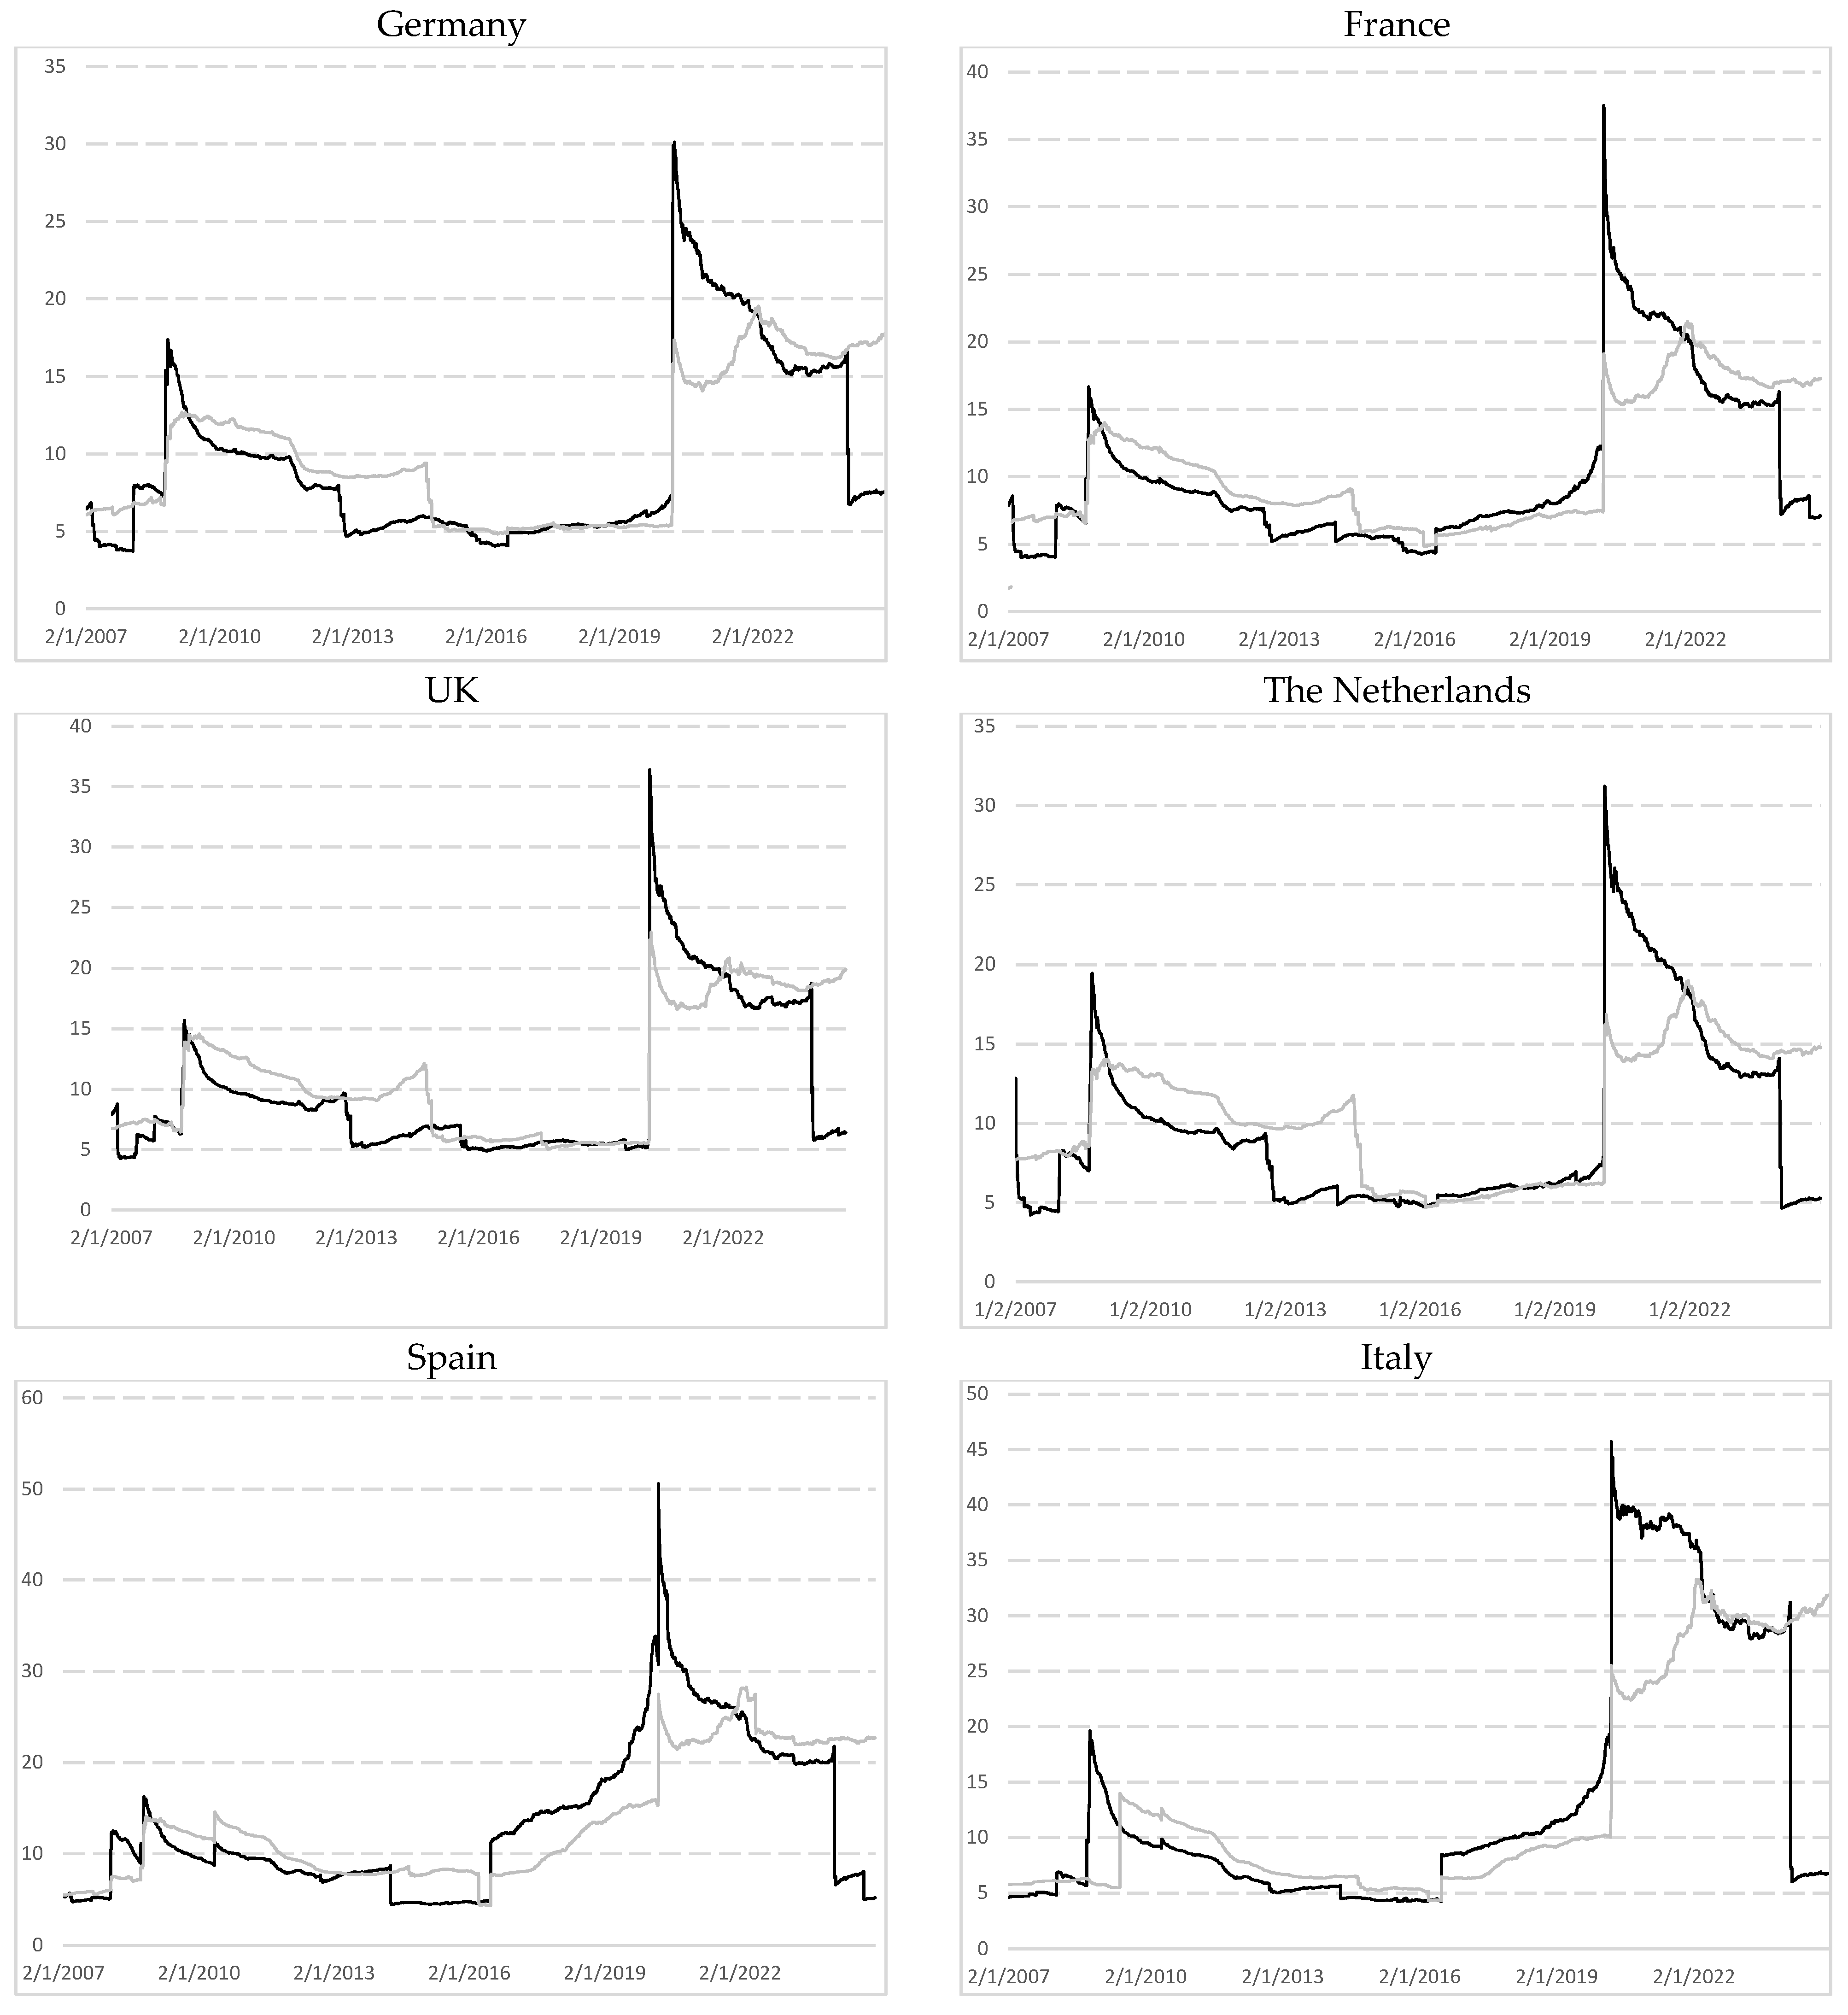
Figure A1 in Appendix B depicts the rolling kurtosis values computed using overlapping window of 1000 and 1500 observations. Few studies have examined the dynamic evolution of kurtosis over time. In the figure, black and grey lines represent estimates for window sizes of 1000 and 1500 observations, respectively. The results reveal similar patterns across markets, with higher kurtosis values clustering during periods of financial turmoil. In particular, kurtosis spiked significantly during the subprime mortgage crisis and the COVID-19 pandemic, reaching values of 30 to 35 for France, Germany, the UK, and the Netherlands; and exceeding 45 for Italy, Spain, and Belgium. Switzerland exhibited more stability, with kurtosis remaining below 25 during the pandemic when using a 1000-day window. During the subprime mortgage crisis, kurtosis peaks were generally lower, ranging between 15 and 20. These spikes are more pronounced with a 1000-day window than with a 1500-day window, indicating that longer windows smooth extreme returns and volatility. The 1000-observation curve shows sharper and more reactive peaks, particularly in early 2009 and early 2020, whereas the 1500-observation curve produces a smoother profile, mitigating the impact of extreme values.
Between major crises, kurtosis values gradually return to a range of 5–10, regardless of the window size. Notably, after the COVID-19 crisis, kurtosis remains elevated compared to pre-2020 levels, suggesting a sustained period of excess kurtosis in return distributions. These findings will be further examined alongside the Hurst exponent to evaluate whether high-kurtosis periods correspond to lower levels of market efficiency.

4.2. Statistics Results

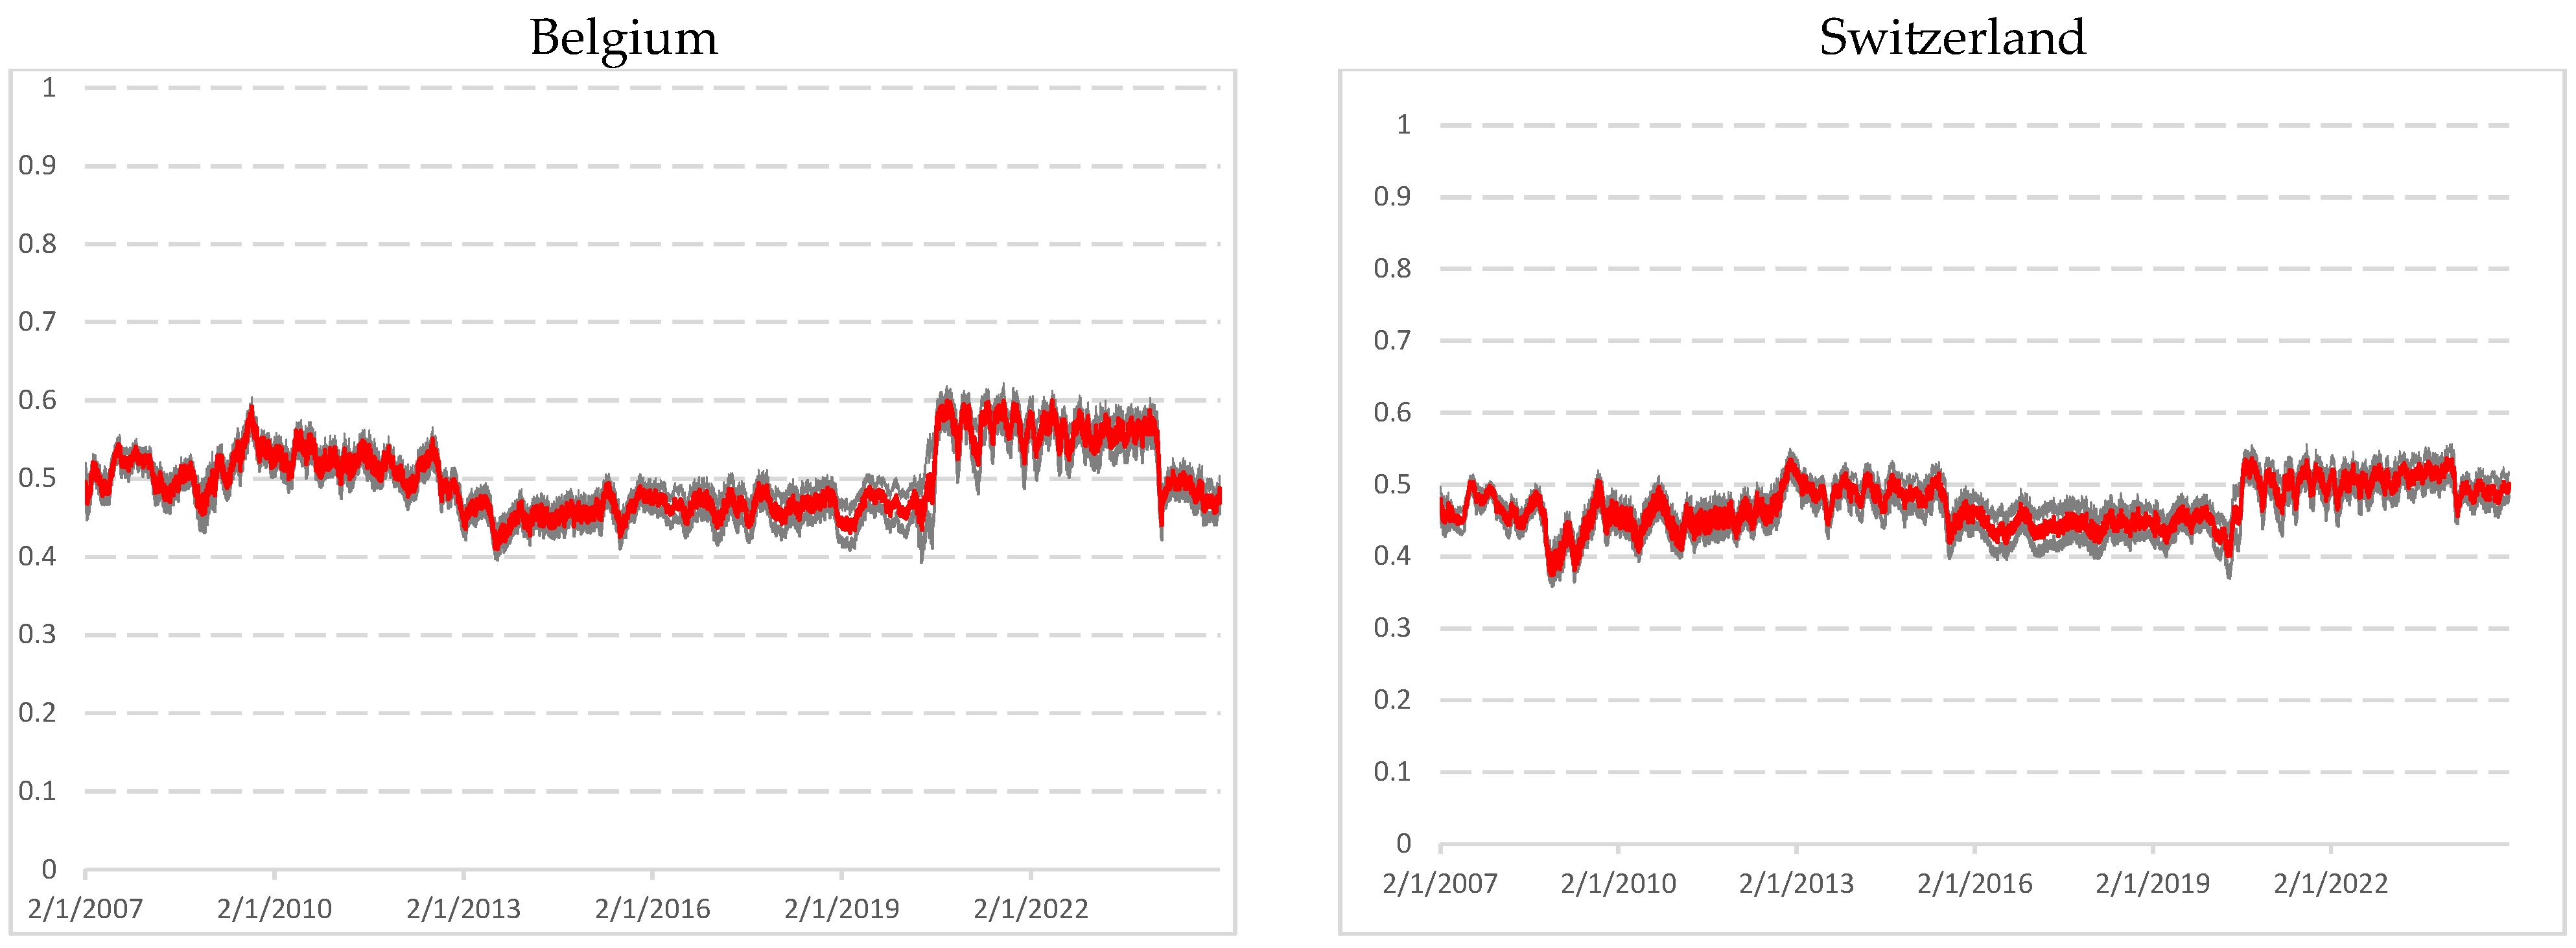
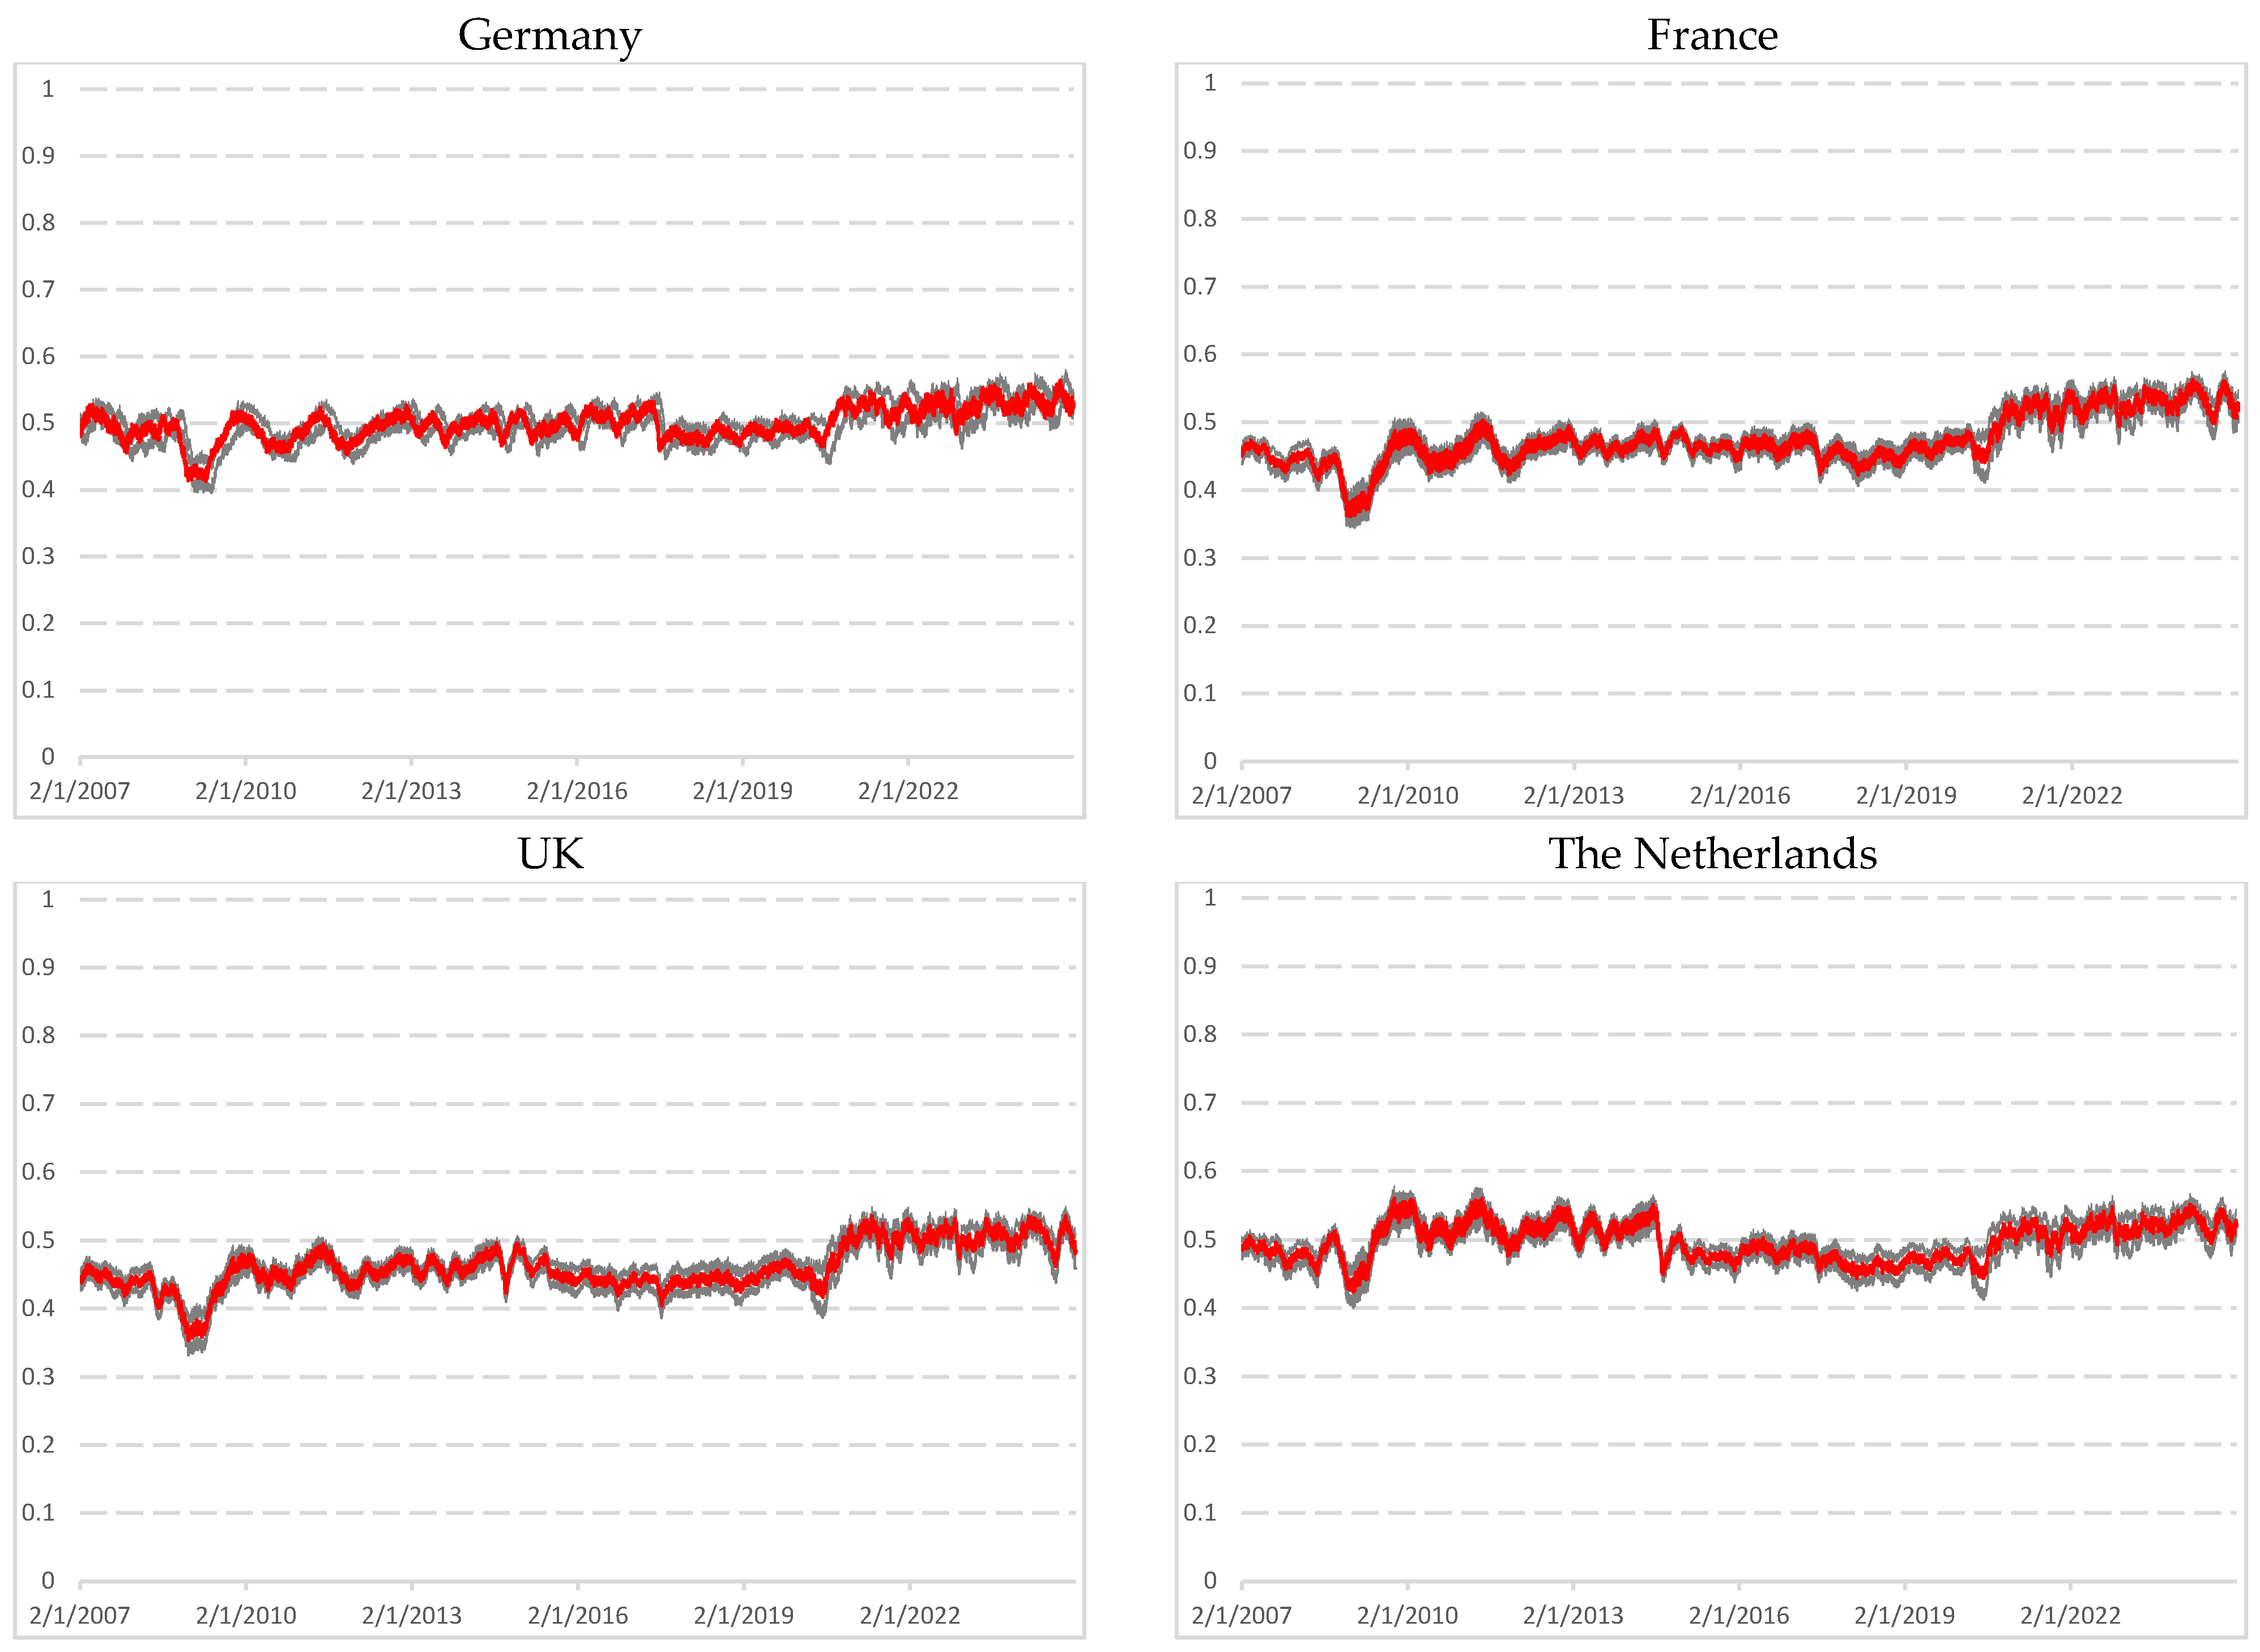
The following figures present the DFA exponent results for different stock market indices. In these figures, the red line represents the evolution of DFA estimates over time, while the grey series represent the standard deviation of the DFA estimations. Using a window length w = 1000 , the results show that indices exhibit a relatively stable evolution of the DFA exponents around the 0.5 threshold, suggesting that European stock markets are globally efficient, consistent with the weak form of the efficient market hypothesis.
Nevertheless, noticeable deviations from 0.5 are observed across all indices, often occurring simultaneously and corresponding to major macroeconomics events. Figure 1 highlights several interesting patterns. During the subprime mortgage crisis (2007–2009), Hurst exponents indicate a mean-reverting process, followed by spikes in long-range dependence for Italy and Belgium. From 2009 to 2019, the exponents remain relatively stable, indicating a return to near-efficiency. This period also shows a slight negative long-range dependence, which can partly be attributed to the low-interest-rate environment maintained by the European Central Bank, potentially mitigating market turbulences during the European sovereign debt crisis (2010–2012).
A sharp increase in the Hurst exponent appears in early 2020, coinciding with the outbreak of COVID-19. The values rise significantly above 0.5, indicating a positive autocorrelation and substantial departure from market efficiency. This behavior likely reflects a slower adjustment to information driven by heightened uncertainty and market stress during the pandemic.
From late 2021 onward, following the pandemic, the Hurst exponents remain elevated above 0.5. This period coincides with new economic events, such as inflationary pressures, the subsequent rise in interest rates, and geopolitical tensions (war in Ukraine). These factors may have introduced structural breaks and contributed to increase market volatility. By 2024, the Hurst values decline again toward 0.5, signaling a potential return to efficiency despite the ongoing Russia–Ukraine conflict.
When using a longer rolling window of 1500 observations (Figure 2), the evolution of the DFA exponents appears notably smoother over time. The smoothing effect reduces noise from short-term fluctuations and emphasizes underlying structural behaviors. Major macroeconomic events are still clearly reflected in DFA dynamics, but they appear less erratic and more persistent compared to the results using a 1000-observation window. Periods of mean reversion during the subprime crisis and long-range dependence during the COVID-19 pandemic are more distinctly delineated, suggesting that the 1500-day window facilitates a clearer identification of inefficiency patterns. Conversely, the 1000-day window is more sensitive to short-term noise, which can obscure these longer-term dynamics. Nonetheless, a slight tendency toward negative autocorrelation is still observed during the 2009–2019 period.
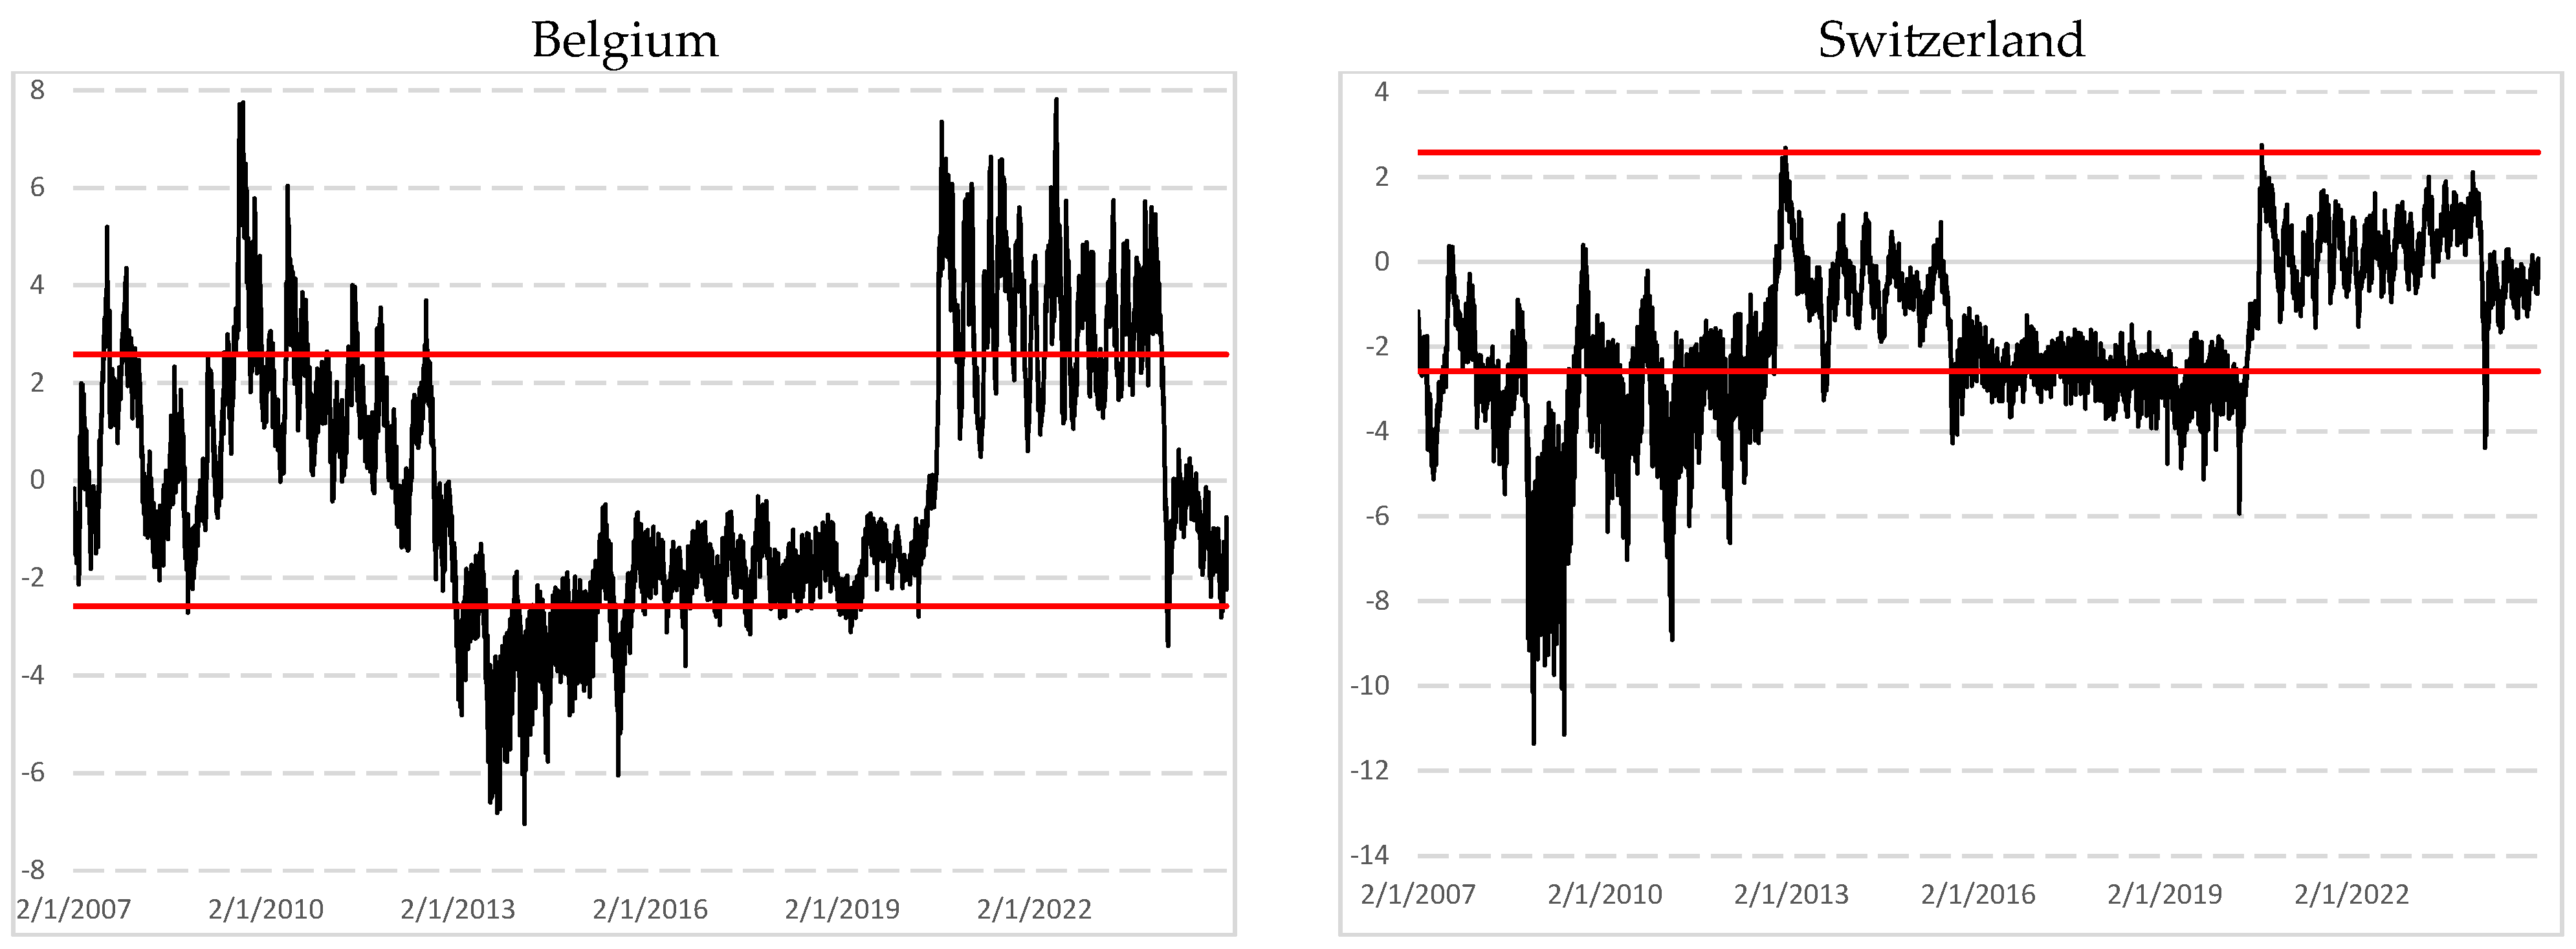
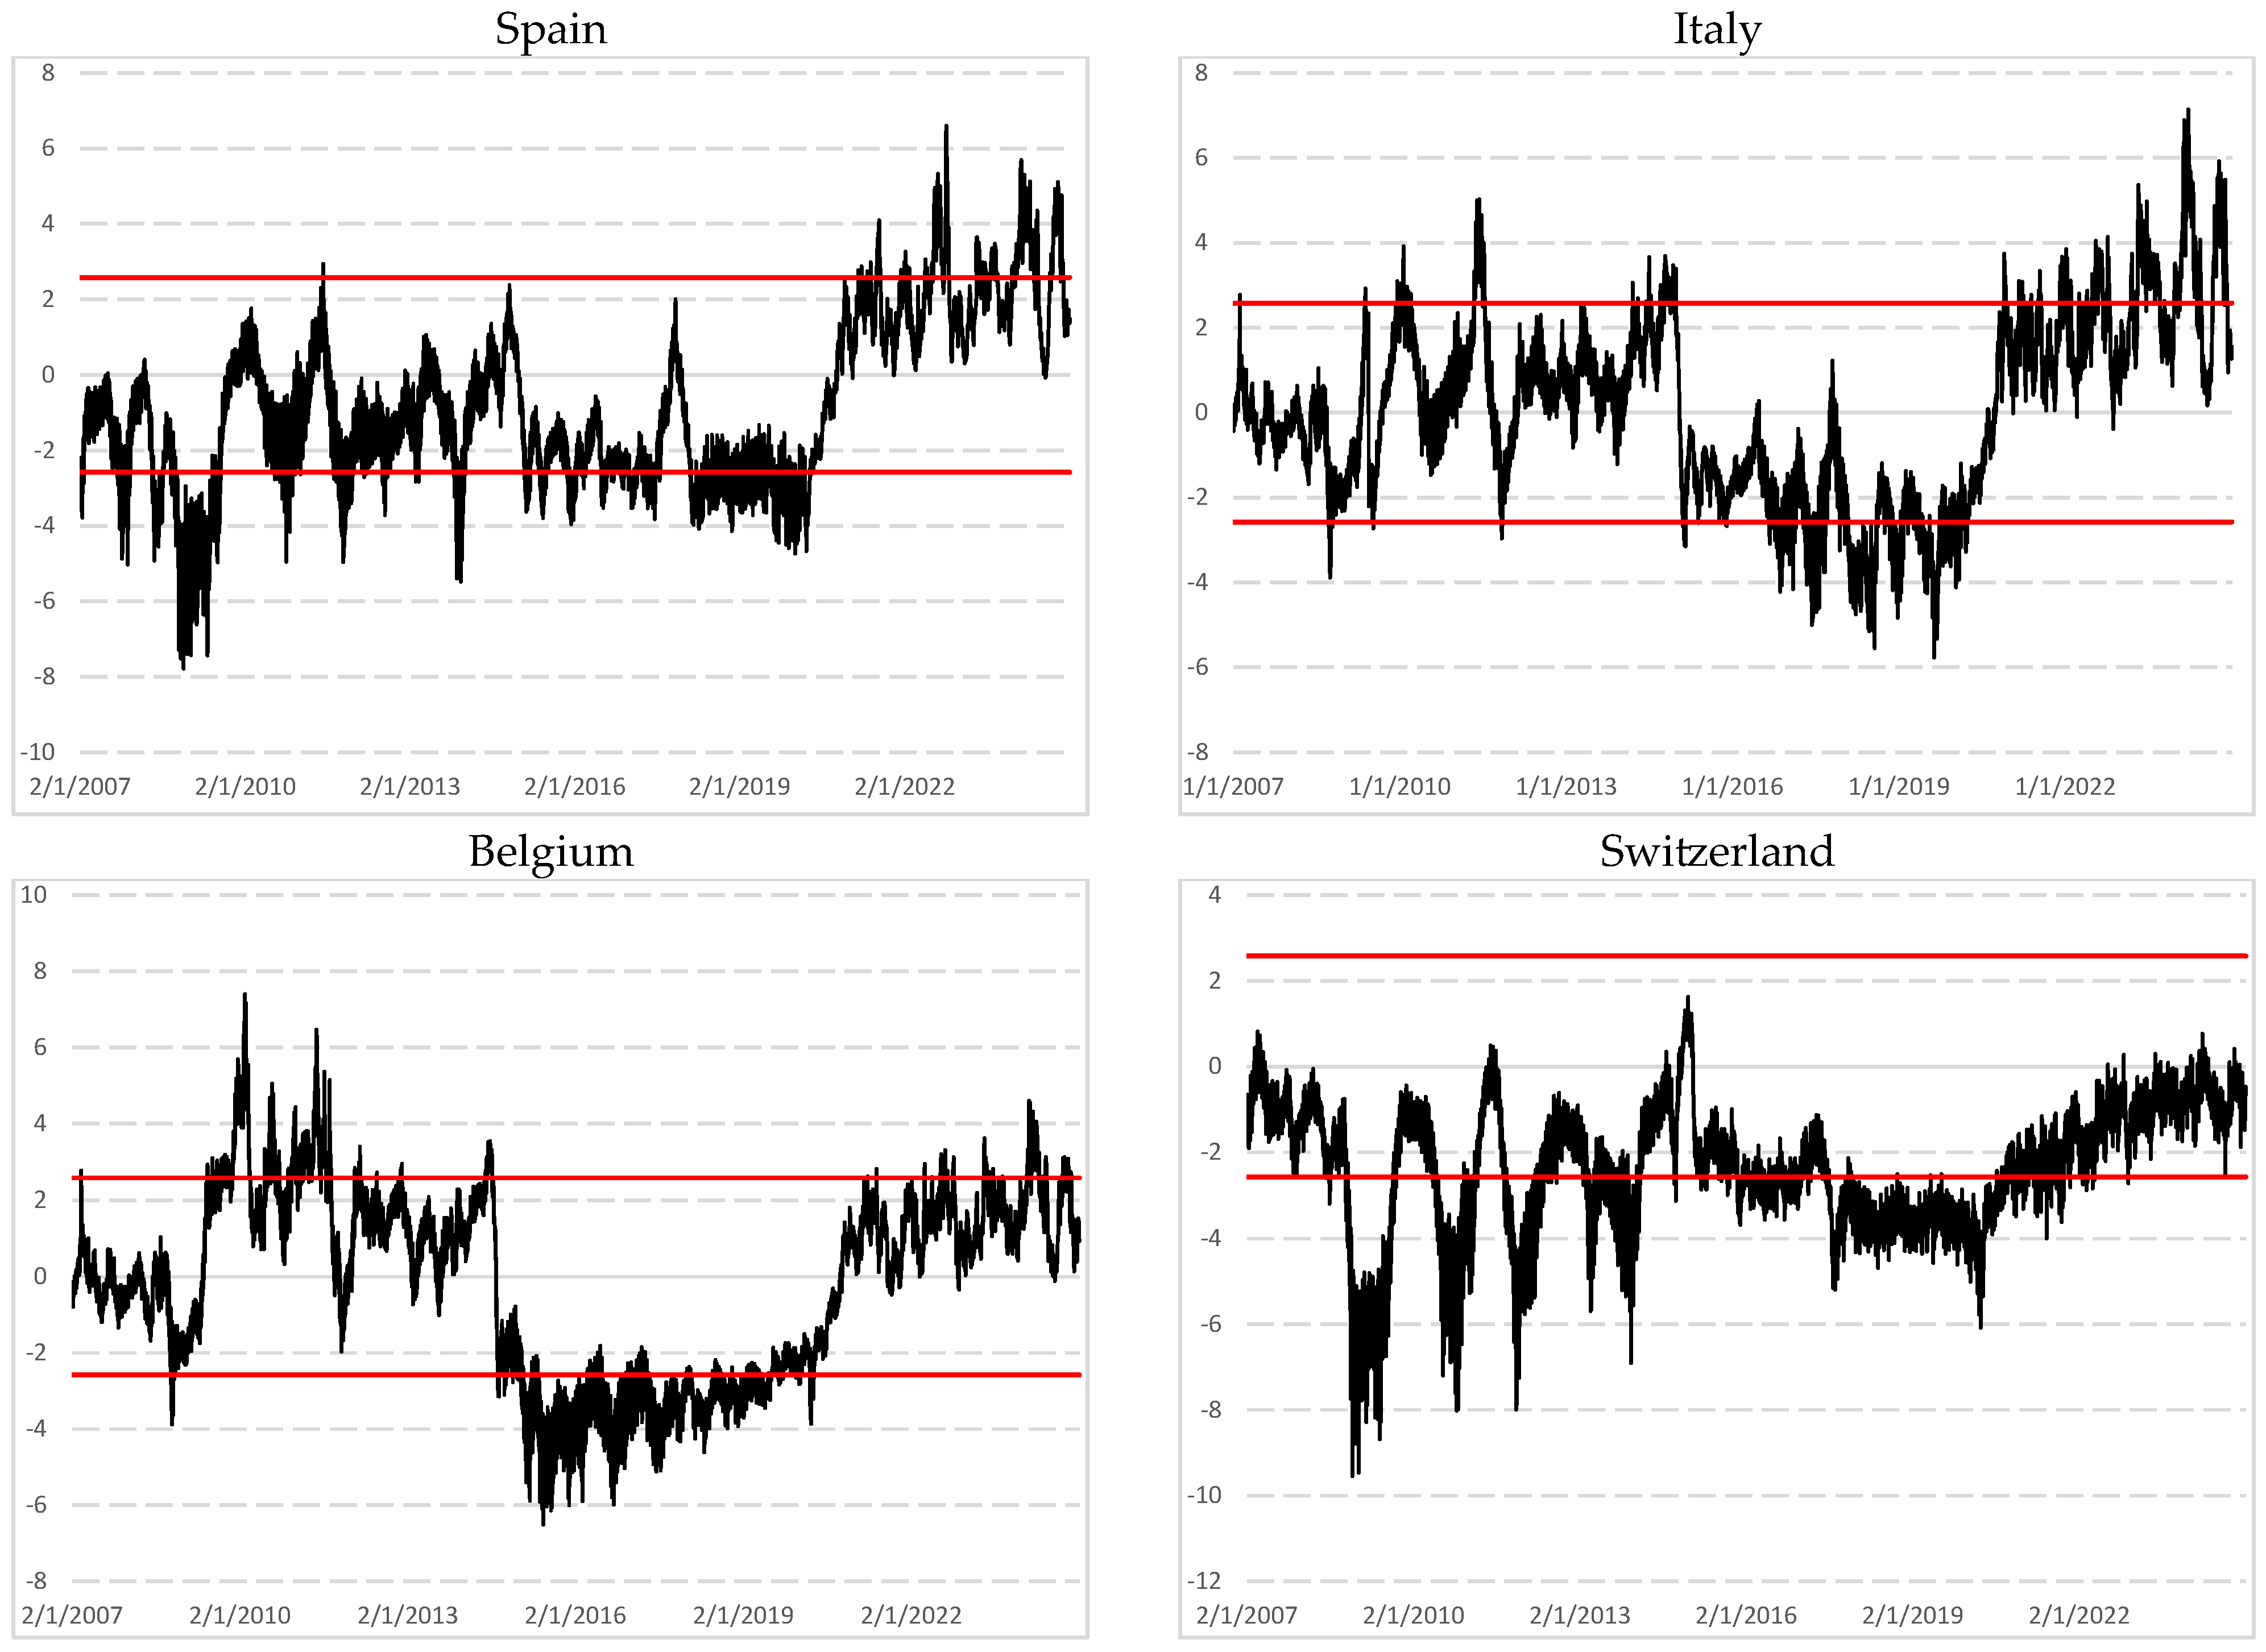
Figure 3 and Figure 4 display the t-statistics of the DFA exponents over time, complementing the analysis of the estimated Hurst coefficients. These t-statistics evaluate the statistical significance of deviations from the 0.5 benchmark. Results are presented for both 1000- and 1500-observation rolling windows. The two horizontal lines indicate the 1% confidence bounds. When the statistic lies within these bounds, the null hypothesis of no long-range dependence cannot be rejected. A statistic above the upper bound indicates persistence (long-range dependence), while a statistic below the lower bound indicates anti-persistence (mean-reverting behavior).
Overall, all stock markets fluctuate between periods of efficiency and inefficiency, showing similar broad trends across indices. However, when applying a 1000-observation window, notable cross-market discrepancies emerge.
The German market displays a clear mean-reverting period during 2008–2009, corresponding to the subprime crisis. From 2010 and 2016, the market trends upward near the upper bound, with multiple persistence peaks, and occasional negative autocorrelation spikes. A temporary return to efficiency occurs between 2016 to 2018, followed by a sharp rise in inefficiency from 2019 to 2023, driven by both endogenous and exogenous shocks. From 2023, a gradual reversion toward efficiency is observed.
The French, British, and to a lesser extent Spanish markets exhibit similar patterns. From 2007 to 2016, the t-statistics frequently fall below the lower bound, indicating persistent mean-reversion, consistent with the subprime and sovereignty debt crises. From 2020 onward, these markets show sustained long-range dependence, with t-statistics above the upper bound, particularly during the COVID-19 period. A return to efficiency emerges around 2023.
The Dutch market largely remains within the confidence bounds, despite some fluctuations. Several spikes in long-range dependence are observed between 2019 and 2023, linked to global shocks.
The Italian market displays clear mean-reverting signals during 2008–2009 and 2016–2019, and several spikes above the upper bound in late 2009, 2010, and 2012. Between 2019 to 2023, the market again exhibits long-range dependence before reverting to efficiency.
The Swiss market is slightly different. While some mean-reverting tendencies are present during 2008–2012, the post-2020 period reveals one significant inefficiency peak characterized by long-memory behavior.
The Belgian market shows a mean-reverting peak during the subprime crisis followed by long-range dependance during the European debt crisis and the COVID-19 period. Between 2014 and 2019, the market demonstrates a more mean-reverting trend, before returning to efficiency after 2020.
Using a 1500-observation rolling window, all market indices display smoother trajectories, reducing the influence of short-term volatility and enhancing the readability of long-term dynamics. While the markets generally return to efficiency around 2023 when using a shorter window size, this behavior is still observed with the longer window but occurs with a slight delay. This lagged adjustment is also confirmed by the rolling kurtosis analysis, which shows a similar dependence on widow size.
The German market exhibits a more persistent mean-reverting phase during the subprime and sovereignty debt crises (2010–2012). From 2010 to 2016, t-statistics remain close to the upper bound, with reduced erratic spikes. The long-range dependence observed after 2019 is still present but less abrupt, and the return to efficiency in 2023 occurs slightly later than in the 1000-observation case, a pattern consistent across all indices.
The French market also confirms a sustained mean-reverting trend between 2007 to 2016. The COVID-19 shock (2020–2022) remains visible, though the transition back to efficiency in 2023 is slightly delayed compared to the shorter window. The UK and Spain markets follow a similar pattern, showing well-defined anti-persistence phases before 2016 and persistent behavior during the pandemic.
The Dutch market continues to fluctuate mostly within the confidence interval but shows additional episodes of mean-reversion in 2008, as well as long-range dependence from 2009 to 2013 and again around 2022. The Spanish market similarly exhibits mean-reversion before 2016 and persistence after 2020, but these transitions are more gradual.
The Italian market maintains its overall structure: mean-reversion during the financial and debt crises, moderate long-memory peaks from 2009 to 2012, and a smoother period of dependence from 2019 to 2023.
The Belgian market confirms a mean-reverting peak during the subprime crisis and long-range dependence during both the pandemic and the sovereignty debt crises. Between 2014 and 2019, the market demonstrates stable mean-reverting behavior, which is further smoothed when applying the longer window.
The Swiss market remains remarkably stable. With a larger window, deviations outside the confidence interval are minimal. Only the 2008–2009 and 2010–2012 periods display temporary mean-reversion, and post-2020, the market remains consistently efficient.
Finally, Table 1 presents the Efficiency Index comparison across countries for different rolling window sizes, providing a complementary cross-market assessment of efficiency dynamics.
Overall, the Efficiency Index values remain relatively low, indicating that European stock markets are generally efficient. For most indices, the Efficiency Index decreases when using a longer window size, suggesting that longer horizons smooth short-term inefficiencies. Nevertheless, notable cross-markets differences emerge. For example, the UK and Switzerland appear slightly less efficient, particularly with longer window sizes. This behavior is likely explained by their structural tendency toward mean-reversion over time. In contrast, the most efficient markets are those where the t-statistics remain within the confidence bounds for the majority of the sample period. This occurs despite occasional sharp peaks in either long-range dependence or anti-persistence.

5. Discussion

While each market displays its own dynamic features, several broad patterns emerge in terms of magnitude, duration, and kind of persistence. Using the 1000-observation rolling window, the efficiency dynamics appear more volatile and sensitive to short-term disturbances. In contrast, the 1500-observation window produces a smoother representation, reducing the influence of short-term volatility and providing clearer insights into persistent phases of inefficiency and structural patterns. However, the overall findings remain broadly similar. The longer window delineates periods of inefficiency and efficiency more distinctly, thereby making long-term trends easier to interpret.
The results also show that market reactions vary substantially depending on both the nature of the shock and the structural characteristics of each market. Overall, the t-statistics derived from the DFA exponents reveal alternating periods of efficiency and inefficiency that closely align with major macroeconomic events. Throughout the sample period, several shocks of different natures occurred, spanning multiple years. These macroeconomic events are not comparable in nature. The first represent endogenous shocks, such as the subprime crisis (2008–2009), the European sovereignty debt crisis (2010–2012), inflationary pressures (2022–2023), and the rising of interest rates (2022–2024). The second are exogenous ones such as the COVID-19 pandemic (2020–2022), the Russia–Ukraine conflict (from 2022). This fundamental distinction helps explain the differences observed in the econometric results, as each type of shock affects market dynamics through different mechanisms.
Table 2 below presents the results of DFA statistics and kurtosis following exogenous shocks. The findings indicate that these shocks consistently increase kurtosis and disrupt market efficiency across the majority of European stock markets.
Table 3 below summarizes the main results for endogenous shocks. These shocks are found to be systematically associated with increased kurtosis and episodes of market inefficiency.

5.1. Persistence and Mean-Reversion Dynamics

Combining the results from Table 2 and Table 3, two distinct patterns emerge across shocks and markets. Both exogenous and endogenous shocks generally disrupt market efficiency, limiting the market’s ability to rapidly and accurately reflect available information.
Exogenous shocks, particularly the COVID-19 pandemic, consistently generate strong long-memory dynamics and persistent deviations from efficiency, as evidenced by elevated kurtosis and slower returns to market stability. These findings are observed across all eight stock markets, with a lesser extent in Switzerland (Table 2). For instance, Germany, France, UK, the Netherlands, Spain, Italy, Belgium, and Switzerland all exhibit long-range dependence and increased kurtosis during the COVID-19 pandemic, and to a smaller degree during the Russia–Ukraine conflict.
Conversely, endogenous shocks tend to produce mean-reverting behavior, also accompanied by fat-tailed return distributions. This behavior is particularly evident during the subprime mortgage crisis, where all markets display DFA exponents below 0.5 (anti-persistence) along with increased kurtosis (Table 3).
Our results highlight the dynamic efficiency of European markets, consistent with the adaptive markets hypothesis (AMH) proposed by Lo (2004, 2005) and supported by the empirical literature. Markets appear to adapt differently depending on environmental factors such as economic bubbles, political crises, or major macroeconomic shocks (Boya, 2019; Soteriou & Svensson, 2017; Urquhart & McGroarty, 2016; Cajueiro & Tabak, 2004). These studies have demonstrated that market efficiency fluctuates over time in response to these environmental changes (Da Silva et al., 2007; Ma et al., 2016; Morales et al., 2012; Ammy-Driss & Garcin, 2021). By jointly analyzing DFA Hurst exponents and distributional properties (kurtosis), our approach provides a richer framework for understanding how financial markets respond to systemic and external disturbances. The conclusion aligns with findings by Kristoufek (2012, 2013), who documented anti-persistence during the subprime crisis, suggesting that critical events alter dominant investment horizons. These results differ from those reported by Horta et al. (2014), Kumar and Deo (2013), and Boya (2019), who instead observed long-range dependence during this crisis.
Our findings are also consistent with Ammy-Driss and Garcin (2021) regarding the pandemic, where markets shifted from efficiency to a mean-reverting regime, as indicated by low Hurst exponents. This pattern suggests that the nature of a shock fundamentally influences how trading horizons are represented in the market. Kristoufek (2012, 2013) indicates that the trading structure shifted: short-term investors became dominant, while long-term investors lost confidence in sustained growth. Consequently, exogenous events leading to long-range dependence and temporary inefficiencies could be dominated by long-term investors, while short-terms investors decided to leave the market.

5.2. Major Versus Minor Economic Disruption

An important contribution of this study is the distinction between major and minor shocks, identified through the examination of kurtosis dynamics. Periods of strong mean-reversion and long-range dependence are particularly evident during and after the subprime mortgage crisis and the COVID-19 pandemic, respectively, across all stock markets. These events coincide with marked peaks in kurtosis values (Table 2 and Table 3). In contrast, all markets exhibit declining kurtosis—to varying degrees—in response to other exogenous or endogenous events. This downward trend in kurtosis reflects a reduced presence of long-range dependence and mean-reversion, indicating that such shocks have a weaker and less persistent impact on market dynamics. For instance, Germany, France, the UK, the Netherlands, Spain, Italy, Belgium, and Switzerland display less persistence during the Russia–Ukraine conflict compared to the pandemic. This trend is also observed for endogenous events, such as the sovereign debt crisis and the inflationary period, which exhibit mixed evidence of mean-reverting behavior and have a weaker overall impact on market dynamics compared to the subprime mortgage crisis.
This raises a fundamental question about how different shocks influence stock market behavior. While previous studies (Kristoufek, 2012; Ferreira, 2020; Sensoy & Tabak, 2016) have consistently shown that economic crises dynamically alter market efficiency, little attention has been given to quantifying the relative intensity of shocks beyond observing shifts in DFA exponents or kurtosis levels. Our results indicate that markets react heterogeneously to shocks, depending on their structural characteristics, such as exposure to macro-financial risks and resilience to systemic disturbances. For example, during 2010–2012—the second major endogenous shock—rolling kurtosis shows a downward trend across all indices, suggesting that much of the observed discrepancies stemmed from the primary phenomenon of the 2008 subprime crisis, which qualifies as a major endogenous event. Similarly, the inflationary pressures (3–10%) and the rise in interest rates are more consistent with monetary adjustments than major endogenous disruptions, allowing markets to gradually revert to efficiency and exhibit a convergence in behavior following a sequence of global shocks. Regarding exogenous shocks, the COVID-19 pandemic stands out as the event generating the largest kurtosis spikes and DFA deviations, highlighting its role as a major systemic disruption. By contrast, the Russia–Ukraine conflict produces a gradual decline in kurtosis, with most t-statistics remaining within efficiency bounds, suggesting a more limited and less persistent impact. Consequently, it is not possible to affirm whether the post-Covid event has the same impact on stock markets or if the persistence observed is solely attributable to the main pandemic shock. Given the continued presence of both dependence and persistent kurtosis during the pandemic, it is reasonable to interpret it as a leading event, while the Russia–Ukraine conflict represents a secondary, less destabilizing shock.
In conclusion, our findings establish a clear empirical distinction between major and minor shocks based on their effects on market efficiency and return distributions. Major shocks—including endogenous events like the subprime mortgage crisis and exogenous disruptions like the COVID-19 pandemic—produce pronounced and persistent deviations from efficiency, reflected by long-range dependence or strong mean-reversion, and are systematically associated with large kurtosis spikes, signaling extreme price movements and substantial disruptions to normal market functioning. In contrast, minor shocks, such as the Russia–Ukraine conflict, or endogenous events, like the European sovereign debt crisis, inflationary pressures, and interest rate hikes, generate short-lived inefficiencies. These events alter the persistence structure—as evidenced by temporary rejections of the random walk hypothesis—without meaningfully increasing kurtosis or reshaping the overall distribution of returns. This combined evidence provides a novel classification framework, whereby major disruptions are characterized by long-lasting efficiency breakdowns, fat-tailed return behavior, and systemic instability, while minor disruptions lead to temporary efficiency deviations with only modest distributional effects.

5.3. Implications for AMH and Fractal Market Hypothesis (FMH)

As highlighted above, markets react differently depending on the magnitude of shocks. Although common patterns are observed across Western European stock markets, our results reveal heterogeneous adaptive responses between countries. Southern European markets, particularly Italy and Spain, exhibit more persistent inefficiencies and slower recoveries following both endogenous and exogenous shocks, reflecting structural vulnerabilities and greater sensitivity to systemic crises. In contrast, Northern and Central European markets, such as Germany and France, adapt more rapidly, showing a quicker return to efficiency after major disruptions. Switzerland stands out as the most resilient market, maintaining weak-form efficiency even during severe shocks like COVID-19. These cross-market differences underscore that the adaptive behavior predicted by the AMH is not uniform, but rather shaped by each market’s depth, liquidity, and exposure to macro-financial risks.
Our findings provide strong empirical support for the AMH developed by Lo (2004, 2005), demonstrating that market efficiency in Western European stock markets evolves dynamically with macroeconomic conditions, consistent with previous literature (Boya, 2019; D. Zhang et al., 2020; Ammy-Driss & Garcin, 2021). A key contribution of this study is extending the AMH framework by empirically distinguishing between major and minor shocks and showing that markets adapt differently to each. Major disruptions, such as the subprime crisis and the COVID-19 pandemic, produce pronounced and persistent inefficiencies, altering trading horizons and memory structures, while minor shocks—such as the sovereign debt crisis, inflationary episodes, and geopolitical tensions—lead only to short-lived deviations from efficiency. This differentiation, evidenced by shifts in Hurst exponents and kurtosis, highlights that market adaptation is contingent on the intensity of shocks, offering a more nuanced understanding of the AMH.
The impact of major events is also consistent with the fractal market hypothesis (FMH), thus creating a bridge between the AMH and FMH. According to the FMH, liquidity is directly linked to trading activity across different investment horizons, which influences market volatility. When investors with varying horizons are evenly represented, supply and demand are efficiently matched, ensuring market stability. However, following negative shocks or bad news, one investment horizon can dominate the market, leading to a deterioration in efficiency and the potential emergence of a critical point. Kristoufek (2012, 2013) illustrates this through the example of an endogenous crisis, showing that the Hurst exponent can detect transitions in market behavior. His findings reveal mean-reverting dynamics, indicating a breakdown in persistence. This phase also reflects a shift in trading patterns, as short-term speculators gained dominance while long-term investors retreated due to declining confidence in sustained growth. The imbalance in investment horizons began even before the crisis, with horizon activity indicators gradually returning to pre-crisis levels only after severe market losses. Two mechanisms explain this short-term dominance: (i) long-term investors panic and sell, fueling short-term trading activity, and/or (ii) they exit the market altogether, allowing short-term traders to dominate until stability is restored.
For major exogenous shocks, however, the interpretation must adapt to remain consistent with FMH. Such exogenous shocks cause a sudden, externally driven disruption in financial markets. In the immediate aftermath, short-term investors react sharply to uncertainty with panic-driven selling, causing spikes in volatility and temporary liquidity loss. Long-term investors, in contrast, often remain active, viewing the shock as not fundamentally altering economic conditions. This divergence in behavior is captured statistically by a rise in the Hurst exponent above 0.5, indicating long-memory dynamics and persistent trends driven by long-term investors. Over time, as uncertainty subsides and market conditions normalize, short-term traders gradually re-enter the market, attracted by new opportunities. This leads to a rebalancing of trading activity across horizons, and the Hurst exponent converges back toward 0.5, signaling a return to the fractal equilibrium typical of a stable and liquid market.

6. Conclusions

The results support the view that market efficiency is not static but evolves dynamically over time, consistent with the adaptive markets hypothesis (AMH). The ability of markets to process information and regain efficiency appears to depend on both their structural resilience and the nature of shocks—whether endogenous or exogenous. Our findings demonstrate a strong correlation between periods of inefficiency and major macro-financial disruptions, highlighting the adaptive behavior of Western European stock markets.
Across all indices, the rolling window analysis reveals consistent patterns of alternating phases of efficiency and inefficiency that broadly align with macroeconomic events. Stock markets exhibit a mean-reverting behavior during the 2007–2009 subprime crisis, followed by a return to near-efficiency in the post-crisis recovery. A second wave of inefficiency emerges during the COVID-19 pandemic, characterized by persistent long-range dependence. In contrast, minor events, particularly the European sovereign debt crisis (2010–2012), show limited statistical impact on return distributions, despite temporary deviations from efficiency.
Finally, the findings reveal distinct market responses depending on the type of shock. While major endogenous events tend to induce mean-reverting dynamics, major exogenous shocks are associated with long-memory behavior. This study thus clarifies how different disturbances asymmetrically affect market dynamics and their implications for market efficiency. Moreover, in line with the FMH, each form of inefficiency reflects liquidity imbalances linked to the dominance of specific investment horizons. Future research could extend this analysis to determine whether these findings generalize to emerging markets and less integrated financial systems.

Funding

This research received no external funding.

Data Availability Statement

The raw data supporting the conclusions of this article will be made available by the authors on request.

Conflicts of Interest

The authors declare no conflicts of interest.

Appendix A

Table A1. Descriptive statistics for European indices.
DeutschlandFranceUKThe NetherlandsSpainItalyBelgiumSwitzerland
Stock marketDAXCAC40FTSEAEXIBEX35FTSE MIBBEL20SMI20
Beginning date09/02/200131/03/200124/01/200109/04/200119/01/200106/03/200120/02/200119/01/2001
Ending date31/12/202431/12/202431/12/202431/12/202431/12/202431/12/202431/12/202431/12/2024
Sample60756087604560866103608961106013
Mean1.8083 × 10−45.9492 × 10−54.5313 × 10−57.6389 × 10−52.4539 × 10−5−2.1609 × 10−55.7543 × 10−56.3137 × 10⁻⁵
Standard deviation0.01420.01380.01140.01340.01400.02200.01220.0112
Maximum0.10790.10590.09380.10020.13480.89920.09330.1078
Minimum−0.1305−0.1309−0.1151−0.1137−0.1515−0.8921−0.1532−0.1013
Kurtosis9.409.9711.6610.7711.6313.9512.9011.06
Skewness−0.1756−0.2064−0.3585−0.2325−0.3138−0.7134−0.4226−0.3010
Jarque–Bera10,42912,38819,05315,39819,05430,98225,15716,383

Appendix B

Figure A1. Evolution of Kurtosis, considering a window length w = 1000 (in black), and w = 1500 (in grey).
Ijfs 13 00157 g0a1aIjfs 13 00157 g0a1b

Note

1
With a detrended fluctuation analysis.

References

  1. Akhtaruzzaman, M., Boubaker, S., & Sensoy, A. (2021). Financial contagion during COVID-19 crisis. Finance Research Letters, 38, 101604. [Google Scholar] [CrossRef]
  2. Alvarez-Ramirez, J., Alvarez, J., Rodriguez, E., & Fernandez-Anaya, G. (2008). Time-varying Hurst exponent for US stock markets. Physica A: Statistical Mechanics and its Applications, 387(24), 6159–6169. [Google Scholar] [CrossRef]
  3. Ammy-Driss, A., & Garcin, M. (2021). Efficiency of the financial markets during the COVID-19 crisis: Time-varying parameters of fractional stable dynamics. arXiv, arXiv:2007.10727v3. [Google Scholar] [CrossRef]
  4. Asif, R., & Frömmel, M. (2022). Testing long memory in exchange rates and its implications for the Adaptive Market Hypothesis. Physica A: Statistical Mechanics and Its Applications, 593, 126871. [Google Scholar] [CrossRef]
  5. Aslam, F., Ferreira, P., & Mohti, W. (2021). Investigating efficiency of frontier stock markets using multifractal Detrended Fluctuation Analysis. International Journal of Emerging Markets, 18(7), 1650–1676. [Google Scholar] [CrossRef]
  6. Aslam, F., Nogueiro, F., Brasil, M., Ferreira, P., Mughal, K. S., Bashir, B., & Latif, S. (2020). The footprints of COVID-19 on Central Eastern European stock markets: An intraday analysis. Post-Communist Economies, 33(6), 751–769. [Google Scholar] [CrossRef]
  7. Balcilar, M., Bekiros, S., & Gupta, R. (2017). The role of news-based uncertainty indices in predicting oil markets: A hybrid nonparametric quantile causality method. Empirical Economics, 53(3), 879–889. [Google Scholar] [CrossRef]
  8. Boya, C. (2017). Testing capital market efficiency. Global Business and Economics Review, 19(2), 194–224. [Google Scholar] [CrossRef]
  9. Boya, C. (2019). From efficient markets to adaptive markets: Evidence from the French stock exchange. Research in International Business and Finance, 49, 156–165. [Google Scholar] [CrossRef]
  10. Boya, C. (2023). Testing the adaptive market hypothesis through the presence of dependence in the Swiss stock exchange. Applied Economics Quarterly. Forthcoming. [Google Scholar]
  11. Cajueiro, D. O., & Tabak, B. M. (2004). The Hurst exponent over time: Testing the assertion that emerging markets are becoming more efficient. Physica A: Statistical Mechanics and Its Applications, 336, 521–537. [Google Scholar] [CrossRef]
  12. Da Silva, S., Figueiredo, A., Gleria, I., & Matsushita, R. (2007). Hurst exponents, power laws, and efficiency in the Brazilian foreign exchange market. Economics Bulletin, 7, 1–11. [Google Scholar]
  13. Engelen, S., Norouzzadeh, P., Dullaert, W., & Rahmani, B. (2011). Multifractal features of spot rates in the Liquid Petroleum Gas shipping market. Energy Economics, 33, 88–98. [Google Scholar] [CrossRef]
  14. Fama, E. F. (1970). Efficient capital markets: A review of theory and empirical work. Journal of Finance, 25, 383–417. [Google Scholar] [CrossRef]
  15. Ferreira, P. (2018). Long-range dependence of eastern European stock markets: A dynamic detrended analysis. Physica A: Statistical Mechanics and Its Applications, 505, 454–470. [Google Scholar]
  16. Ferreira, P. (2020). Dynamic long-range dependences in the Swiss stock market. Empirical Economics, 58, 1541–1573. [Google Scholar] [CrossRef]
  17. Grech, M., & Mazur, Z. (2004). Can one make any crash prediction in finance using the local hurst exponent idea? Physica A: Statistical Mechanism and Its Applications, 336(1), 133–145. [Google Scholar]
  18. Hiremath, G. S., & Narayan, S. (2016). Testing the adaptive market hypothesis and its determinants for the Indian stock markets. Finance Research Letters, 19, 173–180. [Google Scholar] [CrossRef]
  19. Horta, P., Lagoa, S., & Martins, L. (2014). The impact of the 2008 and 2010 financial crises on the Hurst exponents of international stock markets: Implications for efficiency and contagion. International Review of Financial Analysis, 35, 140–153. [Google Scholar] [CrossRef]
  20. Hurst, H. E. (1951). Long term storage capacity of reservoirs. Transactions of the American Society of Civil Engineers, 116, 770–799. [Google Scholar] [CrossRef]
  21. Kantelhardt, J. W., Zschiegner, S. A., Koscielny-Bunde, E., Havlin, S., Bunde, A., & Stanley, H. E. (2002). Multifractal Detrended Fluctuation Analysis of nonstationary time series. Physica A: Statistical Mechanics and Its Applications, 316, 87–114. [Google Scholar] [CrossRef]
  22. Kim, J. H., Shamsuddin, A., & Lim, K. P. (2011). Stock return predictability and the Adaptive Markets Hypothesis: Evidence from century-long U.S. data. Journal of Empirical Finance, 18, 868–879. [Google Scholar] [CrossRef]
  23. Kristoufek, L. (2010). Rescaled range analysis and detrended fluctuation analysis: Finite sample properties and confidence intervals. Czech Economic Review, 4(3), 315–329. [Google Scholar]
  24. Kristoufek, L. (2012). Fractal markets hypothesis and the global financial crisis: Scaling, investment horizons and liquidity. Advances in Complex Systems, 15, 1–7. [Google Scholar] [CrossRef]
  25. Kristoufek, L. (2013). Fractal markets hypothesis and the global financial crisis: Wavelet power evidence. Scientific Reports, 3, 2857. [Google Scholar] [CrossRef]
  26. Kristoufek, L., & Vosvrda, M. (2013a). Measuring capital market efficiency: Global and local correlations structure. Physica A: Statistical Mechanics and Its Applications, 392, 184–193. [Google Scholar]
  27. Kristoufek, L., & Vosvrda, M. (2013b). Measuring capital market efficiency: Long-term memory, fractal dimension and approximate entropy. Euoprean Physcial Journal B, 87, 162. [Google Scholar] [CrossRef]
  28. Kumar, S., & Deo, N. (2013). Analyzing crisis in global financial indices. In Econophysics of systemic risk and network dynamics. Springer. [Google Scholar]
  29. Lo, A. W. (2004). The adaptive markets hypothesis: Market efficiency from an evolutionary perspective. Journal of Portfolio Management, 30, 15–29. [Google Scholar]
  30. Lo, A. W. (2005). Reconciling efficient markets with behavioral finance: The Adaptive Markets Hypothesis. Journal of Investment Consulting, 7, 21–44. [Google Scholar]
  31. Lo, A. W., & MacKinlay, A. C. (1988). stock market prices do not follow random walks: Evidence from a simple specification test. Review of Financial Studies, 1, 41–66. [Google Scholar] [CrossRef]
  32. Ma, P., Li, D., & Li, S. (2016). Efficiency and cross-correlation in equity market during global financial crisis: Evidence from China. Physica A, 444, 163–176. [Google Scholar] [CrossRef]
  33. Mandelbrot, B. B. (1972). Statistical methodology for non-periodic cycles: From the covariance to R/S analysis. Annals of Economic and Social Measurement, 3, 543–553. [Google Scholar]
  34. Matos, J. M. O., de Moura, E. P., Krüger, S. E., & Rebello, J. M. A. (2004). Rescaled range analysis and Detrended Fluctuation Analysis study of cast iron ultrasonic backscattered signals. Chaos, Solitons and Fractals, 19(1), 55–60. [Google Scholar] [CrossRef]
  35. Morales, R., Di Matteo, T., Gramatica, R., & Aste, T. (2012). Dynamical generalized Hurst exponent as a tool to monitor unstable periods in financial time series. Physica A: Statistical Mechanics and Its Applications, 391, 3180–3189. [Google Scholar]
  36. Ozkan, O. (2021). Impact of COVID-19 on stock market efficiency: Evidence from developed countries. Research in International Business and Finance, 58, 101445. [Google Scholar] [CrossRef]
  37. Peng, C.-K., Buldyrev, S. V., Havlin, S., Simons, M., Stanley, H. E., & Goldberger, A. L. (1994). Mosaic organization of DNA nucleotides. Physical Review E, 49(2), 1685–1689. [Google Scholar] [CrossRef]
  38. Peters, E. E. (1994). Fractal market analysis: Applying chaos theory to investment and economics. Wiley & Sons, Inc. [Google Scholar]
  39. Rogério, L., Costa, L., & Vasconcelos, G. (2003). Long-range correlations and nonstationarity in the Brazilian stock market. Physica A: Statistical Mechanics and Its Applications, 329, 231–248. [Google Scholar]
  40. Sensoy, A., & Tabak, B. M. (2016). Dynamic efficiency of stock markets and exchange rates. International Review of Financial Analysis, 47, 353–371. [Google Scholar] [CrossRef]
  41. Soteriou, A., & Svensson, L. (2017). Testing the adaptive market hypothesis on the OMXS30 stock index: 1986–2014 [Master’s thesis, Jönköping University]. [Google Scholar]
  42. Takaishi, T. (2022). Time evolution of market efficiency and multifractality of the Japanese stock market. Risk and Financial Management, 15, 31. [Google Scholar] [CrossRef]
  43. Tripathi, A., Vipul, V., & Dixit, A. (2020). Adaptive market hypothesis and investor sentiments: Global evidence. Managerial Finance, 46, 1407–1436. [Google Scholar] [CrossRef]
  44. Urquhart, A., & Hudson, R. (2013). Efficient or adaptive markets? Evidence from major stock markets using very long run historic data. International Review of Financial Analysis, 28, 130–142. [Google Scholar] [CrossRef]
  45. Urquhart, A., & McGroarty, F. (2016). Are stock markets really efficient? Evidence of the Adaptive Market Hypothesis. International Review of Financial Analysis, 47, 39–49. [Google Scholar] [CrossRef]
  46. Zhang, B., Li, X., & Yu, H. (2013). Has recent financial crisis changed permanently the correlations between BRICS and developed stock markets? The North American Journal of Economics and Finance, 26, 725–738. [Google Scholar] [CrossRef]
  47. Zhang, D., Hu, M., & Ji, Q. (2020). Financial markets under the global pandemic of COVID-19. Finance Research Letters, 36, 1–6. [Google Scholar] [CrossRef]
  48. Zunino, L., Tabak, B. M., Pérez, D. G., Garavaglia, M., & Rosso, O. A. (2009). Inefficiency in Latin-American market indices. European Physical Journal B, 67(3), 369–379. [Google Scholar] [CrossRef]
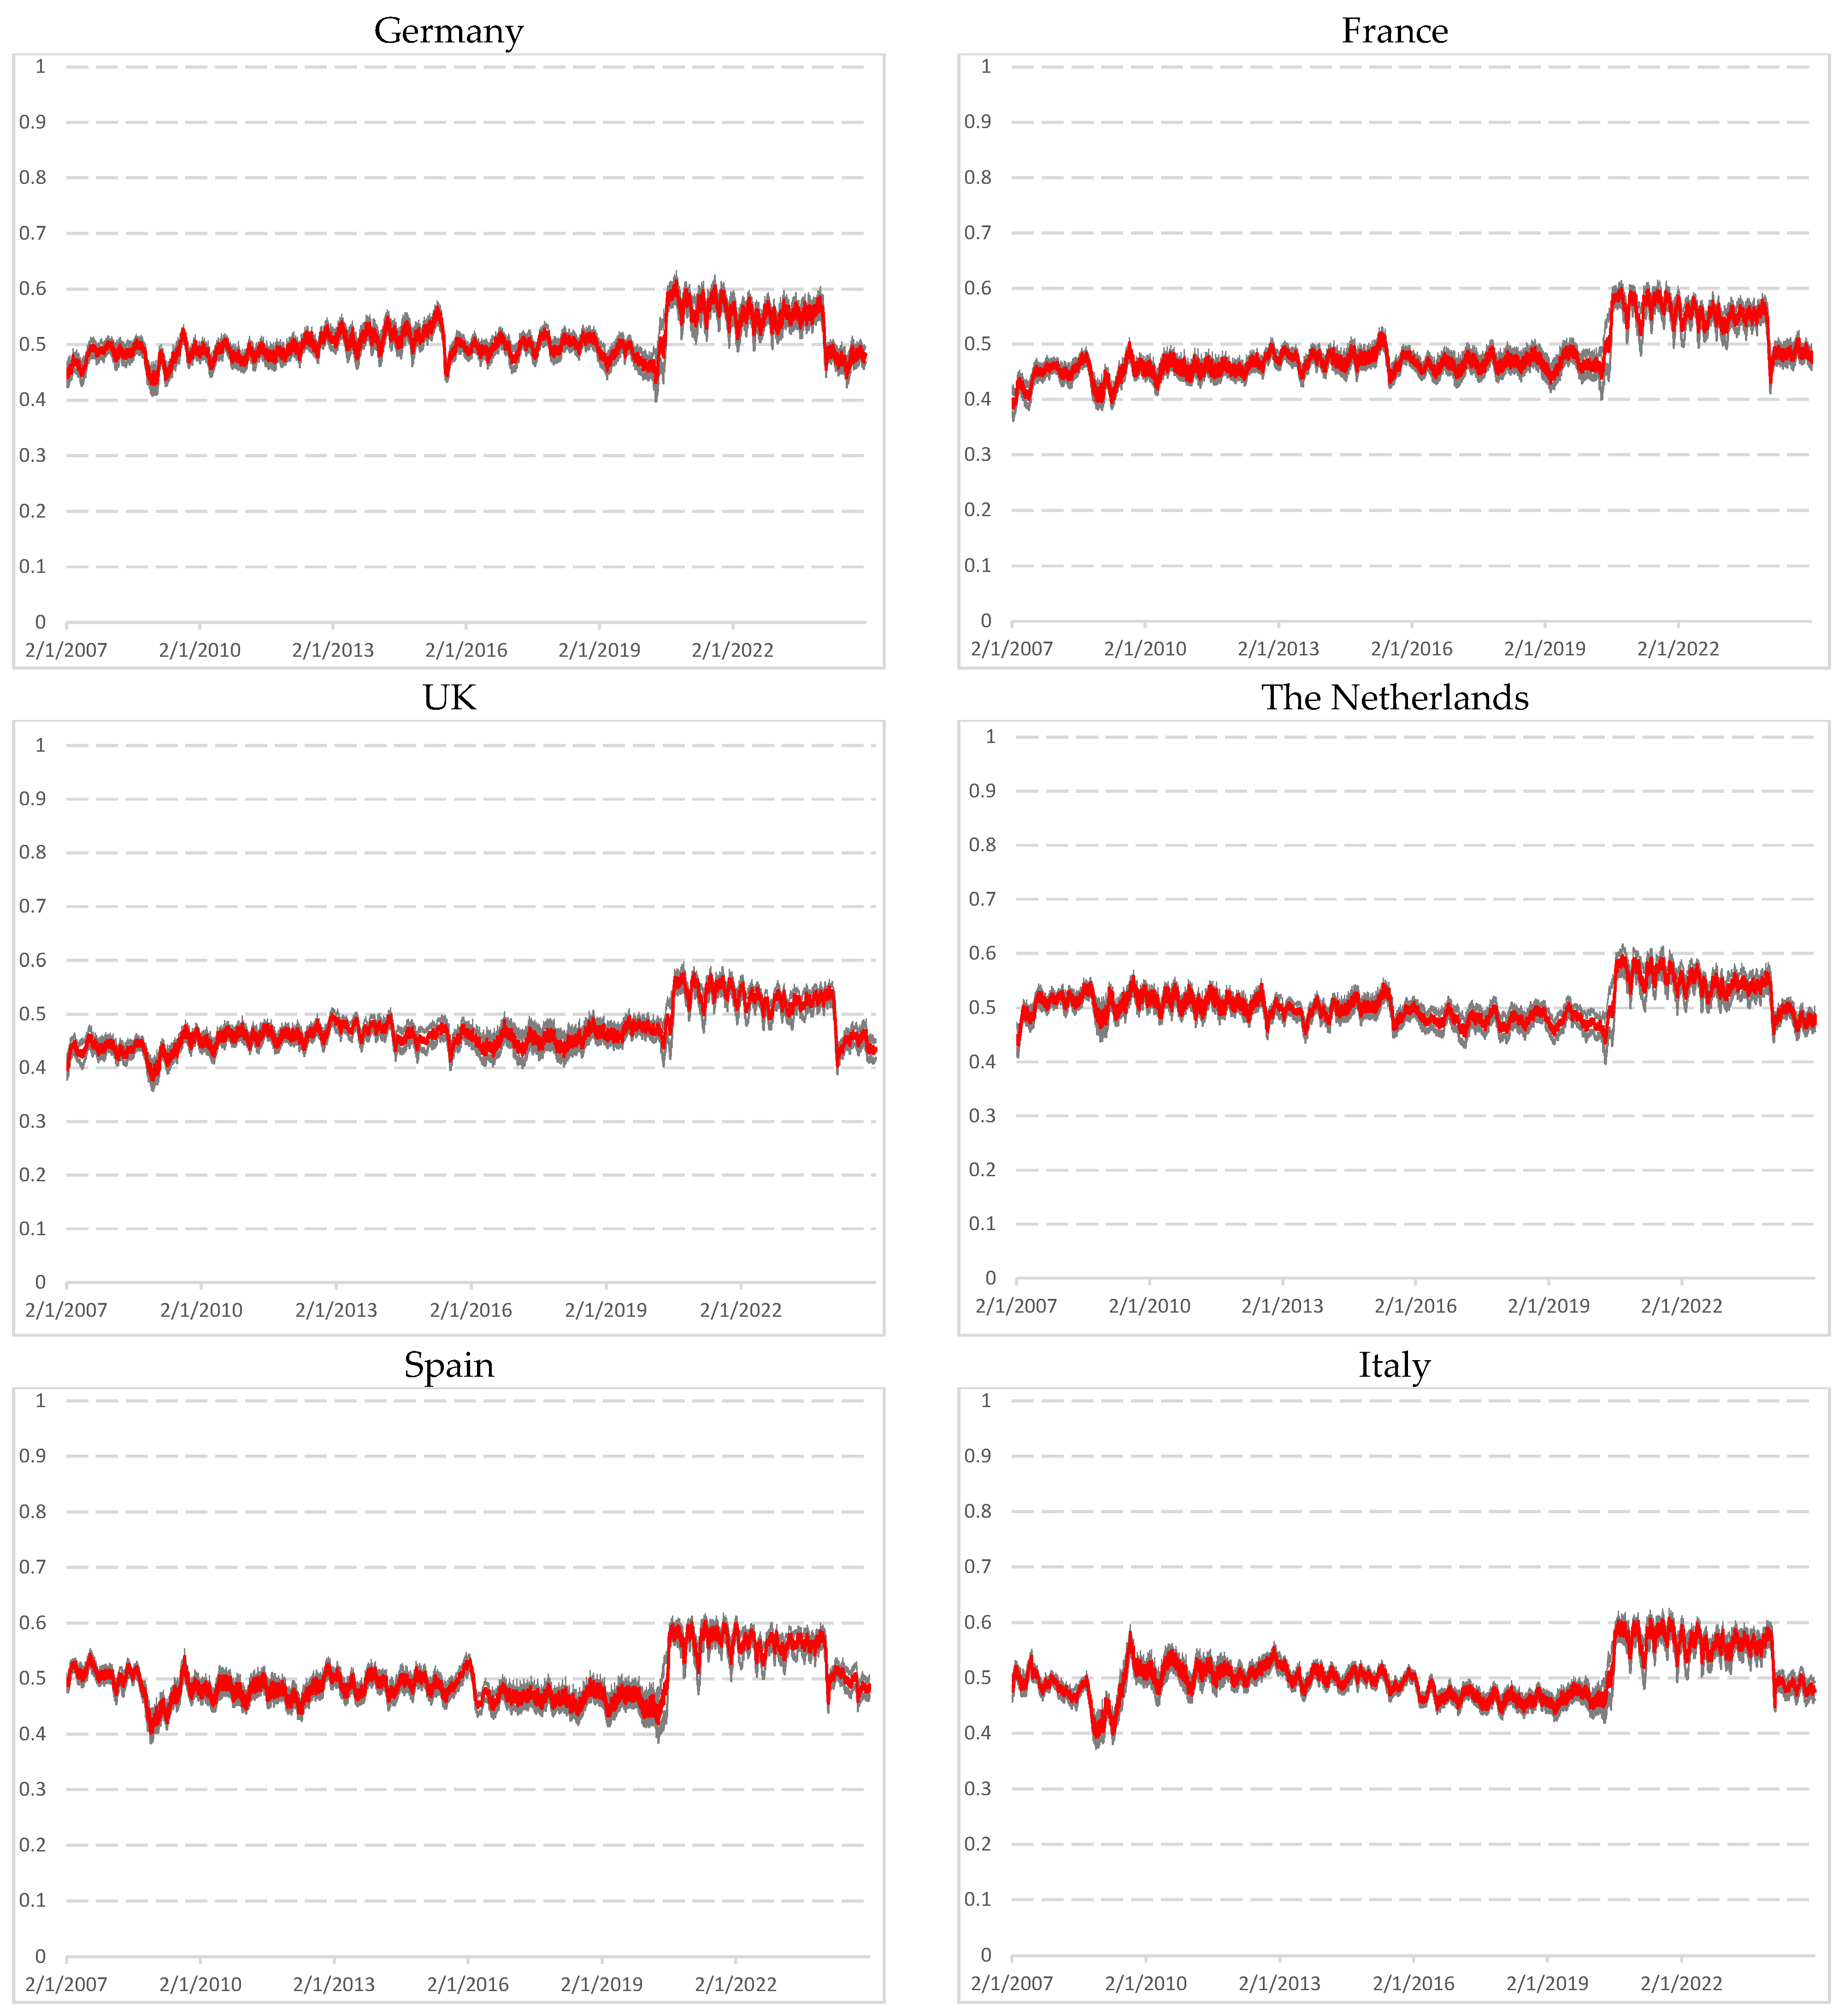
Figure 1. Evolution of the Hurst exponent estimated via detrended fluctuation analysis (DFA) using a 1000-day rolling window across eight Western European stock markets. The analysis covers the period 2007–2024 (In grey, the error-bar of the DFA exponents).
Ijfs 13 00157 g001aIjfs 13 00157 g001b
Figure 2. Evolution of the Hurst exponent estimated via detrended fluctuation analysis (DFA) using a 1500-day rolling window across eight Western European stock markets. The analysis covers the period 2007–2024 (In grey, the error-bar of the DFA exponents).
Ijfs 13 00157 g002aIjfs 13 00157 g002b
Figure 3. Statistical test results for the null hypothesis H0: α = 0 (indicating market efficiency), versus the alternative H1: α 0 , based on DFA estimates using a 1000-day rolling window (the test statistic evaluates deviations from weak-form efficiency). Red lines represent critical values for a 1% level of significance.
Ijfs 13 00157 g003aIjfs 13 00157 g003b
Figure 4. Statistical test results for the null hypothesis H0: α = 0 (indicating market efficiency), versus the alternative H1: α 0 , based on DFA estimates using a 1500-day rolling window (the test statistic evaluates deviations from weak-form efficiency). Red lines represent critical values for a 1% level of significance.
Ijfs 13 00157 g004aIjfs 13 00157 g004b
Table 1. Efficiency Index for countries.
Length w = 1000Length w = 1500
CountryMarketEfficiency IndexEfficiency Index
GermanyDAX0.0492093860.034648195
FranceCAC400.0667897950.063333729
UKFTSE1000.0668852620.070862304
The NetherlandsAEX0.0433536290.037470596
SpainIBEX350.0578301420.045728394
ItalyFTSEMIB0.0590799760.040037193
BelgiumBEL200.0604485440.053541813
SwitzerlandSMI200.0612862850.06610842
Table 2. Effects of exogenous shocks on market efficiency: DFA statistics and kurtosis.
MarketsCOVID-19 Pandemic (2020–2022)Ukraine—Russia War (2022–Nowadays)
GermanyStrong persistence, long-range dependence for all window sizes
Peak of kurtosis
Moderate persistence, delayed return toward efficiency
Strong decreasing kurtosis
FranceStrong persistence, long-range dependence for all window sizes
Peak of kurtosis
Moderate persistence, delayed return toward efficiency
Strong decreasing kurtosis
UKStrong persistence, moderate long memory (w = 1000)
Few peaks of persistence for larger window sizes
Peak of kurtosis
Gradual recovery to efficiency (w = 1000)
Market remains efficient (w = 1500)
Strong decreasing kurtosis
The NetherlandsStrong persistence, moderate long memory
Peak of kurtosis
Moderate persistence, delayed return toward efficiency
Strong decreasing kurtosis
SpainStrong persistence, long-range dependence for all window sizes
Peak of kurtosis
Moderate persistence, delayed return toward efficiency
Strong decreasing kurtosis
ItalyStrong persistence, long-range dependence for all window sizes
Peak of kurtosis
Moderate persistence, delayed return toward efficiency
Strong decreasing kurtosis
BelgiumStrong persistence, moderate long memory (w = 1000)
Few peaks of persistence for larger window sizes
Peak of kurtosis
Moderate persistence, delayed return toward efficiency
Strong decreasing kurtosis
SwitzerlandA peak of long memory (w = 1000)
Market then remains efficient
Peak of kurtosis
Market remains efficient for all windows sizes
Strong decreasing kurtosis
Table 3. Effects of endogenous shocks on market efficiency: DFA statistics and kurtosis.
MarketSubprime Crisis (2008–2009)Sovereign Debt Crisis (2010–2012)Inflation and Rise Interest Rates (2022–2024)
GermanyMean-reverting behavior, sharp anti-persistence
Peak of kurtosis
Anti-persistence close to lower bound
Clear mean-reverting for w = 1500
Decreasing kurtosis
Moderate persistence, delayed return toward efficiency
Strong decreasing kurtosis
FranceStrong mean-reverting behavior
Peak of kurtosis
Strong mean-reverting behavior
Decreasing kurtosis
Moderate persistence, delayed return toward efficiency
Strong decreasing kurtosis
UKStrong mean-reverting behavior
Peak of kurtosis
Strong mean-reverting behavior
Decreasing kurtosis
Persistence for w = 1000
Market remains efficient
Strong decreasing kurtosis
The NetherlandsMostly efficient for w = 1000 and peaks of long-memory
Spikes of mean-reverting for w = 1500
Peak of kurtosis
Presence of long-range dependence
Decreasing kurtosis
Moderate persistence, delayed return toward efficiency
Strong decreasing kurtosis
SpainStrong anti-persistence, clear mean-reversion
Peak of kurtosis
Pronounced anti-persistence
Peak of kurtosis
Moderate persistence, delayed return toward efficiency
Strong decreasing kurtosis
ItalyStrong mean-reversion
Few peaks of anti-persistence for w = 1500
Peak of kurtosis
Discrepancies between bounds
Presence of long-range dependence
Decreasing kurtosis
Moderate persistence, delayed return toward efficiency
Strong decreasing kurtosis
BelgiumFew peaks of anti-persistence
Peak of kurtosis
Discrepancies between bounds
Presence of long-range dependence
Decreasing kurtosis
Moderate persistence, delayed return toward efficiency
Strong decreasing kurtosis
SwitzerlandStrong mean-reverting behavior
Peak of kurtosis
Strong mean-reverting behavior
Decreasing kurtosis
Stability throughout the period
Strong decreasing kurtosis
Disclaimer/Publisher’s Note: The statements, opinions and data contained in all publications are solely those of the individual author(s) and contributor(s) and not of MDPI and/or the editor(s). MDPI and/or the editor(s) disclaim responsibility for any injury to people or property resulting from any ideas, methods, instructions or products referred to in the content.