Training Set Optimization for Machine Learning in Day Trading: A New Financial Indicator
Abstract
1. Introduction
2. Research Problem
- Scenario Detection Modeling (Clustering): Identification of different scenarios (behavior patterns) helps machine learning techniques obtain better results. In this way, it is proposed to answer the question: What is the best way or method to segment scenarios of asset market variations?
- Predictive Modeling: There is a wide range of research into predictive modeling for the financial market. Can we segment scenarios and use them to optimize training sets to improve asset prediction?
- Operation Model: One of the main challenges for studies relating to the financial market is how to use information to model entry and exit points. In this thesis proposal, the following questions arise: Is it possible to optimize return results? How can we create and optimize an operating model?
- To develop a model to segment asset variation scenarios in financial markets.
- To develop a financial indicator based on an asset’s daily behavior.
- Creation of a trading model based on clustering and prediction techniques to generate a set of rules for daily asset operations.
3. Related Works
4. Materials and Methods
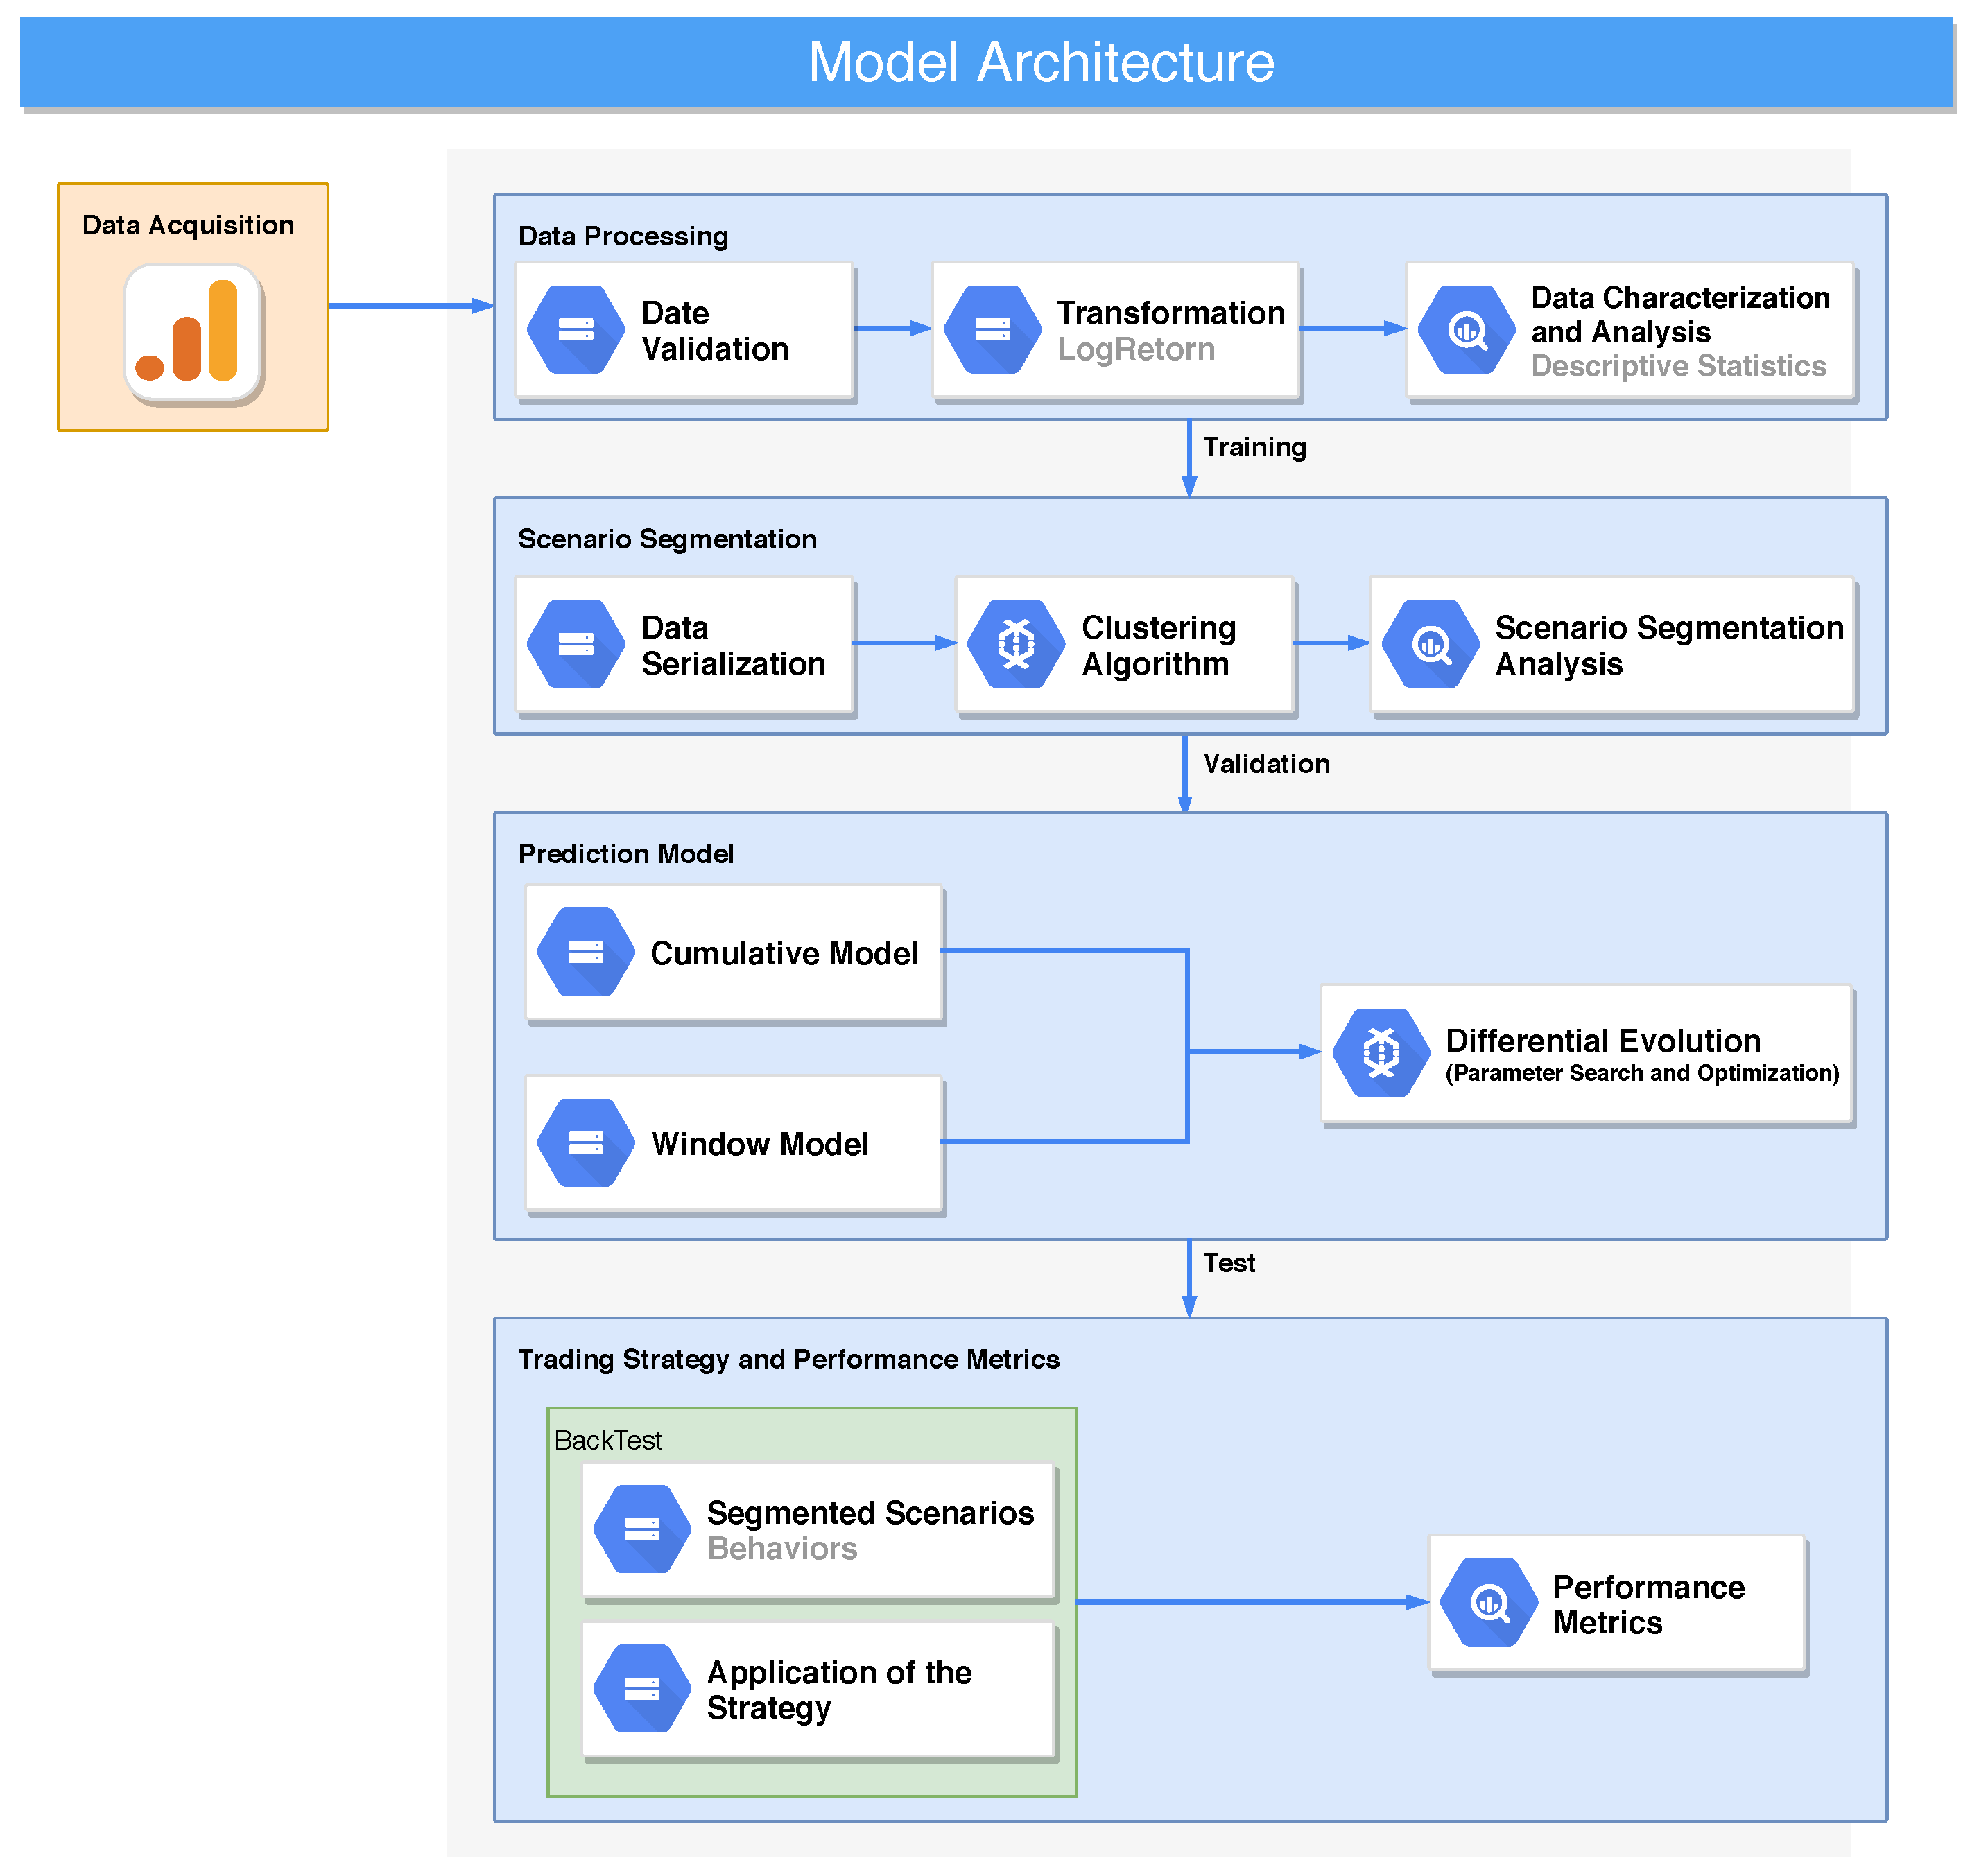
4.1. Data Acquisition and Processing
- Normalize the input data;
- Completely delete days for which there are missing data;
- Build a structure for the remaining steps.
4.2. Modeling of Scenario Segmentations
- Data Serialization: consists of the organization of the data according to the time granularity of the searched base in this study of 15 min.
- Clustering Algorithms: execution of the algorithm that defines the scenario segments of the assets.
- Flexibility regarding the level of granularity;
- Ease of handling any form of similarity or distance;
- Applicability to any attribute type.
- The difficulty of choosing the right stopping criteria;
- Most hierarchical algorithms do not revisit (intermediate) clusters once they are constructed.
4.3. Modeling the Prediction
4.4. Trading Strategy and Performance Metrics
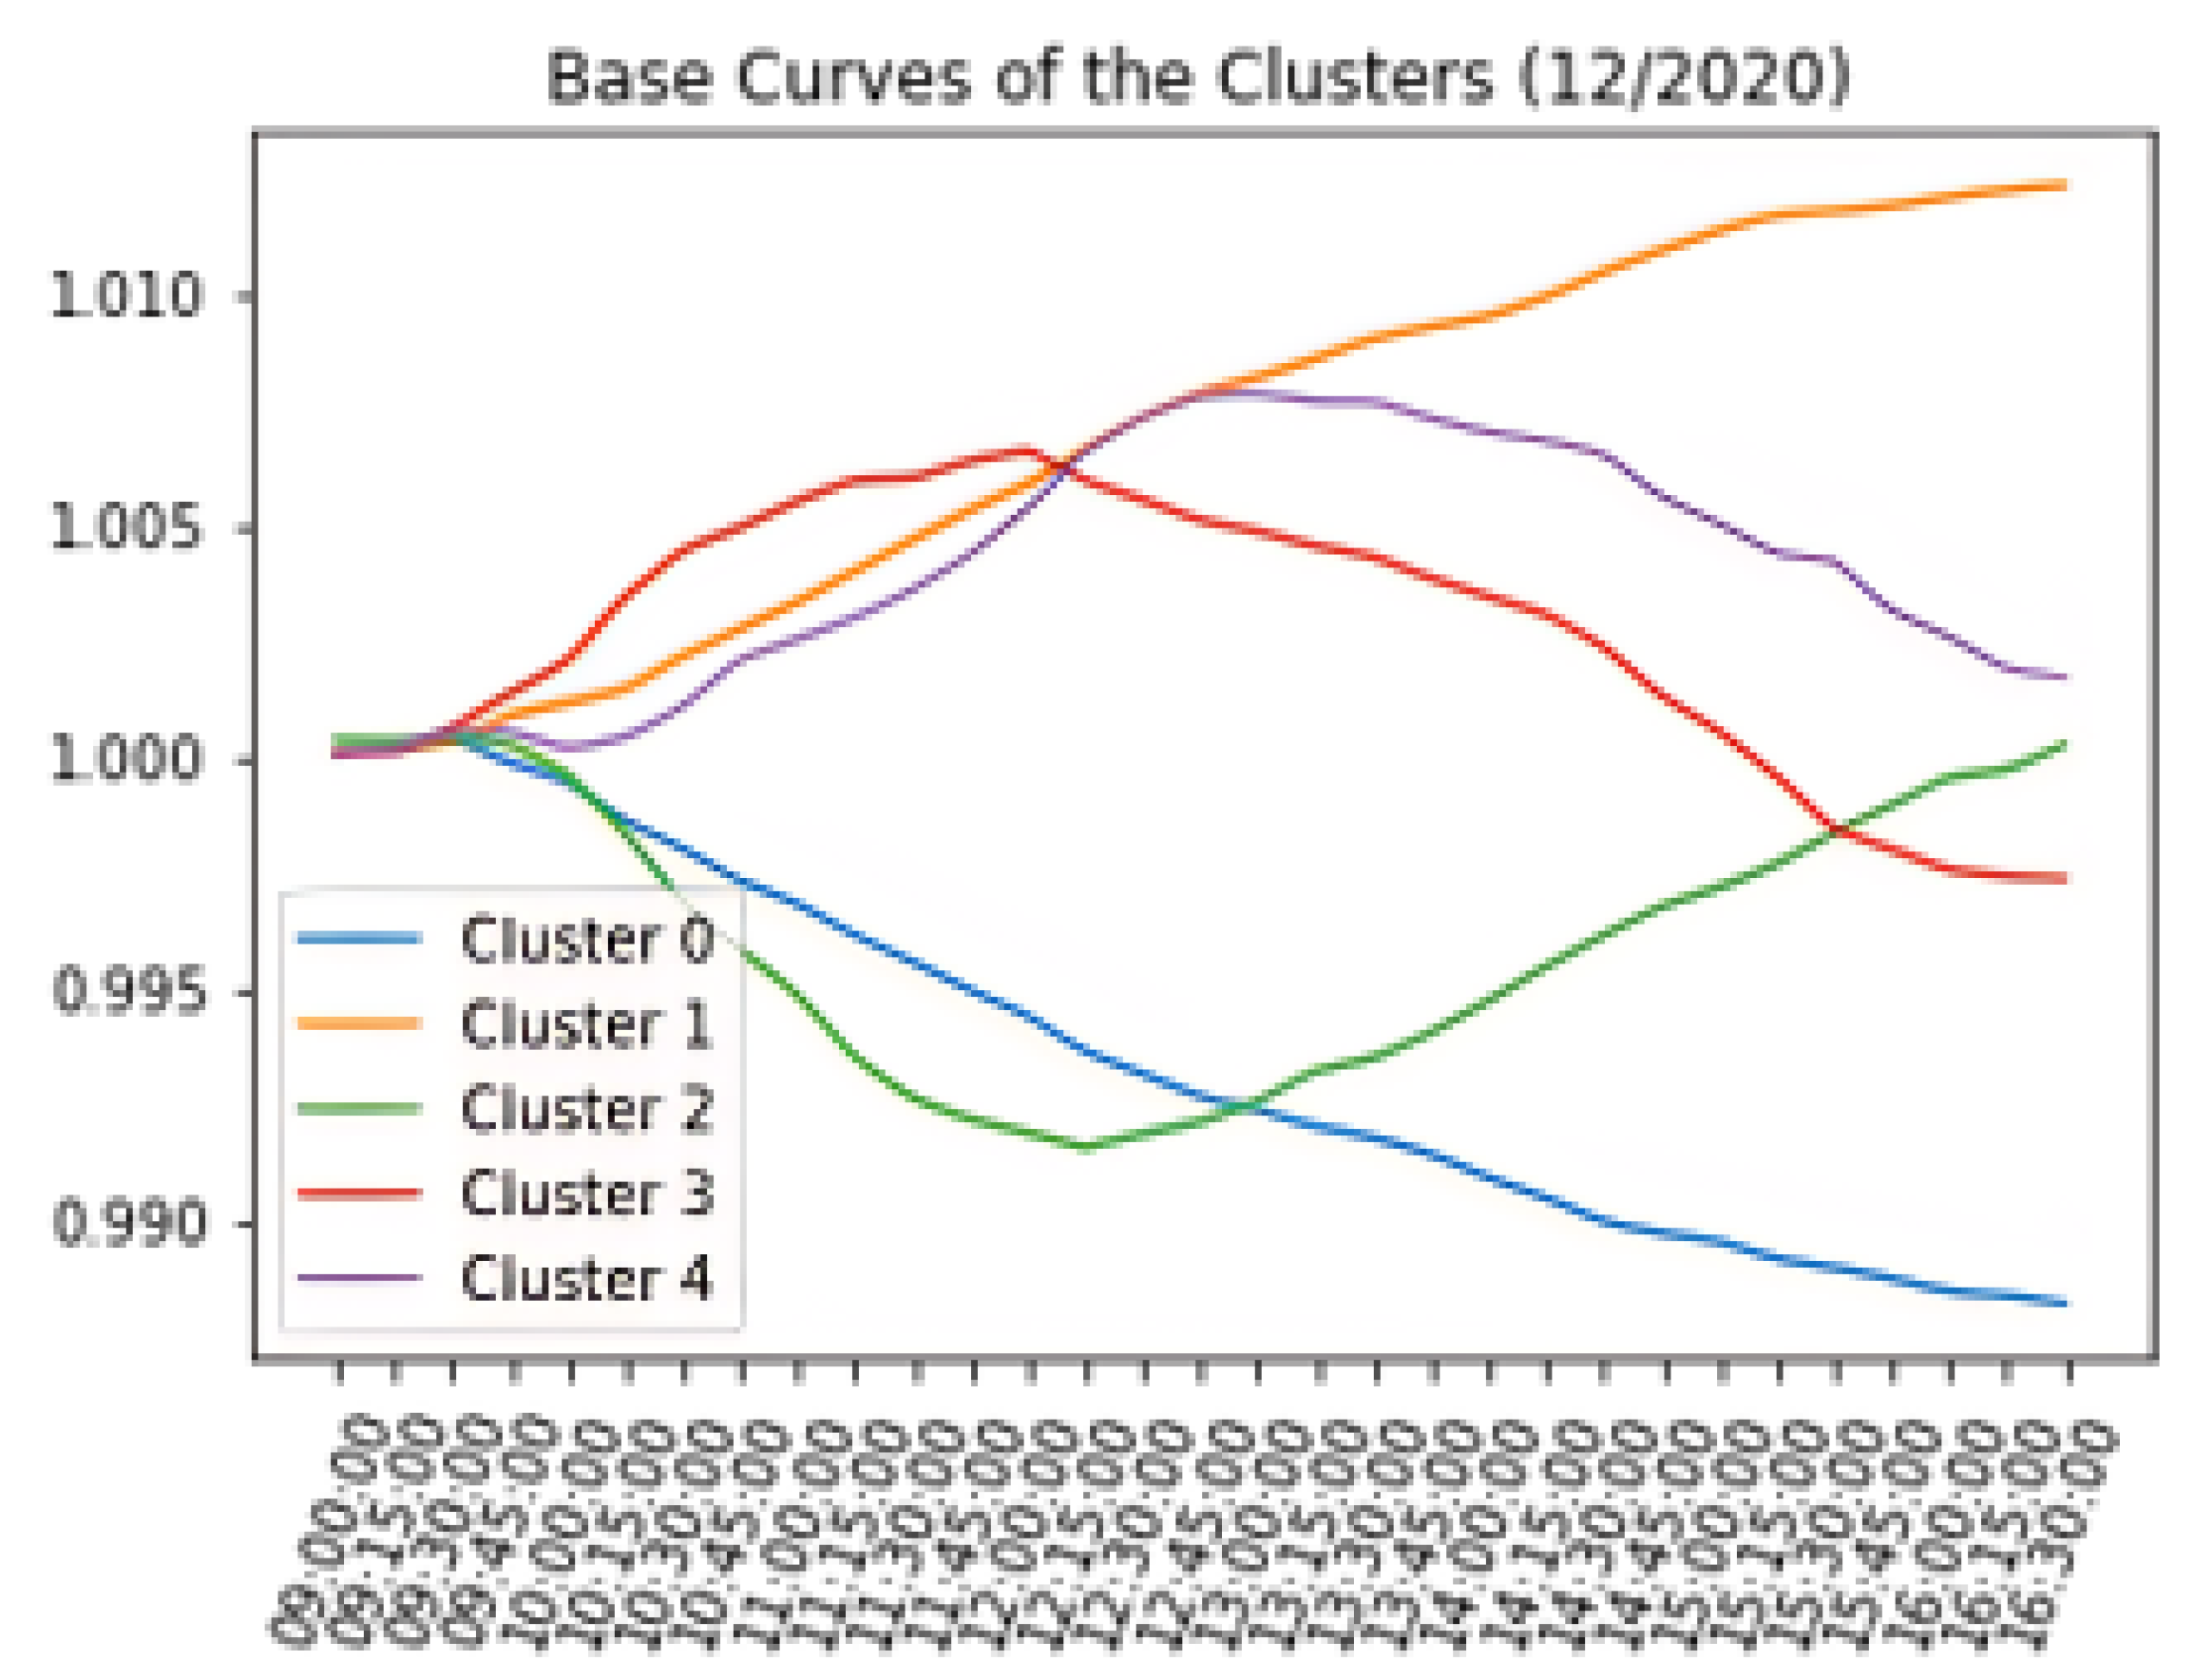
- Observing the cluster (scenarios) created, their representations, and the distribution of the curves;
- The correlation between clusters.
- Financial Return: Based on the gain or loss on the transaction and return points, with the difference in points of the buy and sale negotiations;
- DrawDown (Days): It represents the maximum number of consecutive days when the strategy operated with negative profit after any drop;
- DrawDown (Max): A maximum accumulated loss that the strategy generated;
- DrawDown (Max Unique): A maximum loss in an unique day.
- Cumulative: All daily curves are added to the model before the current test month;
- Window: Represented by data six, twelve, and twenty-four months before the current test month.
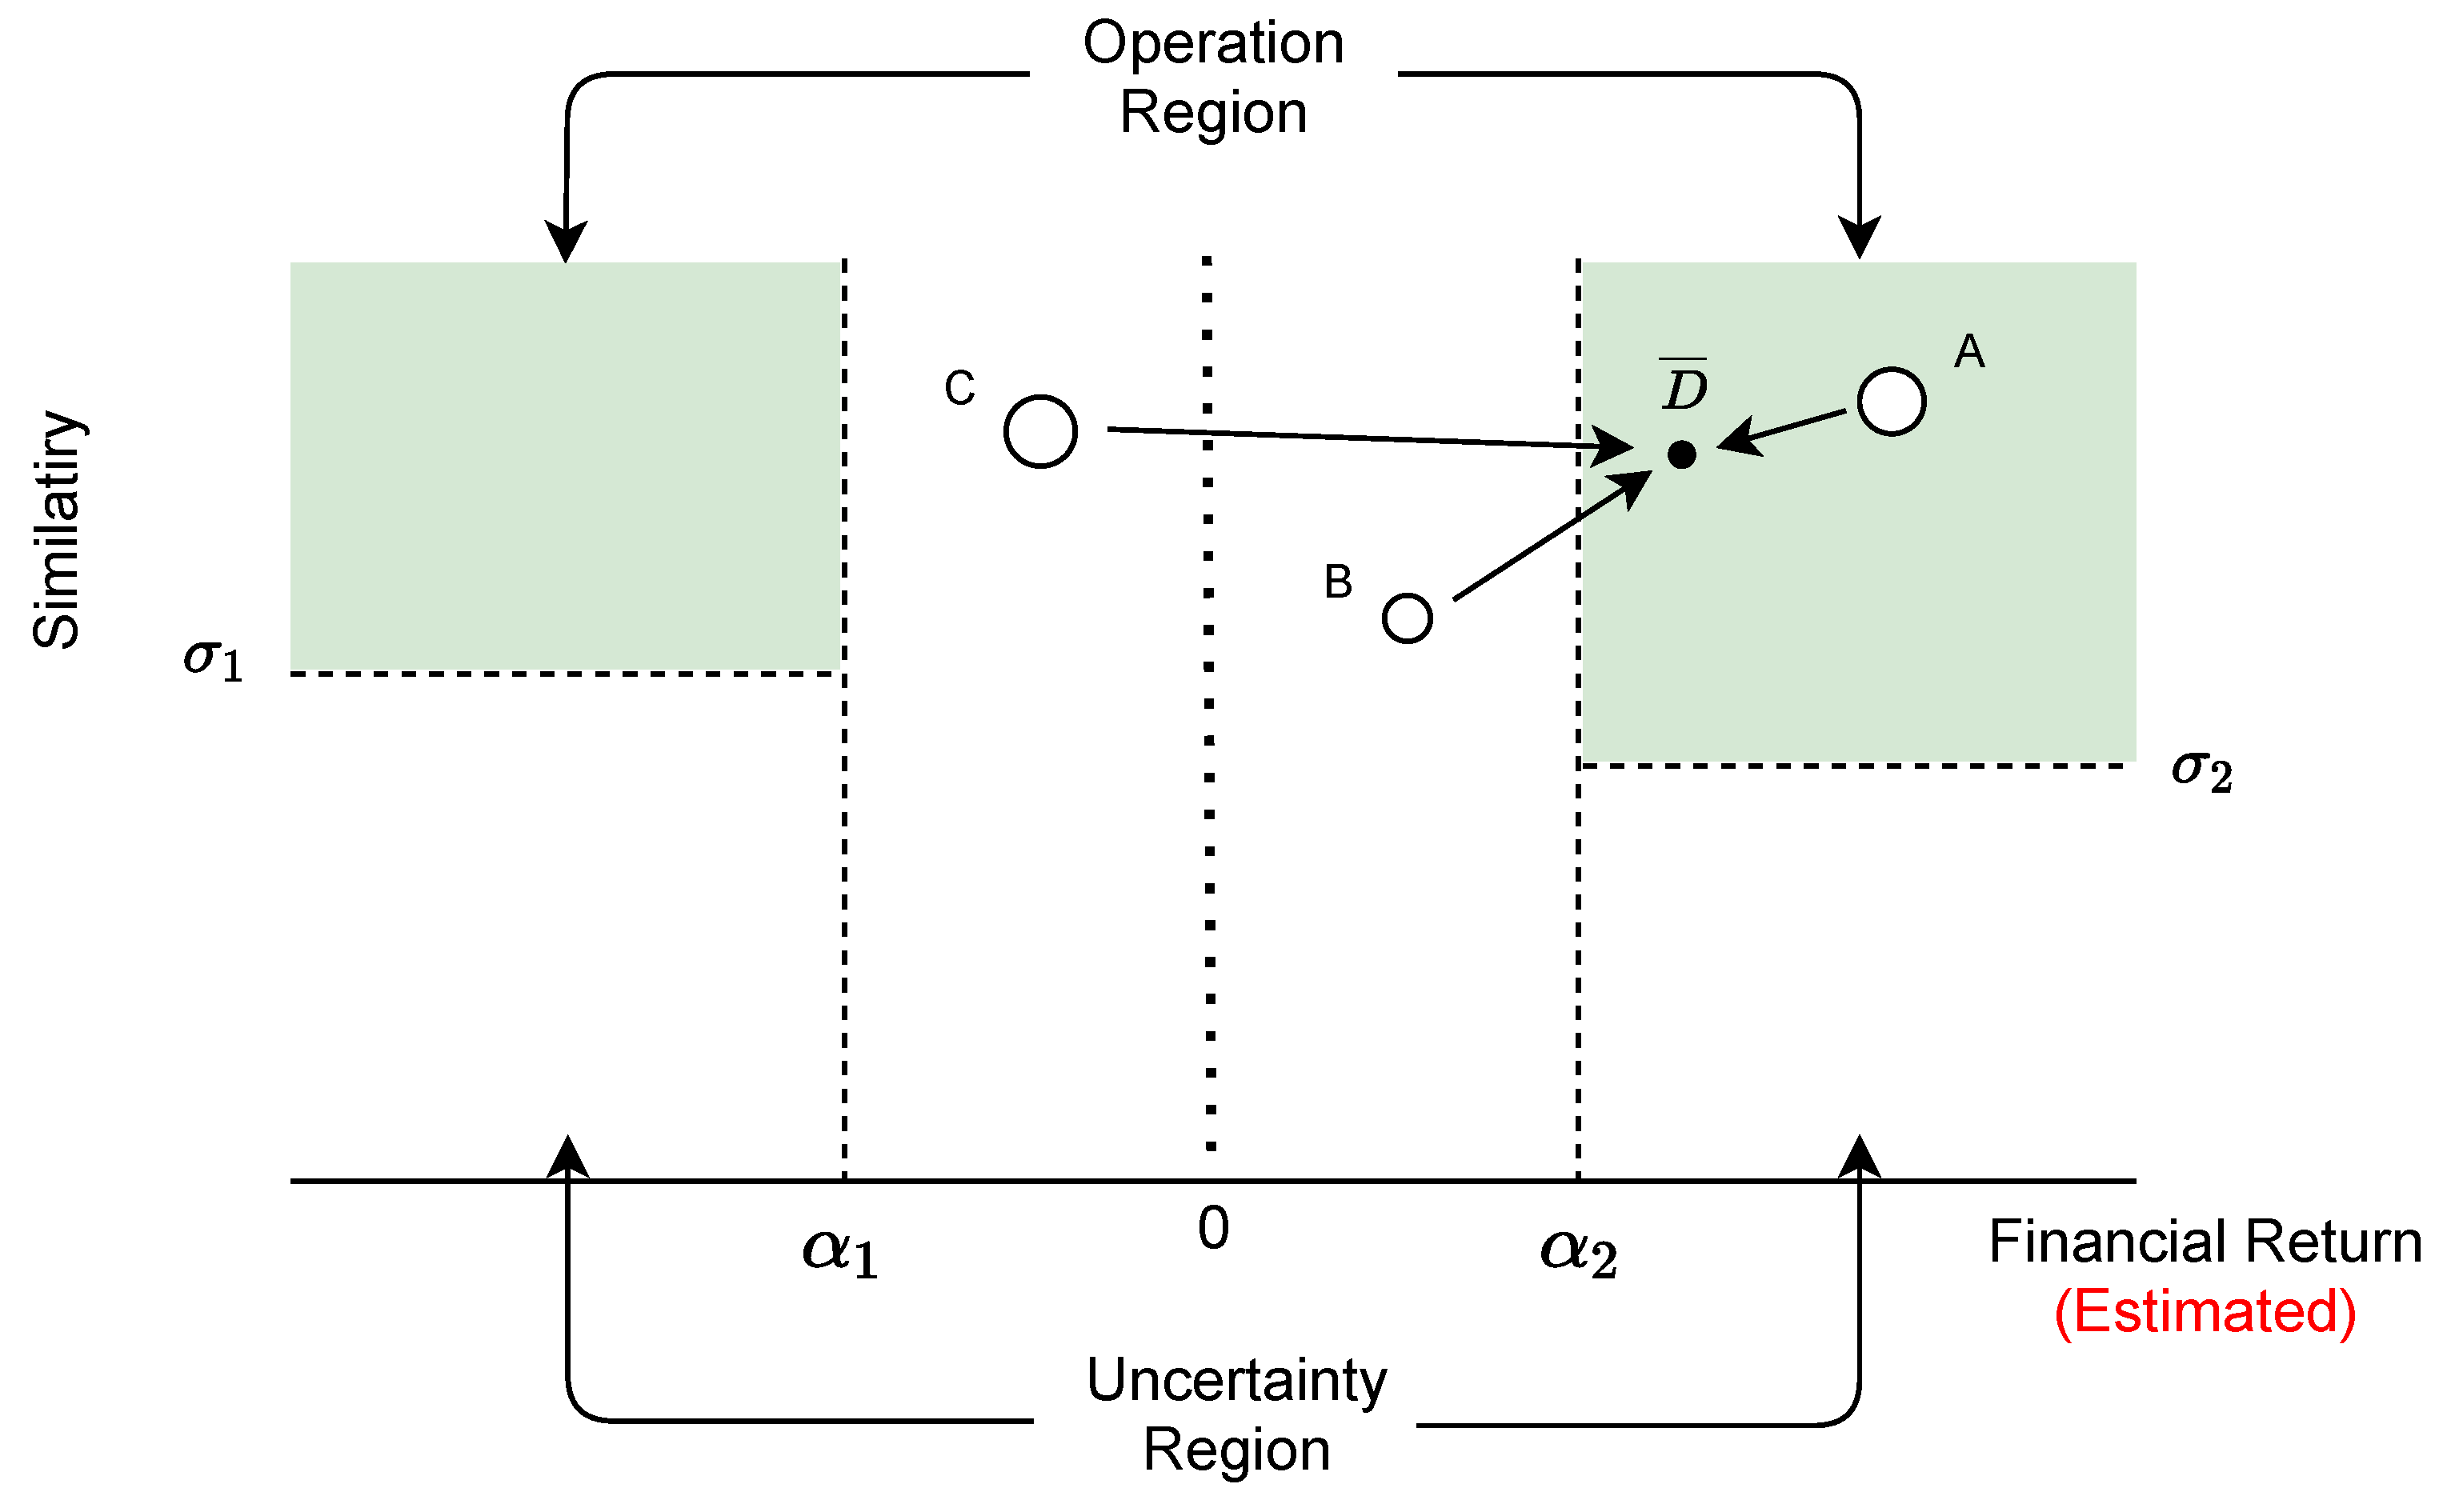
4.5. Financial Indicator: Representativeness
| Algorithm 1: Simulation and Real Operation |
|
5. Experimental Setup and Result Analysis
5.1. Characterization of Daily Assets’ Behaviors (Scenarios)
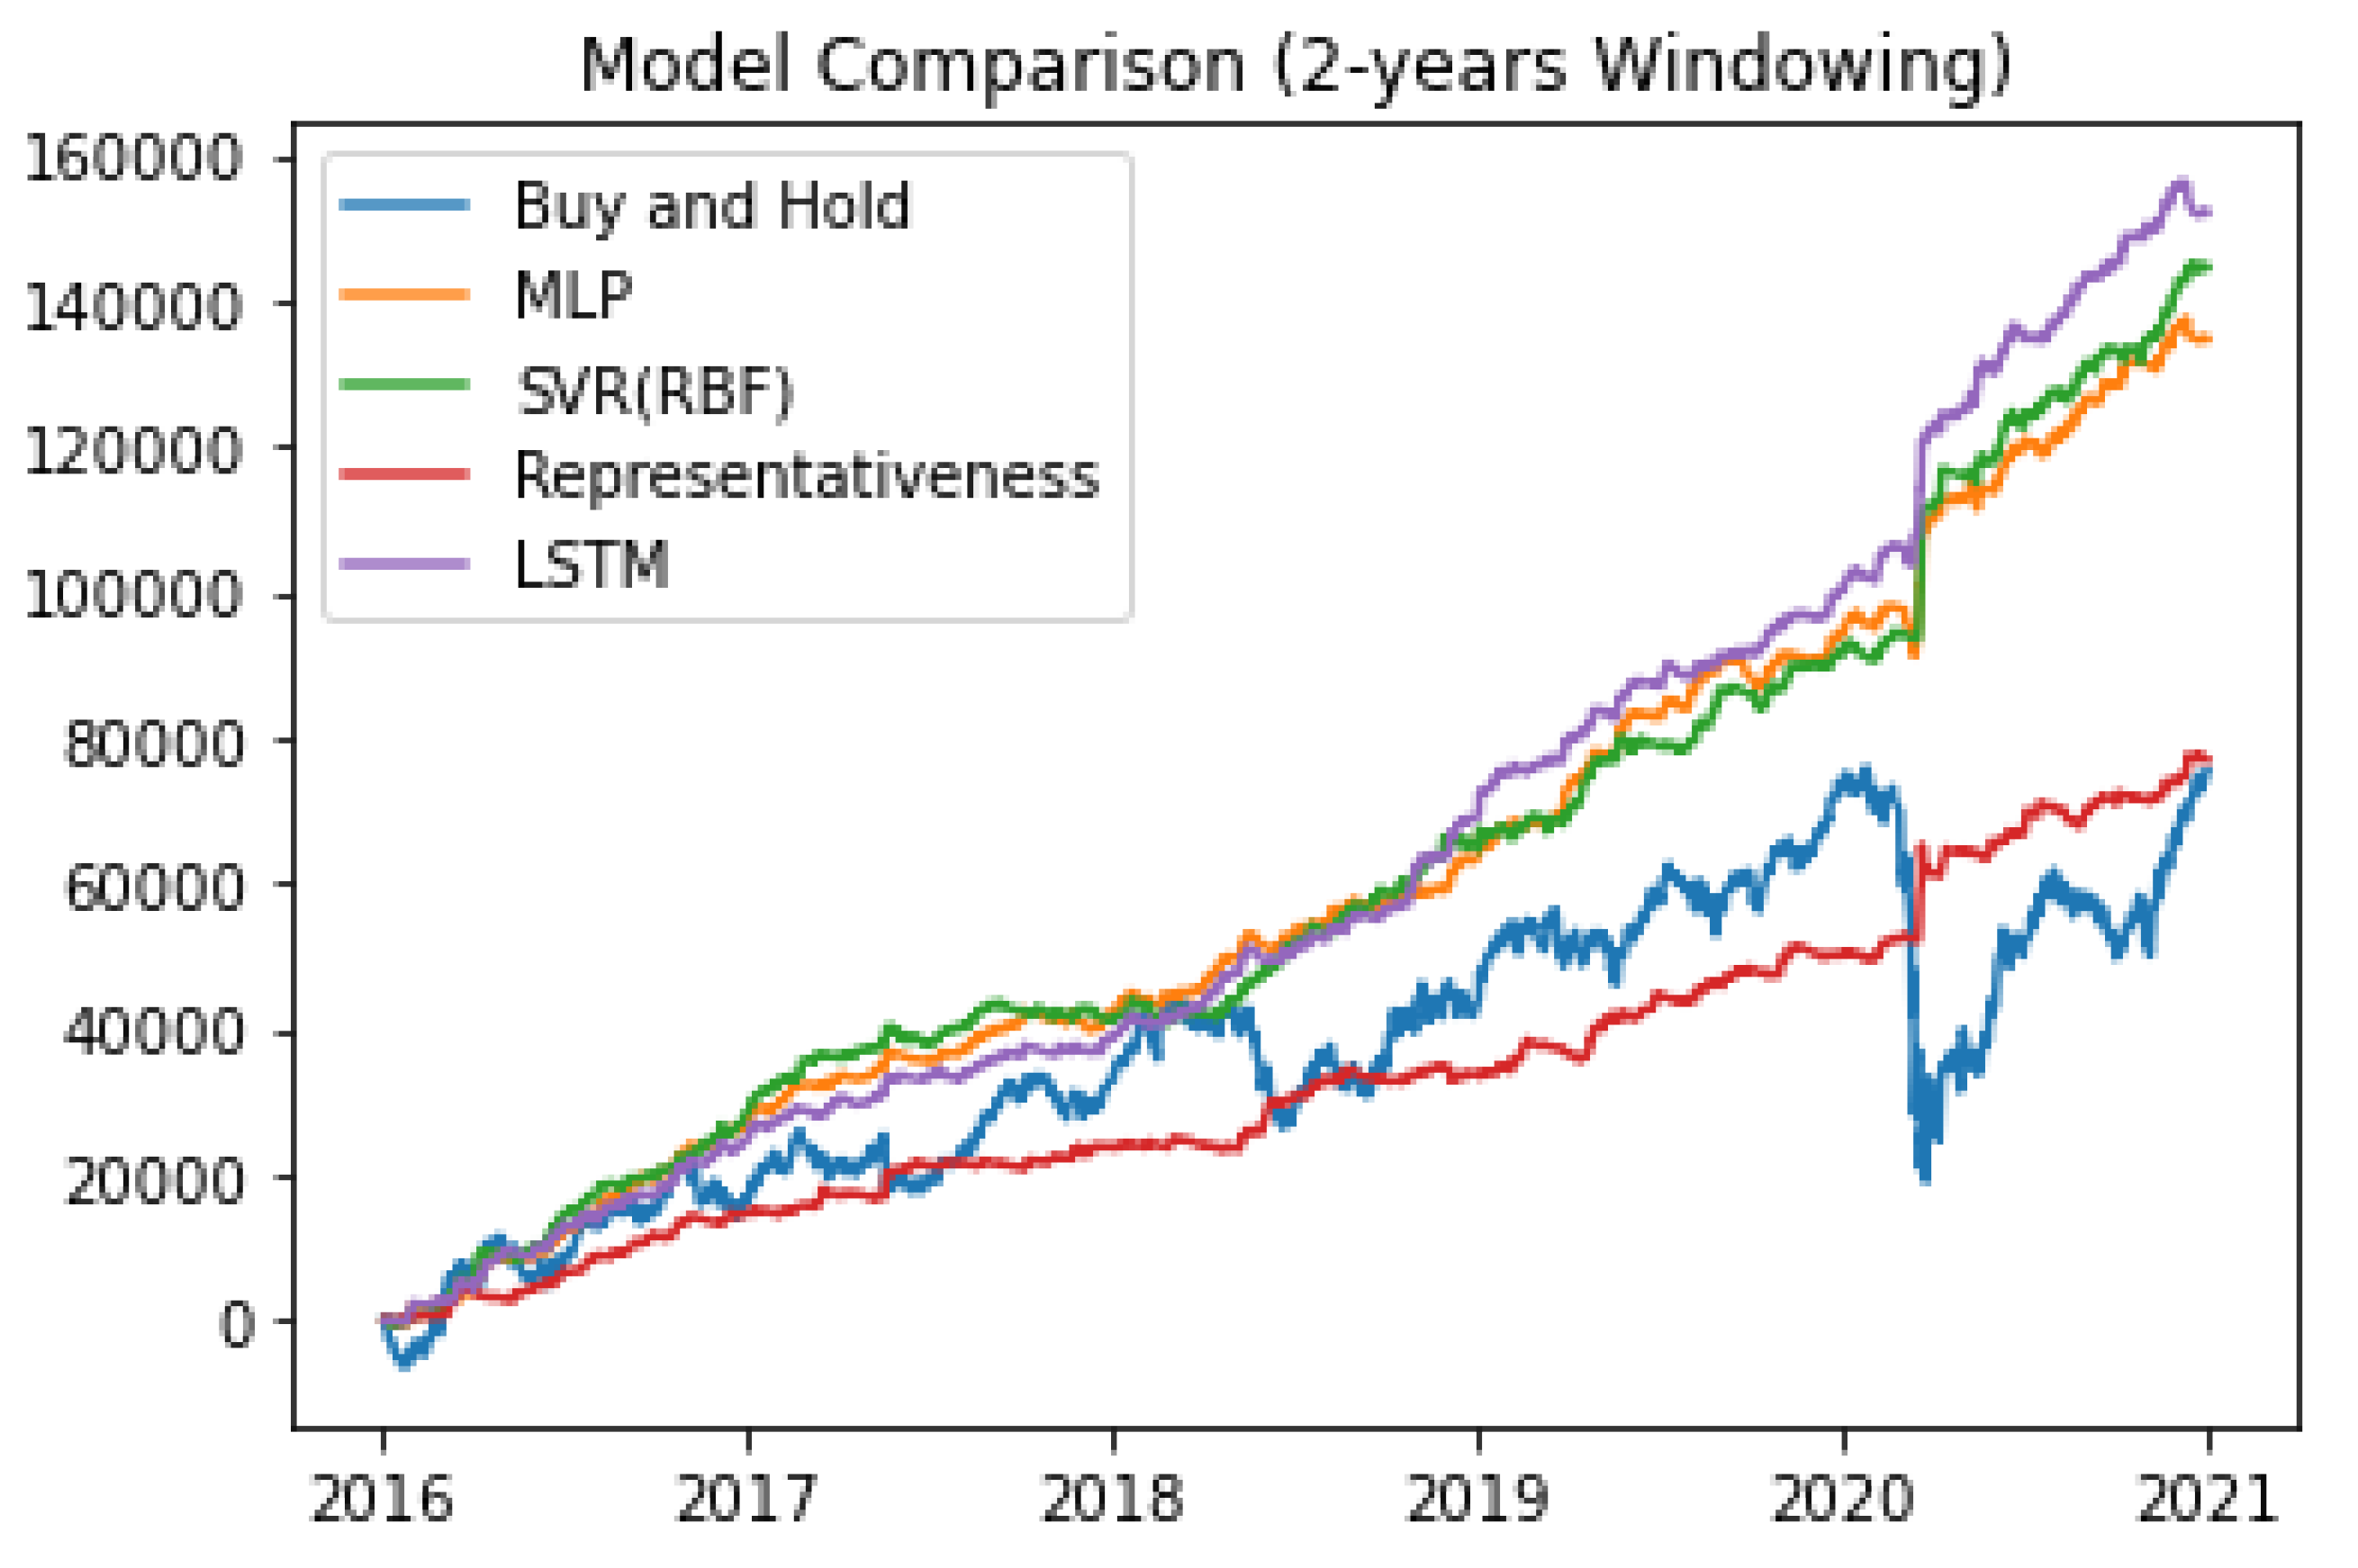
5.2. Financial Returns Based on the Proposed Model
6. Discussions on Model Limitations
6.1. Model Learning Time
6.2. Limitations Regarding Rapid Changes in the Financial Market
6.3. Financial Return Optimization
7. Conclusions
Author Contributions
Funding
Informed Consent Statement
Data Availability Statement
Conflicts of Interest
References
- Berkhin, P. (2006). A survey of clustering data mining techniques. In Grouping multidimensional data: Recent advances in clustering (pp. 25–71). Springer. [Google Scholar]
- Carvalho, W. A., Cerqueira, M. H. C., Oliveira, L. d. A. d., Simões, C. F. S., Fávero, L. P., & Santos, M. d. (2024). Application of a machine learning model to maximize the success rate in day trade operations on the American Stock Exchange. Procedia Computer Science, 242, 79–94. [Google Scholar] [CrossRef]
- Cavalcante, R. C., Brasileiro, R. C., Souza, V. L. F., Nobrega, J. P., & Oliveira, A. L. I. (2016). Computational intelligence and financial markets: A survey and future directions. Expert Systems with Applications, 55(2016), 194–211. [Google Scholar] [CrossRef]
- Chang, E., Shen, X., Yeh, H., & Demberg, V. (2021). On training instance selection for few-shot neural text generation. arXiv, arXiv:2107.03176. [Google Scholar]
- Di Persio, L., & Honchar, O. (2017). Recurrent neural networks approach to the financial forecast of google assets. International Journal of Mathematics and Computers in Simulation, 11, 7–13. [Google Scholar]
- Hammoudeh, Z., & Lowd, D. (2024). Training data influence analysis and estimation: A survey. Machine Learning, 113(5), 2351–2403. [Google Scholar] [CrossRef]
- Haykin, S. (1994). Neural networks: A comprehensive foundation. Prentice Hall PTR. [Google Scholar]
- Hegazy, O., Soliman, O. S., & Salam, M. A. (2014). A machine learning model for stock market prediction. arXiv, arXiv:1402.7351. [Google Scholar]
- Hochriter, S., & Schmidhuber, J. (1997). Long short-term memory. Neural Computation, 9(8), 1735–1780. [Google Scholar] [CrossRef]
- Hsu, M.-W., Lessmann, S., Sung, M.-C., Ma, T., & Johnson, J. E. V. (2016). Bridging the divide in financial market forecasting: Machine learners vs. financial economists. Expert Systems with Applications, 61(2016), 215–234. [Google Scholar] [CrossRef]
- Liu, G., & Wang, X. (2018). A numerical-based attention method for stock market prediction with dual information. IEEE Access, 7, 7357–7367. [Google Scholar] [CrossRef]
- Mintarya, L. N., Halim, J. N. M., Angie, C., Achmad, S., & Kurniawan, A. (2023). Machine learning approaches in stock market prediction: A systematic literature review. Procedia Computer Science, 216, 96–102. [Google Scholar] [CrossRef]
- Nabipour, M., Nayyeri, P., Jabani, H., Mosavi, A., Salwana, E., & S., S. (2020). Deep learning for stock market prediction. Entropy, 22(8), 840. [Google Scholar] [CrossRef] [PubMed]
- Rai, P., & Shubha, S. (2010). A survey of clustering techniques. International Journal of Computer Applications, 7(12), 1–5. [Google Scholar] [CrossRef]
- Ramezan, C. A., Warner, T. A., Maxwell, A. E., & Price, B. S. (2021). Effects of training set size on supervised machine-learning land-cover classification of large-area high-resolution remotely sensed data. Remote Sensing, 13(3), 368. [Google Scholar] [CrossRef]
- Roondiwala, M., Patel, H., & Varma, S. (2017). Predicting stock prices using lstm. International Journal of Science and Research (IJSR), 6, 1754–1756. [Google Scholar] [CrossRef]
- Shah, D., Isah, H., & Zulkernine, F. (2019). Stock market analysis: A review and taxonomy of prediction techniques. International Journal of Financial Studies, 7(2), 26. [Google Scholar] [CrossRef]
- Si, Y.-W., & Yin, J. (2013). OBST-based segmentation approach to financial time series. Engineering Applications of Artificial Intelligence, 26(10), 2581–2596. [Google Scholar] [CrossRef]
- Tsay, R. S. B. (2014). Financial time series (pp. 1–23). Wiley StatsRef: Statistics Reference Online. Wiley Online Library. [Google Scholar]
- Vapnik, V. (2013). The nature of statistical learning theory. Springer Science & Business Media. [Google Scholar]
- Wang, J.-Z. (2011). Forecasting stock indices with back propagation neural network. Expert Systems with Applications, 38(11), 14346–14355. [Google Scholar] [CrossRef]


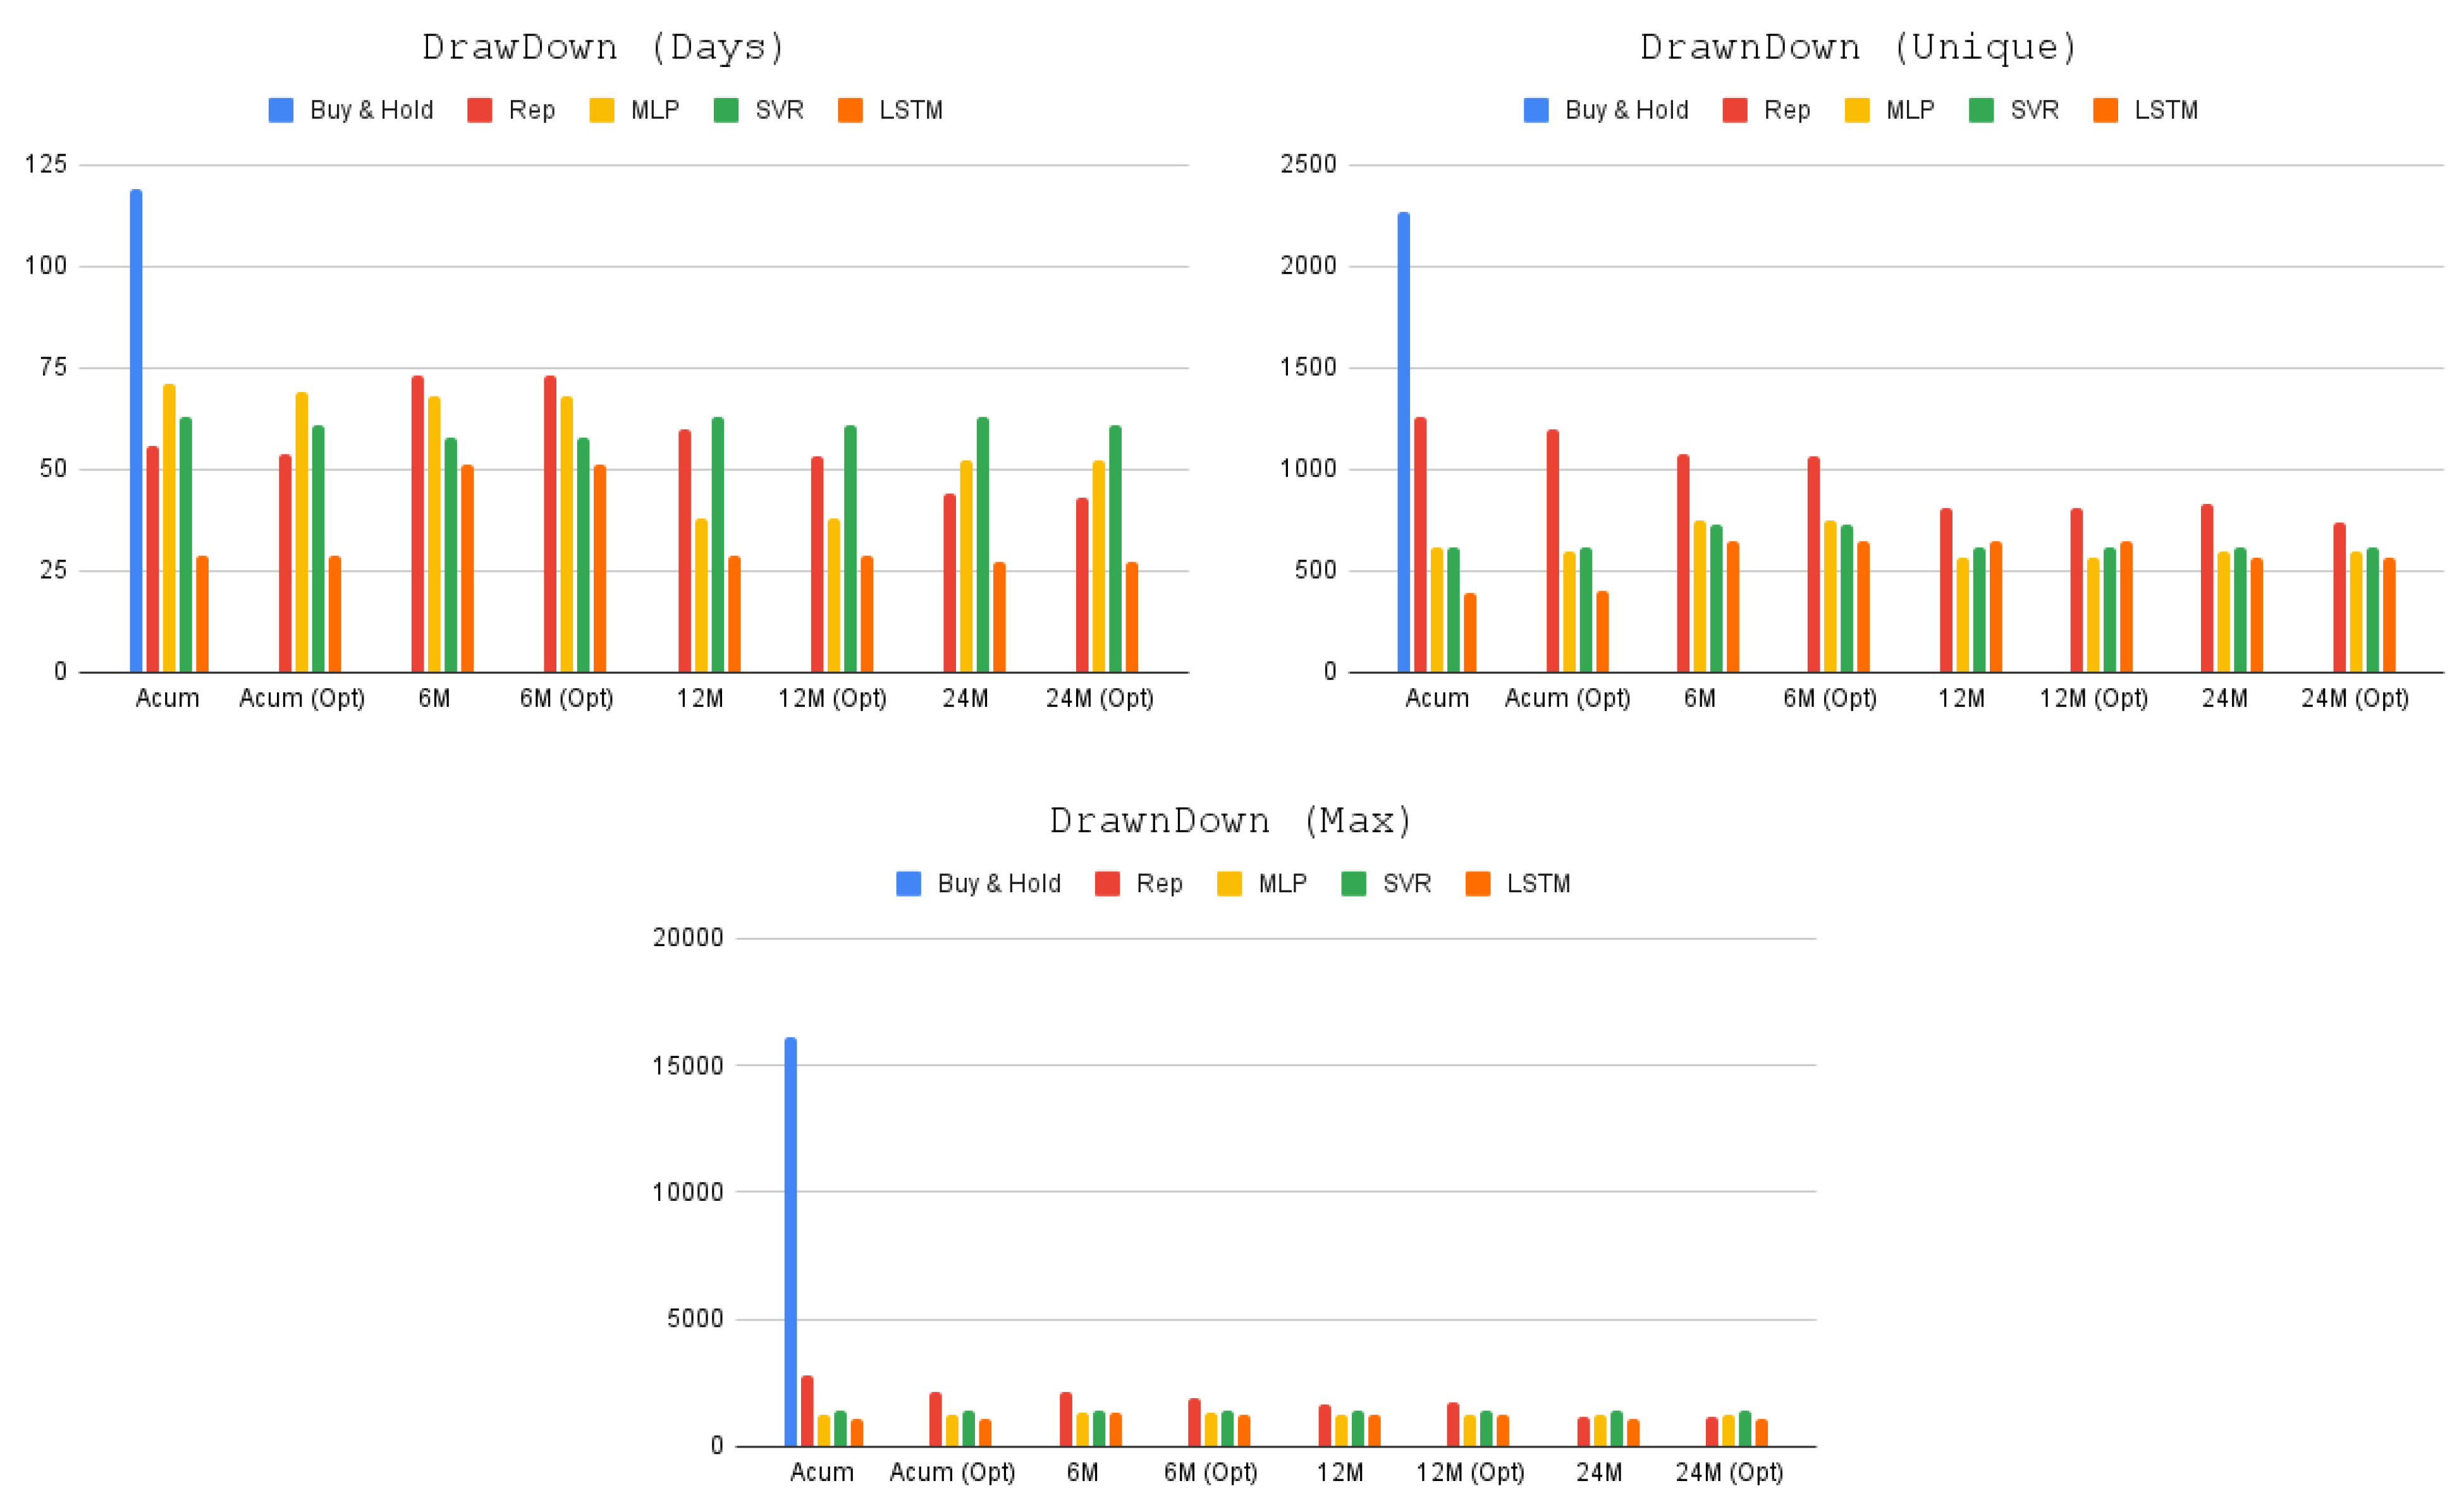
| Time Horizon | FR | DrawDown (Days) | DrawDown (Max) | DrawDown (Unique) | |
|---|---|---|---|---|---|
| B. & H. | 75.652 | 119 | −16.080 | −2.265 | |
| Rep | Acum | 76.265 | 56 | −2.837 | −1.263 |
| Acum (Opt) | 76.323 | 54 | −2.120 | −1.198 | |
| 6 M | 76.486 | 73 | −2.126 | −1.072 | |
| 6M (Opt) | 76.543 | 73 | −1.879 | −1.068 | |
| 12 M | 76.645 | 61 | −1.628 | −807 | |
| 12M (Opt) | 76.726 | 60 | −1.747 | −807 | |
| 24 M | 76.838 | 44 | −1.215 | −834 | |
| 24M (Opt) | 77.234 | 43 | −1.209 | −734 | |
| MLP | Acum | 126.424 | 71 | −1.254 | −612 |
| Acum (Opt) | 126.578 | 69 | −1.254 | −592 | |
| 6 M | 132.789 | 68 | −1.351 | −552 | |
| 6M (Opt) | 133.089 | 68 | −1.351 | −552 | |
| 12 M | 133.687 | 38 | −1.287 | −562 | |
| 12M (Opt) | 133.687 | 38 | −1.287 | −562 | |
| 24 M | 134.692 | 52 | −1.220 | −592 | |
| 24M (Opt) | 134.756 | 52 | −1.220 | −592 | |
| SVR | Acum | 127.543 | 63 | −1.441 | −612 |
| Acum (Opt) | 127.564 | 61 | −1.441 | −612 | |
| 6 M | 134.265 | 58 | −1.441 | −623 | |
| 6M (Opt) | 134.265 | 58 | −1.441 | −623 | |
| 12 M | 144.398 | 63 | −1.387 | −612 | |
| 12M (Opt) | 144.452 | 61 | −1.441 | −612 | |
| 24 M | 144.531 | 63 | −1.387 | −612 | |
| 24M (Opt) | 144.565 | 61 | −1.441 | −612 | |
| LSTM | Acum | 129.504 | 29 | −1.102 | −483 |
| Acum (Opt) | 129.566 | 29 | −1.102 | −398 | |
| 6 M | 135.689 | 51 | −1.316 | −451 | |
| 6M (Opt) | 136.786 | 51 | −1.263 | −451 | |
| 12 M | 149.823 | 29 | −1.223 | −649 | |
| 12M (Opt) | 149.897 | 29 | −1.223 | −649 | |
| 24 M | 152.345 | 27 | −1.126 | −566 | |
| 24M (Opt) | 152.405 | 27 | −1.126 | −566 |
Disclaimer/Publisher’s Note: The statements, opinions and data contained in all publications are solely those of the individual author(s) and contributor(s) and not of MDPI and/or the editor(s). MDPI and/or the editor(s) disclaim responsibility for any injury to people or property resulting from any ideas, methods, instructions or products referred to in the content. |
© 2025 by the authors. Licensee MDPI, Basel, Switzerland. This article is an open access article distributed under the terms and conditions of the Creative Commons Attribution (CC BY) license (https://creativecommons.org/licenses/by/4.0/).
Share and Cite
Brun, A.D.M.; Pereira, A.C.M. Training Set Optimization for Machine Learning in Day Trading: A New Financial Indicator. Int. J. Financial Stud. 2025, 13, 121. https://doi.org/10.3390/ijfs13030121
Brun ADM, Pereira ACM. Training Set Optimization for Machine Learning in Day Trading: A New Financial Indicator. International Journal of Financial Studies. 2025; 13(3):121. https://doi.org/10.3390/ijfs13030121
Chicago/Turabian StyleBrun, Angelo Darcy Molin, and Adriano César Machado Pereira. 2025. "Training Set Optimization for Machine Learning in Day Trading: A New Financial Indicator" International Journal of Financial Studies 13, no. 3: 121. https://doi.org/10.3390/ijfs13030121
APA StyleBrun, A. D. M., & Pereira, A. C. M. (2025). Training Set Optimization for Machine Learning in Day Trading: A New Financial Indicator. International Journal of Financial Studies, 13(3), 121. https://doi.org/10.3390/ijfs13030121


