European Markets’ Reactions to Exogenous Shocks: A High Frequency Data Analysis of the 2005 London Bombings


Abstract
:1. Introduction
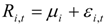
2. Data and Methodology
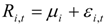
 and
and

 and
and


 ,
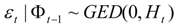
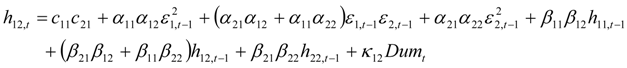
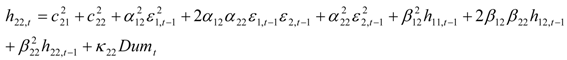
,  represent the deviations from the mean attributed to the unanticipated event in each market. The cross values of the error terms
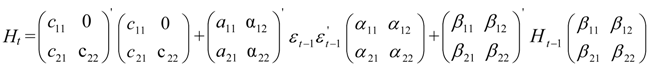
  represent the news in the first and second index in time of period t – 1. By
  we describe the conditional variance for the first stock index (in our case FTSE-100) at time t – 1, conditional variance for the second stock index (in our case CAC-40 or DAX-30) at time t – 1, and the conditional covariance between the first and the second index in our model.
3. Findings and Discussion

| Date | Open | High | Low | Close | Daily Return | High-Low | |
|---|---|---|---|---|---|---|---|
| 6 July 2005 | 5190.10 | 5237.60 | 5190.10 | 5229.60 | 0.758% | 47.50 | |
| FTSE-100 Index | 7 July 2005 | 5229.60 | 5229.60 | 5022.10 | 5158.30 | –1.373% | 207.50 |
| 8 July 2005 | 5158.30 | 5232.20 | 5158.30 | 5232.20 | 1.422% | 73.90 | |
| 6 July 2005 | 4607.57 | 4636.96 | 4607.57 | 4615.49 | 0.257% | 29.39 | |
| DAX-30 Index | 7 July 2005 | 4595.23 | 4595.23 | 4444.94 | 4530.18 | –1.866% | 150.29 |
| 8 July 2005 | 4560.43 | 4597.97 | 4559.57 | 4597.97 | 1.485% | 38.40 | |
| 6 July 2005 | 4272.64 | 4292.07 | 4264.00 | 4279.95 | 0.638% | 28.07 | |
| CAC-40 Index | 7 July 2005 | 4269.56 | 4269.77 | 4089.27 | 4220.62 | –1.396% | 180.50 |
| 8 July 2005 | 4264.71 | 4300.31 | 4252.07 | 4300.31 | 1.871% | 48.24 |
| CAC- 40 Index | DAX- 30 Index | FTSE -100 Index | |
|---|---|---|---|
| Mean | 1.16 × 10⁻⁵ | 1.35 × 10⁻⁵ | 8.09 × 10⁻⁶ |
| Maximum | 0.0128 | 0.0156 | 0.0101 |
| Minimum | –0.0168 | –0.0229 | –0.0138 |
| Std. Dev. | 0.0009 | 0.0011 | 0.0007 |
| Skewness | –0.9576 | –1.9041 | –0.7345 |
| Kurtosis | 40.8166 | 62.1455 | 40.6416 |
| Jarque-Bera | 612336.3 | 1500214 | 606051.9 |
| Probability | (0.00) *** | (0.00) *** | (0.00) *** |
| Observations | 10250 | 10250 | 10250 |
| RFTSE-RCAC | RFTSE-RDAX | |||||||||||
|---|---|---|---|---|---|---|---|---|---|---|---|---|
| Whole Sample | Pre-Bomb period 21/01/2005-05/07/2005 | Post-Bomb period 07/07/2005-28/10/2005 | Whole Sample | Pre-Bomb period 21/01/2005-05/07/2005 | Post-Bomb period 07/07/2005-28/10/2005 | |||||||
| Coeff | Signif. | Coeff | Signif. | Coeff | Signif. | Coeff | Signif. | Coeff | Signif. | Coeff | Signif. | |
| μ1 | 2.06E-05 | (0.00) *** | 2.34E-05 | (0.00) *** | 1.20E-05 | (0.21) | 1.43E-05 | (0.01) ** | 2.20E-05 | (0.01) ** | 1.17E-05 | (0.19) |
| μ2 | 3.53E-05 | (0.00) *** | 3.70E-05 | (0.00) *** | 1.60E-05 | (0.23) | 2.29E-05 | (0.00) *** | 3.07E-05 | (0.00) *** | 1.89E-05 | (0.16) |
| c11 | 1.38E-04 | (0.00) *** | 1.21E-04 | (0.00) *** | −2.12E-04 | (0.00) *** | 1.69E-04 | (0.00) *** | 3.67E-04 | (0.00) *** | 1.71E-04 | (0.00) *** |
| c21 | -2.03E-04 | (0.00) *** | −1.97E-04 | (0.00) *** | 1.23E-04 | (0.00) *** | −1.71E-04 | (0.00) *** | −1.78E-04 | (0.00) *** | 2.10E-04 | (0.00) *** |
| c22 | -9.49E-08 | (0.99) | 3.40E-07 | (0.99) | −2.00E-09 | (0.99) | 9.05E-05 | (0.01) ** | −3.63E-07 | (0.99) | −2.86E-04 | (0.00) *** |
| α11 | 0.0708 | (0.00) *** | −0.0103 | (0.68) | 0.3132 | (0.00) *** | 0.0466 | (0.00) *** | −0.3445 | (0.00) *** | 0.1215 | (0.00) *** |
| α12 | -0.1859 | (0.00) *** | −0.0809 | (0.00) *** | 0.2333 | (0.00) *** | −0.3094 | (0.00) *** | −0.0891 | (0.00) *** | −0.3445 | (0.00) *** |
| α21 | 0.4181 | (0.00) *** | 0.5131 | (0.00) *** | −0.0476 | (0.09) * | 0.3560 | (0.00) *** | 0.5186 | (0.00) *** | 0.2712 | (0.00) *** |
| α22 | 0.6211 | (0.00) *** | 0.6166 | (0.00) *** | 0.3092 | (0.00) *** | 0.6613 | (0.00) *** | 0.6731 | (0.00) *** | 0.6776 | (0.00) *** |
| β11 | 0.9832 | (0.00) *** | 0.9825 | (0.00) *** | 0.6514 | (0.00) *** | 0.9622 | (0.00) *** | 0.0686 | (0.53) | 0.9693 | (0.00) *** |
| β12 | 0.2914 | (0.00) *** | 0.2375 | (0.00) *** | −0.1966 | (0.00) *** | 0.2865 | (0.00) *** | −0.1268 | (0.02) ** | 0.1226 | (0.00) *** |
| β21 | -0.1112 | (0.00) *** | −0.1316 | (0.00) *** | 0.2478 | (0.00) *** | −0.0851 | (0.00) *** | 0.5139 | (0.00) *** | −0.0756 | (0.00) *** |
| β22 | 0.6962 | (0.00) *** | 0.7085 | (0.00) *** | 0.9896 | (0.00) *** | 0.7365 | (0.00) *** | 0.9177 | (0.00) *** | 0.8010 | (0.00) *** |
| κ11 | 1.96E-03 | (0.00) *** | 1.34E-03 | (0.01) ** | ||||||||
| κ12 | 3.20E-03 | (0.00) *** | 1.20E-03 | (0.24) | ||||||||
| κ22 | 1.51E-03 | (0.00) *** | 1.79E-03 | (0.00) *** | ||||||||
| GED Parameter | 0.9268 | (0.00) *** | 0.9218 | (0.00) *** | 0.9117 | (0.00) *** | 0.9459 | (0.00) *** | 0.9122 | (0.00) *** | 0.9577 | (0.00) *** |
| Observations | 10250 | 6068 | 4182 | 10250 | 6068 | 4182 | ||||||
| Log Likelihood | 121740.71 | 72829.31 | 49053.41 | 120011.73 | 72276.21 | 48032.47 | ||||||
 ) and they are also indirectly affected by news generated from the London market ( and ). A reverse direction is also evident from the German and French markets to the London market but they are lower in magnitude as it can be deduced from the relevant coefficients in absolute terms (
  ). It is worth mentioning at that point that when we separate our sample into two sub-samples pre- and post- bomb period interesting findings appear5. More specifically,
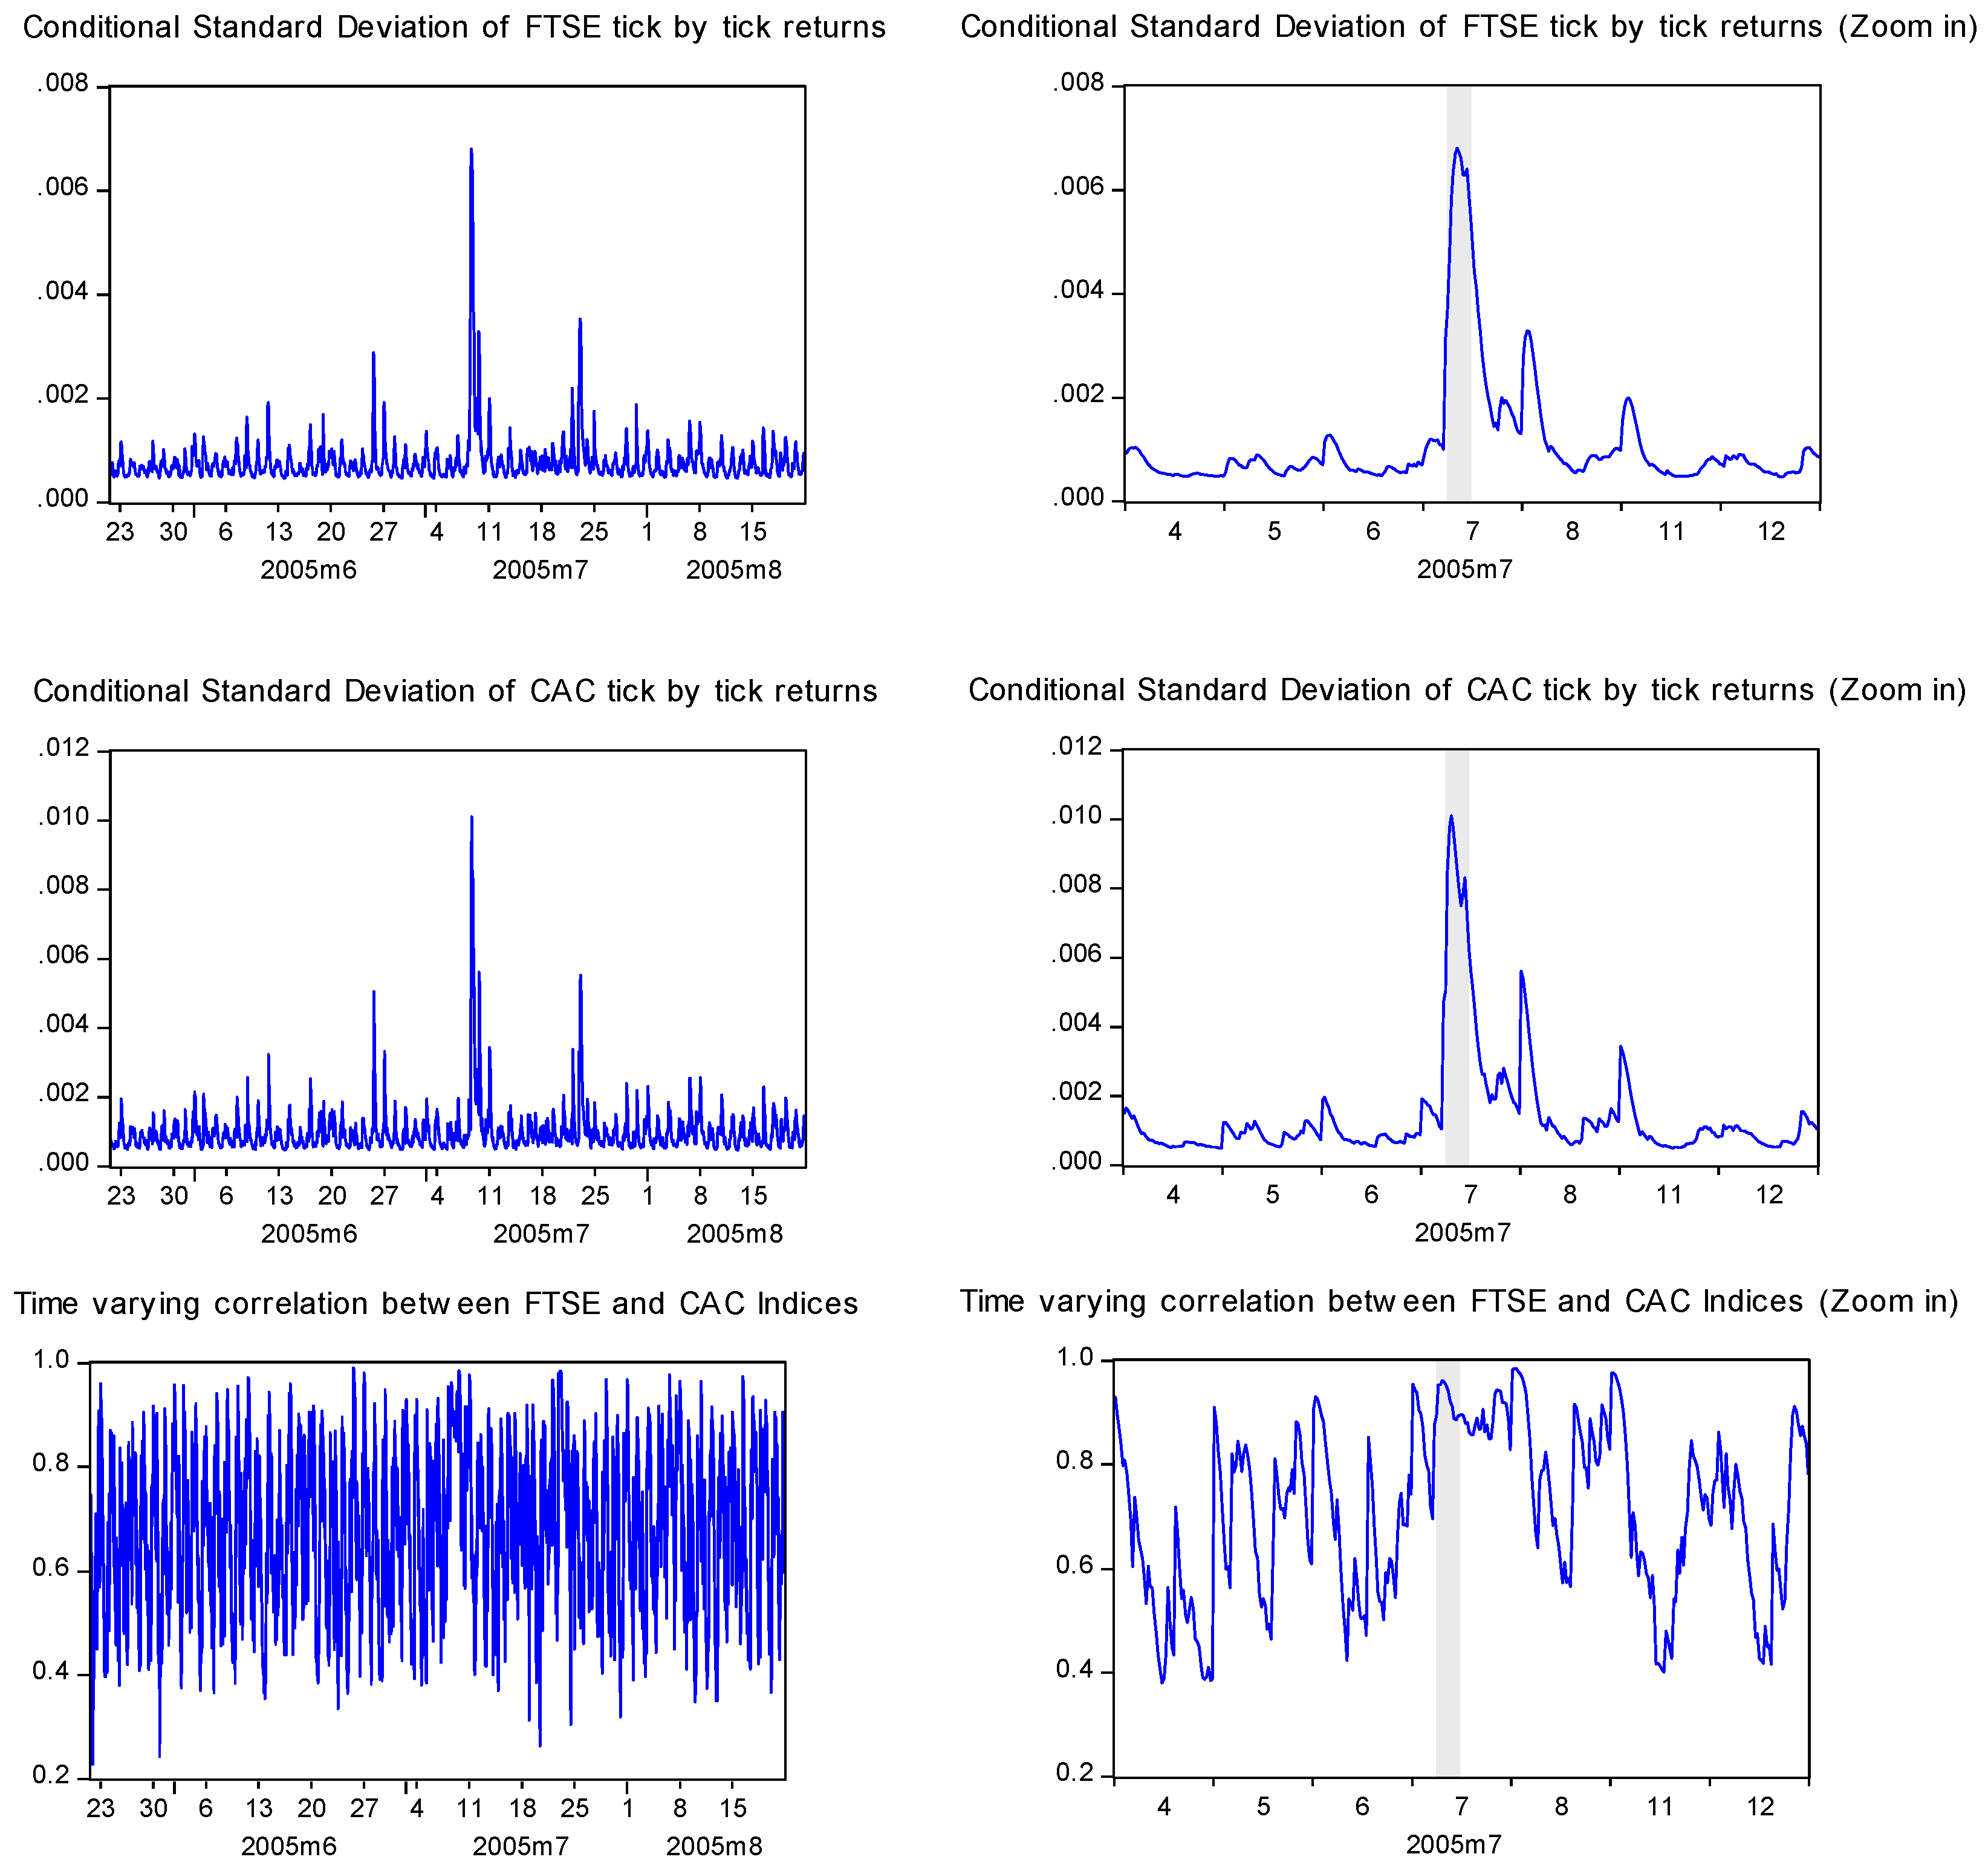
  coefficient is higher in the post-bomb period for both DAX and CAC. Therefore, this event seems to affect the way that news is transmitted by London to the other two stock indices. Moreover, the statistical significant positive mean return over the first sub-period for both CAC and DAX indices, become insignificant over the second sub-period. The volatilities of all the indices’ returns are directly affected by their own past volatilities respectively in the whole sample estimation (the relevant coefficient is 0.96 for the British market and 0.48, 0.54 for the French and German market respectively). However, in the case of France, volatility persistence increased in the post-bomb period. Indirect effects of past volatilities are also present in each case. However, the indirect effects of the London market on the CAC and DAX volatilities respectively, are higher compared to the indirect effects of the latter on FTSE (
  ) for the whole sample. Focusing on the covariance equation in the bivariate BEKK-GARCH models, unexpected shocks in the London market reduce the covariance between FTSE and CAC or DAX. However, unexpected shock in the French and German markets increases their covariance with the London market.
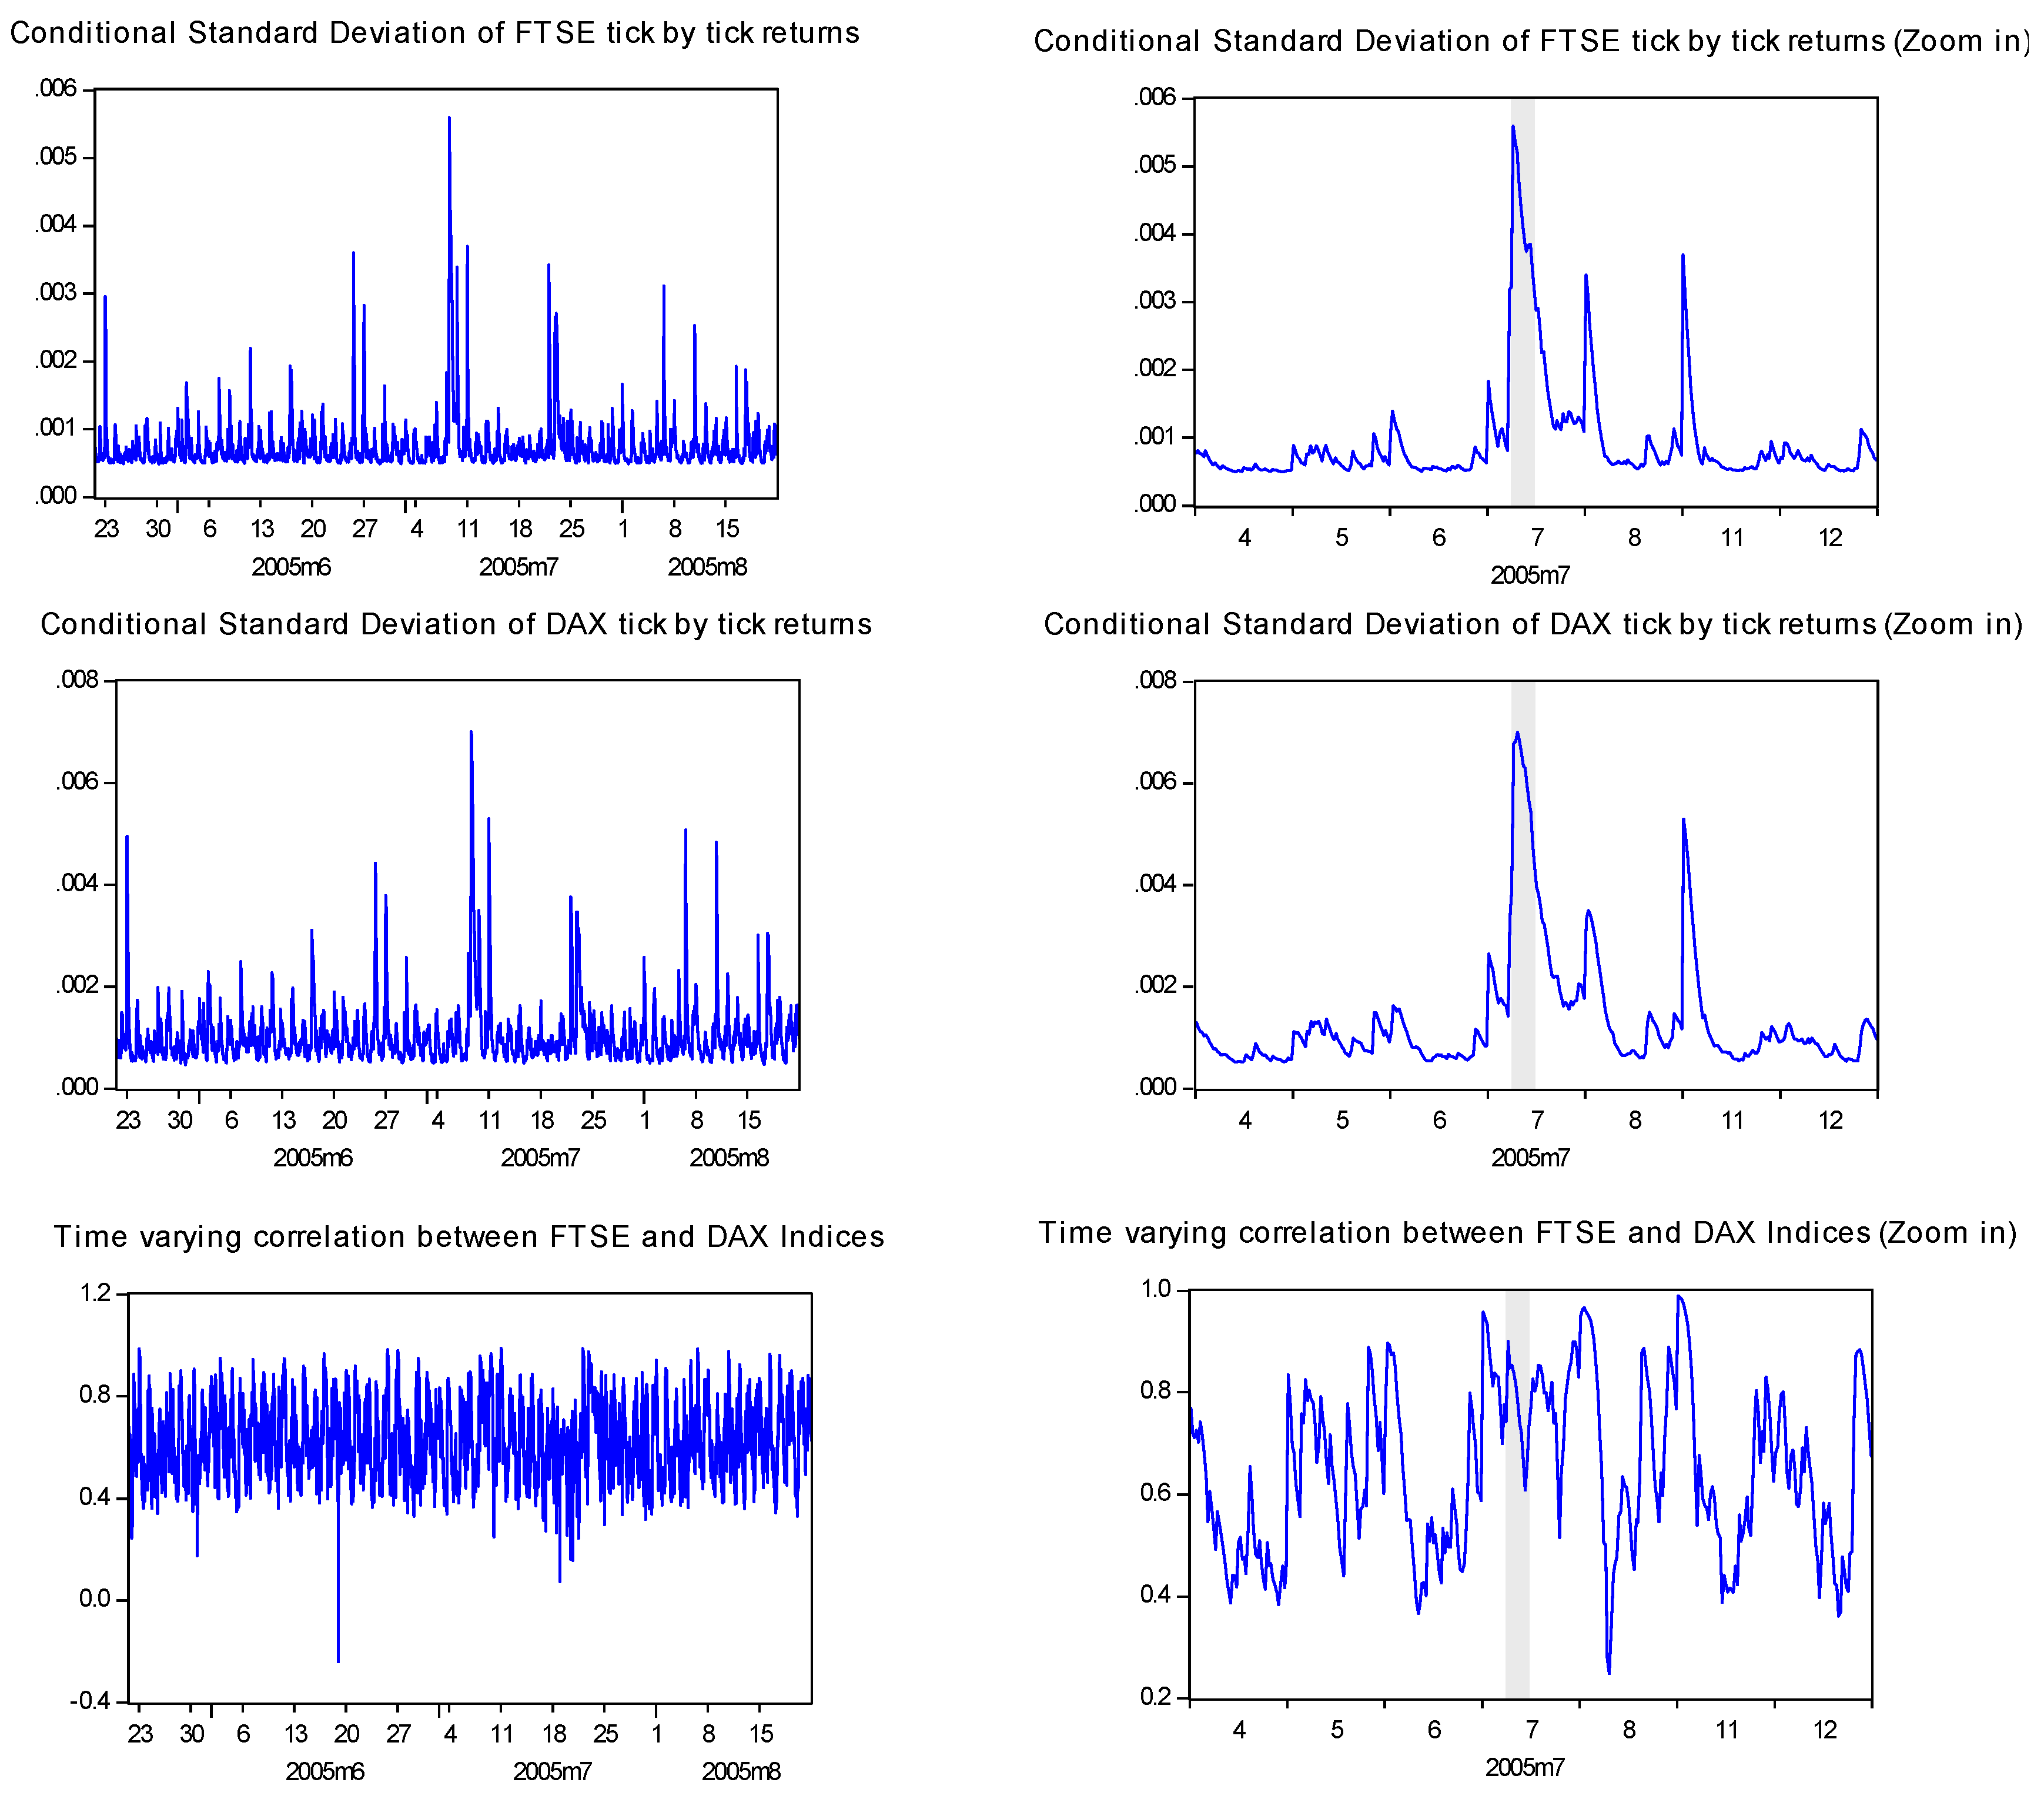
4. Conclusions
Acknowledgments
Conflicts of Interest
References
- M. Pericoli, and M. Sbracia. “A primer on financial contagion.” J. Econ. Surv. 17 (2003): 571–608. [Google Scholar]
- W.N. Goetzmann, L. Li, and K.G. Rouwenhorst. “Long-term global market correlations.” J. Bus. 78 (2005): 1–38. [Google Scholar]
- K. Saleem. “International linkage of the Russian market and the Russian financial crisis: A multivariate GARCH analysis.” Res. Int. Bus. Financ. 23 (2009): 243–256. [Google Scholar] [CrossRef]
- I. Meric, and G. Meric. “Co-movements of European equity markets before and after the 1987 crash.” Multina. Financ. J. 2 (1997): 137–152. [Google Scholar]
- I. Asimakopoulos, J. Goddard, and C. Siriopoulos. “Interdependence between the US and major European equity markets: Evidence from spectral analysis.” Appl. Financ. Econ. 10 (2000): 41–47. [Google Scholar] [CrossRef]
- T.C. Chiang, B.N. Jeon, and H. Li. “Dynamic correlation analysis of financial contagion: Evidence from Asian markets.” J. Int. Money Financ. 26 (2007): 1206–1228. [Google Scholar] [CrossRef]
- Y. Hamao, R.W. Masulis, and V. Ng. “Correlations in price changes and volatility across international markets.” Rev. Financ. Stud. 3 (1990): 281–307. [Google Scholar] [CrossRef]
- P. Theodossiou, and U. Lee. “Mean and volatility spillovers across major national stock markets: Further empirical evidence.” J. Financ. Res. 16 (1993): 337–350. [Google Scholar]
- W. Lin, R. Engle, and T. Ito. “Do bulls and bears move across borders? International transmission of stock returns and volatility.” Rev. Financ. Stud. 7 (1994): 507–538. [Google Scholar] [CrossRef]
- F. Longin, and B. Solnik. “Is the correlation in international equity returns constant: 1960–1990? ” J. Int. Money Financ. 14 (1995): 3–26. [Google Scholar]
- G. Kaplanski, and H. Levy. “Sentiment and stock prices: The case of aviation disasters.” J. Financ. Econ. 95 (2010): 174–201. [Google Scholar] [CrossRef]
- G. Capelle-Blancard, and M. Laguna. “How does the stock market respond to chemical disasters? ” J. Environ. Econ. Ma. 59 (2009): 192–205. [Google Scholar] [CrossRef]
- D. Asteriou, and C. Siriopoulos. “The role of political instability in stock market development and economic growth: The case of Greece.” Econ. Notes 29 (2003): 355–374. [Google Scholar]
- A. Herbst, J. Marshall, and J. Wingender. “An analysis of the stock market’s response to the Exxon Valdez disaster.” Global Financ. J. 7 (1996): 101–114. [Google Scholar] [CrossRef]
- L. Blose, R. Bornkamp, M. Brier, K. Brown, and J. Frederick. “Catastrophic events, contagion and stock market efficiency: The case of the space shuttle Challenger.” Rev. Financ. Econ. 5 (1996): 117–129. [Google Scholar] [CrossRef]
- R. Kalra, G. Henderson, and G. Raines. “Contagion effects in the chemical industry following the Bhopal disaster.” J. Financ. Strategic Decis. 8 (1995): 1–11. [Google Scholar]
- R. Bowen, R. Castanias, and L. Daley. “Intra-industry effects of the accident at Three Mile Island.” J. Financ. Quant. Anal. 18 (1983): 87–112. [Google Scholar] [CrossRef]
- D. Brounrn, and J. Derwall. “The impact of terrorist attacks on international stock markets.” Eur. Financ. Ma. 16 (2010): 585–598. [Google Scholar] [CrossRef]
- V. Ramiah, M.A. Cam, M. Calabro, D. Maher, and S. Ghafouri. “Changes in equity returns and volatility across different Australian industries following the recent terrorist attacks.” Pac. Bas. Financ. J. 18 (2010): 64–76. [Google Scholar] [CrossRef]
- M. Graham, and V. Ramiah. “Global terrorism and adaptive expectations in financial markets: Evidence from Japanese equity market.” Res. Int. Bus. Fin. 26 (2012): 97–119. [Google Scholar] [CrossRef]
- C. Amelie, and O. Darne. “Large shocks and the September 11th terrorist attacks on international stock markets.” Econ. Model. 23 (2006): 683–698. [Google Scholar] [CrossRef]
- V. Fernandez. “The war on terror and its impact on the long-term volatility of financial markets.” Int. Rev. Financ. Anal. 17 (2008): 1–26. [Google Scholar] [CrossRef]
- J. Nikkinen, and S. Vahamaa. “Terrorism and stock market sentiment.” Financ. Rev. 45 (2010): 263–275. [Google Scholar] [CrossRef]
- K. Drakos. “Terrorism activity, investor sentiment, and stock returns.” Rev. Financ. Econ. 19 (2010): 128–135. [Google Scholar] [CrossRef]
- C. Kollias, E. Manou, S. Papadamou, and A. Stagiannis. “Stock markets and terrorist attacks: Comparative evidence from a large and a small capitalization market.” Eur. J. Pol. Econ. 27 (2011): 64–77. [Google Scholar] [CrossRef]
- C. Kollias, S. Papadamou, and A. Stagiannis. “Terrorism and capital markets: The effects of the Madrid and London bomb attacks.” Int. Rev. Econ. Financ. 20 (2011): 532–541. [Google Scholar] [CrossRef]
- M. Chesney, G. Reshetar, and M. Karaman. “The impact of terrorism on financial markets: An empirical study.” J. Bank. Financ. 35 (2011): 253–267. [Google Scholar] [CrossRef]
- M. Hon, J. Strauss, and S.-K. Yong. “Contagion in financial markets after September 11: Myth or reality? ” J. Financ. Res. 27 (2004): 95–114. [Google Scholar] [CrossRef]
- K.-C. Mun. “Contagion and impulse response of international stock markets around the 9–11 terrorist attacks.” Global Financ. J. 16 (2005): 48–68. [Google Scholar] [CrossRef]
- K. Drakos. “Behavioral channels in the cross-market diffusion of major terrorist shocks.” Risk Anal. 31 (2011): 143–159. [Google Scholar] [CrossRef]
- K. Drakos. “The determinants of terrorist shock’s cross-market transmission.” J. Risk Financ. 11 (2010): 147–163. [Google Scholar]
- C. Kollias, S. Papadamou, and V. Arvanitis. “Does terrorism affect the stock-bond covariance? evidence from european countries.” South. Econ. J. 79 (2013): 832–848. [Google Scholar] [CrossRef]
- R. Connolly, and A. Wang. “International equity market comovements: Economic fundamentals or contagion.” Pac. Bas. Financ. 11 (2003): 23–43. [Google Scholar] [CrossRef]
- J. Hanousek, E. Kočenda, and A. Kutan. “The reaction of asset prices to macroeconomic announcements in new EU markets: Evidence from intraday data.” J. Financ. Stab. 5 (2009): 199–219. [Google Scholar] [CrossRef]
- B. Égert, and E. Kočenda. “Interdependence between Eastern and Western European stock markets: Evidence from intraday data.” Econ. Syst. 31 (2007): 184–203. [Google Scholar] [CrossRef]
- R. Markellos, T. Mills, and C. Siriopoulos. “Intradaily behaviour of listed and unlisted security basket indices in the emerging Greek stock market.” Manage. Financ. 29 (2003): 29–54. [Google Scholar]
- A. Groß-Klußmann, and N. Hautsch. “Predicting bid-ask spreads using long memory autoregressive conditional poisson models, 2011.” Available online: http://ssrn.com/abstract=1884237 (accessed on 13 November 2013).
- W.K. Härdle, N. Hautsch, and A. Mihoci. “Modelling and forecasting liquidity supply using semiparametric factor dynamics.” J. Empir. Financ. 19 (2012): 610–625. [Google Scholar] [CrossRef]
- N. Hautsch, P. Malec, and M. Schienle. “Capturing the zero: A new class of zero-augmented distributions and multiplicative error processes, 2011.” Available online: http://ssrn.com/abstract=1711810 (accessed on 13 November 2013).
- A. Groß-Klußmann, and N. Hautsch. “When machines read the news: Using automated text analytics to quantify high frequency news-implied market reactions.” J. Empir. Financ. 18 (2011): 321–340. [Google Scholar] [CrossRef]
- N. Hautsch, D. Hess, and D. Veredas. “The impact of macroeconomic news on quote adjustments, noise, and informational volatility.” J. Bank. Financ. 35 (2011): 2733–2746. [Google Scholar] [CrossRef]
- R.F. Engle, and K. Kroner. “Multivariate simultaneous GARCH.” Economet. Theor. 11 (1995): 122–150. [Google Scholar] [CrossRef]
- F. Chesnay, and E. Jondeau. “Does correlation between stock returns really increase during turbulent periods? ” Econ. Notes 30 (2001): 53–80. [Google Scholar]
- K.J. Forbes, and R. Rigobon. “No contagion, only interdependence: Measuring stock market co-movements.” J. Financ. 57 (2002): 2223–2261. [Google Scholar] [CrossRef]
- 1LSE was the bigger in terms of market capitalization in 2005, in Europe followed by the German and French markets (see: www.world-exchanges.org/statistics).
- 2Data are collected by http://www.tickdata.com.
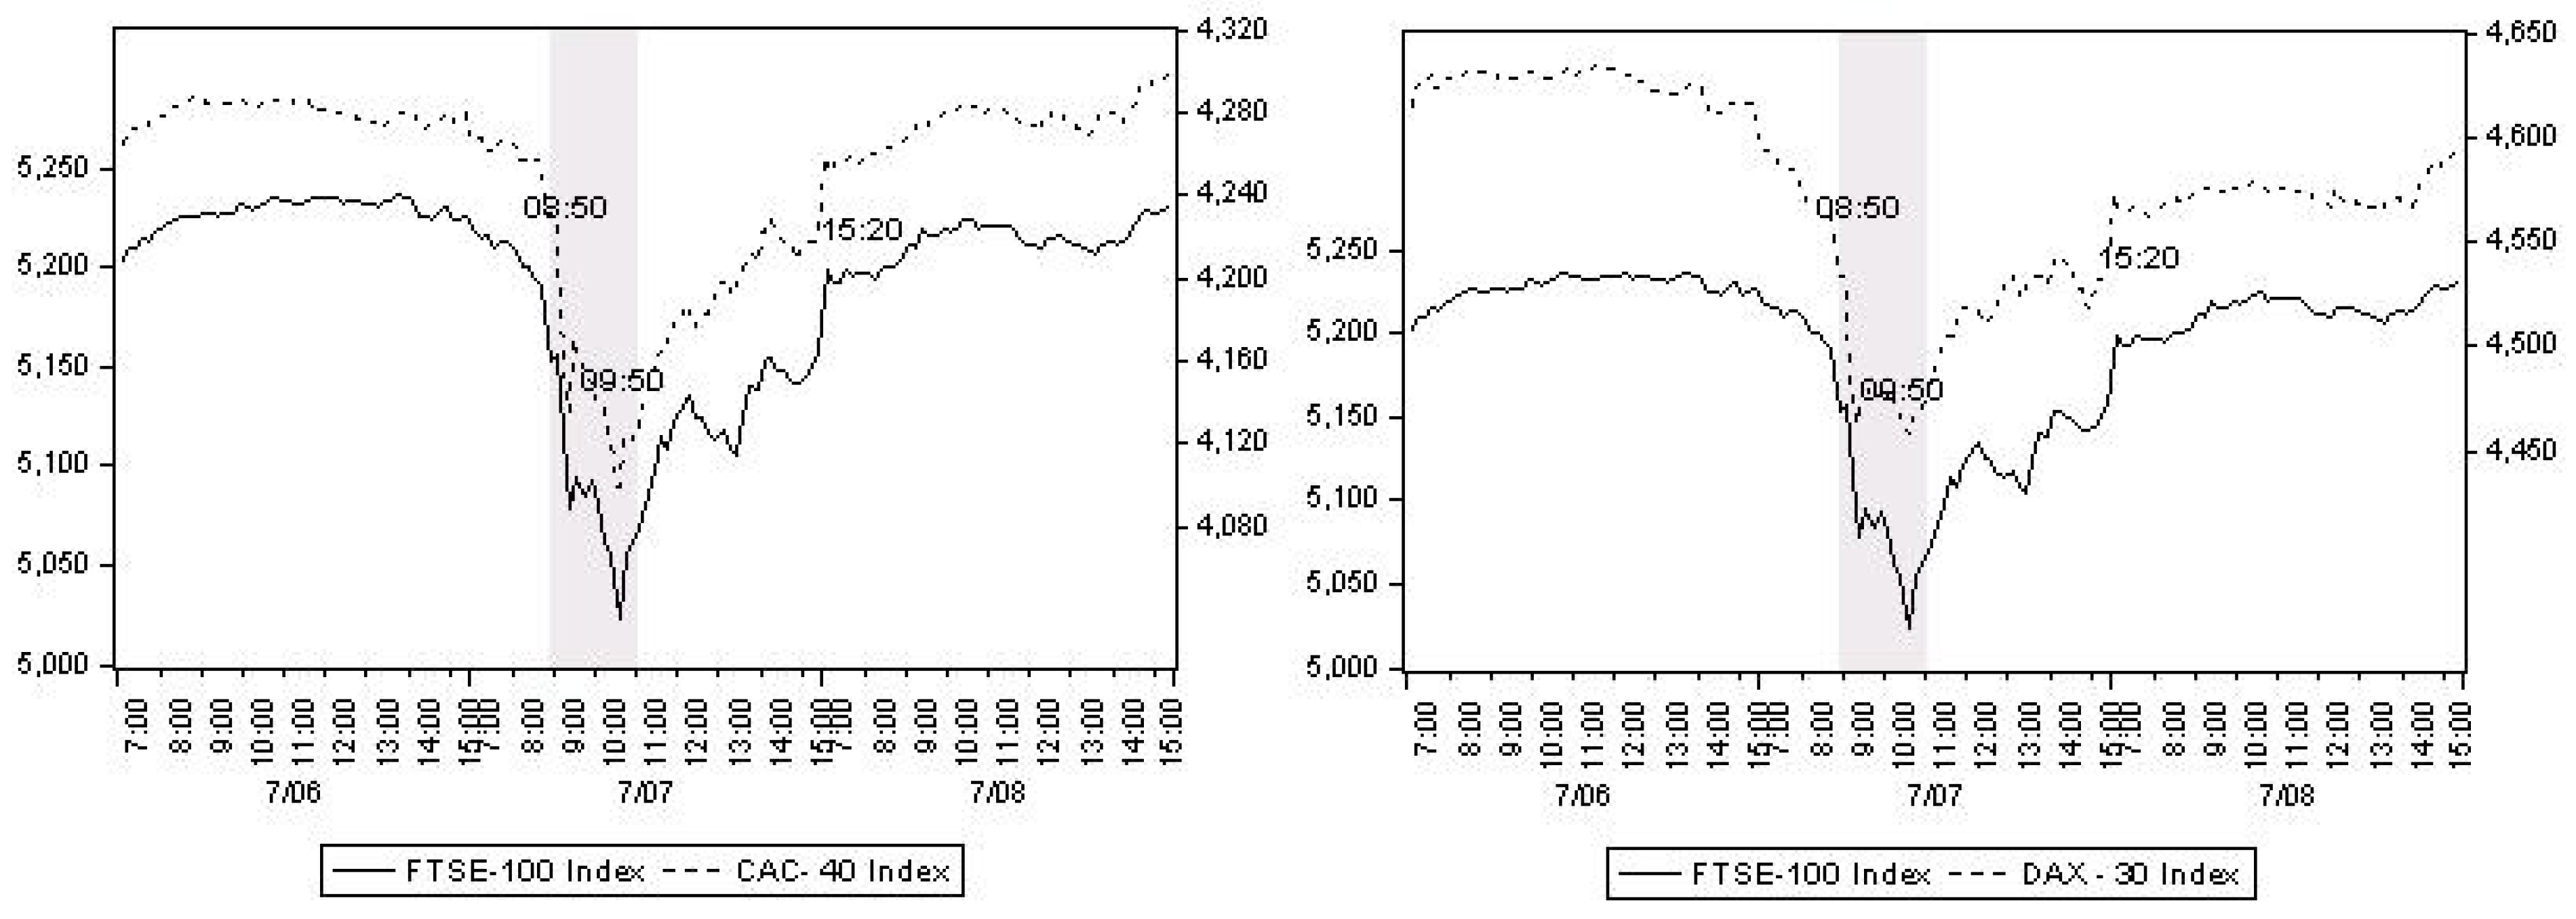
- 3In order to count for the effect induced by the events occurred in 08:50 and 09:50 respectively we have used a dummy taking the value of one from the first bomb explosion lasting one hour and for the second bomb also lasting also one hour.
- 4See for instance Kollias et al. [26] that compare this attack to the one in Madrid in 2004.
- 5We would like to thank one of the anonymous referees for his helpful comment to divide whole sample to sub-samples and investigate for possible differences among stock markets.
- 6The secd column of each graph zooms in on the event day window in order to present in a more clear manner the effect.
© 2013 by the authors; licensee MDPI, Basel, Switzerland. This article is an open access article distributed under the terms and conditions of the Creative Commons Attribution license (http://creativecommons.org/licenses/by/3.0/).
Share and Cite
Kollias, C.; Papadamou, S.; Siriopoulos, C. European Markets’ Reactions to Exogenous Shocks: A High Frequency Data Analysis of the 2005 London Bombings. Int. J. Financial Stud. 2013, 1, 154-167. https://doi.org/10.3390/ijfs1040154
Kollias C, Papadamou S, Siriopoulos C. European Markets’ Reactions to Exogenous Shocks: A High Frequency Data Analysis of the 2005 London Bombings. International Journal of Financial Studies. 2013; 1(4):154-167. https://doi.org/10.3390/ijfs1040154
Chicago/Turabian StyleKollias, Christos, Stephanos Papadamou, and Costas Siriopoulos. 2013. "European Markets’ Reactions to Exogenous Shocks: A High Frequency Data Analysis of the 2005 London Bombings" International Journal of Financial Studies 1, no. 4: 154-167. https://doi.org/10.3390/ijfs1040154
APA StyleKollias, C., Papadamou, S., & Siriopoulos, C. (2013). European Markets’ Reactions to Exogenous Shocks: A High Frequency Data Analysis of the 2005 London Bombings. International Journal of Financial Studies, 1(4), 154-167. https://doi.org/10.3390/ijfs1040154