Low Mannitol Concentrations in Arabidopsis thaliana Expressing Ectocarpus Genes Improve Salt Tolerance

 ,
,  ,
,  , , , , , and
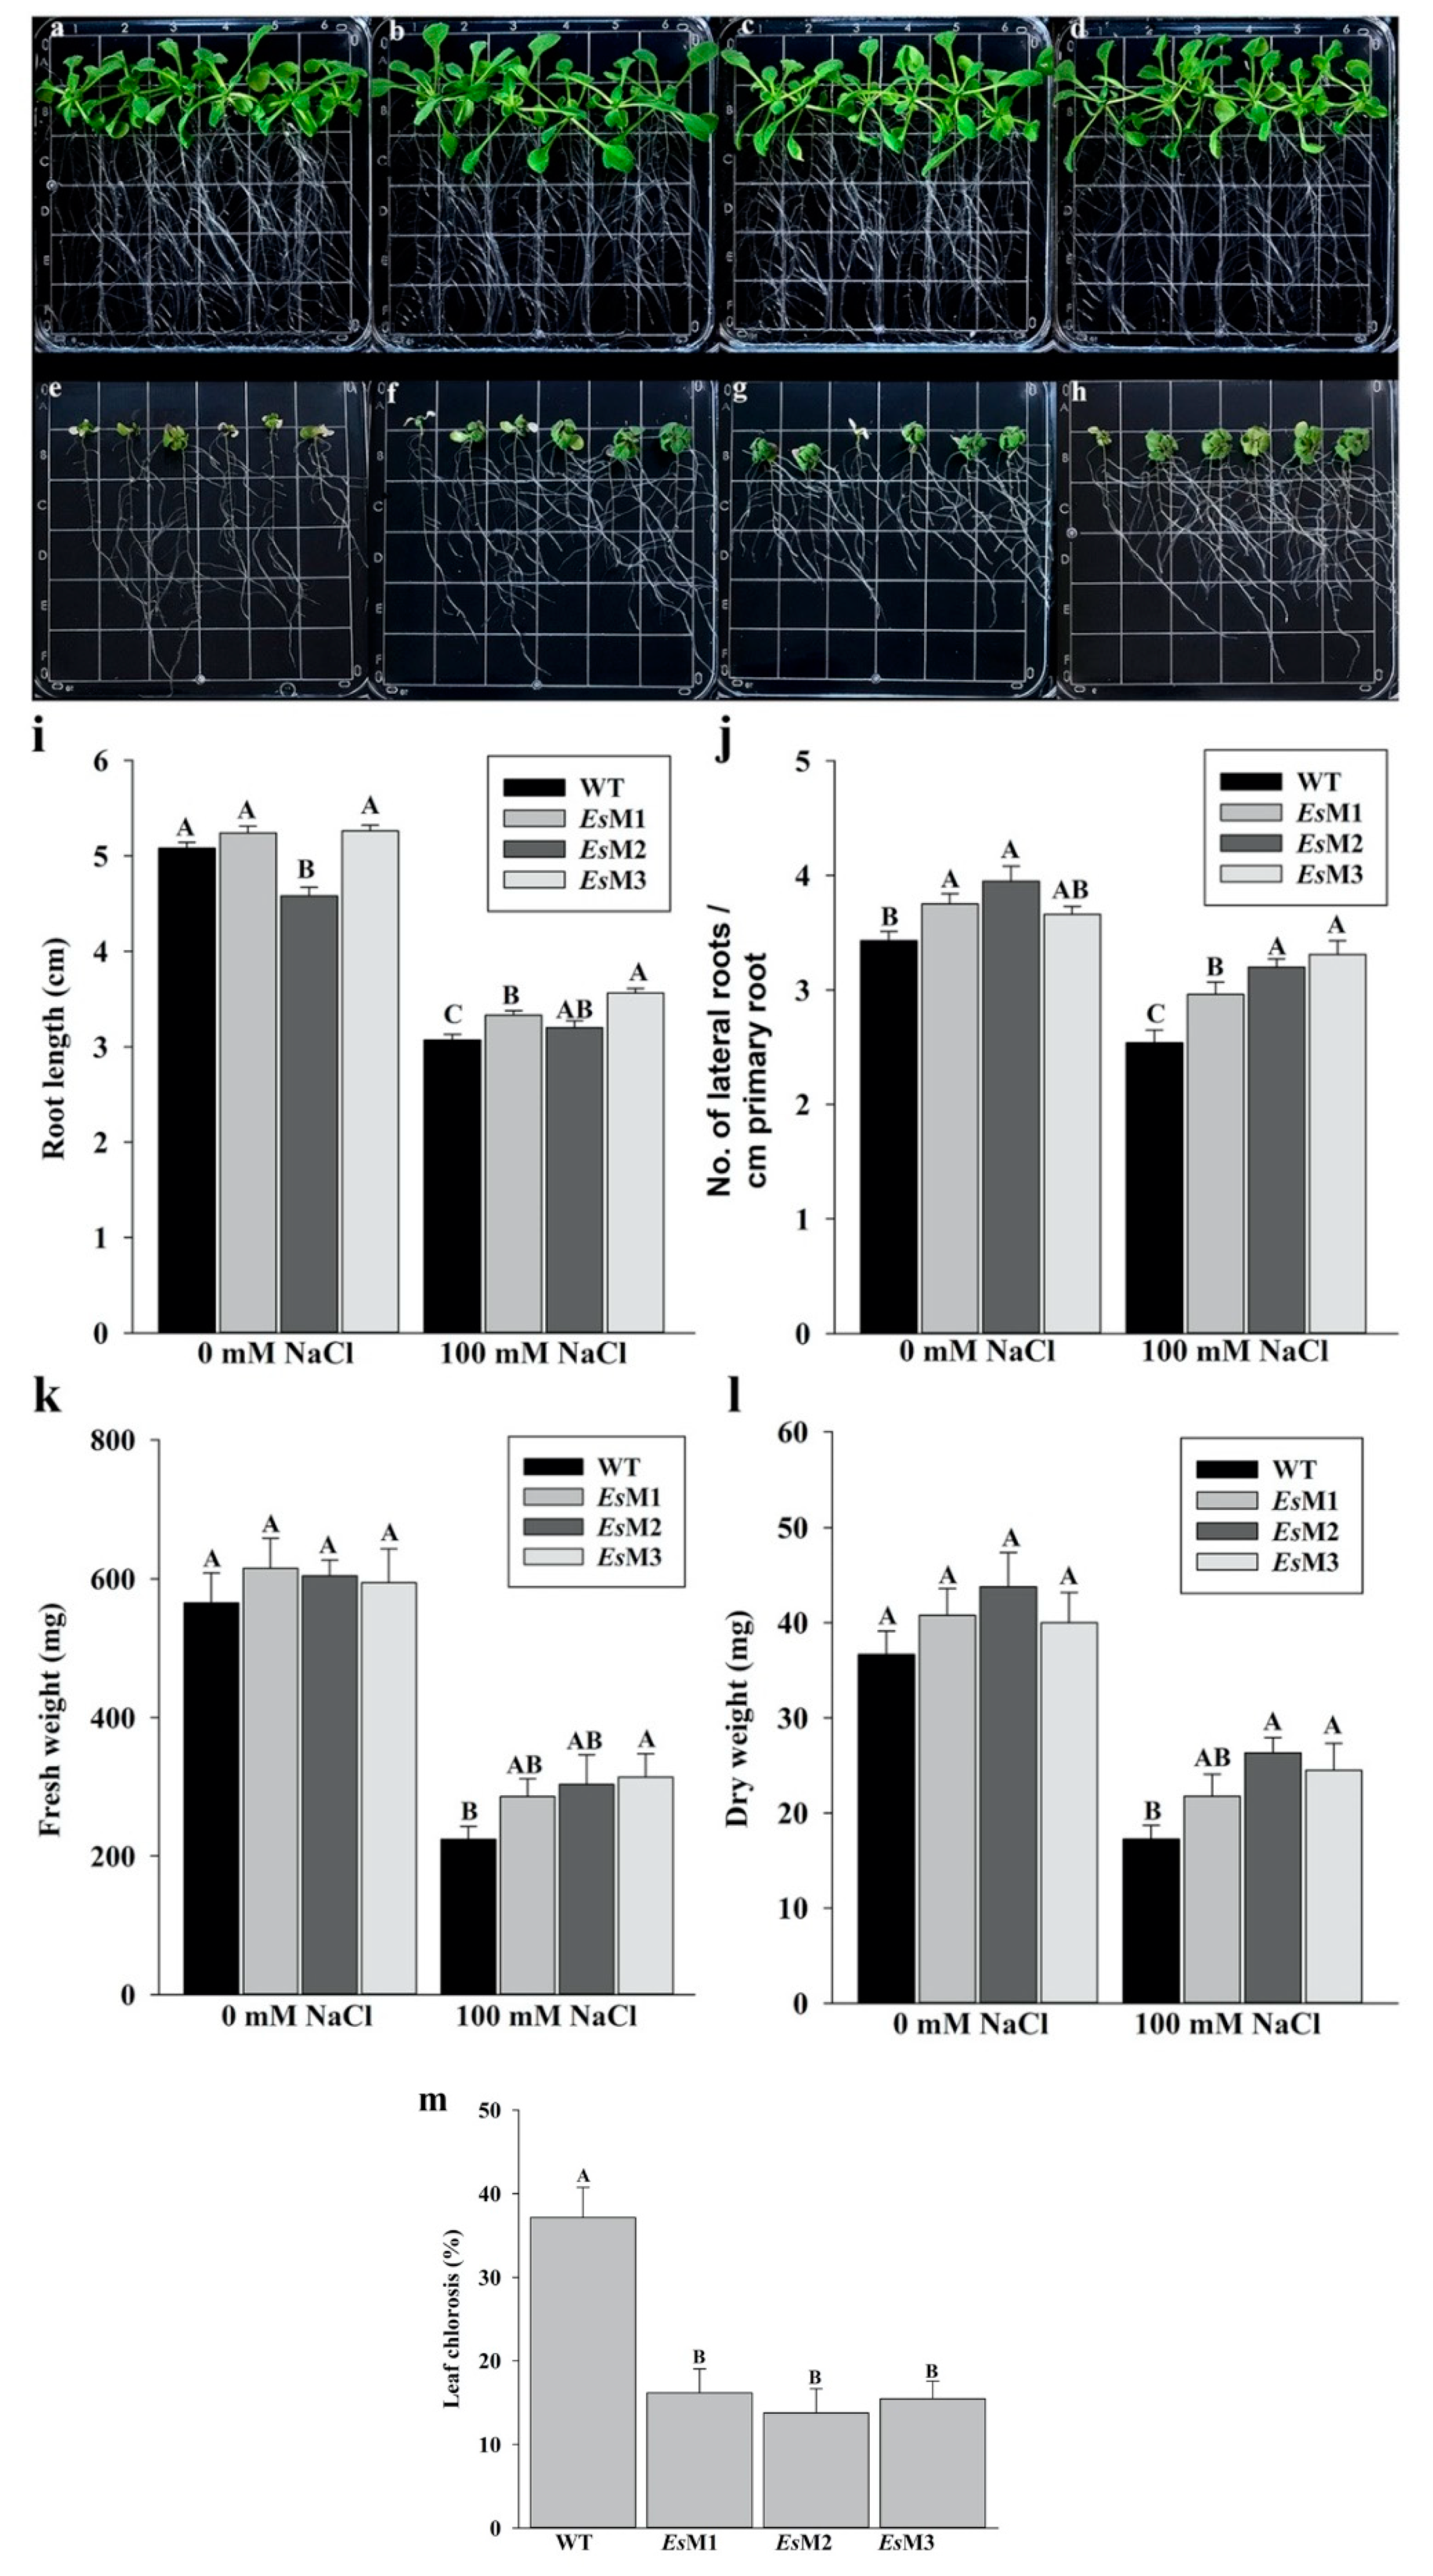
Abstract
1. Introduction
2. Results
2.1. M1PDH1 and M1Pase2 Expression and Mannitol Content in A. thaliana Transgenic Lines
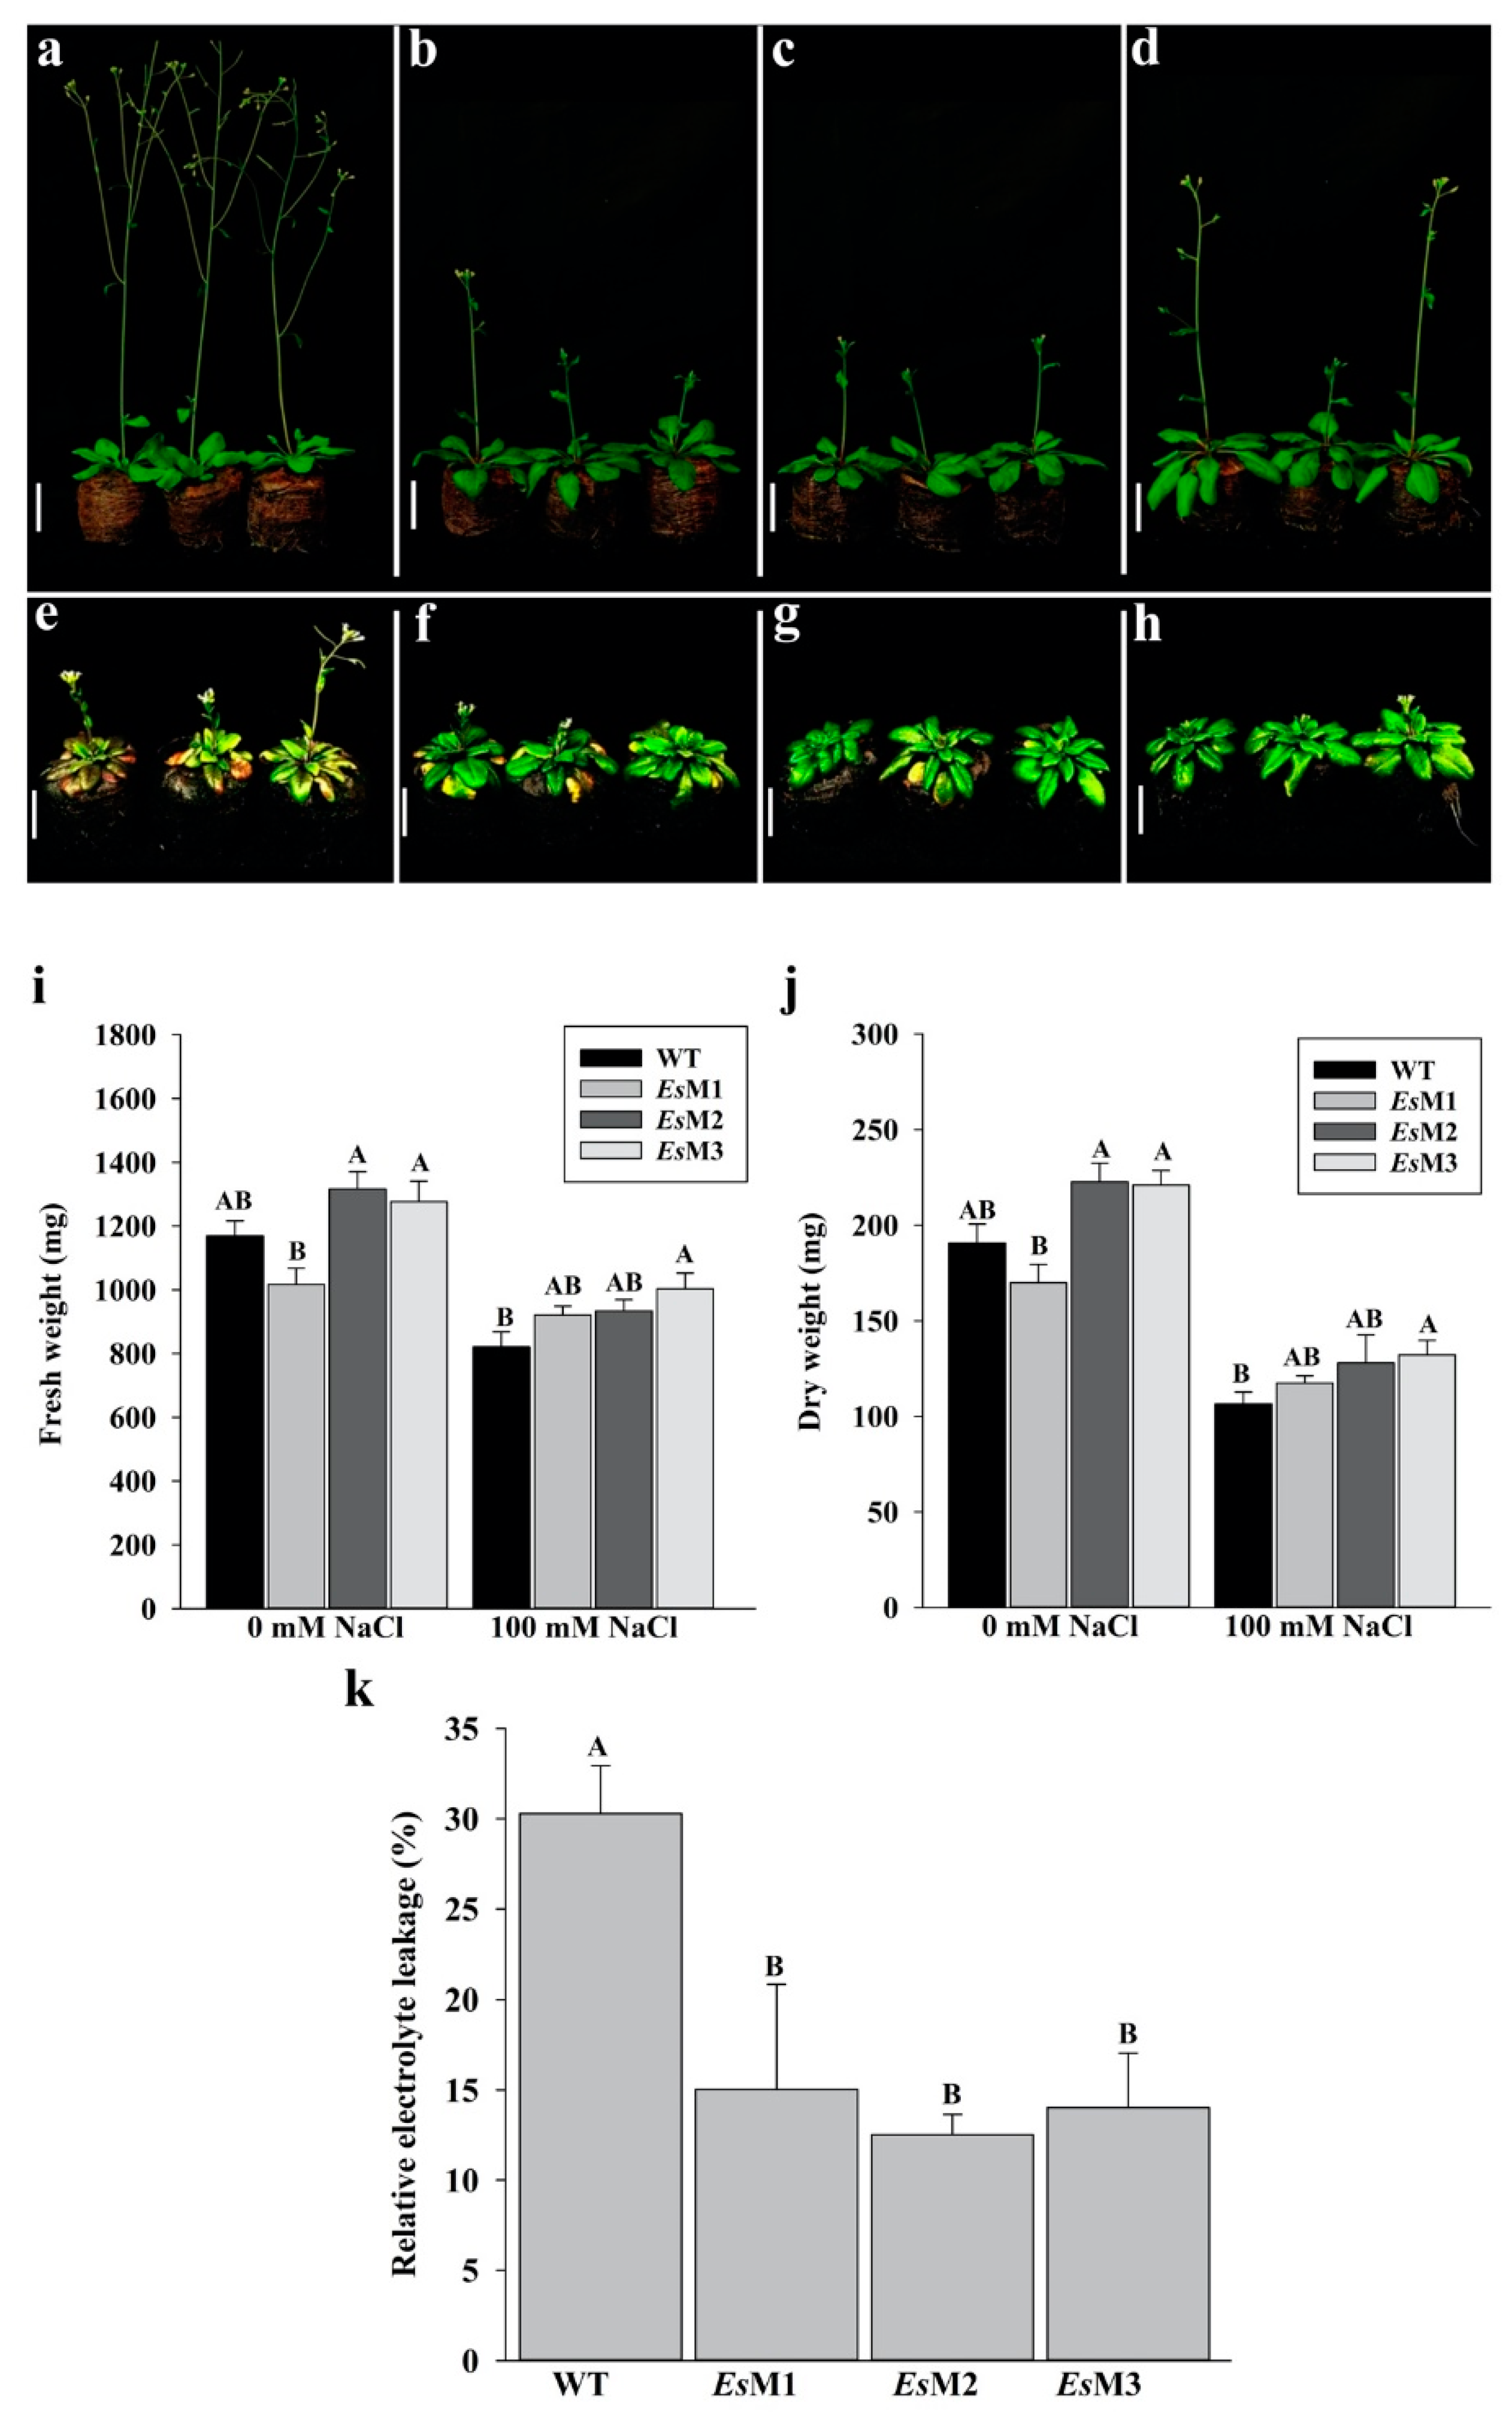
2.2. Mannitol Producing Lines Showed Enhanced Tolerance to Salinity and High Temperature Stress
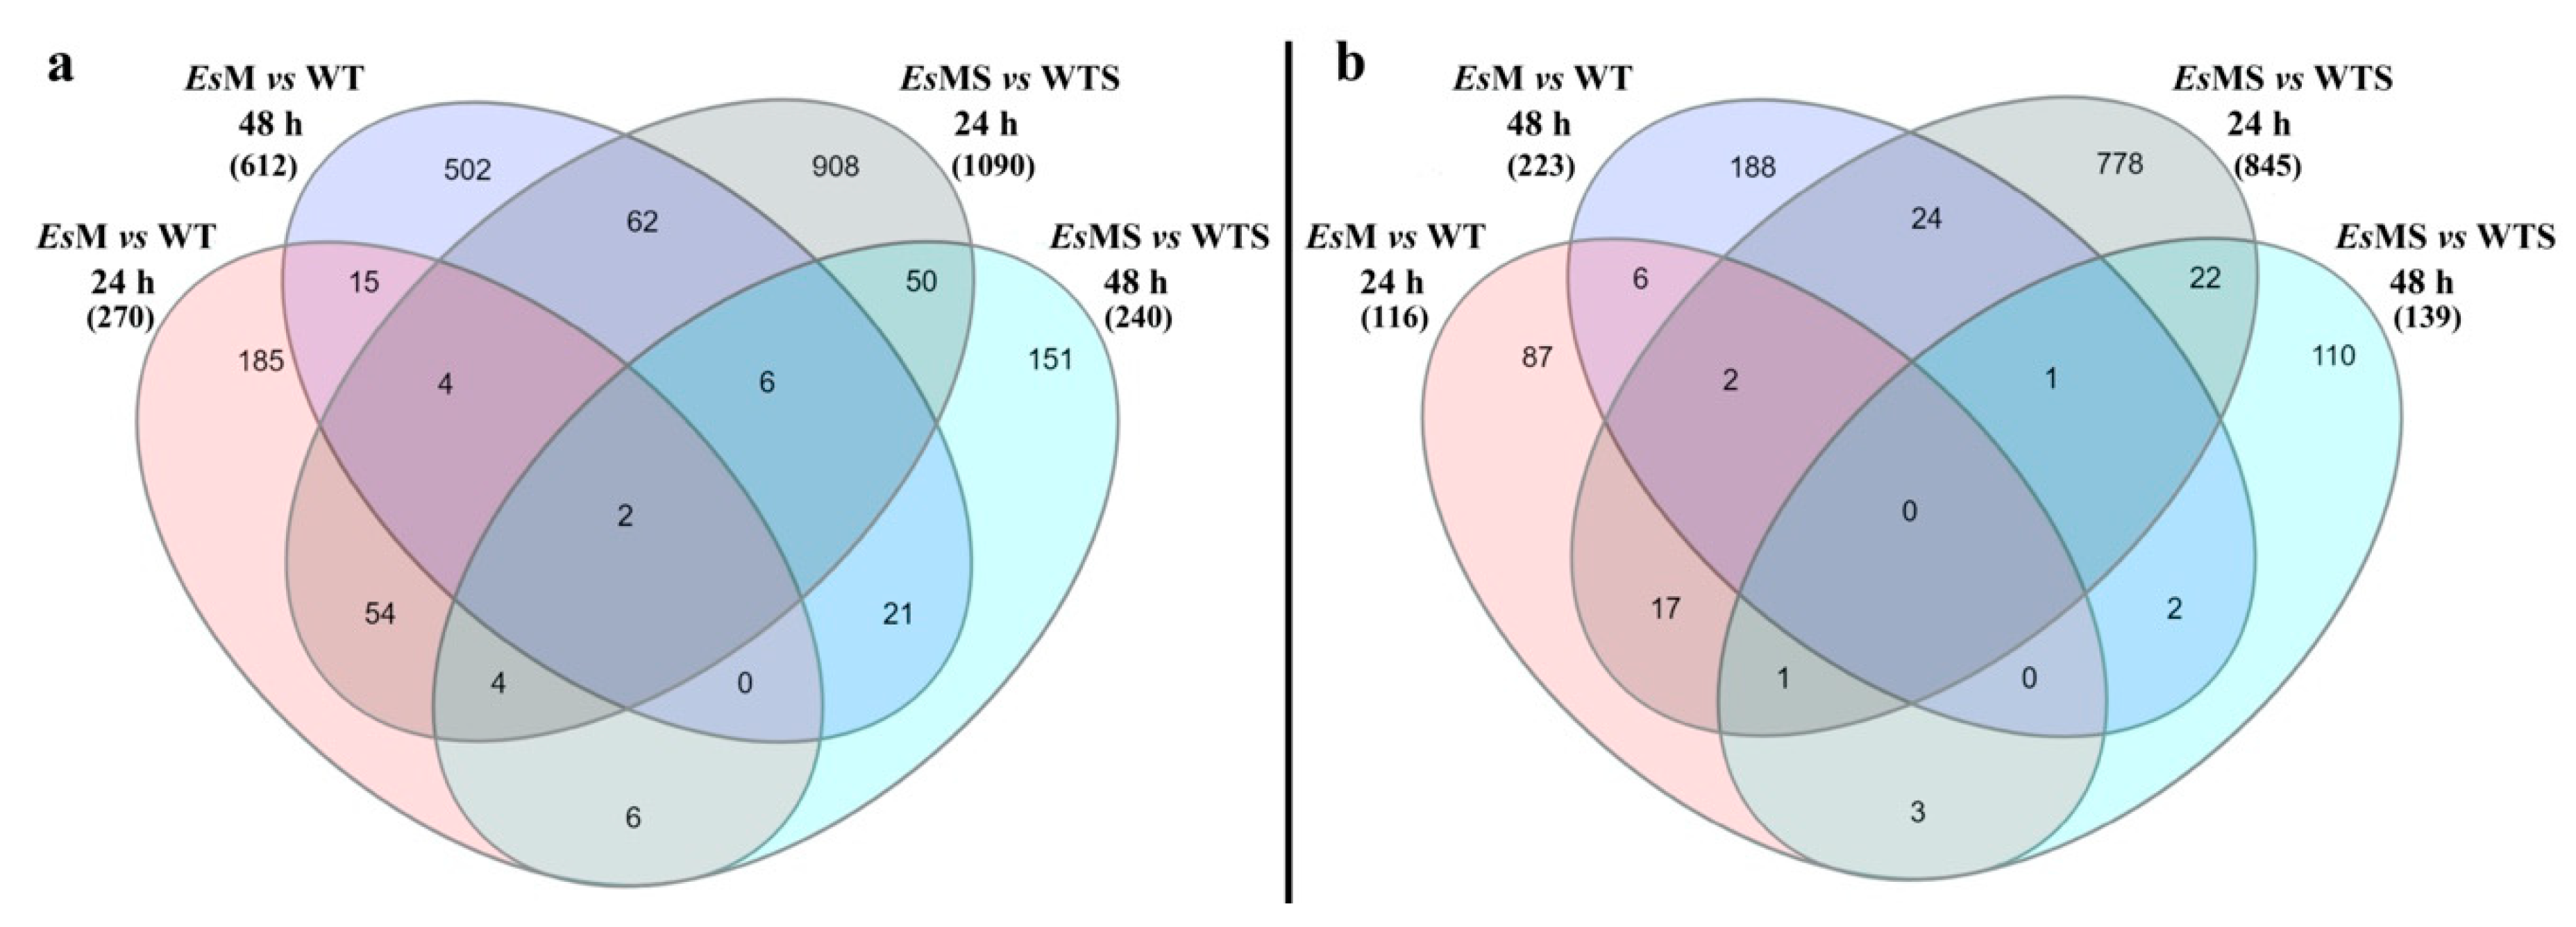
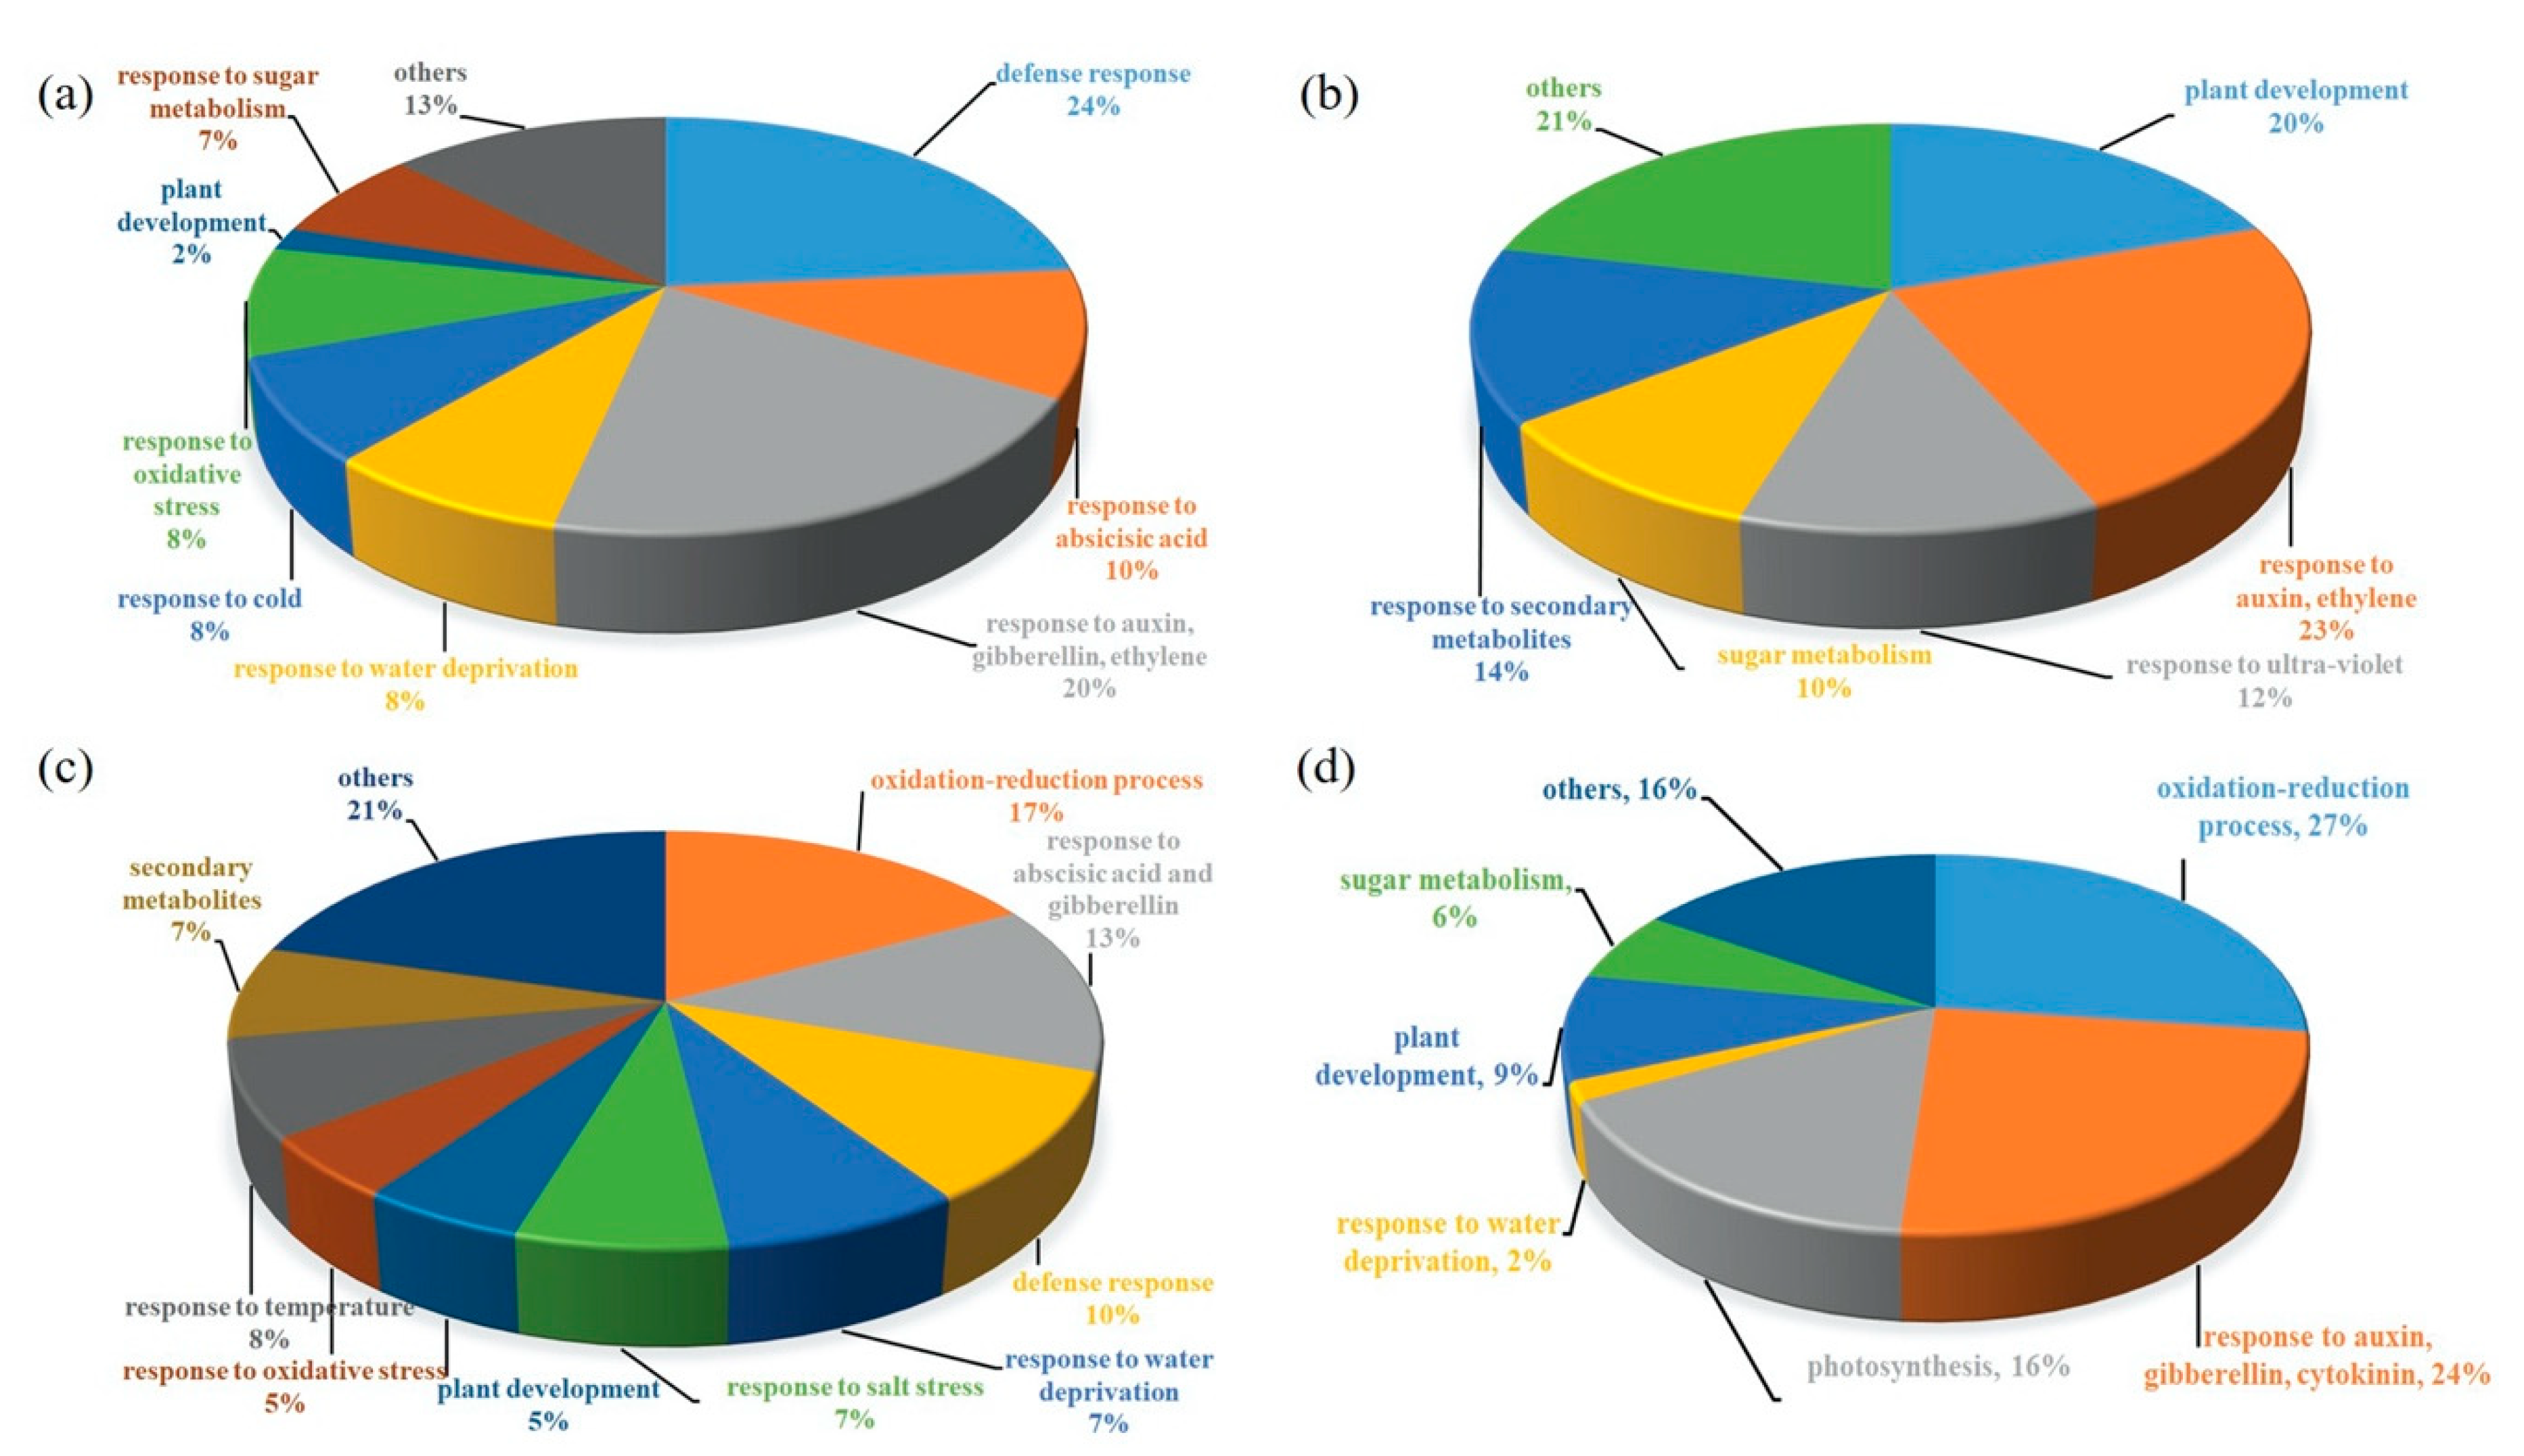
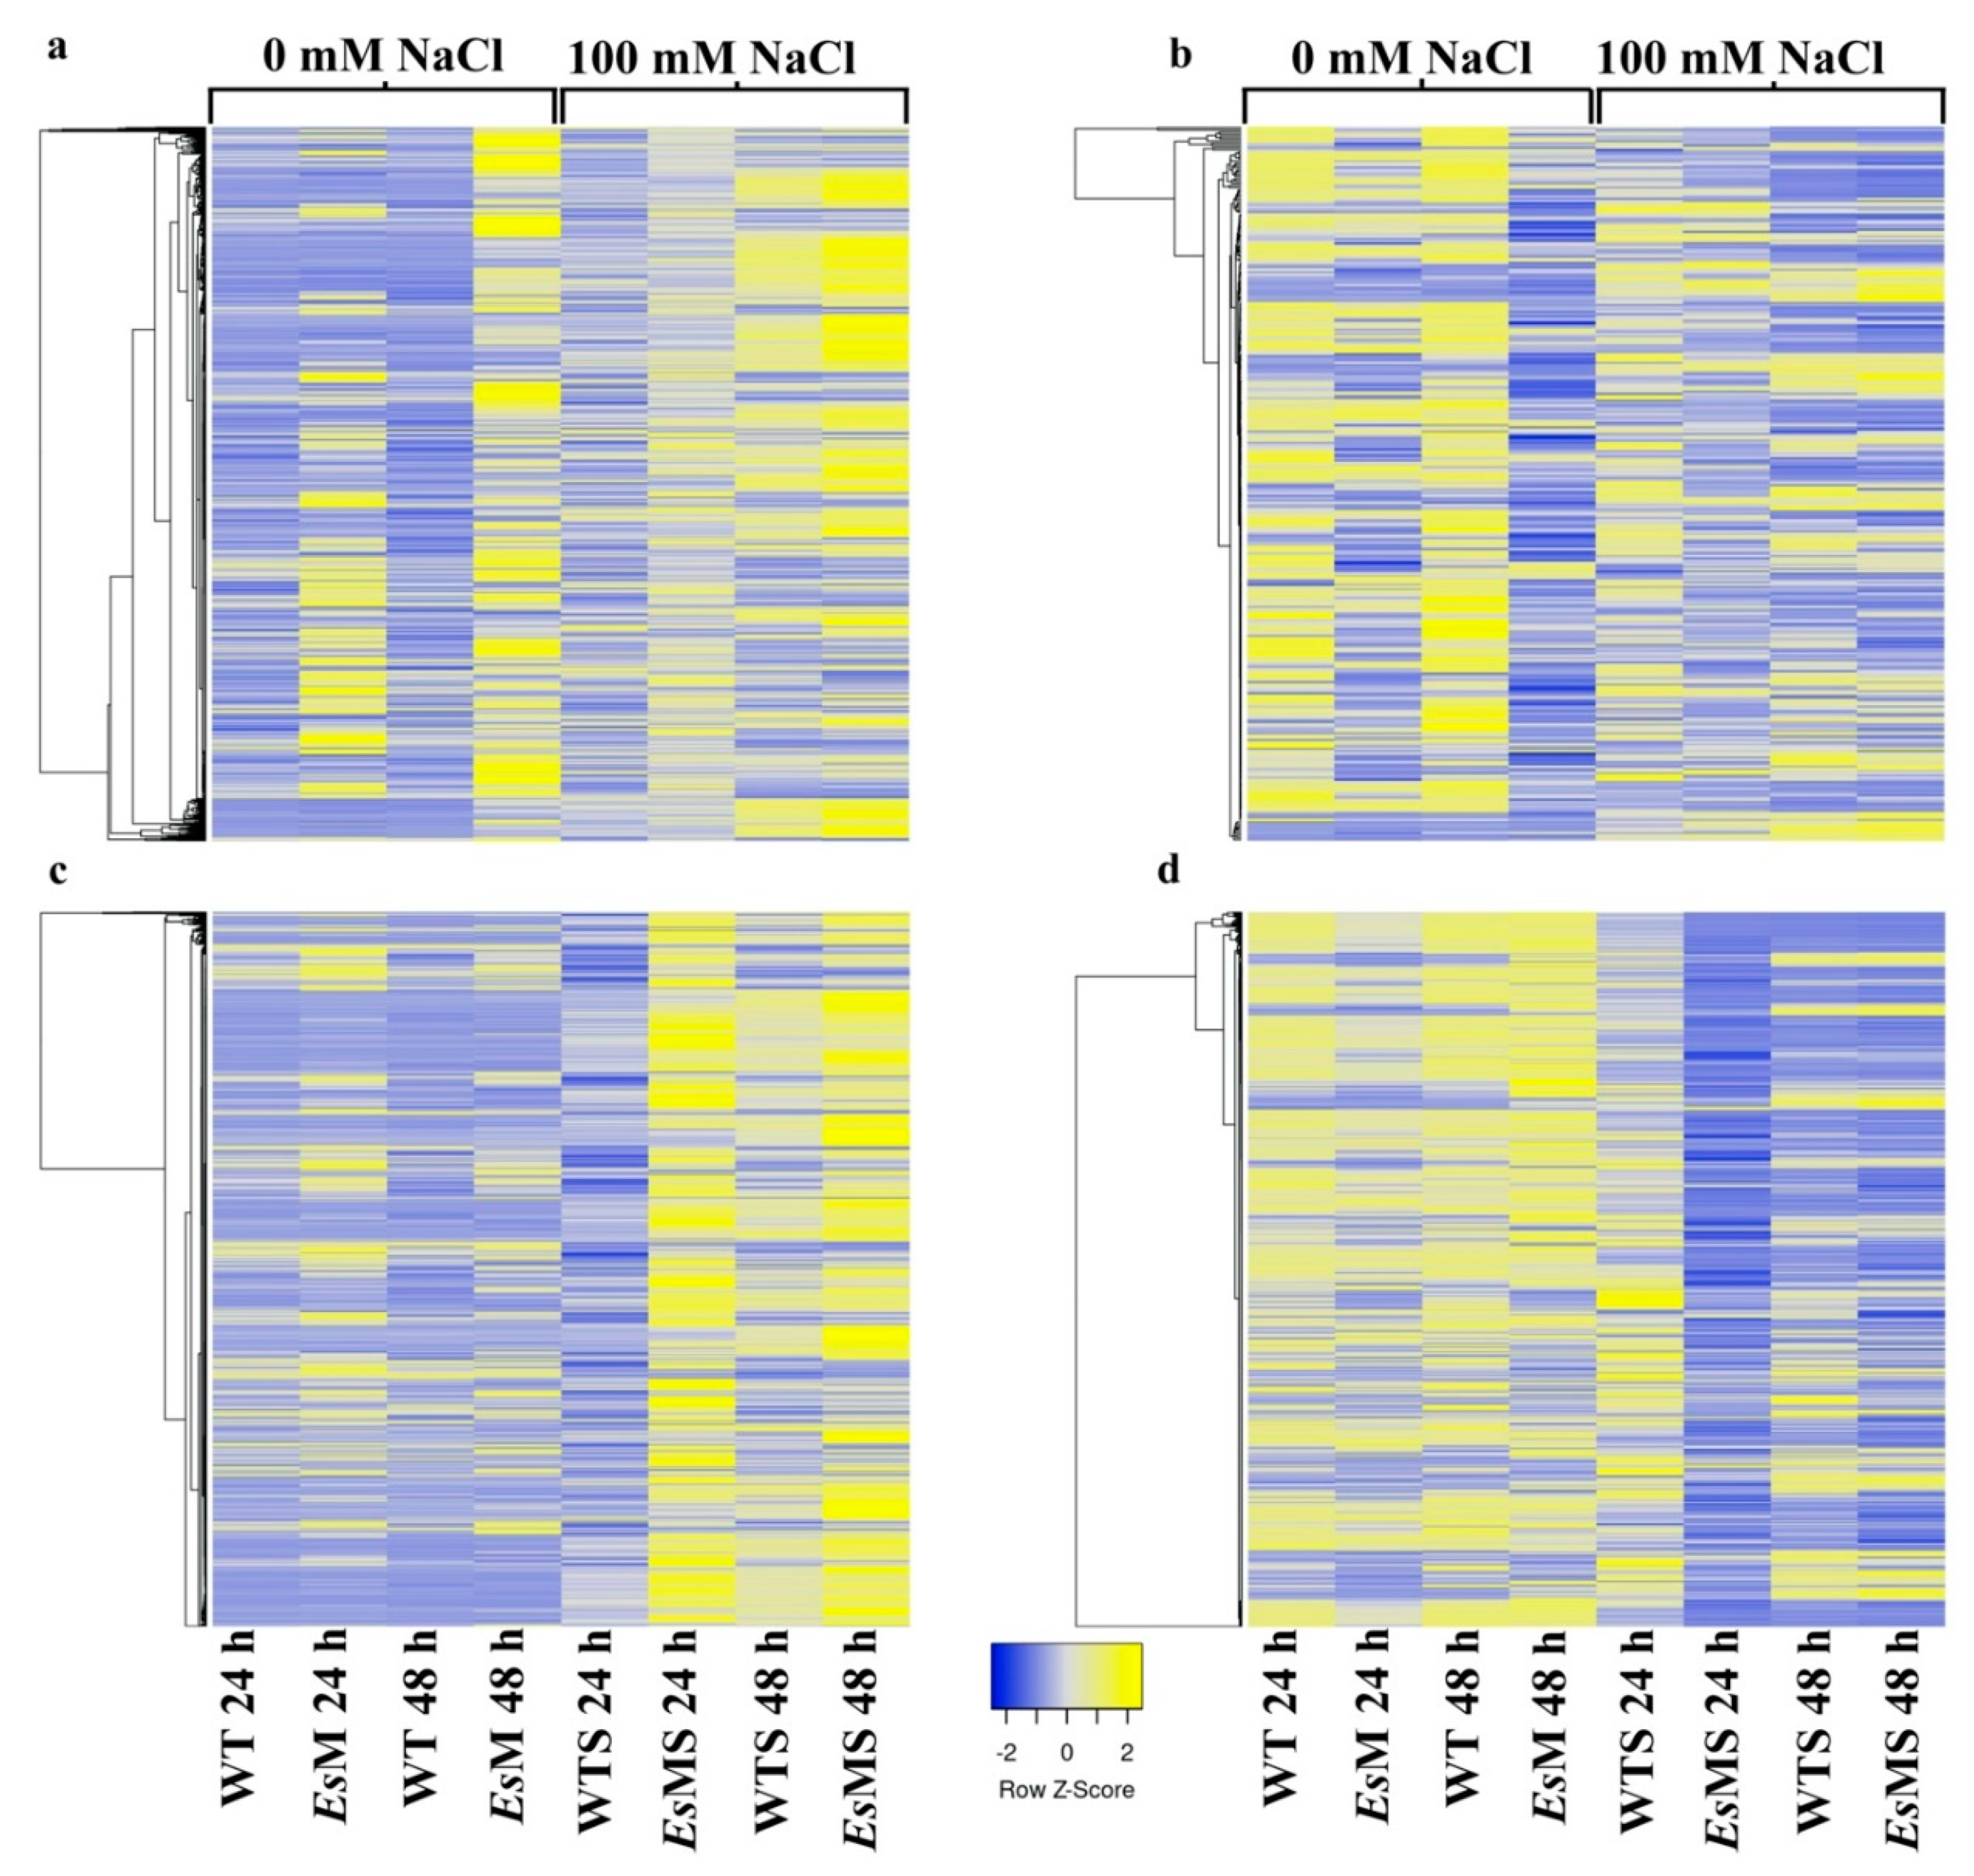
2.3. Transcriptomics of a Mannitol-Producing Line and of Wild Type A. thaliana Grown in Standard Conditions and under Salt Stress
3. Discussion
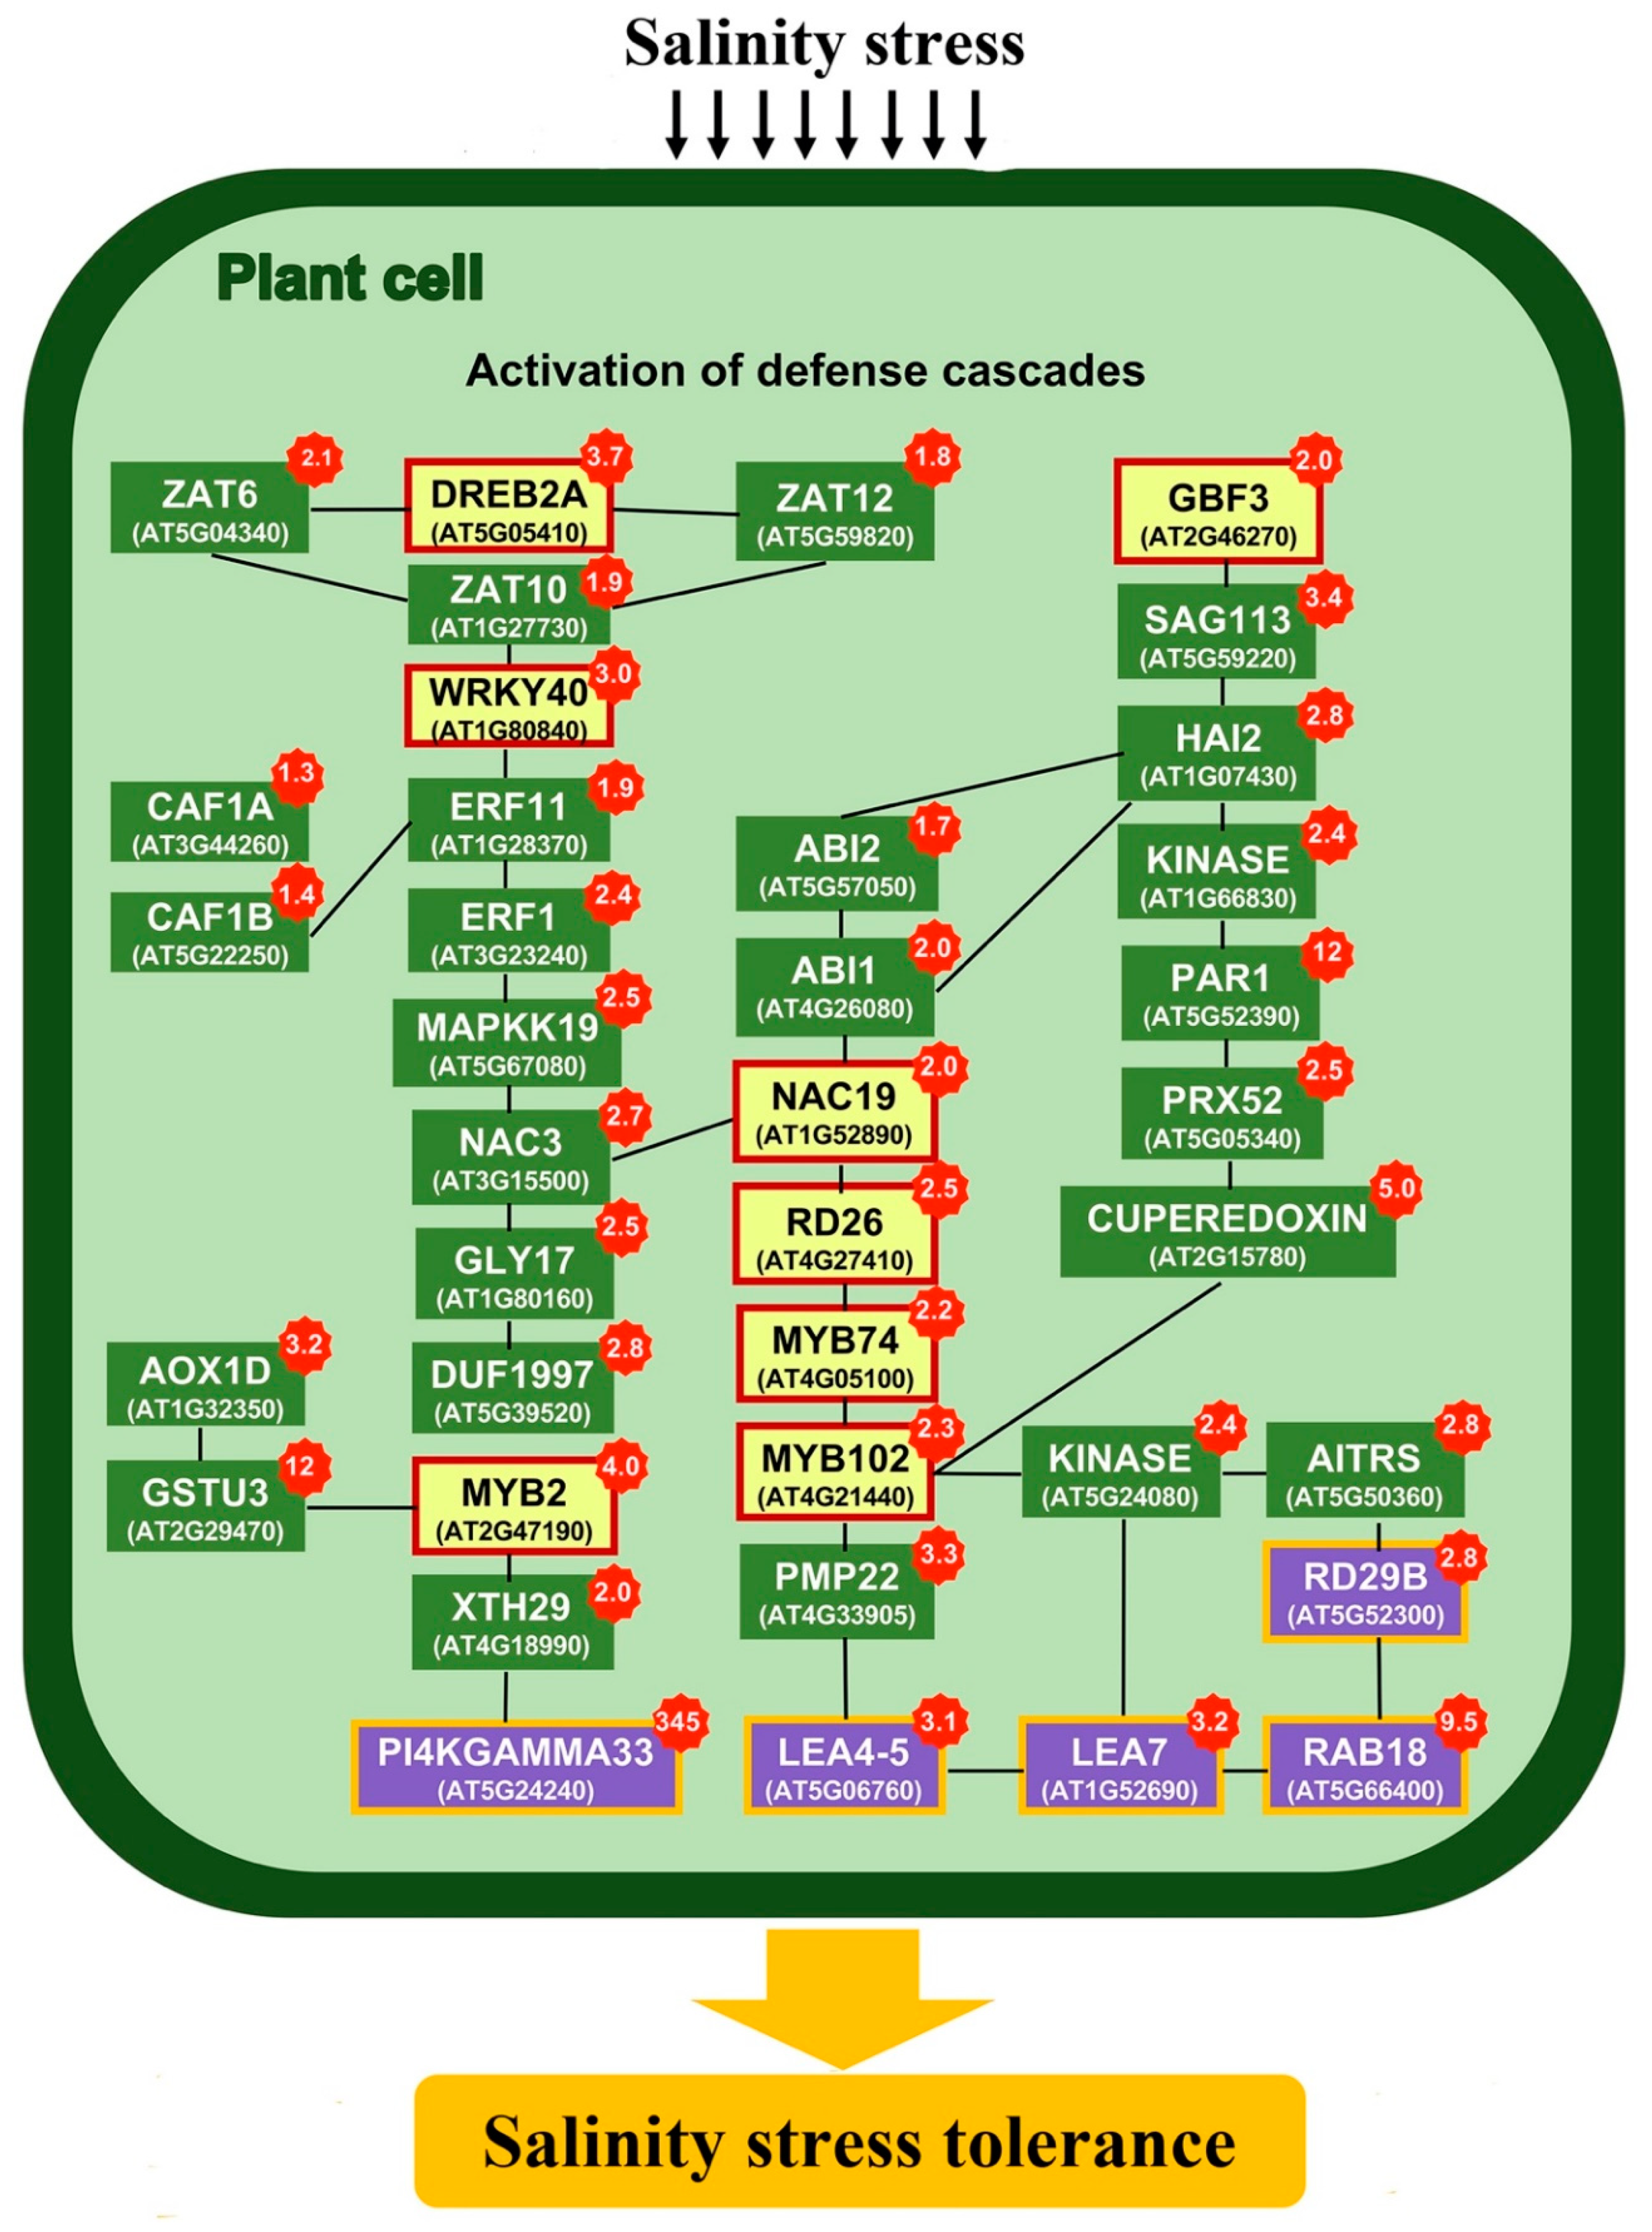
3.1. Stress Responsive Genes
3.2. K+ Homeostasis Under Salinity Stress
3.3. ROS Signaling and Radical Scavengers
3.4. ABA Signaling
4. Materials and Methods
4.1. Cloning of Ectocarpus sp. M1PDH1and M1Pase2 Genes and Transformation of A. thaliana
4.2. Selection of Transformants and Homozygosity
4.3. Salinity Stress Tolerance
4.4. Heat Stress Tolerance
4.5. Electrolyte Leakage
4.6. Quantification of Mannitol Levels in Transgenic Lines by LC-MS
4.7. Plant Samples, RNA Isolation, Library Construction and Next Generation Sequencing
4.8. Next Generation Sequencing Data Processing
4.9. Real-Time Quantitative PCR
5. Conclusions
Supplementary Materials
Author Contributions
Funding
Acknowledgments
Conflicts of Interest
References
- Zhu, J.-K. Abiotic stress signaling and responses in plants. Cell 2016, 167, 313–324. [Google Scholar] [CrossRef] [PubMed]
- Verslues, P.E.; Agarwal, M.; Katiyar-Agarwal, S.; Zhu, J.; Zhu, J.K. Methods and concepts in quantifying resistance to drought, salt and freezing, abiotic stresses that affect plant water status. Plant J. 2006, 45, 523–539. [Google Scholar] [CrossRef] [PubMed]
- Patel, T.K.; Williamson, J.D. Mannitol in plants, fungi, and plant-fungal Interactions. Trends Plant Sci. 2016, 21, 486–497. [Google Scholar] [CrossRef] [PubMed]
- Tonon, T.; Li, Y.; McQueen-Mason, S. Mannitol biosynthesis in algae: More widespread and diverse than previously thought. New Phytol. 2017, 213, 1573–1579. [Google Scholar] [CrossRef] [PubMed]
- Abebe, T.; Guenzi, A.C.; Martin, B.; Cushman, J.C. Tolerance of mannitol-accumulating transgenic wheat to water stress and salinity. Plant Physiol. 2003, 131, 1748–1755. [Google Scholar] [CrossRef] [PubMed]
- Chan, Z.; Grumet, R.; Loescher, W. Global gene expression analysis of transgenic, mannitol-producing, and salt-tolerant Arabidopsis thaliana indicates widespread changes in abiotic and biotic stress-related genes. J. Exp. Bot. 2011, 62, 4787–4803. [Google Scholar] [CrossRef]
- Chiang, Y.-J.; Stushnoff, C.; McSay, A.; Jones, M.L.; Bohnert, H. Overexpression of mannitol-1-phosphate dehydrogenase increases mannitol accumulation and adds protection against chilling injury in Petunia. J. Am. Soc. Hortic. Sci. 2005, 130, 605–610. [Google Scholar] [CrossRef]
- Patel, T.; Krasnyanski, S.; Allen, G.; Panthee, D.; Louws, F.; Williamson, J. Tomato plants overexpressing a celery mannitol dehydrogenase (mtd) have decreased susceptibility to Botrytis cinerea. Am. J. Plant Sci. 2015, 6, 1116–1125. [Google Scholar] [CrossRef]
- Prabhavathi, V.; Rajam, M.V. Mannitol-accumulating transgenic eggplants exhibit enhanced resistance to fungal wilts. Plant Sci. 2007, 173, 50–54. [Google Scholar] [CrossRef]
- Sickler, C.M.; Edwards, G.E.; Kiirats, O.; Gao, Z.; Loescher, W. Response of mannitol-producing Arabidopsis thaliana to abiotic stress. Funct. Plant Biol. 2007, 34, 382–391. [Google Scholar] [CrossRef] [PubMed]
- Tarczynski, M.C.; Jensen, R.G.; Bohnert, H.J. Expression of a bacterial mtlD gene in transgenic tobacco leads to production and accumulation of mannitol. Proc. Natl. Acad. Sci. USA 1992, 89, 2600–2604. [Google Scholar] [CrossRef]
- Tarczynski, M.C.; Jensen, R.G.; Bohnert, H.J. Stress protection of transgenic tobacco by production of the osmolyte mannitol. Science 1993, 259, 508–510. [Google Scholar] [CrossRef]
- Zhifang, G.; Loescher, W. Expression of a celery mannose 6-phosphate reductase in Arabidopsis thaliana enhances salt tolerance and induces biosynthesis of both mannitol and a glucosyl-mannitol dimer. Plant Cell Environ. 2003, 26, 275–283. [Google Scholar] [CrossRef]
- Thomas, J.C.; Sepahi, M.; Arentall, B.; Bohnert, H.J. Enhancement of seed germination in high salinity by engineering mannitol expression in Arabidopsis thaliana. Plant Cell Environ. 1995, 18, 801–806. [Google Scholar] [CrossRef]
- Coelho, S.M.; Scornet, D.; Rousvoal, S.; Peters, N.T.; Dartevelle, L.; Peters, A.F.; Cock, J.M. Ectocarpus: A Model Organism for the Brown Algae. Cold Spring Harb. Protoc. 2012, 2012. [Google Scholar] [CrossRef]
- Black, W.A.P. The seasonal variation in weight and chemical composition of the common British Laminariaceae. J. Mar. Biol. Assoc. U. K. 1950, 29, 45–72. [Google Scholar] [CrossRef]
- Montecinos, A.E.; Couceiro, L.; Peters, A.F.; Desrut, A.; Valero, M.; Guillemin, M.-L. Species delimitation and phylogeographic analyses in the Ectocarpus subgroup siliculosi (Ectocarpales, Phaeophyceae). J. Phycol. 2017, 53, 17–31. [Google Scholar] [CrossRef] [PubMed]
- Gravot, A.; Dittami, S.M.; Rousvoal, S.; Lugan, R.; Eggert, A.; Collén, J.; Boyen, C.; Bouchereau, A.; Tonon, T. Diurnal oscillations of metabolite abundances and gene analysis provide new insights into central metabolic processes of the brown alga Ectocarpus siliculosus. New Phytol. 2010, 188, 98–110. [Google Scholar] [CrossRef]
- Bonin, P.; Groisillier, A.; Raimbault, A.; Guibert, A.; Boyen, C.; Tonon, T. Molecular and biochemical characterization of mannitol-1-phosphate dehydrogenase from the model brown alga Ectocarpus sp. Phytochemistry 2015, 117, 509–520. [Google Scholar] [CrossRef]
- Groisillier, A.; Shao, Z.; Michel, G.; Goulitquer, S.; Bonin, P.; Krahulec, S.; Nidetzky, B.; Duan, D.; Boyen, C.; Tonon, T. Mannitol metabolism in brown algae involves a new phosphatase family. J. Exp. Bot. 2014, 65, 559–570. [Google Scholar] [CrossRef]
- Sakuma, Y.; Maruyama, K.; Qin, F.; Osakabe, Y.; Shinozaki, K.; Yamaguchi-Shinozaki, K. Dual function of an Arabidopsis transcription factor DREB2A in water-stress-responsive and heat-stress-responsive gene expression. Proc. Natl. Acad. Sci. USA 2006, 103, 18822–18827. [Google Scholar] [CrossRef] [PubMed]
- Yoo, J.H.; Park, C.Y.; Kim, J.C.; Do Heo, W.; Cheong, M.S.; Park, H.C.; Kim, M.C.; Moon, B.C.; Choi, M.S.; Kang, Y.H.; et al. Direct interaction of a divergent CaM isoform and the transcription factor, MYB2, enhances salt tolerance in Arabidopsis. J. Biol. Chem. 2005, 280, 3697–3706. [Google Scholar] [CrossRef] [PubMed]
- Akhter, S.; Uddin, M.N.; Jeong, I.S.; Kim, D.W.; Liu, X.M.; Bahk, J.D. Role of Arabidopsis At PI 4Kγ3, a type II phosphoinositide 4-kinase, in abiotic stress responses and floral transition. Plant Biotechnol. J. 2016, 14, 215–230. [Google Scholar] [CrossRef]
- Li, L.; Zheng, W.; Zhu, Y.; Ye, H.; Tang, B.; Arendsee, Z.W.; Jones, D.; Li, R.; Ortiz, D.; Zhao, X.; et al. QQS orphan gene regulates carbon and nitrogen partitioning across species via NF-YC interactions. Proc. Natl. Acad. Sci. USA 2015, 112, 14734–14739. [Google Scholar] [CrossRef]
- Qi, M.; Zheng, W.; Zhao, X.; Hohenstein, J.D.; Kandel, Y.; O’Conner, S.; Wang, Y.; Du, C.; Nettleton, D.; MacIntosh, G.C.; et al. QQS orphan gene and its interactor NF-YC4 reduce susceptibility to pathogens and pests. Plant Biotechnol. J. 2019, 17, 252–263. [Google Scholar] [CrossRef]
- Thalmann, M.; Santelia, D. Starch as a determinant of plant fitness under abiotic stress. New Phytol. 2017, 214, 943–951. [Google Scholar] [CrossRef]
- Rook, F.; Hadingham, S.A.; Li, Y.; Bevan, M.W. Sugar and ABA response pathways and the control of gene expression. Plant Cell Environ. 2006, 29, 426–434. [Google Scholar] [CrossRef]
- Kempa, S.; Krasensky, J.; Dal Santo, S.; Kopka, J.; Jonak, C. A central role of abscisic acid in stress-regulated carbohydrate metabolism. PLoS ONE 2008, 3, e3935. [Google Scholar] [CrossRef]
- Lloyd, J.R.; Kossmann, J.; Ritte, G. Leaf starch degradation comes out of the shadows. Trends Plant Sci. 2005, 10, 130–137. [Google Scholar] [CrossRef]
- Qin, X.; Zeevaart, J.A. Overexpression of a 9-cis-epoxycarotenoid dioxygenase gene in Nicotiana plumbaginifolia increases abscisic acid and phaseic acid levels and enhances drought tolerance. Plant Physiol. 2002, 128, 544–551. [Google Scholar] [CrossRef]
- Wang, W.; Vinocur, B.; Shoseyov, O.; Altman, A. Role of plant heat-shock proteins and molecular chaperones in the abiotic stress response. Trends Plant Sci. 2004, 9, 244–252. [Google Scholar] [CrossRef]
- Hundertmark, M.; Hincha, D.K. LEA (late embryogenesis abundant) proteins and their encoding genes in Arabidopsis thaliana. BMC Genomics 2008, 9, 118. [Google Scholar] [CrossRef]
- Kiyosue, T.; Abe, H.; Yamaguchi-Shinozaki, K.; Shinozaki, K. ERD6, a cDNA clone for an early dehydration-induced gene of Arabidopsis, encodes a putative sugar transporter. BBA Biomembr. 1998, 1370, 187–191. [Google Scholar] [CrossRef]
- Jia, F.; Qi, S.; Li, H.; Liu, P.; Li, P.; Wu, C.; Zheng, C.; Huang, J. Overexpression of Late Embryogenesis Abundant 14 enhances Arabidopsis salt stress tolerance. Biochem. Biophys. Res. Commun. 2014, 454, 505–511. [Google Scholar] [CrossRef]
- Tunnacliffe, A.; Wise, M.J. The continuing conundrum of the LEA proteins. Naturwissenschaften 2007, 94, 791–812. [Google Scholar] [CrossRef] [PubMed]
- Lee, S.; Lee, E.J.; Yang, E.J.; Lee, J.E.; Park, A.R.; Song, W.H.; Park, O.K. Proteomic identification of annexins, calcium-dependent membrane binding proteins that mediate osmotic stress and abscisic acid signal transduction in Arabidopsis. Plant Cell 2004, 16, 1378–1391. [Google Scholar] [CrossRef]
- Guo, K.M.; Babourina, O.; Christopher, D.A.; Borsics, T.; Rengel, Z. The cyclic nucleotide-gated channel, AtCNGC10, influences salt tolerance in Arabidopsis. Physiol. Plant. 2008, 134, 499–507. [Google Scholar] [CrossRef]
- Demidchik, V.; Cuin, T.A.; Svistunenko, D.; Smith, S.J.; Miller, A.J.; Shabala, S.; Sokolik, A.; Yurin, V. Arabidopsis root K+-efflux conductance activated by hydroxyl radicals: Single-channel properties, genetic basis and involvement in stress-induced cell death. J. Cell Sci. 2010, 123, 1468–1479. [Google Scholar] [CrossRef]
- Laohavisit, A.; Richards, S.L.; Shabala, L.; Chen, C.; Colaço, R.D.; Swarbreck, S.M.; Shaw, E.; Dark, A.; Shabala, S.; Shang, Z.; et al. Salinity-induced calcium signaling and root adaptation in Arabidopsis require the calcium regulatory protein annexin1. Plant Physiol. 2013, 163, 253–262. [Google Scholar] [CrossRef]
- Qiu, Q.-S.; Barkla, B.J.; Vera-Estrella, R.; Zhu, J.-K.; Schumaker, K.S. Na+/H+ exchange activity in the plasma membrane of Arabidopsis. Plant Physiol. 2003, 132, 1041–1052. [Google Scholar] [CrossRef] [PubMed]
- Apse, M.P.; Sottosanto, J.B.; Blumwald, E. Vacuolar cation/H+ exchange, ion homeostasis, and leaf development are altered in a T-DNA insertional mutant of AtNHX1, the Arabidopsis vacuolar Na+/H+ antiporter. Plant J. 2003, 36, 229–239. [Google Scholar] [CrossRef]
- Zhang, H.-X.; Blumwald, E. Transgenic salt-tolerant tomato plants accumulate salt in foliage but not in fruit. Nat. Biotechnol. 2001, 19, 765–768. [Google Scholar] [CrossRef] [PubMed]
- Pilot, G.; Gaymard, F.; Mouline, K.; Chérel, I.; Sentenac, H. Regulated expression of Arabidopsis Shaker K+ channel genes involved in K+ uptake and distribution in the plant. Plant Mol. Biol. 2003, 51, 773–787. [Google Scholar] [CrossRef]
- Osakabe, Y.; Arinaga, N.; Umezawa, T.; Katsura, S.; Nagamachi, K.; Tanaka, H.; Ohiraki, H.; Yamada, K.; Seo, S.-U.; Abo, M.; et al. Osmotic stress responses and plant growth controlled by potassium transporters in Arabidopsis. Plant Cell 2013, 25, 609–624. [Google Scholar] [CrossRef]
- Mittler, R. Oxidative stress, antioxidants and stress tolerance. Trends Plant Sci. 2002, 7, 405–410. [Google Scholar] [CrossRef]
- Willekens, H.; Chamnongpol, S.; Davey, M.; Schraudner, M.; Langebartels, C.; Van Montagu, M.; Inzé, D.; Van Camp, W. Catalase is a sink for H2O2 and is indispensable for stress defence in C3 plants. EMBO J. 1997, 16, 4806–4816. [Google Scholar] [CrossRef] [PubMed]
- Chang, C.C.; Ślesak, I.; Jordá, L.; Sotnikov, A.; Melzer, M.; Miszalski, Z.; Mullineaux, P.M.; Parker, J.E.; Karpińska, B.; Karpiński, S. Arabidopsis chloroplastic glutathione peroxidases play a role in cross talk between photooxidative stress and immune responses. Plant Physiol. 2009, 150, 670–683. [Google Scholar] [CrossRef]
- Rossel, J.B.; Walter, P.B.; Hendrickson, L.; Chow, W.S.; Poole, A.; Mullineaux, P.M.; Pogson, B.J. A mutation affecting ASCORBATE PEROXIDASE 2 gene expression reveals a link between responses to high light and drought tolerance. Plant Cell Environ. 2006, 29, 269–281. [Google Scholar] [CrossRef]
- Dixon, D.P.; Cummins, I.; Cole, D.J.; Edwards, R. Glutathione-mediated detoxification systems in plants. Curr. Opin. Plant Biol. 1998, 1, 258–266. [Google Scholar] [CrossRef]
- Antoni, R.; Gonzalez-Guzman, M.; Rodriguez, L.; Rodrigues, A.; Pizzio, G.A.; Rodriguez, P.L. Selective inhibition of clade A phosphatases type 2C by PYR/PYL/RCAR abscisic acid receptors. Plant Physiol. 2012, 158, 970–980. [Google Scholar] [CrossRef]
- Fujii, H.; Chinnusamy, V.; Rodrigues, A.; Rubio, S.; Antoni, R.; Park, S.-Y.; Cutler, S.R.; Sheen, J.; Rodriguez, P.L.; Zhu, J.-K. In vitro reconstitution of an abscisic acid signalling pathway. Nature 2009, 462, 660. [Google Scholar] [CrossRef]
- Soon, F.-F.; Ng, L.-M.; Zhou, X.E.; West, G.M.; Kovach, A.; Tan, M.E.; Suino-Powell, K.M.; He, Y.; Xu, Y.; Chalmers, M.J.; et al. Molecular mimicry regulates ABA signaling by SnRK2 kinases and PP2C phosphatases. Science 2012, 335, 85–88. [Google Scholar] [CrossRef]
- Clough, S.J.; Bent, A.F. Floral dip: A simplified method for Agrobacterium-mediated transformation of Arabidopsis thaliana. Plant J. 1998, 16, 735–743. [Google Scholar] [CrossRef] [PubMed]
- Heberle, H.; Meirelles, G.V.; da Silva, F.R.; Telles, G.P.; Minghim, R. InteractiVenn: A web-based tool for the analysis of sets through Venn diagrams. BMC Bioinform. 2015, 16, 1–7. [Google Scholar] [CrossRef]
- Babicki, S.; Arndt, D.; Marcu, A.; Liang, Y.; Grant, J.R.; Maciejewski, A.; Wishart, D.S. Heatmapper: Web-enabled heat mapping for all. Nucleic Acid Res. 2016, 44, W147–W153. [Google Scholar] [CrossRef] [PubMed]


Publisher’s Note: MDPI stays neutral with regard to jurisdictional claims in published maps and institutional affiliations. |
© 2020 by the authors. Licensee MDPI, Basel, Switzerland. This article is an open access article distributed under the terms and conditions of the Creative Commons Attribution (CC BY) license (http://creativecommons.org/licenses/by/4.0/).
Share and Cite
Rathor, P.; Borza, T.; Liu, Y.; Qin, Y.; Stone, S.; Zhang, J.; Hui, J.P.M.; Berrue, F.; Groisillier, A.; Tonon, T.; et al. Low Mannitol Concentrations in Arabidopsis thaliana Expressing Ectocarpus Genes Improve Salt Tolerance. Plants 2020, 9, 1508. https://doi.org/10.3390/plants9111508
Rathor P, Borza T, Liu Y, Qin Y, Stone S, Zhang J, Hui JPM, Berrue F, Groisillier A, Tonon T, et al. Low Mannitol Concentrations in Arabidopsis thaliana Expressing Ectocarpus Genes Improve Salt Tolerance. Plants. 2020; 9(11):1508. https://doi.org/10.3390/plants9111508
Chicago/Turabian StyleRathor, Pramod, Tudor Borza, Yanhui Liu, Yuan Qin, Sophia Stone, Junzeng Zhang, Joseph P. M. Hui, Fabrice Berrue, Agnès Groisillier, Thierry Tonon, and et al. 2020. "Low Mannitol Concentrations in Arabidopsis thaliana Expressing Ectocarpus Genes Improve Salt Tolerance" Plants 9, no. 11: 1508. https://doi.org/10.3390/plants9111508
APA StyleRathor, P., Borza, T., Liu, Y., Qin, Y., Stone, S., Zhang, J., Hui, J. P. M., Berrue, F., Groisillier, A., Tonon, T., Yurgel, S., Potin, P., & Prithiviraj, B. (2020). Low Mannitol Concentrations in Arabidopsis thaliana Expressing Ectocarpus Genes Improve Salt Tolerance. Plants, 9(11), 1508. https://doi.org/10.3390/plants9111508