Article

Advancing the Taxonomy of the Diatom Pseudo-nitzschia Through an Integrative Study Conducted in the Central and Southeastern Adriatic Sea

1
Institute of Oceanography and Fisheries, Šetalište Ivana Meštrovića 63, 21000 Split, Croatia
2
Doctoral Study of Biophysics, Faculty of Science, University of Split, Ruđera Boškovića 37, 21000 Split, Croatia
3
Department of Biology, Faculty of Science, University of Zagreb, Ravnice 48, 10000 Zagreb, Croatia
4
Department of Biomolecular Sciences, Campus E. Mattei, University of Urbino, Via Ca’ le Suore 2/4, 61029 Urbino, Italy
5
CoNISMa National Inter-University Consortium for Marine Sciences, 00196 Rome, Italy
*
Author to whom correspondence should be addressed.
Plants 2025, 14(2), 245; https://doi.org/10.3390/plants14020245
Submission received: 19 December 2024 / Revised: 8 January 2025 / Accepted: 14 January 2025 / Published: 16 January 2025
(This article belongs to the Section Plant Systematics, Taxonomy, Nomenclature and Classification)

Abstract

:
The marine diatom genus Pseudo-nitzschia comprises cosmopolitan phytoplankton species commonly present in the Adriatic Sea. Species within the genus Pseudo-nitzschia have been of significant concern because they produce domoic acid (DA), which can cause amnesic shellfish poisoning (ASP). In this study, we identified Pseudo-nitzschia species along the Central and Southeastern Adriatic Sea, where monthly sampling carried out from February 2022 to February 2024 allowed for comprehensive species documentation. Pseudo-nitzschia species cell cultures isolated from the study areas were morphologically and molecularly analysed. Morphological analyses were performed using a scanning electron microscope (FE-SEM/STEM), while molecular analyses were conducted, targeting the ITS1-5.8S-ITS2, LSU, and rbcL regions, to confirm species identity. This integrative approach led to the identification of eight species: Pseudo-nitzschia allochrona, Pseudo-nitzschia calliantha, Pseudo-nitzschia delicatissima, Pseudo-nitzschia fraudulenta, Pseudo-nitzschia mannii, Pseudo-nitzschia multistriata, Pseudo-nitzschia pseudodelicatissima, and Pseudo-nitzschia subfraudulenta. Our findings underscore the value of a combined approach for reliable species identification and contribute to the development of genetic sequence databases that support the advancement of next-generation methods such as metabarcoding. This research emphasises the importance of combined morphological and molecular methods for the differentiation of the cryptic and pseudo-cryptic Pseudo-nitzschia species.

1. Introduction

Diatoms of the genus Pseudo-nitzschia are well-known and extensively studied components of phytoplankton communities. Distinguishing these diatoms at the species level is extremely important from a public-health perspective, as some Pseudo-nitzschia species produce domoic acid (DA), a potent neurotoxin that can have harmful effects on humans and marine organisms [1,2]. Since 1987, Pseudo-nitzschia species have attracted considerable scientific attention following three reported deaths in Canada caused by the consumption of blue mussels containing high levels of DA, which resulted in amnesic shellfish poisoning (ASP) produced by the Pseudo-nitzschia multiseries [3]. Due to public health concerns, the number of described Pseudo-nitzschia species has increased rapidly. A 2012 study by Lelong et al. [1] reported that at least 37 species of the diatom genus Pseudo-nitzschia have been identified. Currently, there are 63 Pseudo-nitzschia species in total, out of which 28 species are known to produce DA [4,5,6,7,8,9].
However, the presence of cryptic and pseudo-cryptic species [10,11,12] within this genus limits the accuracy of traditionally used morphological methods and necessitates an integrative approach combining morphological and molecular data. Traditionally, Pseudo-nitzschia species can be categorised based on morphological characteristics into the P. delicatissima group, with a cell width less than 3 μm, and the P. seriata group, with a cell width greater than 3 μm. However, some Pseudo-nitzschia species, such as P. multistriata and P. pungens, fall into both categories because their cell widths overlap the defined morpho-categories.
Previous studies of Pseudo-nitzschia diversity along the Eastern Adriatic Sea generally focused on electron microscopy analyses [13,14,15,16,17,18]. Only a few studies included molecular sequencing related to the occurrence of P. mannii [19], P. allochrona (reported as P. cf. arenysensis) [20,21], and, from the latest report, P. hasleana and P. galaxiae [18]. Until now, integrative taxonomical approaches studying Pseudo-nitzschia diversity have been restricted to the Northern Adriatic Sea area [22,23,24].
The most used genetic markers for Pseudo-nitzschia identification are ITS1-5.8S-ITS2 and LSU [12], but new research is also employing the rbcL marker [23]. The use of various markers can aid in identifying cryptic and pseudo-cryptic species, such as P. allochrona or P. delicatissima, as well as P. calliantha or P. pseudodelicatissima, which belong to the P. delicatissima and P. pseudodelicatissima species complex and are common in the Adriatic Sea. The necessity of continuous research in the vicinity of mussel farms in the Adriatic Sea is also reflected in sporadic detection of low DA concentrations in this area [16,25]. Moreover, no integrated morphological and molecular data are available for the Central and Southern parts of the Eastern Adriatic Sea. Therefore, the main objective of this research was the morphological and molecular characterisation of Pseudo-nitzschia species in the coastal waters of the Central and Southeastern Adriatic Sea in the vicinity of mussel farms. The aim of this study was to develop a combined integrative database of morphological and molecular data on the Pseudo-nitzschia genus to enrich the publicly available ITS, LSU, and rbcL sequence databases and aid in distinguishing these cryptic and pseudo-cryptic species on a wider scale.

2. Results

During the study period, 321 Pseudo-nitzschia cell cultures were successfully established from the native phytoplankton community and molecularly sequenced at one gene marker. Out of all the established cell cultures, 184 were confirmed by sequencing at least two regions (ITS1-5.8S-ITS2 (hereafter referred to as ITS), LSU, or rbcL), and 113 were sequenced across all three regions: ITS, LSU, and rbcL (Supplementary Table S1). The Pseudo-nitzschia species included in this study were confirmed with a minimum of two barcodes (ITS, LSU, or rbcL), and 64 isolates were analysed with SEM in addition to molecular confirmation. Eight Pseudo-nitzschia species were established through molecular and morphological analyses of the isolated cell culture, namely, P. allochrona, P. calliantha, P. delicatissima, P. fraudulenta, P. mannii, P. multistriata, P. pseudodelicatissima, and P. subfraudulenta, with additional information regarding rbcL sequences for P. hasleana and P. galaxiae previously published in Arapov et al. [18]. The species that occurred in all the study locations were P. calliantha and P. mannii. The species P. allochrona and P. delicatissima were found at three study locations, as presented in Table 1. In contrast, the species P. fraudulenta and P. pseudodelicatissima were only isolated from Kaštela Bay, while P. multistriata was exclusively found in Šibenik Bay. Additionally, the presence of P. subfraudulenta was established in the Velebit Channel and Šibenik Bay.
The species P. mannii was the only species present throughout all the seasons, while P. calliantha, P. delicatissima, and P. pseudodelicatissima were successfully isolated throughout most of the year (Table 1). Species P. allochrona and P. subfraudulenta were successfully isolated during summer and autumn, while P. fraudulenta was isolated in autumn and winter. P. multistriata was only identified during autumn.

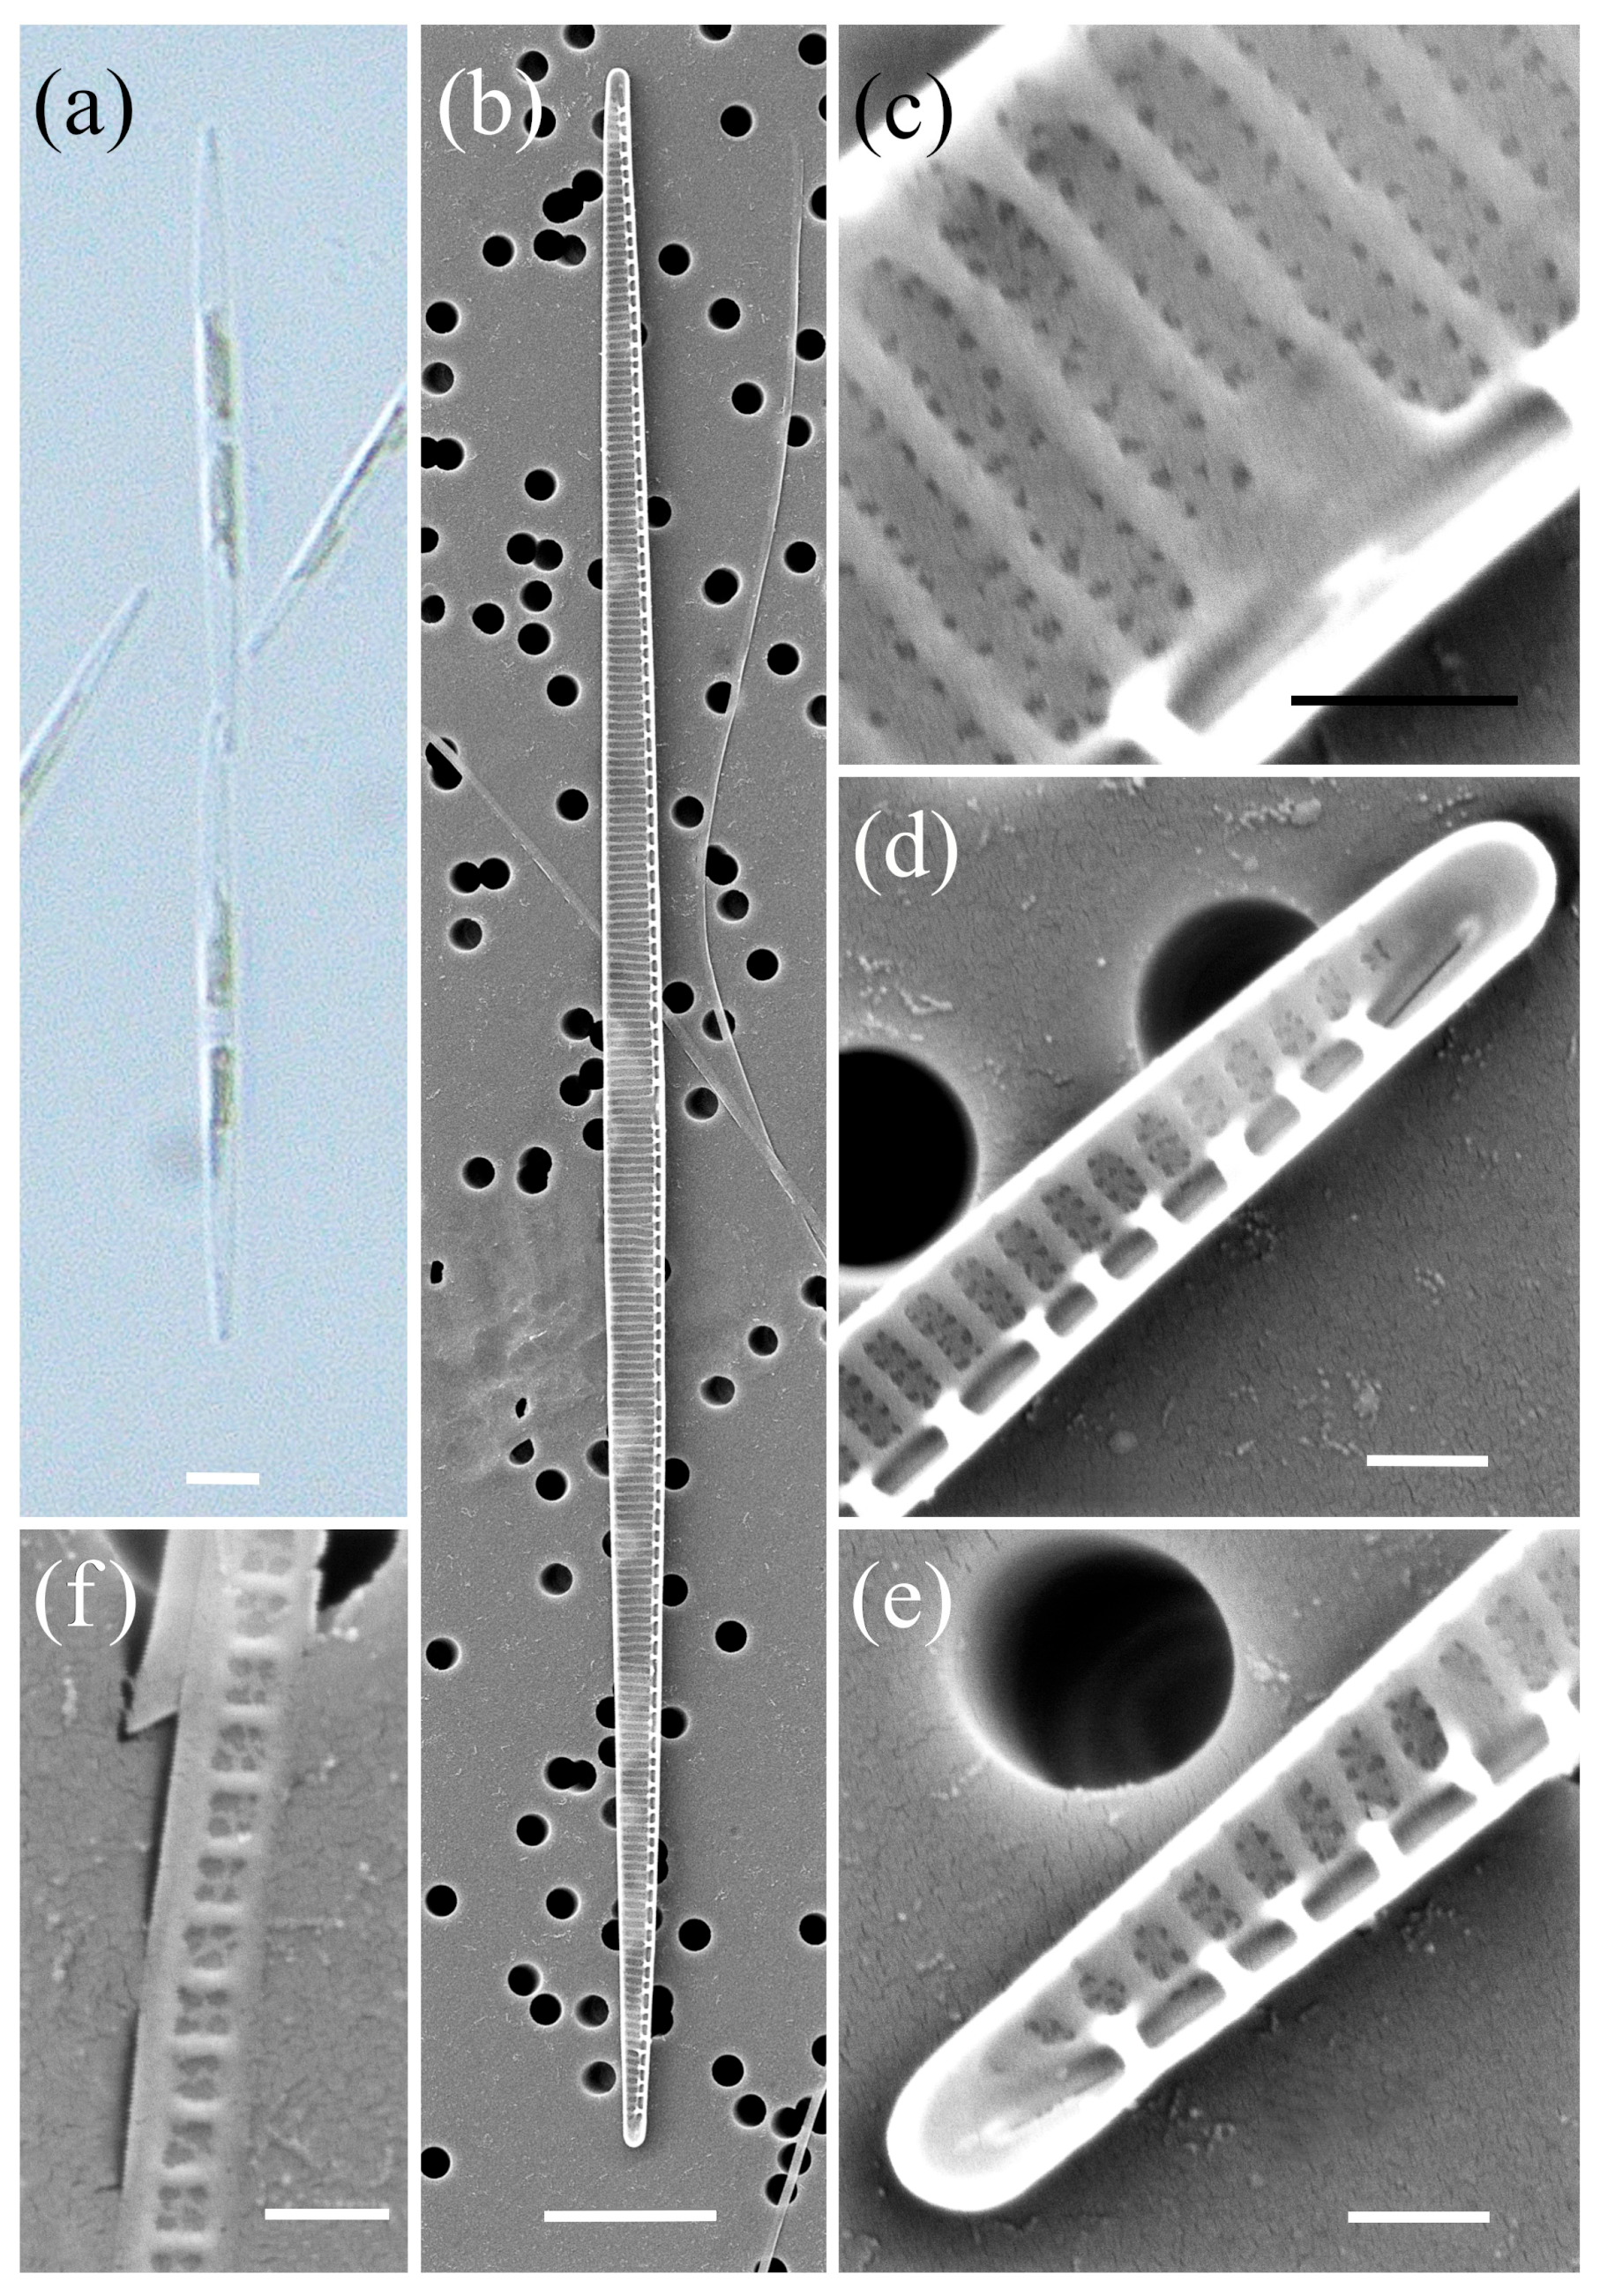
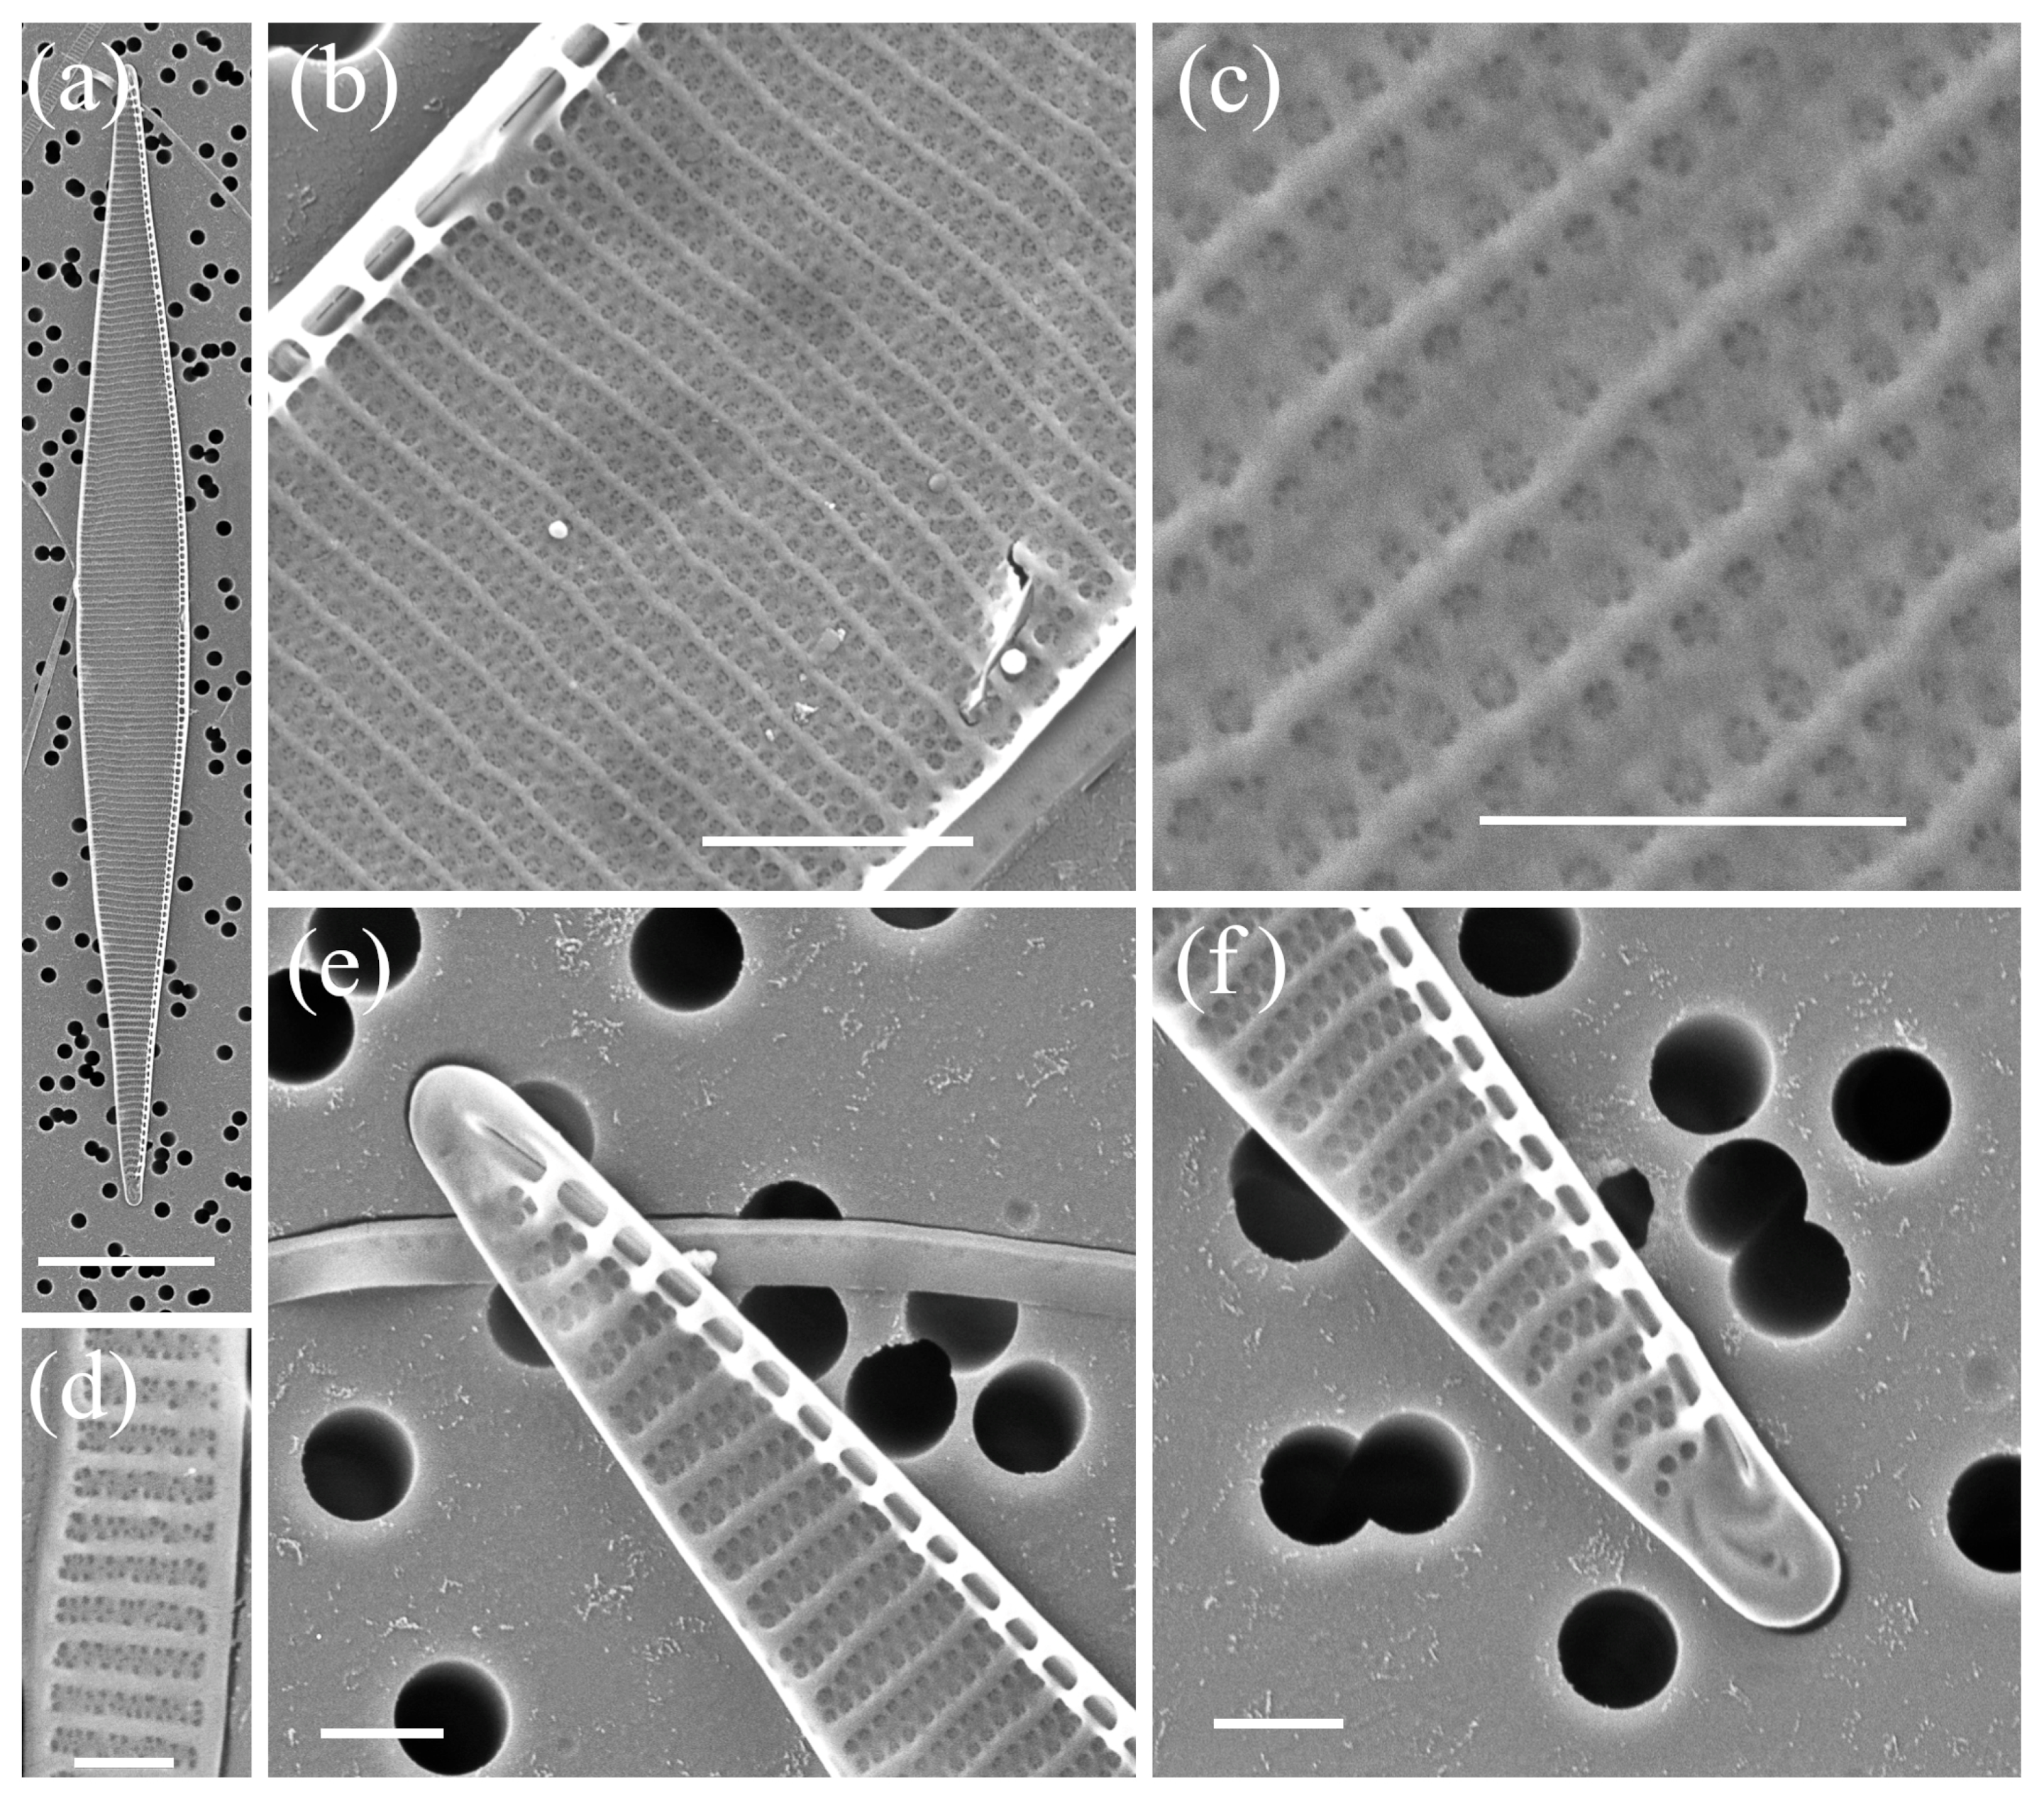
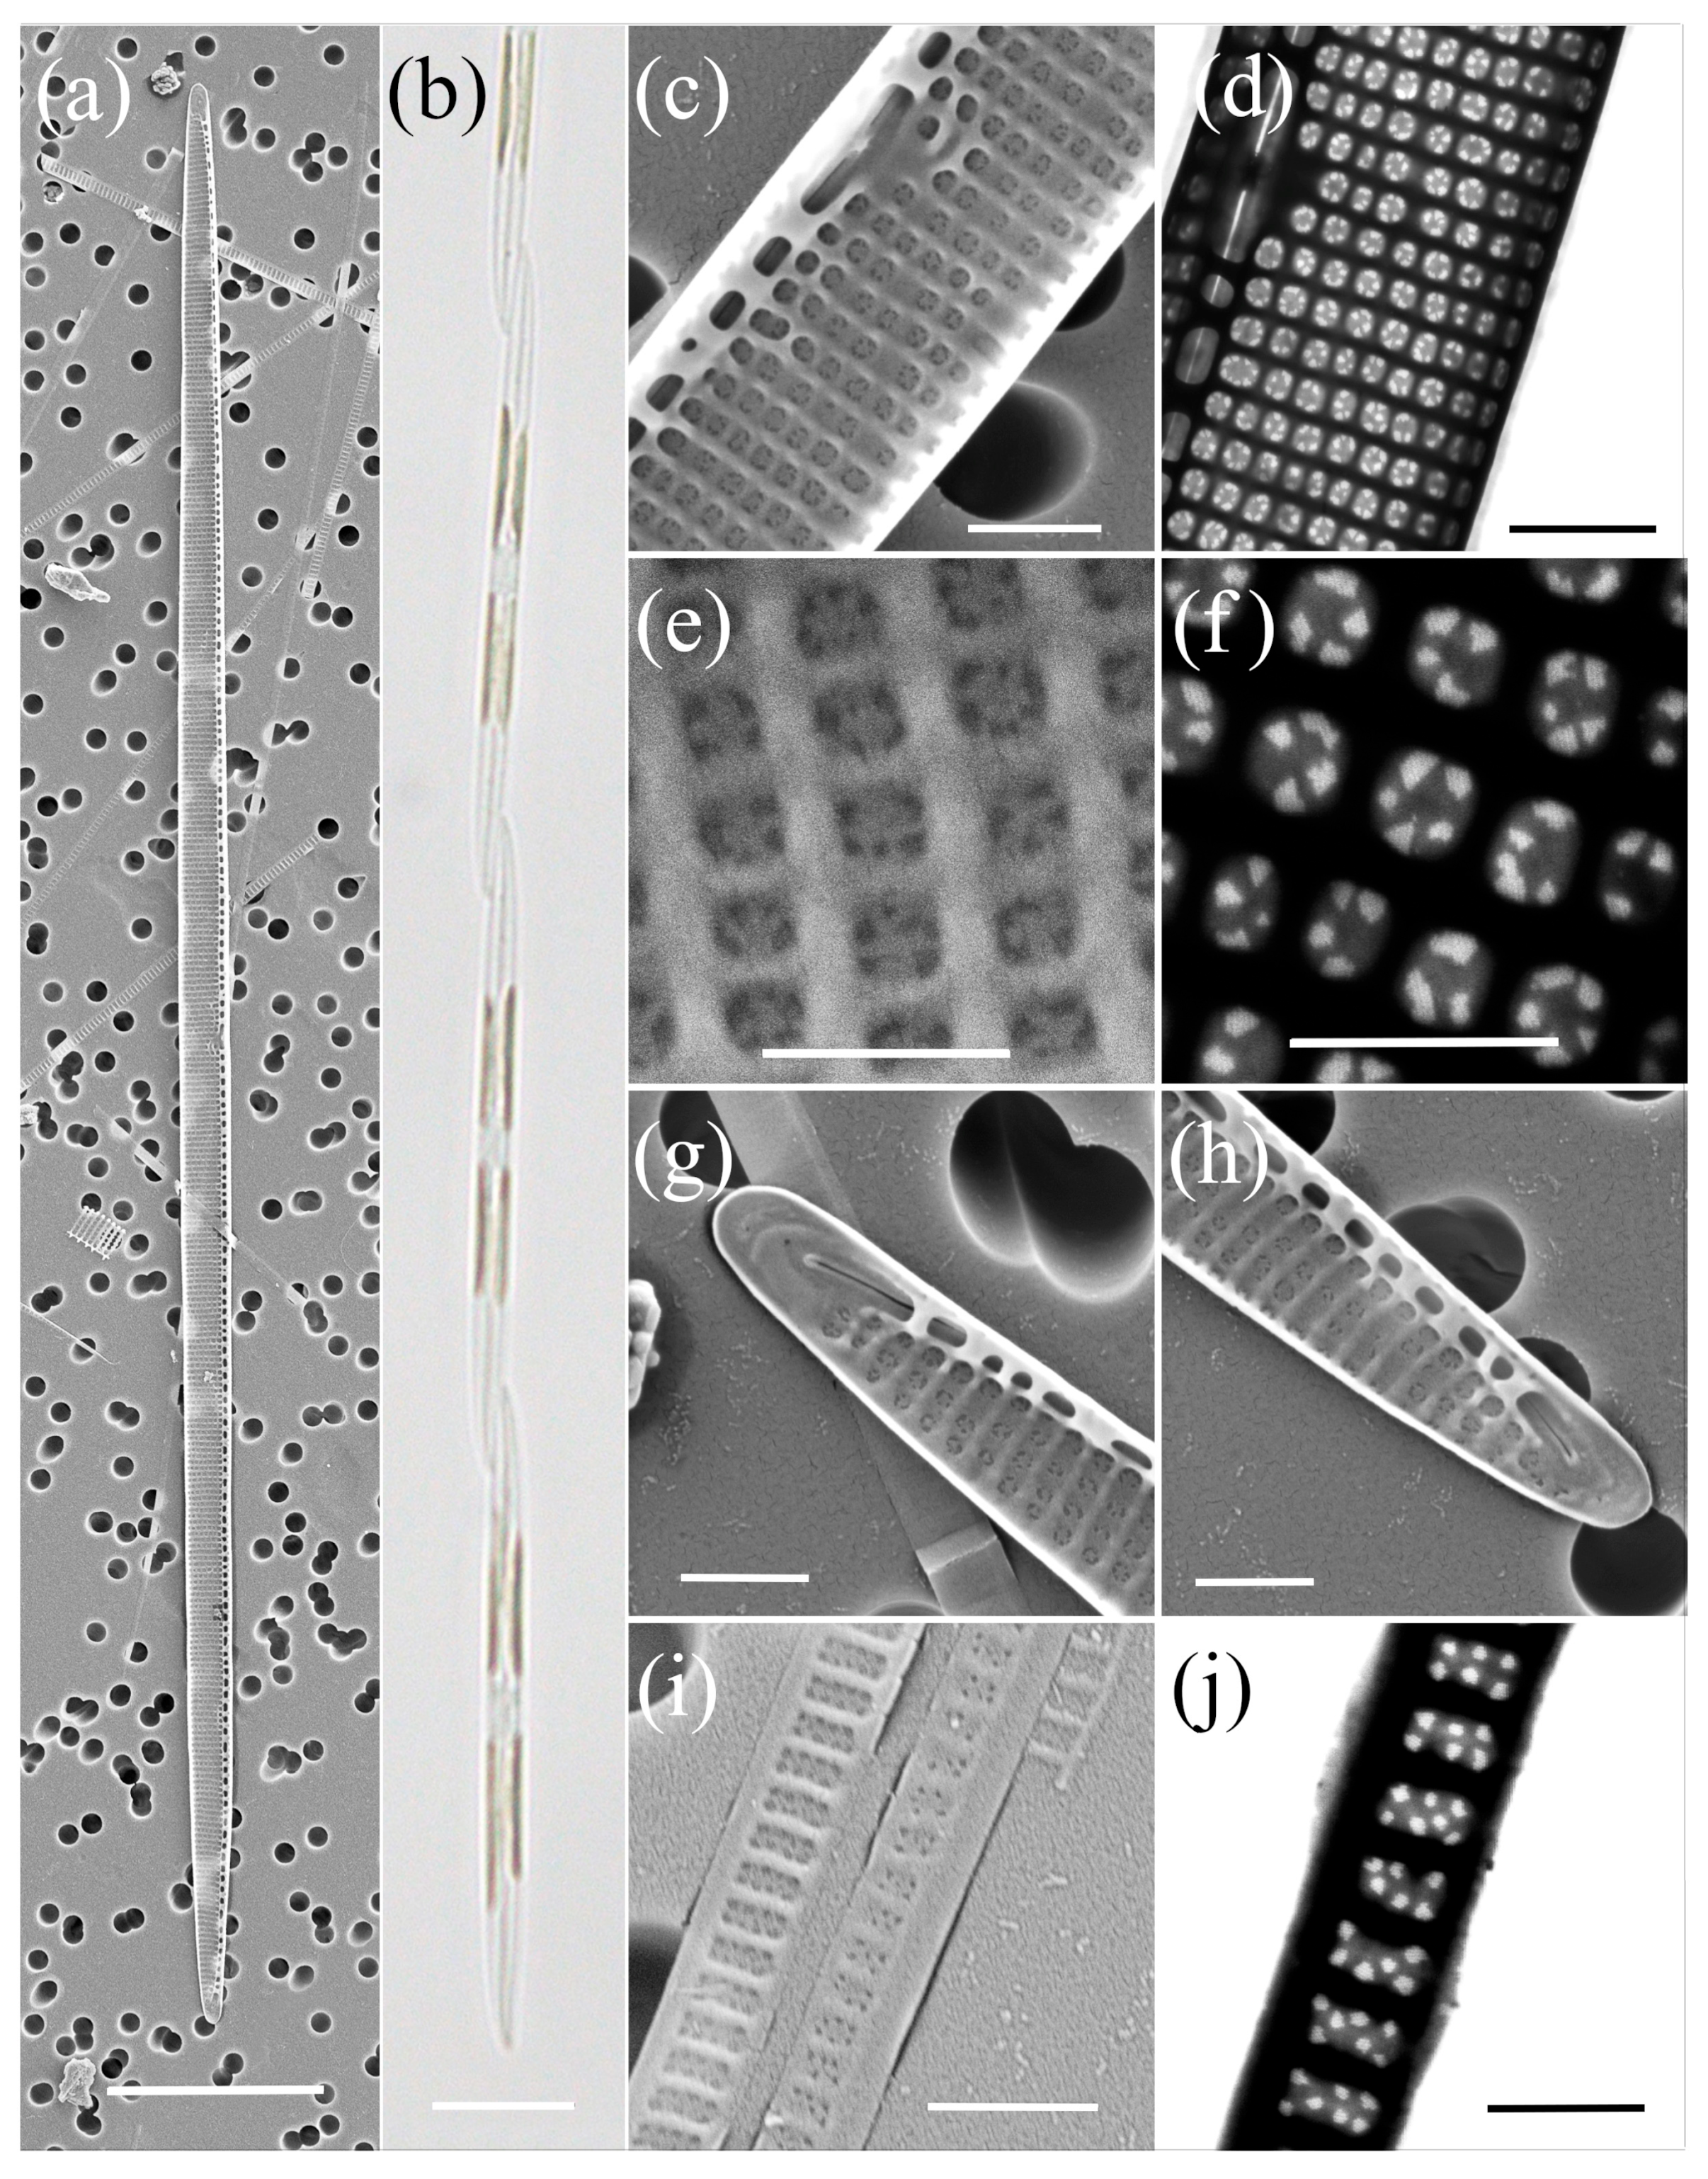
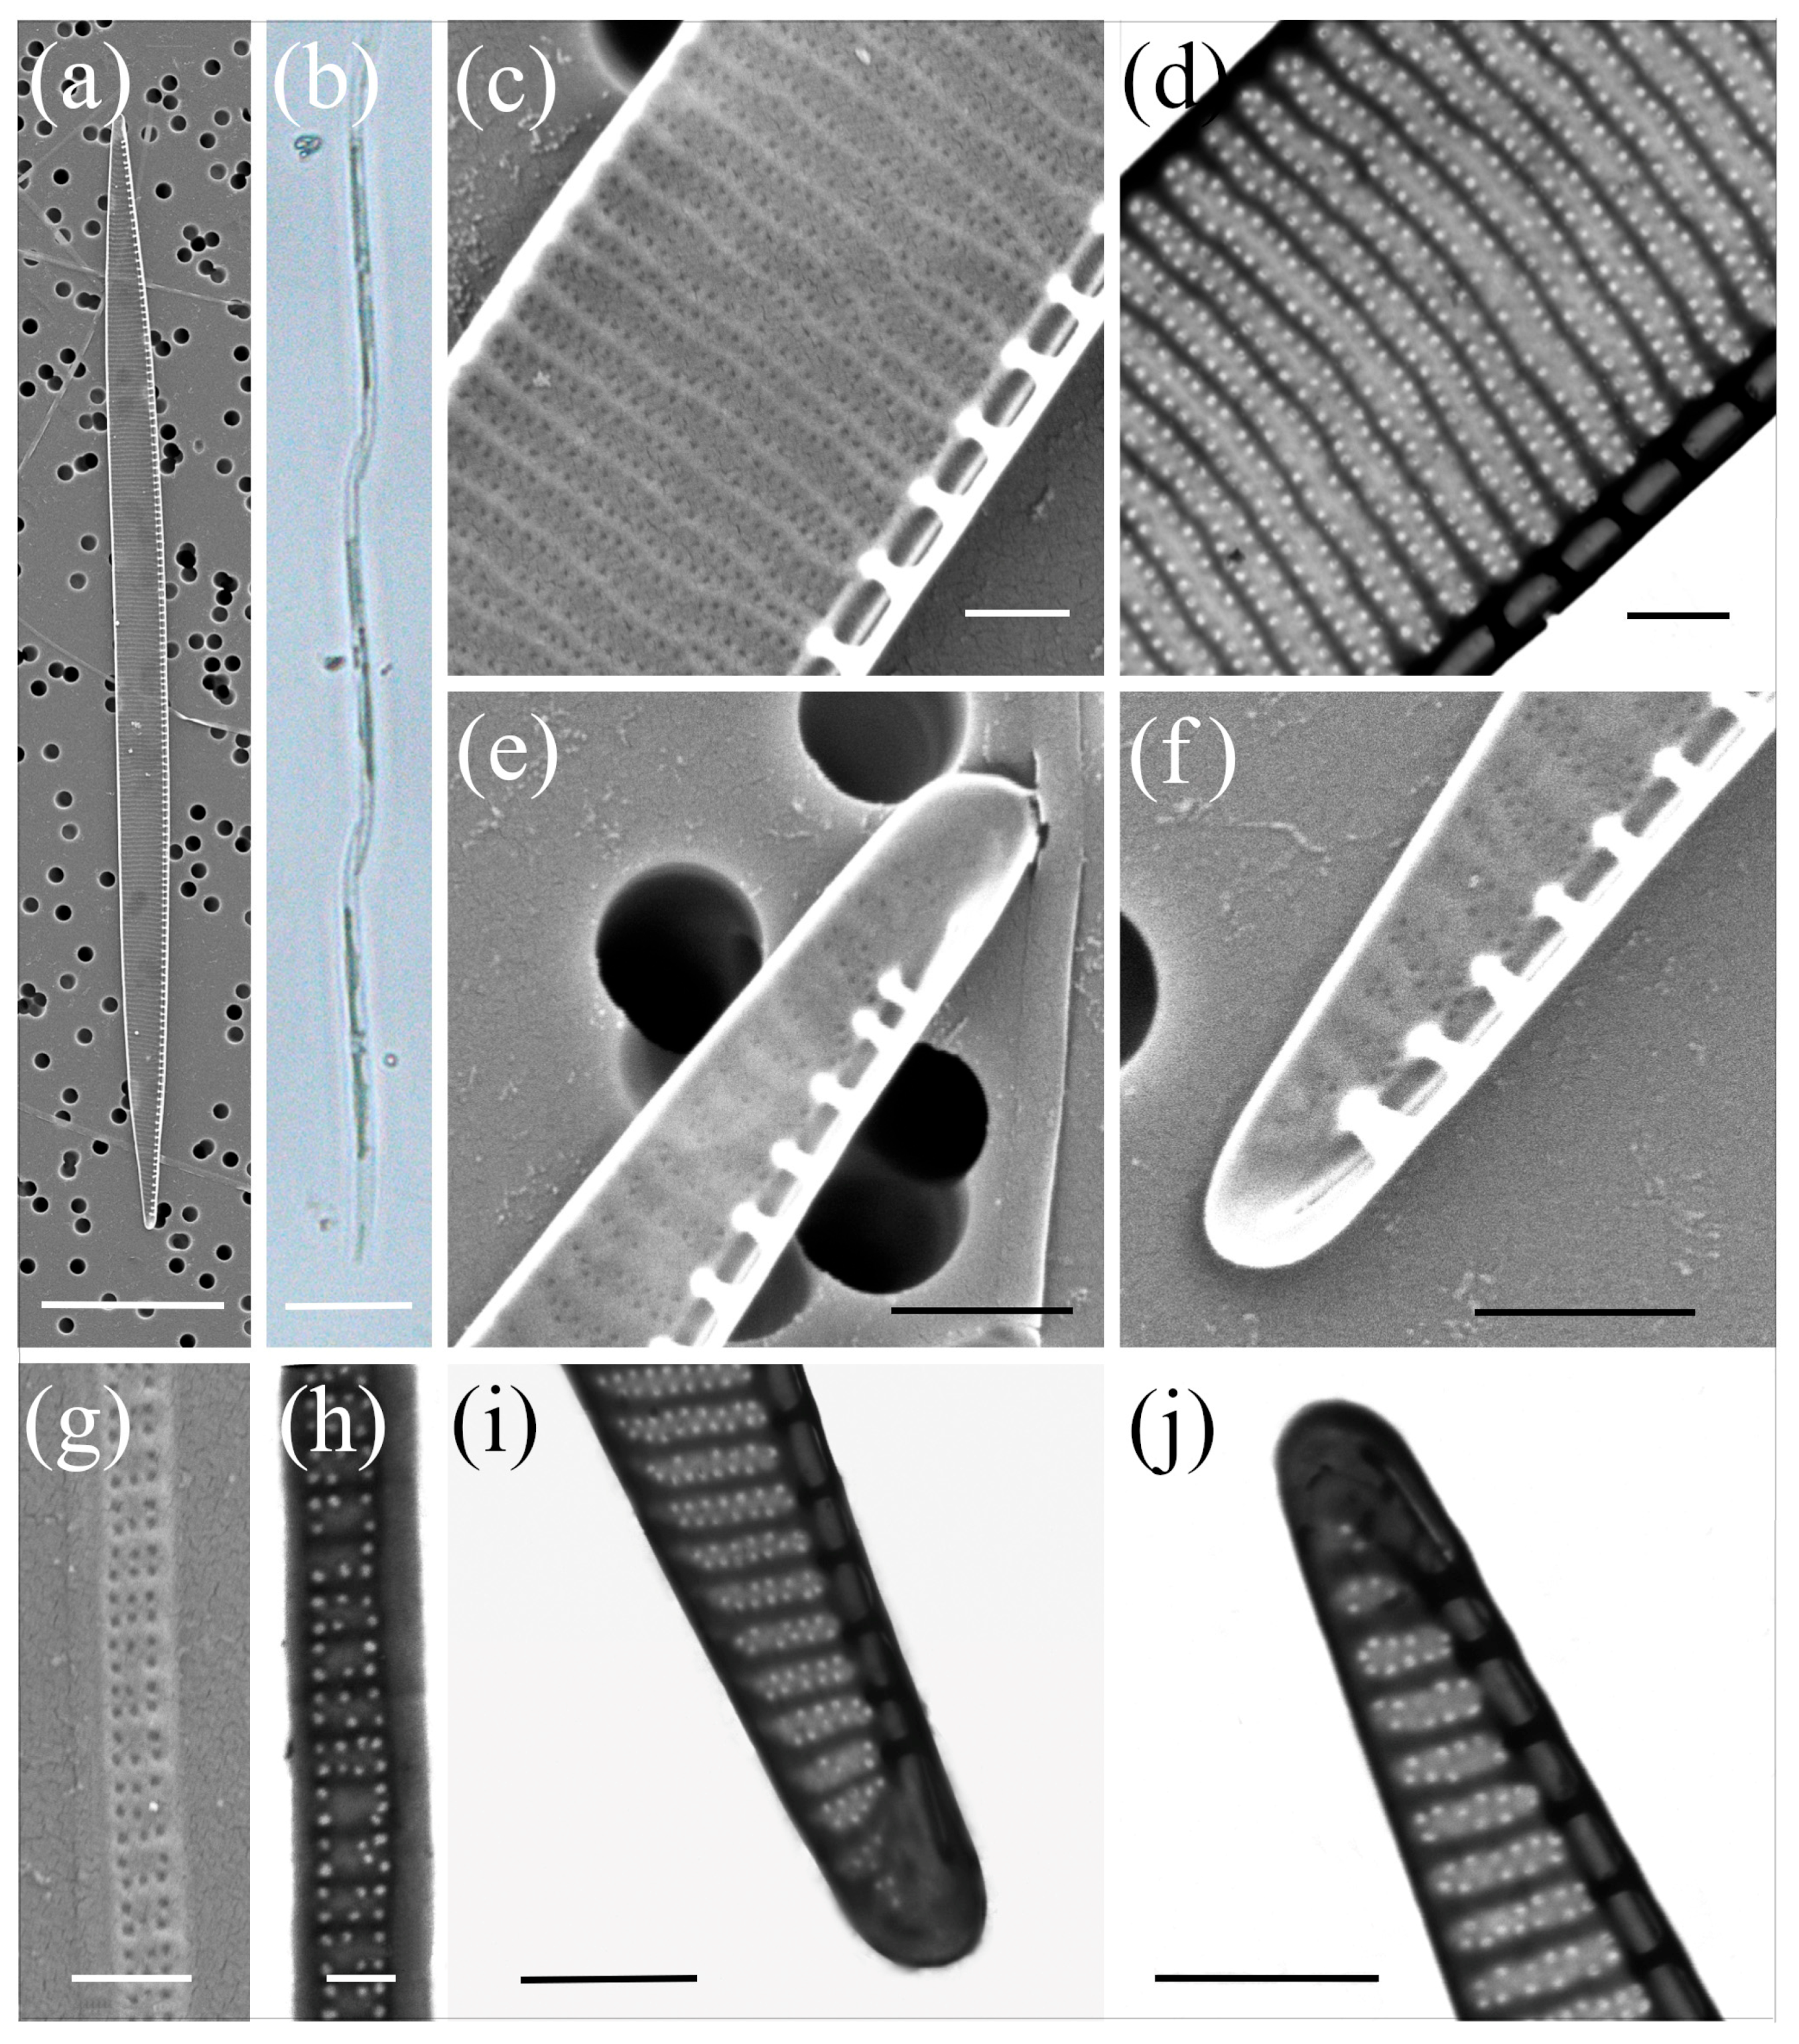
2.1. Morphological Characterisation

The morphological characteristics of the analysed Pseudo-nitzschia cell cultures are presented in Table 2.
Pseudo-nitzschia allochrona Zingone, Percopo & Sarno (Figure 1, Table 2)
The cells were lanceolate with pointed ends in valve view. The valve length and valve width were between 51.06 and 63.01 µm and 1.44 and 2.15 μm, respectively. A central interspace with a central nodule, measuring 2–4 striae, was present. The density of fibulae ranged from 20 to 24, and that of the interstriae ranged from 36 to 39 in 10 µm. In general, each stria was perforated by two rows of poroids, and only at one valve was a single row of poroids observed close to the central nodule. The number of poroids in 1 µm varied from 7 to 13. The valvocopula contained 43 to 45 striae in 10 µm; these were one to two poroids high and two poroids wide.
Pseudo-nitzschia calliantha Lundholm, Moestrup & Hasle (Figure 2, Table 2)
The cells were linear in valve view, with a valve length ranging from 64.08 µm to 107.14 µm and a valve width ranging from 1.38 µm to 2.12 µm. A larger central interspace with a central nodule interrupting the raphe slit, was present and occupied three to five striae. The density of fibulae in 10 µm was between 17 and 22, and that of interstriae was between 34 and 38. The striae were uniseriate, with 4–6 round or square poroids in 1 µm. Each poroid was divided into 2–11 circularly arranged sectors, with a central sector found in 29% of the poroids (n = 3083). The majority of the poroids were divided into six (26%) and five sectors (24%), followed by seven (17%), four (16%), and eight (8%). The valvocopula contained 43–46 band striae in 10 µm, with structured striae measuring two to three poroids in width and three to six poroids (and rarely seven) in height.
Pseudo-nitzschia delicatissima (Cleve) Heiden (Figure 3, Table 2)
The cells were lanceolate with pointed ends in valve view. The valve length exhibited a large range from 31.05 to 94.21 µm, while the valve width ranged from 1.31 to 2.00 µm. A more pronounced lanceolate valve shape was observed in shorter cells, as they have similar widths regardless of the size of the apical axis. A central interspace with a central nodule was present and occupied 2 to 6 striae. The density of fibulae ranged from 20 to 26, and that of interstriae ranged from 37 to 42, in 10 µm. The striae were generally biseriate with 7–13 poroids in 1 µm, but uniseriate striae were also observed, albeit rarely. The valvovopula contained 48–51 band striae in 10 μm; these were one to two poroids high and wide.
Pseudo-nitzschia fraudulenta (Cleve) Hasle (Figure 4, Table 2)
In valve view, the cells were lanceolate with pointed ends. The valve length was between 60.22 and 67.42 µm, and the valve width between 5.09 and 6.54 µm. A central interspace with a central nodule, measuring 3–5 striae, was present. The number of fibulae in 10 µm was almost the same or slightly less than the density of interstriae and ranged from 19 to 24; in comparison, the density of interstriae ranged from 23 to 25. The striae consisted mainly of two rows of poroids, but occasionally one or three rows of poroids were also observed, with five to seven poroids in 1 µm. The valves were slightly silicified, and the exact number of sectors was somewhat difficult to distinguish accurately. Most poroids were divided by four sectors (40%), followed by five (32%), six (14%), and four sectors (12%). The number of band striae in valvocopulae in 10 µm ranged from 38 to 41, and each striae was two to three poroids wide and up to 13 poroids high.
Pseudo-nitzschia mannii Amato & Montresor (Figure 5, Table 2)
The valve length and valve width ranged from 69.08 to 123.56 μm and 1.71 to 2.48 μm, respectively. A central interspace with a central nodule was present and varied in size from two to six striae. The densities of the fibulae and interstriae were 16–23 and 33–37 in 10 μm, respectively. The striae were uniseriate with 4–6 poroids in 1 µm. The poroids consisted of one to eight sectors, predominantly four sectors (35%), followed by three (28%), five (17%), and two sectors (13%). The valvocopula contained 42–44 band striae in 10 μm; these were usually two poroids wide and up to five poroids high.
Pseudo-nitzschia multistriata H. Takano (Figure 6, Table 2)
The cells were lanceolate in valve view and sigmoidal in girdle view. The valve length and valve width were between 55.85 and 84.85 μm and 2.33 and 3.51 μm, respectively. A larger central interspace between the central fibulae including a nodule was not present. The striae were biseriate, and, rarely, one row of poroids was noticed. The density of unsegmented poroids ranged from 9 to 12 in 1 µm. The density of fibulae and interstriae in 10 µm ranged from 23 to 26 and 36 to 40, respectively. The valvocopula consisted of 47 to 51 band striae in 10 µm; these were two poroids wide and two to four poroids high.
Pseudo-nitzschia pseudodelicatissima (Hasle) Hasle (Figure 7, Table 2)
The cells were linear in valve view. The valve length and valve width ranged from 59.14 to 90.99 µm and 1.22 to 1.75 µm, respectively. A larger central interspace with a nodule was present and occupied three to seven striae. The density of fibulae and interstriae in 10 µm ranged from 19 to 26 and 38 to 41, respectively. The striae were uniseriate with a density of 5–7 oval to square poroids in 1 µm. The poroids were usually split into two large sectors (80%), but three (12%), one (4%), and four (3%) sectors were also observed. The number of band striae in valvocopulae ranged from 47 to 52.
Pseudo-nitzschia subfraudulenta (Hasle) Hasle (Figure 8, Table 2)
The cells were linear in the central part in valve view. The valve length ranged from 96.19 µm to 140.33 µm, and valve width ranged from 4.15 µm to 5.25 µm. A larger central interspace with a nodule was present, measuring five to six striae. The densities of fibulae and interstriae in 10 µm were 13–17 and 23–25, respectively. The striae were generally biseriate, although uniseriate striae were occasionally observed. There were 5–6 poroids in 1 µm. The poroids were divided into 2–10 sectors, with predominantly 4 (33%) and 5 sectors (26%) observed, followed by 6 (16%), 3 (14%), and 7 (7%) sectors. The valvocopula consisted of 39 to 41 band striae in 10 µm. In general, the band striae were two poroids wide (and rarely one, three, and four) and up to ten poroids high.

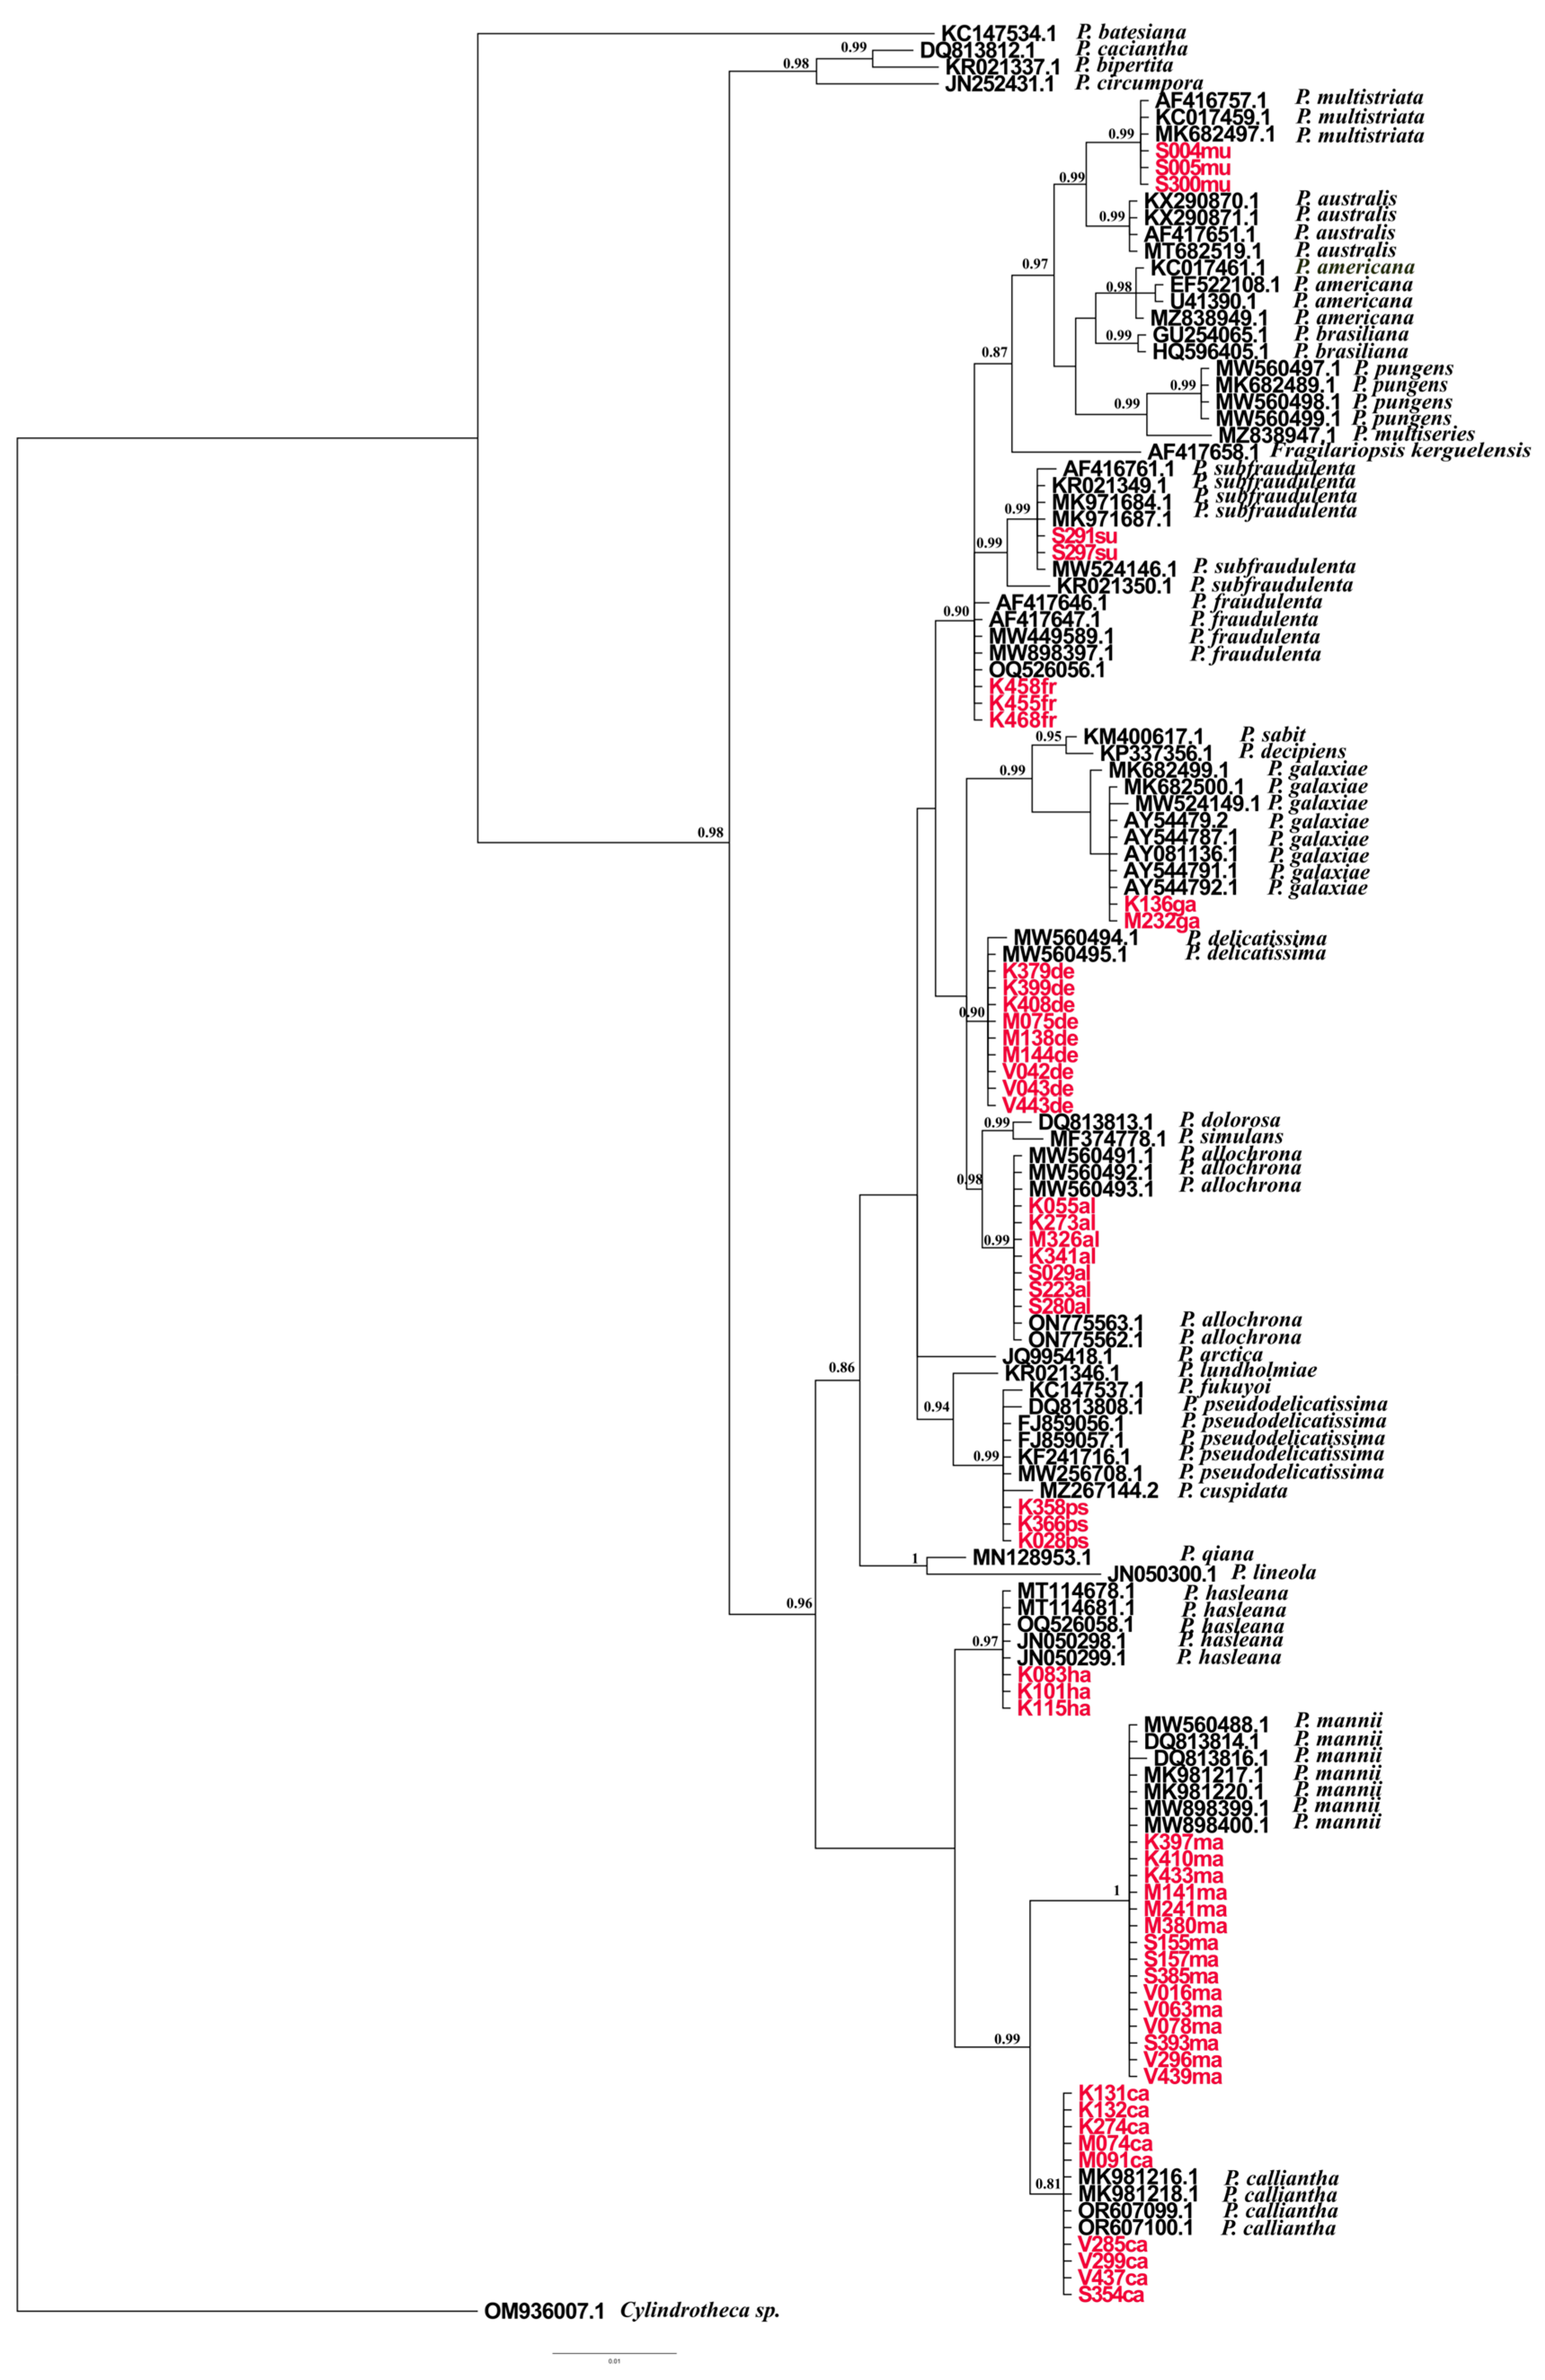
2.2. Phylogenetic Analyses Based on ITS, LSU, and rbcL

Trees were constructed using phylogenies based on ITS, LSU, and rbcL markers. The sequences from our study are noted in Supplementary Table S1 with corresponding species names, isolation locations, and GenBank accession numbers. The datasets yielded 127, 137, and 114 sequences for ITS, LSU, and rbcL, respectively. Alignments included 738 bp for the ITS alignment, 712 bp for the LSU alignment, and 1365 bp for the rbcL alignment. The overall average p-distances were as follows: ITS: 0.212, LSU: 0.029, and rbcL: 0.041; these results indicate that ITS was the most divergent marker of all. The genetically close species P. mannii and P. calliantha were very well resolved in all the observed phylogenetic trees, with strong nodal support > 0.94, while intraspecific variation within P. calliantha and P. mannii species was observed in the ITS and rbcL phylogenetic trees.
Variation was present within species isolated at the same location as well as between species isolated at different locations. P. hasleana is genetically and evolutionary close to P. mannii and P. calliantha, as evidenced in all three phylogenies, with an observed posterior probability of > 0.95. Nevertheless, there are clear differences between them. Slight intraspecific variation between native isolates of P. hasleana and imported sequences is noticeable in the ITS tree.
All the phylogenetic trees separated well the strains recorded in this study that are part of the pseudo-cryptic Pseudo-nitzschia pseudodelicatissima species complex. However, little data were available for rbcL phylogeny, and the ITS and LSU trees yielded the best results for P. pseudodelicatissima, P. plurisecta (present only in the ITS tree), P. lundholmiae, and P. fukuyoi. Overall, most intraspecific variations were observed in the rbcL phylogenies for P. multistriata, P. fraudulenta, P. allochrona, P. delicatissima, and P. galaxiae.
The species P. allochrona and P. delicatissima showed significant phylogenetic similarities and were well resolved in all barcodes, with strong posterior probability. All the phylogenetic trees in this study distinguished the cryptic species of Pseudo-nitzschia delicatissima complex well and with strong nodal support. Intraspecific variation among P. allochrona was detected in the rbcL tree. The observed variation was noted between isolates from the same study area and period (Šibenik Bay, September 2021). The mean p-distance for P. allochrona and P. delicatissima is 0.019. Low genetic distance is a confirmation of a morphologically similar but genetically distinct cryptic complex.
Intraspecific variation between strains was observed in the ITS, LSU, and rbcL phylogenetic trees (Figure 9, Figure 10 and Figure 11). However, only the ITS and rbcL phylogenies showed evident variation between isolates from this study. The observed isolates were from two different locations and seasons: K136ga was isolated in Kaštela Bay in April 2022, while M232ga was isolated in Mali Ston Bay in September 2022. The species P. galaxiae is closest to the Pseudo-nitzschia delicatissima species complex in all the studied trees.
In this study, P. fraudulenta and P. subfraudulenta were identified as sister taxa only in the LSU phylogenies, and intraspecific variation was observed between the P. subfraudulenta isolates from this study and imported strains from GenBank. However, interspecific variation was observed in the ITS and rbcL phylogenies. Variation was present between native and imported species of P. fraudulenta and P. subfraudulenta in the ITS marker, while the rbcL marker distinguished variation among all the observed species.
The species P. multistriata was found in all the phylogenetic trees to be part of the P. seriata group, which includes P. australis, P. americana, P. brasiliana, P. nanaoensis, P. pungens, P. multiseries, and P. seriata. A combined phylogenetic tree of Pseudo-nitzschia species was generated using BI analyses of ITS, LSU and rbcL gene regions, providing high-resolution insights (Figure 12). The combined phylogeny displays a well-resolved branching structure with high posterior probability values across major nodes. The generated structure reflects evolutionary divergence within the genus, with monophyletic groupings demonstrating clear phylogenetic separation among clades (P. allochrona, P. delicatissima, P. fraudulenta, P. subfraudulenta, P. galaxiae, P. mannii, P. calliantha, P. multistriata, P. hasleana, and P. pseudodelicatissima). The phylogenetic tree exhibits high-quality alignment across imported and native Pseudo-nitzschia sequences.

3. Discussion

This research presents the first comprehensive study of the genus Pseudo-nitzschia that combines molecular and morphological analyses conducted in the Central and Southeastern Adriatic Sea. By the end of the study period, 184 Pseudo-nitzschia cell cultures had successfully been isolated from the studied areas and further analysed morphologically and molecularly by using at least two genetic markers. Eight species were identified: P. allochrona, P. calliantha, P. delicatissima, P. fraudulenta, P. mannii, P. multistriata, P. pseudodelicatissima, and P. subfraudulenta. In this study, the species P. subfraudulenta, P. fraudulenta, and P. multistriata were confirmed molecularly using three barcodes after having been previously confirmed based on morphological/SEM analyses from the studied areas [20]. The species P. hasleana and P. galaxiae were additionally confirmed via sequencing the rbcL gene marker after they had previously been recorded on the ITS and LSU gene markers [16,17]. The species of the Pseudo-nitzschia genus found in this study have been previously reported to be in other areas of the Adriatic Sea [22,23,24,26,27].
Analysis of cell cultures using morphological and molecular methods provides an incomplete insight into the diversity of natural populations, but it does provide valuable information on Pseudo-nitzschia species distribution. In our study, the species P. calliantha and P. mannii were found across all the studied locations, and P. mannii was isolated in all seasons. In addition to P. mannii, the species P. calliantha, P. delicatissima, and P. pseudodelictaissima were isolated throughout most of the year, indicating the eurivalent capacity of these species. In accordance with our findings, similar studies have shown that P. calliantha can be isolated throughout the entire year in the Northern Adriatic [23], while P. mannii can be isolated in all seasons except summer [24]. The species that were found at only one site were P. multistriata and P. fraudulenta. We observed that P. fraudulenta was identified exclusively in Kaštela Bay, and its presence was restricted to winter months. The presence of P. fraudulenta has been previously reported, based on morphology, in Kaštela Bay during the winter season [16]. In this study, the presence of P. fraudulenta was verified through molecular sequencing. In the Northern Adriatic, the presence of P. fraudulenta was also confirmed during the winter months [22,23,24]. The species P. multistriata was found only in Šibenik Bay. Although it has previously been reported to occur in this area in all seasons [17], in the current study, it was isolated only during autumn and winter, similar to what was observed regarding the Northern Adriatic [23].
Based on molecular data, two pseudo-cryptic species from the Pseudo-nitzschia delicatissima complex were distinguished, namely, P. delicatissima and P. allochrona, which were well recognised in all the analyzed phylogenetic trees. The only morphological difference between these species was observed in the number of band striae, with 43–45 band striae in 10 µm for P. allochrona and 48–51 for P. delicatissima (Figure 13). This result aligns with the previous findings regarding P. allochrona, which has 43–46 band striae, being identified as P. cf. arenysensis [20]. Similarly, Percopo et al. [21] reported 46–50 band striae, while Giulietti et al. [24] identified P. cf. arenysensis with a broader range of band striae (42–52). A lower number of band striae for P. delicatissima was reported by Lundholm et al. [28], ranging from 43 to 48. In our study, a different seasonal distribution between these cryptic species was noted, as P. delicatissima was isolated in all seasons except summer, contrary to the case for P. allochrona, which was isolated only in summer and autumn. This is in line with previous research, as P. allochrona has been found in the Mediterranean Sea during summer and autumn [20,21,24]. Pseudo-cryptic species from the P. pseudodelicatissima complex were differentiated based on molecular data, namely, P. calliantha, P. mannii, P. hasleana, and P. pseudodelicatisisma. In accordance with Smodlaka Tanković et al.’s research [29], the native strains of P. pseudodelicatissima from this study showed no variation among nucleotides for the rbcL barcode compared with Northern Adriatic strains (sequence MW271781.1, GenBank accession number). Although Lim et al. [30] stated that the separation of P. cuspidata and P. pseudodelicatissima remains unresolved, our rbcL phylogenetic tree showed visible intraspecific variation among them with a pairwise distance of 0.0051. This small distance of 0.0051 suggests that, on average, there is a 0.51% difference in the genetic material of the two species compared. A pairwise distance this small indicates that these two species are quite closely related and that they may have diverged relatively recently.
Morphologically, the species in the P. pseudodelicatisisma complex differed the most in terms of the number of sectors within the poroids and the number of band striae. The number of sectors was the highest for P. calliantha, ranging from 2 to 11, followed by P. mannii, with 1 to 8 sectors, and P. pseudodelicatissima, with the lowest number of sectors, ranging from 1 to 4 (Figure 13). P. calliantha and P. mannii overlapped in terms of all other morphological features, while P. pseudodelicatisima differed in regard to its higher number of band interstriae. In comparison with the mentioned species, P. hasleana, (previously described by Arapov et al. [18]) showed a slightly lower number of fibulae and interstriae, and a number of sectors were in between P. calliantha and P. mannii. In general, the species P. pseudodelicatisisma, P. calliantha, and P. mannii correspond to their original morphological descriptions [26,31].
Phylogenetic trees inferred from BI analyses of ITS, LSU, and rbcL revealed that the strains from this study clustered in 10 supported clades, with a posterior probability >0.90 (i.e., P. allochrona, P. calliantha, P. delicatissima, P. fraudulenta, P. galaxiae, P. hasleana, P. mannii, P. multistriata, P. pseudodelicatissima, and P. subfraudulenta). The overall topology of the phylogenetic trees was comparable, regardless of the marker used. ITS was the most divergent and variable marker, similar to what Turk Dermastia et al. [23] found for ITS2. As reported by Amato et al. [31], ITS is technically problematic because it occurs in multiple repeats in the genome, which could be heterogenic.
The phylogenetic trees from this study were comparable with species Groups (I-IV) defined by Lim et al. [30]. Group I, found in the ITS tree, includes members of the P. pseudodelicatissima species complex, as well as P. fukuyoi, P. lundholmiae, and P. plurisecta. The LSU tree recovered Group I along with P. cuspidata, albeit with the absence of P. plurisecta. The rbcL tree did not include the mentioned species because they were not available in GenBank. Group III was well represented in all the phylogenetic trees with P. mannii, P. calliantha, and P. hasleana. Group IV was represented in all the observed genetic markers and included P. galaxiae, P. decipiens, P. simulans, P. allochrona, P. micropora, and P. delicatissima. In the ITS and rbcL, phylogenies intraspecific differentiation was observed between P. galaxiae strains isolated at different study locations; this result was possibly related to environmental factors. In the North Adriatic, Turk Dermastia et al. [23] reported genetic variations between P. galaxiae species isolated from the same net tow.
The basal clade of the ITS tree was the P. seriata group, and it included P. pungens, P. brasiliana, P. nanaoensis, P. americana, P. multiseries, P. australis, P. seriata, and P. multistriata. All of the mentioned species lack central nodules, and they clustered together in accordance with Lim et al.’s findings [30]. The species P. simulans was found in the P. delicatissima complex in the ITS and LSU phylogenies, even though it has one row of poroids (synamorphy), while the P. delicatissima complex species have two rows of poroids. This finding corresponds with Lim et al.’s research results [30]. Members of the Pseudo-nitzchia pseudodelicatissima complex were best recognised in the ITS phylogenetic tree, and this result is in accordance with Lim et al.’s findings [30]. The mentioned P. pseudodelicatissima complex included the following species: P. cuspidata, P. fukuyoi, P. pseudodelicatissima, P. plurisecta, and P. lundholmiae.
The species P. fraudulenta and P. subfraudulenta were recovered in the LSU phylogenies as part of the P. fraudulenta group with strong nodal support. However, genetic variation was present among the isolated P. fraudulenta strains only in the rbcL phylogenies, although the P. fraudulenta strains were obtained from the same study location.
All the phylogenetic trees are consistent with the available phylogenetic data based on Adriatic strains for Pseudo-nitzschia species [23,24] as well as with the most recent studies for non-Adriatic species [6,7].

4. Materials and Methods

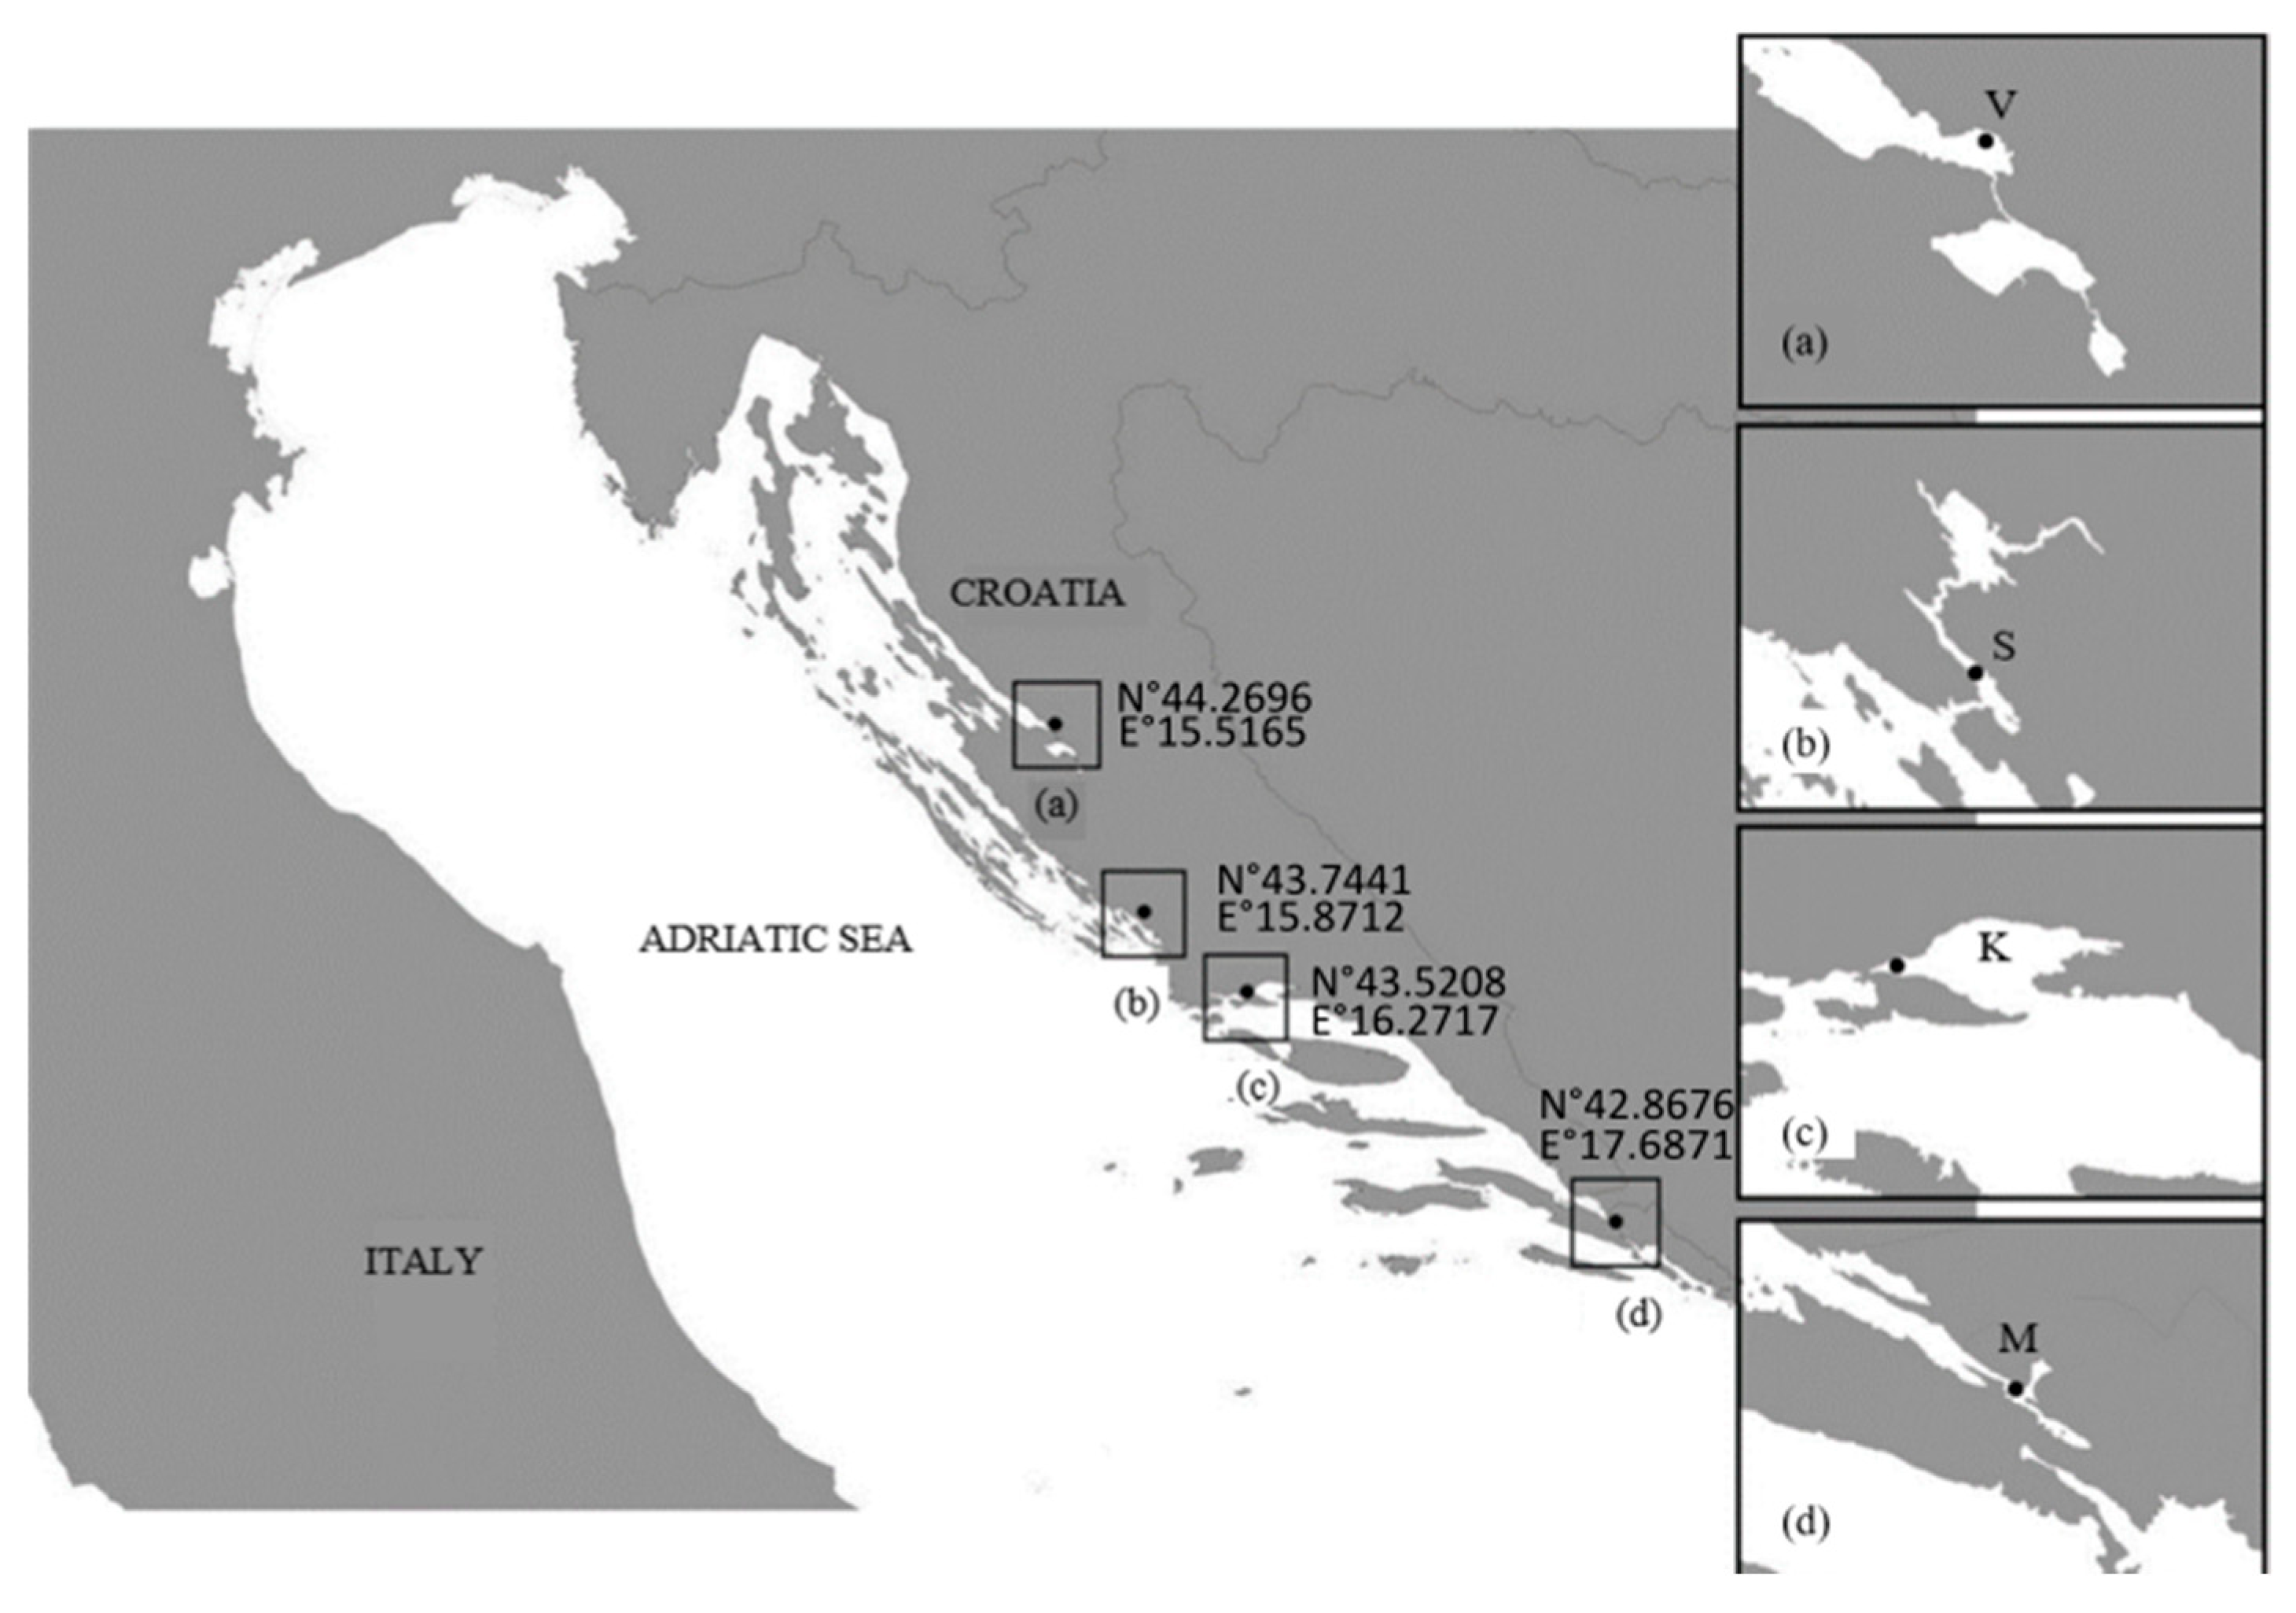
4.1. Study Area and Sampling

The study area included the coastal regions of the Central and Southeastern Adriatic Sea. The sampling stations were as follows: (a) Velebit Channel (V; 44.2696° N, 15.5165° E), (b) Šibenik Bay (S; 43.7441° N, 15.8712° E), (c) Kaštela Bay (K; 43.5208° N, 16.2717° E), and (d) Mali Ston Bay (M; 42.8676° N, 17.6871° E) (Figure 14). Preliminary sampling was conducted in 2020 and 2021, while monthly sampling began in February 2022 and continued until February 2024. Seasons were defined as follows: winter (January–April); spring (May–June); summer (July–October); and autumn (November–December) [32]. Samples were collected using a phytoplankton net with a mesh size of 20 μm. The plankton net was towed vertically at all study stations from 5 m to the surface, except in Šibenik Bay, where the net was towed from 7 m to the surface. Temperature and salinity were measured simultaneously using a YSI Pro 1030 probe at the surface and at depths of 5 m and 7 m, as reported in Supplementary Table S2. In cases of low surface salinity due to high input/discharge of the River Krka, cell isolation was performed using samples taken at a depth of 7 m via a Niskin water sampler.

4.2. Cell Isolation and Cultivation

Cell cultures were established by isolating a single cell or cell chain with a drawn glass micropipette from live plankton net samples as soon as possible after sampling for the following molecular and morphological analyses. Isolation was performed using Olympus IX51 (Olympus Corporation, Tokyo, Japan) and Leica DMI 4000B (Leica Microsystems CMS, Wetzlar, Germany) inverted light microscopes at magnifications of 100× or 200×. Afterward, isolated cells were transferred sequentially to a few drops of sterile culture medium and then a 48-well plate containing up to 1 mL of culture medium. The cell cultures were maintained within a temperature range of 14 °C to 20 °C ± 0.5 °C depending on environmental conditions. Isolated cells were exposed to a 12:12 light cycle at a light intensity of 108 μmol photons m−2 s−1. The culture medium consisted of sterile filtered seawater enriched with f/2 nutrients in addition to silicates [33]. The plates containing the isolated cells were examined for growth. Subsequently, the actively growing cells were transferred to flasks containing 35 mL of enriched f/2 medium. These flasks were then kept under the same conditions as previously described to ensure their continued growth and development. Samples for molecular and morphological analyses were obtained after sufficient density had been achieved, with a maximum generally being reached after 2 to 3 weeks. The collected strains were then processed for molecular and morphological analyses. For molecular analyses, culture volumes of 6–10 mL were collected and centrifuged at 4000× g rpm for 20 min. The supernatant was then removed, and the pellet was transferred to a 1.5 mL sterile microcentrifuge tube and centrifuged at 13,000× g rpm for 10 min. The samples were then frozen until analysis. Culture samples for morphological analyses were fixed with acidic Lugol’s iodine solution at an approximate concentration of 1.5% and stored in the dark at 4 °C until further analysis. To prepare acidic Lugol’s iodine solution, 100 g of potassium iodide (KI) was dissolved in 1 L of distilled water. Following this, 50 g of solid iodine (I2) was added and mixed until it fully dissolved in the mixture. Afterward, 100 g of glacial acetic acid (CH3COOH) was mixed thoroughly. If any iodine crystals remained undissolved, the solution was decanted.

4.3. Morphological Analyses

Isolated Pseudo-nitzschia cell cultures from the field samples were analysed using a field emission scanning electron microscope equipped with a retractable STEM detector (FE-SEM/STEM Mira3, Tescan, Brno, Czech Republic). Samples were prepared for SEM analyses according to the protocol reported by Hasle and Fryxell [34]. The samples were well mixed and transferred into a beaker. An equal amount of concentrated sulfuric acid (H2SO4) was added to a mixed Pseudo-nitzschia culture sample. The solution was gently mixed under a hood. The saturated solution was slowly added while mixing it until the solution turned purple, indicating the oxidation of organic matter. The saturated potassium permanganate solution was prepared by adding 7–8 g of potassium permanganate (KMnO4) into 100 mL of distilled water. Afterwards, saturated oxalic acid ((COOH)2) was added, mixing the solution after each addition, until the solution slowly became transparent. The concentration of saturated oxalic acid ((COOH)2) was prepared by adding 10 g of oxalic acid ((COOH)2) into 100 mL of distilled water. The sample was rinsed with deionised water through repeated centrifugation at 3000× g rpm for 20 min until the pH was close to neutral. Cleaned samples were filtered through polycarbonate filters with a pore size of 1 μm and a diameter of 13 mm and dried in a desiccator for at least 24 h (Nucleopore, Whatman, Maidstone, UK). Filters were then mounted on aluminium stubs, which were gold-coated using a sputter coater (Quorum Technologies, Q150RES, Lewes, UK) for scanning electron microscopy. SEM analyses were performed at an accelerating voltage of 4 kV and a working distance of 4 mm. Additionally, some cultures were analysed with a STEM detector at an accelerating voltage in the range of 7–9 kV and a working distance ranging from 3–6 mm, depending on the analysed species. For STEM analysis, 10–20 μL of cleaned culture sample was gently put on TEM mesh (FCF200-NI, 200 mesh, formvar/carbon coated nickel grid, Electron Microscopy Sciences, Hatfield, PA, USA). For morphological analyses, at least 10 cells were measured for each culture, accounting for width, length, number of fibulae and interstriae in 10 μm, number of poroids in 1 μm, rows of poroids, poroid sectors, and band striae in 10 μm.

4.4. DNA Extraction, PCR Amplification, and Sequencing

Total genomic DNA was extracted from cultures (app. volume 6–10 mL) in the exponential growth phase using the DNeasy Plant Mini Kit (Qiagen, Gilden, Germany) according to the manufacturer’s guidelines. The concentration of extracted DNA was measured with a NanoDrop spectrophotometer (Thermo Fisher). PCR amplification was performed using either recombinant Q5 Hot-Start High-Fidelity Master Mix (New England Biolabs, Ipswich, MA, USA) or Phire Tissue Direct PCR Master Mix (Thermo Scientific) in a total volume of 25 μL according to the manufacturer’s instructions. PCR reaction contained Master Mix, 0.02 μM of each primer, 1 ng/µL of genomic DNA template, and UltraPure DNase/RNase-Free Distilled Water (Invitrogen, Thermo Fisher Scientific, Waltham, MA, USA). DNA was amplified using a series of primers (details of PCR protocols are shown in Supplementary Table S3). To confirm the Pseudo-nitzschia species, three different regions were amplified: the entire internal transcribed spacer ITS (ITS1/5.8S/ITS2), the LSU region of the DNA (large subunit), and rbcL (ribulose-1,5-biphosphate carboxylase/oxidase). The PCR products were visualised under UV light using 1% agarose gel electrophoresis. Purification and Sanger sequencing of PCR products were performed by Macrogene Europe (Amsterdam, The Netherlands). For the ITS amplification, the forward and reverse primers combined were PSNF1 (5′GGATCATTACCACACCGATCC3′) and PSNR1 (5′CCTCTTGCTTGATCTGAGATCC3′) [35] and ITSA (5′CCAAGCTTCTAGATCGTAACAAGGTCCGTAGGT3′) combined with ITSB primer (5′CCTGCAGTCGACAATGCTTAATTCAGCGG3′) [36]. For LSU rDNA amplification, the primers used were D1R (5′ACCCGCTGAATTTAAGCATA3′) and D3B (5′TCGGAGGGAACCAGCTACTA3′) [37,38] as well as D1R (5′ACCCGCTGAATTTAAGCATA3′) [37] and D3Ca (ACGAACGATTTGCACGTCAG3′). The rbcL gene region was amplified using the primers rbcL1 (5′AAGGAGAAATHAATGTCT3′) and rbcL7 (5′AARCAACCTTGTGTAAGTCT3′) [39].

4.5. Sequence Analysis and Phylogeny

Chromatograms were assembled and quality-checked using Chromas Pro (v2.1.10.1). For molecular species identification, the ITS, LSU rDNA, and rbcL sequences were compared with Pseudo-nitzschia spp. sequences published in the National Center for Biotechnology Information (NCBI) nucleotide database using BLASTn (NCBI) [40]. A sequence is confirmed as corresponding to a species if the similarity percentage is over 99%. Gene markers (ITS, LSU, and rbcL) were analysed separately to obtain distinct phylogenies. Alignments were made using CLUSTALW (version 2.1) with MEGA11 (version 11.0.13) software using default settings [41,42]. The resulting ITS, LSU, and rbcL alignments had 738, 712, and 1365 nucleotides, respectively. We developed the evolutionary model of nucleotide substitution and calculated the shape parameters of the gamma distribution using Bayesian information criteria integrated in MEGA11 [41,42]. Bayesian Inference (BI) was made with a generalised time-reversible evolution model (GTR) with gamma distribution and invariant sites (G+I) for BI for all barcodes [43]. Pre-aligned FASTA file was used as input for Bayesian analyses, which were carried out using MrBayes 3.2.7 [44] with a minimum of 4,000,000 Markov chain Monte Carlo generations with a sample frequency of 1000 generations and diagnostic frequencies of 1000 until the average standard deviation fell between 0.01 and 0.05. Additionally, a combined phylogenetic tree was created using the ITS, LSU, and rbcL alignments, which were merged using R-Studio software (version 4.3.0) [45], version 4.3.0 with packages magrittr and dplyr from CRAN Repository (RStudio, PBC). The construction of BI for the combined phylogenetic tree was conducted with a GTR+G+I model with a minimum of 10,000,000 Markov chain Monte Carlo generations with a sample frequency of 1000 generations and diagnostic frequencies of 1000 until the standard deviation fell between 0.01 and 0.05. Outputs for ITS, LSU, rbcL, and combined phylogenetic tree were visualised using FigTree. The first 25% of samples from the cold chain were discarded by default. All posterior probabilities above 0.85 are shown. The genetic pair-wise values and overall pair-wise values were calculated in MEGA11 [41,42]. All downloaded sequences used in creating phylogenetic trees have GenBank accession numbers next to the species names. Nitzschia navis-varingica (GenBank accession number: KX353643.1) was used as the outgroup for conducting ITS phylogenies, while for LSU and rbcL, the outgroup used was Cylindrotheca sp. (GenBank accession numbers OM9360007.1 and M59080.1, respectively). The outgroup used in the analysis for the combined phylogenetic tree was Cylindrotheca closterium (GenBank accession number: NC_037986.1). The selected imported sequences for the combined phylogenetic tree were gathered from studies conducted in the same location and time period.

5. Conclusions

In conclusion, an approach combining molecular and morphological methods provides reliable and accurate insights into the composition of Pseudo-nitzschia species. Our results are especially significant as the reported areas are important aquaculture areas, and the findings will contribute substantially to the accurate identification of Pseudo-nitzschia species in these regions. However, we are aware that the analysis of cell cultures cannot give a complete insight into the native community of Pseudo-nitzschia diversity because of different shortcomings: the sampling method itself, the isolation of the cells, and the sensitivity of Pseudo-nitzschia species under the culture conditions. Nevertheless, the genetic characterisation analysis of cell cultures is crucial and very informative for the differentiation of cryptic and pseudo-cryptic species within the genus Pseudo-nitzschia. The findings of our study will make an important contribution to the development of the database for the discussed genetic sequences, especially for the rbcL marker. The establishment of sequence databases is necessary for the use of new methods, such as metabarcoding, and will serve our future phytoplankton biodiversity research.

Supplementary Materials

The following supporting information can be downloaded at https://www.mdpi.com/article/10.3390/plants14020245/s1. Table S1: List of Pseudo-nitzschia species based on location (V—Velebit Channel, S—Šibenik Bay, K—Kaštela Bay, and M—Mali Ston Bay), year of isolation, and accession numbers of ITS, LSU, and rbcL sequences deposited in GenBank. Table S2: Seasonal temperature and salinity range (min–max) measured during the study period at the studied areas: V—Velebit Channel, S—Šibenik Bay, K—Kaštela Bay, and M—Mali Ston Bay. Table S3: Set of primers used for amplification of ITS, LSU, and rbcL barcode according to specific PCR protocols.

Author Contributions

Data collection and analysis, T.B., T.T., M.M. and J.A.; manuscript writing, T.B., J.A. and S.S.; visualisation and figures, M.B. and B.M.R.; review and editing, I.B., I.L.P., A.P. and S.C.; supervision, Ž.N.G. All authors have read and agreed to the published version of the manuscript.

Funding

This research was funded by the Croatian Science Foundation, grant number UIP-2020-02-3249—Ecology and toxicity of the genus Pseudo-nitzschia in the coastal waters of the Central and Southern Adriatic Sea (PSEUDOTOX).

Data Availability Statement

Dataset can be made available by the authors upon request.

Acknowledgments

The authors wish to thank Ante Bilušić (Faculty of Science, Department of Physics, University of Split) for his technical assistance with gold coating the SEM samples. The authors would like to thank Heliodor Prelesnik, Nikša Nazlić, and Roman Garber for field sampling.

Conflicts of Interest

The authors declare no conflicts of interest.

References

  1. Lelong, A.L.; Hegaret, H.; Soudant, P.; Bates, S.S. Pseudo-nitzschia (Bacillariophyceae) species, domoic acid and amnesic shellfish poisoning: Revisiting previous paradigms. Phycologia 2012, 51, 168–216. [Google Scholar] [CrossRef]
  2. Trainer, V.L.; Bates, S.S.; Lundholm, N.; Thessen, A.E.; Cochlan, W.P.; Adams, N.G.; Trick, C.G. Pseudo-nitzschia physiological ecology, phylogeny, toxicity, monitoring and impacts on ecosystem health. Harmful Algae 2012, 14, 271–300. [Google Scholar] [CrossRef]
  3. Bates, S.S.; Garrison, D.L.; Horner, R.A. Bloom Dynamics and Physiology of Domoic Acid Producing Pseudo-nitzschia Species. In Physiological Ecology of Harmful Algal Blooms; Springer: Heidelberg, Germany, 1998; pp. 267–292. [Google Scholar]
  4. Dong, H.C.; Lundholm, N.; Teng, S.T.; Li, A.; Wang, C.; Hu, Y.; Li, Y. Occurrence of Pseudo-nitzschia species and associated domoic acid production along the Guangdong coast, South China Sea. Harmful Algae 2020, 98, 101899. [Google Scholar] [CrossRef]
  5. Lundholm, N. Bacillariophyta, in IOC-UNESCO Taxonomic Reference List of Harmful Micro Algae. Available online: https://www.marinespecies.org/hab (accessed on 19 September 2024).
  6. Lundholm, N.; Christensen, A.L.; Olesen, A.K.J.; Beszteri, B.; Eggers, S.L.; Krock, B.; Altenburger, A. Diversity, toxicity, and distribution of potentially toxic diatoms in Antarctic waters––With description of Pseudo-nitzschia meridionalis sp. nov. and P. glacialis sp. nov. Harmful Algae 2024, 139, 102724. [Google Scholar] [CrossRef]
  7. von Dassow, P.; Mikhno, M.; Percopo, I.; Orellana, V.R.; Aguilera, V.; Álvarez, G.; Araya, M.; Cornejo-Guzmán, S.; Llona, T.; Mardones, J.I.; et al. Diversity and toxicity of the planktonic diatom genus Pseudo-nitzschia from coastal and offshore waters of the Southeast Pacific, including Pseudo-nitzschia dampieri sp. nov. Harmful Algae 2023, 130, 102520. [Google Scholar] [CrossRef]
  8. Guiry, M.D.; Guiry, G.M. AlgaeBase. World-Wide Electronic Publication, University of Galway. Available online: https://www.algaebase.org (accessed on 15 September 2024).
  9. Niu, B.; Pang, J.; Lundholm, N.; Liang, C.; Teng, S.T.; Zheng, Q.; Guo, X.; Li, Y. A Pseudo-nitzschia metabarcoding approach with a calibrated ITS1 reference sequence database applied in the Taiwan Strait. Harmful Algae 2024, 133, 102602. [Google Scholar] [CrossRef]
  10. Amato, A.; Kooistra, W.H.C.F.; Levialdi Ghiron, J.H.; Mann, D.G.; Pröschold, T.; Montresor, M. Reproductive Isolation among Sympatric Cryptic Species in Marine Diatoms. Protist 2007, 158, 193–207. [Google Scholar] [CrossRef]
  11. Amato, A.; Kooistra, W.H.C.F.; Montresor, M. Cryptic Diversity: A Long-lasting Issue for Diatomologists. Protist 2019, 170, 1–7. [Google Scholar] [CrossRef]
  12. Bates, S.S.; Hubbard, K.A.; Lundholm, N.; Montresor, M.; Leaw, C.P. Pseudo-nitzschia, Nitzschia, and domoic acid: New research since 2011. Harmful Algae 2018, 79, 3–43. [Google Scholar] [CrossRef]
  13. Burić, Z.; Viličić, D.; Mihalić, K.C.; Carić, M.; Kralj, K.; Ljubešić, N. Pseudo-nitzschia blooms in the Zrmanja river estuary (Eastern Adriatic sea). Diatom Res. 2008, 23, 51–63. [Google Scholar] [CrossRef]
  14. Ljubešić, Z.; Bosak, S.; Viličić, D.; Borojević, K.K.; Marić, D.; Godrijan, J.; Ujević, I.; Peharec, P.; Dakovac, T. Ecology and taxonomy of potentially toxic Pseudo-nitzschia species in Lim Bay (north-eastern Adriatic Sea). Harmful Algae 2011, 10, 713–722. [Google Scholar] [CrossRef]
  15. Arapov, J.; Ujević, I.; Pfannkuchen, D.M.; Godrijan, J.; Bakrač, A.; Ninčević Gladan, Ž.; Marasović, I. Domoic acid in phytoplankton net samples and shellfish from the Krka River estuary in the central Adriatic Sea. Mediterr. Mar. Sci. 2016, 17, 340–350. [Google Scholar] [CrossRef]
  16. Arapov, J.; Skejić, S.; Bužančić, M.; Bakrač, A.; Vidjak, O.; Bojanić, N.; Ujević, I.; Ninčević Gladan, Ž. Taxonomical diversity of Pseudo-nitzschia from the Central Adriatic Sea. Phycol. Res. 2017, 65, 280–290. [Google Scholar] [CrossRef]
  17. Arapov, J.; Bužančić, M.; Skejić, S.; Mandić, J.; Bakrač, A.; Straka, M.; Ninčević Gladan, Ž. Phytoplankton dynamics in the middle Adriatic estuary, with a focus on the potentially toxic genus Pseudo-nitzschia. J. Mar. Sci. Eng. 2020, 8, 608. [Google Scholar] [CrossRef]
  18. Arapov, J.; Tomašević, T.; Bonačić, T.; Pejković, M.; Bužančić, M.; Bušelić, I.; Lepen Pleić, I.; Casabianca, S.; Penna, A.; Skejić, S.; et al. A New Insight into the Taxonomy of Pseudo-nitzschia Genus from the Adriatic Sea: Description of P. brasiliana, P. galaxiae, P. hasleana, and P. Linea. J. Mar. Sci. Eng. 2023, 11, 1370. [Google Scholar] [CrossRef]
  19. Grbin, D.; Pfannkuchen, M.; Babić, I.; Mejdandžić, M.; Mihanović, H.; Marić Pfannkuchen, D.; Godrijan, J.; Peharec Štefanić, P.; Olujić, G.; Ljubešić, Z. Multigene phylogeny and morphology of newly isolated strain of Pseudo-nitzschia mannii Amato & Montresor (Adriatic Sea). Diatom Res. 2017, 32, 127–131. [Google Scholar] [CrossRef]
  20. Arapov, J.; Bužančić, M.; Penna, A.; Casabianca, S.; Capellacci, S.; Andreoni, F.; Skejić, S.; Bakrač, A.; Straka, M.; Mandić, J.; et al. High proliferation of Pseudo-nitzschia cf. arenysensis in the Adriatic Sea: Ecological and morphological characterisation. Mediterr. Mar. Sci. 2020, 21, 759–774. [Google Scholar] [CrossRef]
  21. Percopo, I.; Ruggiero, M.V.; Sarno, D.; Longobardi, L.; Rossi, R.; Piredda, R.; Zingone, A. Phenological segregation suggests speciation by time in the planktonic diatom Pseudo-nitzschia allochrona sp. nov. Ecol. Evol. 2022, 12, e9155. [Google Scholar] [CrossRef]
  22. Marić Pfannkuchen, D. Potentially Toxic Diatom Genus Pseudo-nitzschia in the Northern Adriatic Sea: Ecological, taxonomic and Molecular featurs. Ph.D. Thesis, University of Zagreb, Zagreb, Croatia, 2013. [Google Scholar]
  23. Turk Dermastia, T.; Cerino, F.; Stanković, D.; Francé, J.; Ramšak, A.; Žnidarič Tušek, M.; Beran, A.; Natali, V.; Cabrini, M.; Mozetič, P. Ecological time series and integrative taxonomy unveil seasonality and diversity of the toxic diatom Pseudo-nitzschia H. Peragallo in the northern Adriatic Sea. Harmful Algae 2020, 93, 101773. [Google Scholar] [CrossRef]
  24. Giulietti, S.; Romagnoli, T.; Siracusa, M.; Bacchiocchi, S.; Totti, C.; Accoroni, S. Integrative taxonomy of the Pseudo-nitzschia (Bacillariophyceae) populations in the NW Adriatic Sea, with a focus on a novel cryptic species in the P. delicatissima species complex. Phycologia 2021, 60, 247–264. [Google Scholar] [CrossRef]
  25. Ujević, I.; Ninčević Gladan, Ž.; Roje, R.; Skejić, S.; Arapov, J.; Marasović, I. Domoic acid-A new toxin in the Croatian adriatic shellfish toxin profile. Molecules 2010, 15, 6835–6849. [Google Scholar] [CrossRef] [PubMed]
  26. Lundholm, N.; Moestrup, Ø.; Hasle, G.R.; Hoef-Emden, K. A study of the Pseudo-nitzschia pseudodelicatissima/cuspidata complex (Bacillariophyceae): What is P. pseudodelicatissima? J. Phycol. 2003, 39, 797–813. [Google Scholar] [CrossRef]
  27. Penna, A.; Casabianca, S.; Perini, F.; Bastianini, M.; Riccardi, E.; Pigozzi, S.; Scardi, M. Toxic Pseudo-nitzschia spp. in the northwestern Adriatic Sea: Characterization of species composition by genetic and molecular quantitative analyses. J. Plankton Res. 2013, 35, 352–366. [Google Scholar] [CrossRef]
  28. Lundholm, N.; Moestrup, Ø.; Kotaki, Y.; Hoef-Emden, K.; Scholin, C.; Miller, P. Inter- and intraspecific variation of the Pseudo-nitzschia delicatissima complex (Bacillariophyceae) illustrated by rRNA probes, morphological data and phylogenetic analyses. J. Phycol. 2006, 42, 464–481. [Google Scholar] [CrossRef]
  29. Smodlaka Tanković, M.; Baričević, A.; Gerić, M.; Domijan, A.M.; Pfannkuchen, D.M.; Kužat, N.; Ujević, I.; Kuralić, M.; Rožman, M.; Matković, K.; et al. Characterisation and toxicological activity of three different Pseudo-nitzschia species from the northern Adriatic Sea (Croatia). Environ. Res. 2022, 214, 114108. [Google Scholar] [CrossRef]
  30. Lim, H.C.; Tan, S.N.; Teng, S.T.; Lundholm, N.; Orive, E.; David, H.; Quijano-Scheggia, S.; Leong, S.C.Y.; Wolf, M.; Bates, S.S.; et al. Phylogeny and species delineation in the marine diatom Pseudo-nitzschia (Bacillariophyta) using cox1, LSU, and ITS2 rRNA genes: A perspective in character evolution. J. Phycol. 2018, 54, 234–248. [Google Scholar] [CrossRef]
  31. Amato, A.; Orsini, L.; D’Alelio, D.; Montresor, M. Life cycle, size reduction patterns, and ultrastructure of the pennate planktonic diatom Pseudo-nitzschia delicatissima (Bacillariophyceae). J. Phycol. 2005, 41, 542–556. [Google Scholar] [CrossRef]
  32. Artegiani, A.; Bregant, D.; Paschini, E.; Pinardi, N.; Raicich, F.; Russo, A. The Adriatic Sea General Circulation. Part I: Air-Sea Interactions and Water Mass Structure. J. Phys. Oceanogr. 1996, 27, 1492–1513. [Google Scholar] [CrossRef]
  33. Andersen, R.A. Algal Culturing Techniques; Elsevier Academic Press, Phycological Society of America: Amsterdam, The Netherlands, 2005. [Google Scholar]
  34. Hasle, G.R.; Fryxell, G.A. Diatoms: Cleaning and Mounting for Light and Electron Microscopy. Trans. Am. Microsc. Soc. 1970, 89, 469–474. [Google Scholar] [CrossRef]
  35. Noyer, C.; Abot, A.; Trouilh, L.; Le Berre, V.; Dreanno Phytochip, C.; Anton Leberre, V.; Dreanno, C. Phytochip: Development of a DNA-microarray for rapid and accurate identification of Pseudo-nitzschia spp and other harmful algal species. J. Microbiol. Methods 2015, 112, 55–66. [Google Scholar] [CrossRef]
  36. Adachi, M.; Sako, Y.; Ishida, Y. Restriction fragment length polymorphism of ribosomal DNA internal transcribed spacer and 5.8s regions in Japanese Alexandrium species (Dinophyceae). J. Phycol. 1994, 30, 857–863. [Google Scholar] [CrossRef]
  37. Scholin, C.A.; Villac, M.C.; Buck, K.R.; Krupp, J.M.; Powers, D.A.; Fryxell, G.A.; Chavez, F.P. Ribosomal DNA Sequences Discriminate Among Toxic and Non-Toxic Pseudonitzschia Species. Nat. Toxins 1994, 2, 152–165. [Google Scholar] [CrossRef] [PubMed]
  38. Nunn, G.B.; Theisen, B.F.; Christensen, B.; Arctander, P. Simplicity-Correlated Size Growth of the Nuclear 28S Ribosomal RNA D3 Expansion Segment in the Crustacean Order Isopoda. J. Mol. Evol. 1996, 42, 211–223. [Google Scholar] [CrossRef] [PubMed]
  39. Jones, H.M.; Simpson, G.E.; Stickle, A.J.; Mann, D.G. Life history and systematics of Petroneis (Bacillariophyta), with special reference to British waters. Eur. J. Phycol. 2005, 40, 61–87. [Google Scholar] [CrossRef]
  40. Altschul, S.F.; Gish, W.; Miller, W.; Myers, E.W.; Lipman, D.J. Basic local alignment search tool. J. Mol. Biol. 1990, 215, 403–410. [Google Scholar] [CrossRef]
  41. Masatoshi, N.; Sudhir, K. Molecular Evolution and Phylogenetics; Oxford, University Press: Oxford, UK, 2000. [Google Scholar]
  42. Tamura, K.; Stecher, G.; Kumar, S. MEGA11: Molecular Evolutionary Genetics Analysis Version 11. Mol. Biol. Evol. 2021, 38, 3022–3027. [Google Scholar] [CrossRef]
  43. Yang, Z. Maximum likelihood phylogenetic estimation from DNA sequences with variable rates over sites: Approximate methods. J. Mol. Evol. 1994, 39, 306–314. [Google Scholar] [CrossRef]
  44. Ronquist, F.; Teslenko, M.; Van Der Mark, P.; Ayres, D.L.; Darling, A.; Höhna, S.; Larget, B.; Liu, L.; Suchard, M.A.; Huelsenbeck, J.P. Mrbayes 3.2: Efficient Bayesian phylogenetic inference and model choice across a large model space. Syst. Biol. 2012, 61, 539–542. [Google Scholar] [CrossRef]
  45. Gelfond, J.; Goros, M.; Hernandez, B.; Bokov, A. A System for an Accountable Data Analysis Process in R. R J. 2018, 10, 6–21. [Google Scholar] [CrossRef]
Figure 1. Micrographs of Pseudo-nitzschia allochrona: (a) colony in girdle view, LM; (b) whole valve, SEM; (c) central part of the valve face with central nodule, SEM; (d,e) valve ends, SEM; (f) girdle band with rows of perforations, SEM. Scale bars: (a,b) 5 µm; (cf) 500 nm.
Plants 14 00245 g001
Figure 2. Micrographs of Pseudo-nitzschia calliantha: (a) whole valve, SEM; (b) colony in girdle view, LM; (c) central part of the valve face with central nodule, SEM; (d) central part of the valve face with central nodule, STEM; (e) poroid structure with sector detail, SEM; (f) poroid structure with sector detail, STEM; (g,h) valve ends, SEM; (i) valve end, STEM; (j) girdle band with rows of perforations, SEM; (k) girdle band with rows of perforations, STEM. Scale bars: (a,b) 10 µm; (gi) 1 µm; (cf,j,k) 500 nm.
Plants 14 00245 g002
Figure 3. Micrographs of Pseudo-nitzschia delicatissima: (ac) whole valve, SEM; (d) central part of the valve face with central nodule, SEM; (e) central part of the valve face with central nodule, STEM; (f,g) valve ends, SEM; (h) girdle band with rows of perforations, SEM; (i) girdle band with rows of perforations, STEM. Scale bars: (a) 10 µm; (b,c) 5 µm; (di) 1 µm.
Plants 14 00245 g003
Figure 4. Micrographs of Pseudo-nitzschia fraudulenta: (a) whole valve, SEM; (b) central part of the valve face with central nodule, SEM; (c) poroid structure with sector detail, SEM; (d) girdle band with rows of perforations, SEM; (e,f) valve ends, SEM. Scale bars: (a) 10 µm; (b) 2 µm; (c,e,f) 1 µm; (d) 500 nm.
Plants 14 00245 g004
Figure 5. Micrographs of Pseudo-nitzschia mannii: (a) whole valve, SEM; (b) colony in girdle view, LM; (c) central part of the valve face with central nodule, SEM; (d) central part of the valve face with central nodule, STEM; (e) poroid structure with sector detail, SEM; (f) poroid structure with sector detail, STEM; (g,h) valve ends, SEM; (i) girdle band with rows of perforations, SEM; (j) girdle band with rows of perforations STEM. Scale bars: (a,b) 10 µm; (c,d) 1 µm; (gi) 1 µm; (e,f,j) 500 nm.
Plants 14 00245 g005
Figure 6. Micrographs of Pseudo-nitzschia multistriata: (a) whole valve, SEM; (b) colony in girdle view, LM; (c) central part of the valve face without central nodule, SEM; (d) central part of the valve face without central nodule, STEM; (e,f) valve ends, SEM; (g) girdle band with rows of perforations, SEM; (h) girdle band with rows of perforations, STEM; (i,j) valve ends, STEM. Scale bars: (a,b) 10 µm; (e,f,i,j) 1 µm; (c,d,g,h) 500 nm.
Plants 14 00245 g006
Figure 7. Micrographs of Pseudo-nitzschia pseudodelicatissima: (a) whole valve, SEM; (b) central part of the valve face with central nodule, SEM; (c) central part of the valve face with central nodule, STEM; (d,e) valve ends, SEM; (f) girdle band with rows of perforations, SEM; (g) girdle band with rows of perforations, STEM. Scale bars: (a) 10 µm; (d,e) 1 µm; (b,c,f,g) 500 nm.
Plants 14 00245 g007
Figure 8. Micrographs of Pseudo-nitzschia subfraudulenta: (a) whole valve, SEM; (b) colony in girdle view, LM; (c) central part of the valve face with central nodule, SEM; (d) central part of the valve face with central nodule, STEM; (e) detail of the valve striae with one row of pores, SEM; (f) poroid structure with sector detail, SEM; (g) poroid structure with sector detail, STEM; (h) girdle band with rows of perforations, SEM; (i,j) valve ends, SEM; (k) girdle band with rows of perforations, STEM. Scale bars: (a,b) 10 µm; (ce,i,j) 1 µm; (fh,k) 500 nm.
Plants 14 00245 g008
Figure 9. Phylogenetic tree reconstruction created using Bayesian tree based on ITS marker GTR+G+I; ngen = 5,000,000 Monte Carlo Markov Chain generations. Bayesian inference (BI) posterior probabilities (PP) > 0.90 are shown. Isolates sequenced in this study are presented in red. The scale bar represents 0.2 substitutions per site.
Plants 14 00245 g009
Figure 10. Phylogenetic tree reconstruction created using Bayesian tree based on LSU sequences GTR+G+I; ngen = 4,000,000 Monte Carlo Markov Chain generations. Bayesian inference (BI) posterior probabilities (PP) > 0.90 are shown. Isolates sequenced in this study are presented in red. The scale bar represents 0.01 substitutions per site.
Plants 14 00245 g010
Figure 11. Phylogenetic tree reconstruction using Bayesian tree based on rbcL sequences GTR+G+I; ngen = 4,000,000 Monte Carlo Markov Chain generations. Bayesian inference (BI) posterior probabilities (PP) > 0.90 are shown. Isolates sequenced in this study are presented in red. The scale bar represents 0.02 substitutions per site.
Plants 14 00245 g011
Figure 12. Combined phylogenetic tree reconstruction using Bayesian tree based on ITS, LSU, and rbcL marker GTR+G+I; ngen = 10,000,000 Monte Carlo Markov Chain generations. Bayesian inference (BI) posterior probabilities (PP) > 0.90 are shown. Isolates sequenced in this study are presented in red. The scale bar represents 1.0 substituions per site.
Plants 14 00245 g012
Figure 13. Morphometric data regarding observed Pseudo-nitzschia species: (a) length; (b) width; (c) number of fibulae in 10 µm; (d) number of interstriae in 10 µm; (e) number of poroids in 1 µm; (f) number of sectors within poroids; and (g) number of band interstriae in 10 µm.
Plants 14 00245 g013
Figure 14. The study stations: (a) V—Velebit Channel, (b) S—Šibenik Bay, (c) K—Kaštela Bay, (d) and M—Mali Ston Bay.
Plants 14 00245 g014
Table 1. List of species identified with the corresponding information about the isolation location, season (SP: spring, SU: summer, A: autumn, and W: winter), and species confirmation method.
SpeciesNumber of CulturesLocationSeasonMethods
P. allochrona14K, M, SA, SUITS, LSU, rbcL, SEM
P. calliantha24All locationsA, W, SUITS, LSU, rbcL, SEM/STEM
P. delicatissima47K, M, VA, W, SPITS, LSU, rbcL, SEM/STEM
P. fraudulenta6KA, WITS, LSU, rbcL, SEM
P. mannii51All locationsAll seasonsITS, LSU, rbcL, SEM/STEM
P. multistriata7SAITS, LSU, rbcL, SEM/STEM
P. pseudodelicatissima16KA, W, SUITS, LSU, rbcL, SEM/STEM
P. subfraudulenta6S, VA, SUITS, LSU, rbcL, SEM/STEM
Table 2. Morphometric measurements made for Pseudo-nitzschia species. Data are given as minimum and maximum ranges in bold, with average values ± standard deviation specified below. The number of measurements (n) and analysed strains are specified in parentheses.
SpeciesWidth (µm)Length (µm)Central InterspaceFibulae in 10 µmInterstriae in 10 µmPoroids in 1 µmRows of PoroidsPoroid SectorsBand Striae in 10 µm
P. allochrona
(n = 50; 5)
1.44–2.15
1.72 ± 0.18
51.06–63.01
58.12 ± 3.58
+
20–24
21.6 ± 0.9
36–39
37.1 ± 0.8
7–13(1)-2-
43–45
43.9 ± 0.7
P. calliantha
(n = 97; 9)
1.38–2.12
1.75 ± 0.17
64.08–107.14
83.53 ± 12.11
+
17–22
19.6 ± 1.1
34–38
36.2 ± 0.8
4–612–11 *
6
43–46
44.5 ± 0.8
P. delicatissima
(n = 126; 12)
1.31–2.00
1.64 ± 0.15
31.05–94.21
57.43 ± 17.00
+
20–26
23.3 ± 1.2
37–42
40.4 ± 0.7
7–13(1)-2-
48–51
49.6 ± 0.6
P. fraudulenta
(n = 56; 5)
5.09–6.54
5.79 ± 0.37
60.22–67.42
65.04 ± 1.45
+
19–24
22.7 ± 0.9
23–25
23.8 ± 0.6
5–7(1)-2-(3)2–7 *
5
38–41
39.5 ± 0.6
P. mannii
(n = 148; 14)
1.71–2.48
2.05 ± 0.16
69.08–123.56
93.37 ± 13.37
+
16–23
19.7 ± 1.2
33–37
35.3 ± 0.7
4–611–8 *
4
42–44
43.2 ± 0.6
P. multistriata
(n = 62; 6)
2.33–3.51
2.91 ± 0.30
55.85–84.85
68.07 ± 7.94
-23–26
24.3 ± 0.8
36–40
38.4 ± 0.9
9–12(1)-2-
47–51
49.9 ± 0.9
P. pseudodelicatissima
(n = 84; 8)
1.22–1.75
1.48 ± 0.12
59.14–90.99
72.76 ± 11.06
+
19–26
22.3 ± 1.2
38–41
39.3 ± 0.7
5–711–4 *
2
47–52
49.6 ± 1.0
P. subfraudulenta
(n = 60; 5)
4.15–5.25
4.69 ± 0.22
96.19–140.33
118.42 ± 15.98
+
13–17
14.8 ± 0.9
23–25
24.6 ± 0.5
5–6(1)-22–10 *
5
39–41
40.1 ± 0.6
* The number of measurements for poroid sectors are as follows: P. calliantha n = 2638, P. fraudulenta n = 507, P. mannii n = 4103, P. pseudodelicatissima n = 1347, and P. subfraudulenta n = 1416.
Disclaimer/Publisher’s Note: The statements, opinions and data contained in all publications are solely those of the individual author(s) and contributor(s) and not of MDPI and/or the editor(s). MDPI and/or the editor(s) disclaim responsibility for any injury to people or property resulting from any ideas, methods, instructions or products referred to in the content.

