Article

Transcriptome Profiling of Spike Development Reveals Key Genes and Pathways Associated with Early Heading in Wheat–Psathyrstachys huashanica 7Ns Chromosome Addition Line

1
State Key Laboratory of Crop Gene Exploration and Utilization in Southwest China, Sichuan Agricultural University, Chengdu 611130, China
2
Triticeae Research Institute, Sichuan Agricultural University, Chengdu 611130, China
3
College of Resources, Sichuan Agricultural University, Chengdu 611130, China
4
College of Grassland Science and Technology, Sichuan Agricultural University, Chengdu 611130, China
5
College of Agronomy and Biotechnology, Yunnan Agricultural University, Kunming 650201, China
*
Authors to whom correspondence should be addressed.
These authors contributed equally to this work.
Plants 2025, 14(13), 2077; https://doi.org/10.3390/plants14132077
Submission received: 20 May 2025 / Revised: 19 June 2025 / Accepted: 4 July 2025 / Published: 7 July 2025
(This article belongs to the Special Issue Biosystematics and Breeding Application in Triticeae Species)

Abstract

Developing early-heading wheat cultivars is an important breeding strategy to utilize light and heat resources, facilitate multiple-cropping systems, and enhance annual grain yield. Psathyrostachys huashanica Keng (2n = 2x = 14, NsNs) possesses numerous agronomically beneficial traits for wheat improvement, such as early maturity and resistance to biotic and abiotic stresses. In this study, we found that a cytogenetically stable wheat–P. huashanica 7Ns disomic addition line showed (9–11 days) earlier heading and (8–10 days) earlier maturation than its wheat parents. Morphological observations of spike differentiation revealed that the 7Ns disomic addition line developed distinctly faster than its wheat parents from the double ridge stage. To explore the potential molecular mechanisms underlying the early heading, we performed transcriptome analysis at four different developmental stages of the 7Ns disomic addition line and its wheat parents. A total of 10,043 differentially expressed genes (DEGs) were identified during spike development. Gene Ontology (GO) enrichment analysis showed that these DEGs were linked to the carbohydrate metabolic process, photosynthesis, response to abscisic acid, and the ethylene-activated signaling pathway. Kyoto Encyclopedia of Genes and Genomes (KEGG) enrichment analysis showed that these DEGs were involved in plant hormone signal transduction (ARF, AUX/IAA, SAUR, DELLA, BRI1, and ETR), starch and sucrose metabolism (SUS1 and TPP), photosynthetic antenna proteins (Lhc), and circadian rhythm (PRR37, FT, Hd3a, COL, and CDF) pathways. In addition, several DEGs annotated as transcription factors (TFs), such as bHLH, bZIP, MADS-box, MYB, NAC, SBP, WRKY, and NF-Y, may be related to flowering time. Our findings reveal spike development-specific gene expression and critical regulatory pathways associated with early heading in the wheat–P. huashanica 7Ns addition line, and provide a new genetic resource for further dissection of the molecular mechanisms underlying the heading date in wheat.

Graphical Abstract

1. Introduction

Wheat (Triticum aestivum L., 2n = 6x = 42, AABBDD) is a staple food crop widely cultivated worldwide and provides approximately 20% of the calories consumed by human beings and livestock [1]. Wheat heading time, representing the initiation of flowering time, is an important agronomic trait related to ecological adaptability, maturity, yield, and stress resistance. Early maturity is essential to reduce potential yield losses caused by several negative factors, such as frost, heat, disease, pre-harvest sprouting, and terminal drought stress [2,3]. More importantly, it is beneficial for promoting wheat–rice or wheat–maize rotations in Southwest China. Therefore, the development of early-heading wheat lines and studies on their related candidate genes or pathways are crucial to maximize the whole-year crop yield potential.
Heading time in wheat, a complex polygenic trait, is mainly influenced by vernalization (VRN), photoperiod (PPD), and earliness per se (Eps) [4]. Vernalization is primarily controlled by VRN1, VRN2, and VRN3 [5]. VRN1, an APETALA1 (AP1)-like MADS-box transcription factor, is the central regulator that can interact with TaVRT2, an SVP-like gene, to regulate vernalization-induced flowering [6,7]. VRN2 acts as a flowering repressor and is downregulated by vernalization and short-day (SD) treatment [8,9]. VRN3, a homologous gene of the Arabidopsis FLOWERING LOCUS T (FT), moves from the leaf to the apical meristem to induce flowering [5]. PPD1, a pseudo-response regulator (PRR) gene that controls photoperiod-dependent floral induction, affects inflorescence architecture and paired spikelet formation by modulating the FT expression [10,11]. When the vernalization and photoperiod requirements are fully satisfied, flowering time is mainly determined by Eps genes, which are independent of environmental cues [12]. To date, only a few of the underlying Eps genes have been identified [4,13], but their molecular mechanisms regulating heading time are poorly understood. Additionally, several phytohormones, such as gibberellin (GA), abscisic acid (ABA), brassinosteroid (BR), auxin (IAA), methyl jasmonate (MeJA), and ethylene, also play important roles in fine-tuning the timing of flowering [14,15,16]. Among them, GA plays a major role in affecting flowering time [17]. DELLA proteins, key components in the GA signaling pathway, physically interact with the flowering activator CONSTANS (CO) to regulate flowering under long day (LD) conditions in Arabidopsis [18]. GA promotes the transcription of the MADS-box gene SUPPRESSOR OF OVEREXPRESSION OF CO1 (SOC1) to accelerate flowering in Arabidopsis [19]. Both VRN1 and GA are required in the wheat shoot apical meristem for the acceleration of spike development under SD conditions [20]. Factors contributing to early wheat maturation include the following: (1) accelerated floral transition, characterized by premature conversion of the shoot apical meristem into the spike meristem; (2) expedited spike development with a rapid progression from primordium formation to mature spike; (3) shortened pre-heading phase between spike formation and ear emergence; (4) reduced heading–anthesis interval; and (5) abbreviated grain-filling period from anthesis to physiological maturity. Crucially, accelerated spike development and early phase transitions represent the core physiological determinants of this process [21,22].
Spike development is pivotal for floral organ formation and flower induction in cereals. In recent years, RNA-seq has been extensively employed to investigate the molecular mechanisms regulating flowering time driven by spike development. For instance, Digel et al. [23] performed a transcriptome analysis using developing leaf and shoot apices to reveal the distinct genetic and environmental control of floral transition and inflorescence development in barley. Through transcriptome analysis of early spike development in wheat, Li et al. [24] identified 375 transcription factor genes that are involved in flowering time regulation, meristem initiation or transition, and floral organ development. Liu et al. [25] profiled transcriptomes at three developmental stages of the barley main shoot apex to uncover phase-specific gene expression related to barley inflorescence and identify novel candidate genes that regulate meristem activities and flower development. Transcriptome analysis during the double ridge and androgynous primordium differentiation stages of the wheat leaf and apical meristem revealed many DEGs associated with wheat heading date and identified a potential candidate gene influencing flowering time [26]. Additionally, VanGessel et al. [27] utilized a wheat spike transcriptome dataset to reveal dynamic expression profiles linked to the progression from vegetative meristem formation to terminal spikelet establishment, highlighting potential roles for TtCLE13, TtWOX2, and TtWOX7 in wheat meristem development. Benaouda et al. [28] discovered that the wheat orthologous transcription factor AS1 could induce flowering time in response to GA biosynthesis via transcriptome analysis of the wheat shoot apical meristem and leaf tissue. Gauley et al. [29] performed a transcriptome analysis of wheat developing inflorescence and identified bZIP and ALOG transcription factors, namely PDB1 and ALOG1, which influence flowering time and spikelet architecture.
As an important tertiary gene pool of wheat genetic improvement, Psathyrostachys huashanica Keng ex P. C. Kuo (2n = 2x = 14, NsNs) harbors numerous agronomically beneficial traits, such as early maturity and resistance to biotic and abiotic stresses [30,31]. At present, a large number of genes of interest from P. huashanica have been successfully introgressed into common wheat through the generation of a series of wheat–P. huashanica derived lines [32,33,34]. Previously, we developed and characterized a wheat–P. huashanica 7Ns disomic chromosome addition line 18-1-5 with powdery mildew resistance [35]. In the current study, we investigated the heading and maturity times of 18-1-5 and its wheat parents, Chinese Spring (CS) and CSph2b, under field conditions. Anatomical observation of young spikes was performed to further characterize their phenotypic differences. Moreover, comparative transcriptome analysis between 18-1-5 and its wheat parents was conducted across four different spike development stages to explore the molecular mechanisms underlying accelerated spike development in 18-1-5. Our data provide new insights into the genetic regulatory mechanism of wheat heading time and offer genetic resources for early-maturing wheat breeding.

2. Results

2.1. Cytological Identification of Wheat–P. huashanica 7Ns Addition Line

To assess the cytogenetic stability of the wheat–P. huashanica 7Ns disomic addition line 18-1-5, genomic in situ hybridization (GISH) and fluorescence in situ hybridization (FISH) techniques were employed to characterize 80 randomly selected individual plants from the selfed progeny of 18-1-5. GISH analysis revealed that all examined plants carried 42 chromosomes with blue 4,6-diamidino-2-phenylindole (DAPI) signals and two chromosomes with strong red fluorescent signals that were Ns chromosomes of P. huashanica (Figure 1a). FISH analysis using the probes Oligo-pSc119.2 and Oligo-pTa535 demonstrated that all plants contained 21 pairs of intact wheat chromosomes in accordance with the standard FISH karyotype of CS [36] (Figure 1b). Further FISH analysis with the probes Oligo-pSc200, Oligo-44, and Oligo-pTa71A-2 indicated that the additional alien chromosome in all plants was identified as belonging to P. huashanica chromosome 7Ns based on the previously published FISH karyotype of P. huashanica [37] (Figure 1c). These results suggested that 18-1-5 was a cytogenetically stable wheat–P. huashanica 7Ns disomic addition line, which could be utilized for subsequent research.

2.2. Investigation of Heading and Maturity Times for Wheat–P. huashanica 7Ns Addition Line

We investigated the heading and maturity times of wheat–P. huashanica 7Ns disomic addition line 18-1-5 and its wheat parents CS and CSph2b in the field for three consecutive years. The statistical results revealed that the average heading time of 18-1-5 was significantly shorter than that of wheat parents CS and CSph2b, with an advance of 10.7 and 9.3 days, respectively (Figure 2a,b; Table S1). Moreover, the average maturity time of 18-1-5 was also significantly earlier than that of CS and CSph2b, with an advance of 10.0 and 8.3 days, respectively (Figure 2c,d; Table S1).

2.3. Observation of Spike Development in the Wheat–P. huashanica 7Ns Addition Line

To further reveal the reason behind the different heading and maturity time between 18-1-5 and its wheat parents, we used a stereomicroscope to observe spike differentiation from the three-leaf stage to the heading stage during the 2022–2023 growing season, and recorded sixteen different developmental time points (Figure 3; Table S2). The results showed that no significant differences appeared among the materials at the apex elongation stage and early single-ridge stage at 24 and 34 days after sowing, respectively (Figure 3a,b). However, a clear developmental difference emerged at 43 days after sowing, where CS and CSph2b were at the middle single-ridge stage, whereas 18-1-5 had entered the early double-ridge stage (Figure 3c). Thereafter, the spike development rate of 18-1-5 was faster than that of CS and CSph2b from the later double-ridge stage to the tetrad stage (Figure 3d–o). Finally, at 143 days after sowing, CS and CSph2b were at the tetrad stage, while 18-1-5 developed larger spikes and started heading (Figure 3p). Thus, these findings suggested that the spike development process of wheat parents CS and CSph2b was basically consistent, while 18-1-5 reached spike development earlier than its wheat parents during the double-ridge stage to the tetrad stage.

2.4. Quality Analysis and Sequence Assembly of RNA-Seq Data

To identify the underlying genes responsible for the early heading time of 18-1-5, the developing young spikes of three materials, including 18-1-5 and its wheat parents CS and CSph2b, were collected at four different spike developmental stages, which were referred to as the double-ridge stage (S1), the glume primordia differentiation stage (S2), the floret primordia differentiation stage (S3), and the stamen and pistil differentiation stage (S4), respectively. A total of 36 RNA samples from four developmental stages of three materials with three biological replicates were subjected to RNA sequencing, and approximately 2.38 billion raw reads were generated. After filtering, approximately 2.36 billion (98.82%) high-quality clean reads were retained. Each library contained 59.23–79.18 million reads. The Q30 value was greater than 97%, and the guanine and cytosine (GC) content distribution was 49–52%. Following assembly, approximately 2.23 billion clean reads were mapped to IWGSC Refseq v1.1, with an average rate of 94.58%, of which 2.10 billion reads could be aligned to only one location on the reference genome, ranging from 84.72 to 91.27% in different samples (Table S3). The transcriptome data met the quality requirements for subsequent analysis to a high extent.

2.5. DEGs Obtained During Spike Development

To obtain differentially expressed genes (DEGs) between 18-1-5 and its wheat parents, CS and CSph2b were pooled together as the parental control since they were similar in spike development. DEGs between 18-1-5 (represented by a capital letter “C”) and its wheat parents (represented by a capital letter “D”) across the four different developmental stages were analyzed using DESeq2 v1.26.0 software. In total, we identified 7189 unique DEGs (Table S4). In the C-S1 vs. D-S1, C-S2 vs. D-S2, C-S3 vs. D-S3, and S4 vs. D-S4 comparison groups, there were 3490, 1744, 2137, and 2672 DEGs, respectively (Figure 4a). Among them, 2277, 1086, 1005, and 1521 DEGs were unique in the C-S1 vs. D-S1, C-S2 vs. D-S2, C-S3 vs. D-S3, and C-S4 vs. D-S4 comparison groups, respectively, and 257 DEGs, including 59 upregulated and 198 downregulated, were shared in four different comparison groups (Figure 4b,c), suggesting that these genes may be involved in maintaining young spike development.

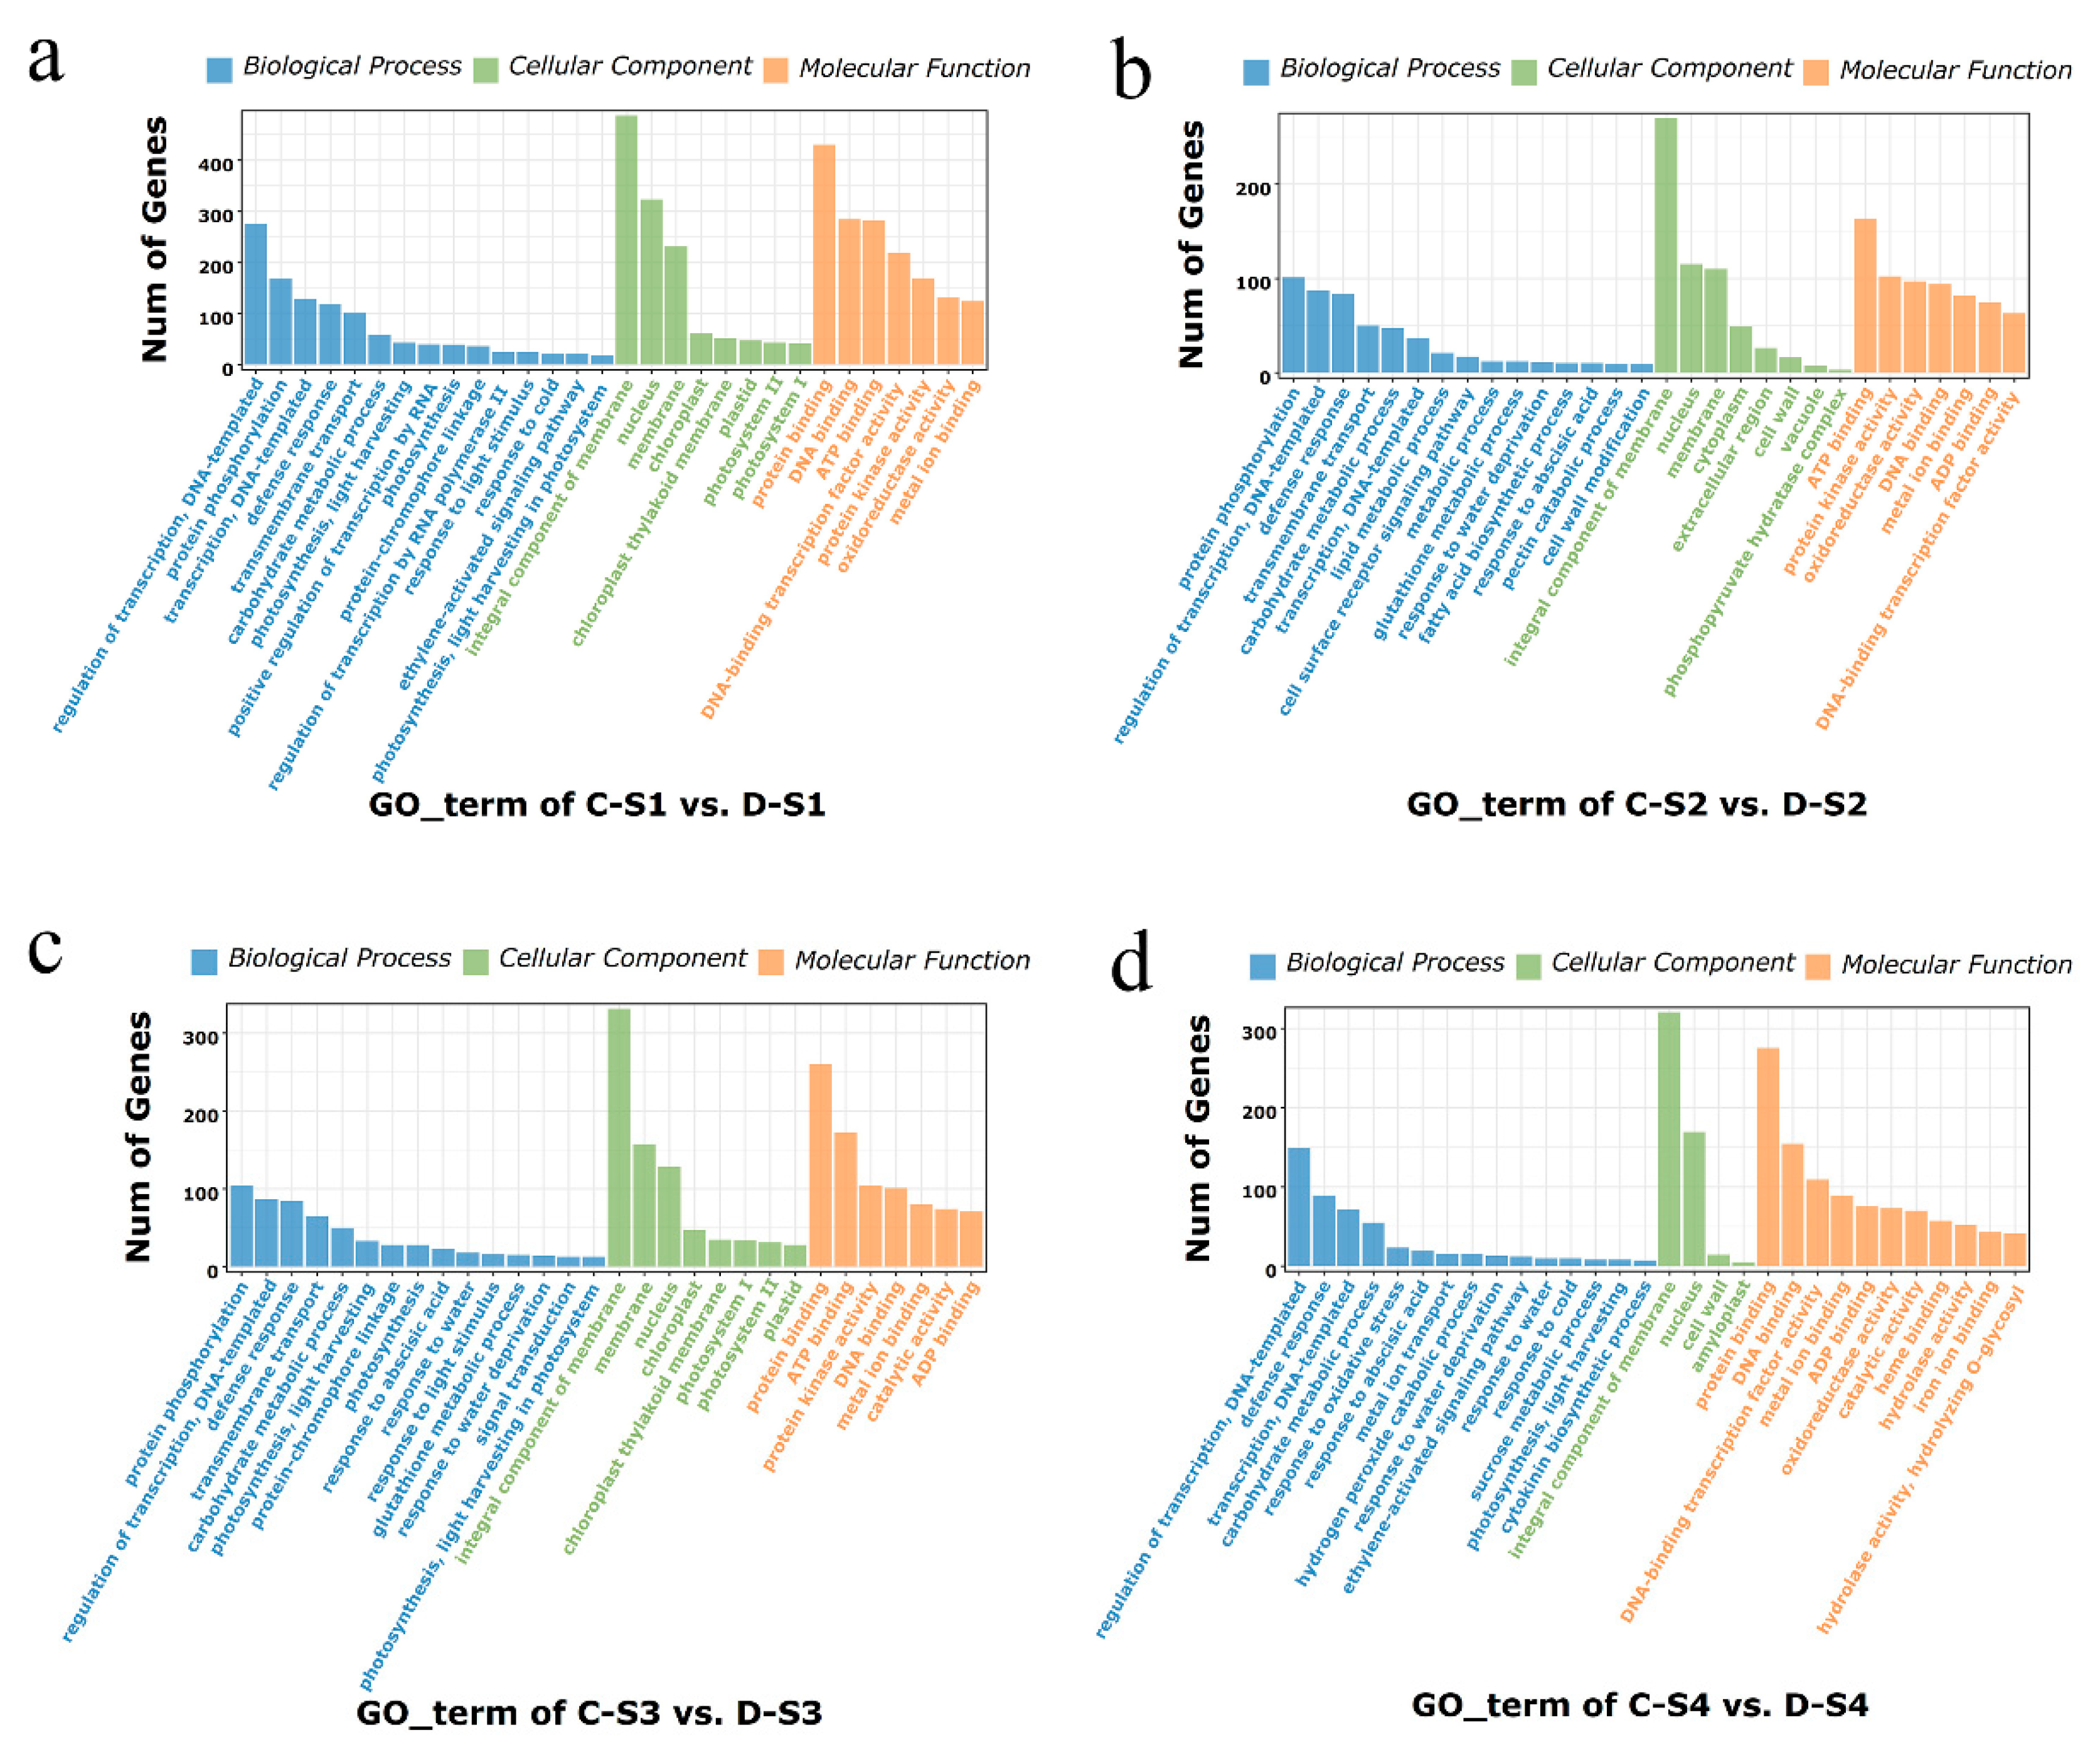
2.6. GO Enrichment Analysis of DEGs

To explore the regulatory pathways of these DEGs, Gene Ontology (GO) enrichment analysis was performed. The results showed that all DEGs were classified into 356 unique GO terms with three categories: biological process (BP), cellular component (CC), and molecular function (MF) (Table S5). The top 30 GO terms with the most significant enrichment were selected for further analysis (Figure 5). In the C-S1 vs. D-S1 group, the main BPs were protein phosphorylation, transmembrane transport, carbohydrate metabolic process, and photosynthesis; the main CCs were nucleus, chloroplast, and photosystem I/II; and the main MFs were protein binding, DNA binding, and ATP binding (Figure 5a). In the C-S2 vs. D-S2 group, the main BPs were protein phosphorylation, regulation of transcription, transmembrane transport, and carbohydrate metabolic process; the main CCs were the integral component of the membrane, nucleus, and membrane; and the main MFs were ATP binding, protein kinase activity, and oxidoreductase activity (Figure 5b). Additionally, in the C-S3 vs. D-S3 group, the main BPs were protein phosphorylation, carbohydrate metabolic process, photosynthesis, and response to abscisic acid; the main CCs were the integral component of the membrane, chloroplast, and photosystem I/II; and the main MFs were protein binding, ATP binding, and protein kinase activity (Figure 5c). Furthermore, in the C-S4 vs. D-S4 group, the main BPs were regulation of transcription, carbohydrate metabolic process, response to abscisic acid, and ethylene-activated signaling pathway; the main CCs were the integral component of the membrane and nucleus; and the main MFs were protein binding, DNA binding, and DNA-binding transcription factor activity (Figure 5d). Moreover, fifteen common GO terms, which were generally expressed in all the comparison groups, were found, such as carbohydrate metabolic process, response to abscisic acid, and ethylene-activated signaling pathway (Figure S1). These findings suggested that these pathways may play crucial roles in the spike development process.

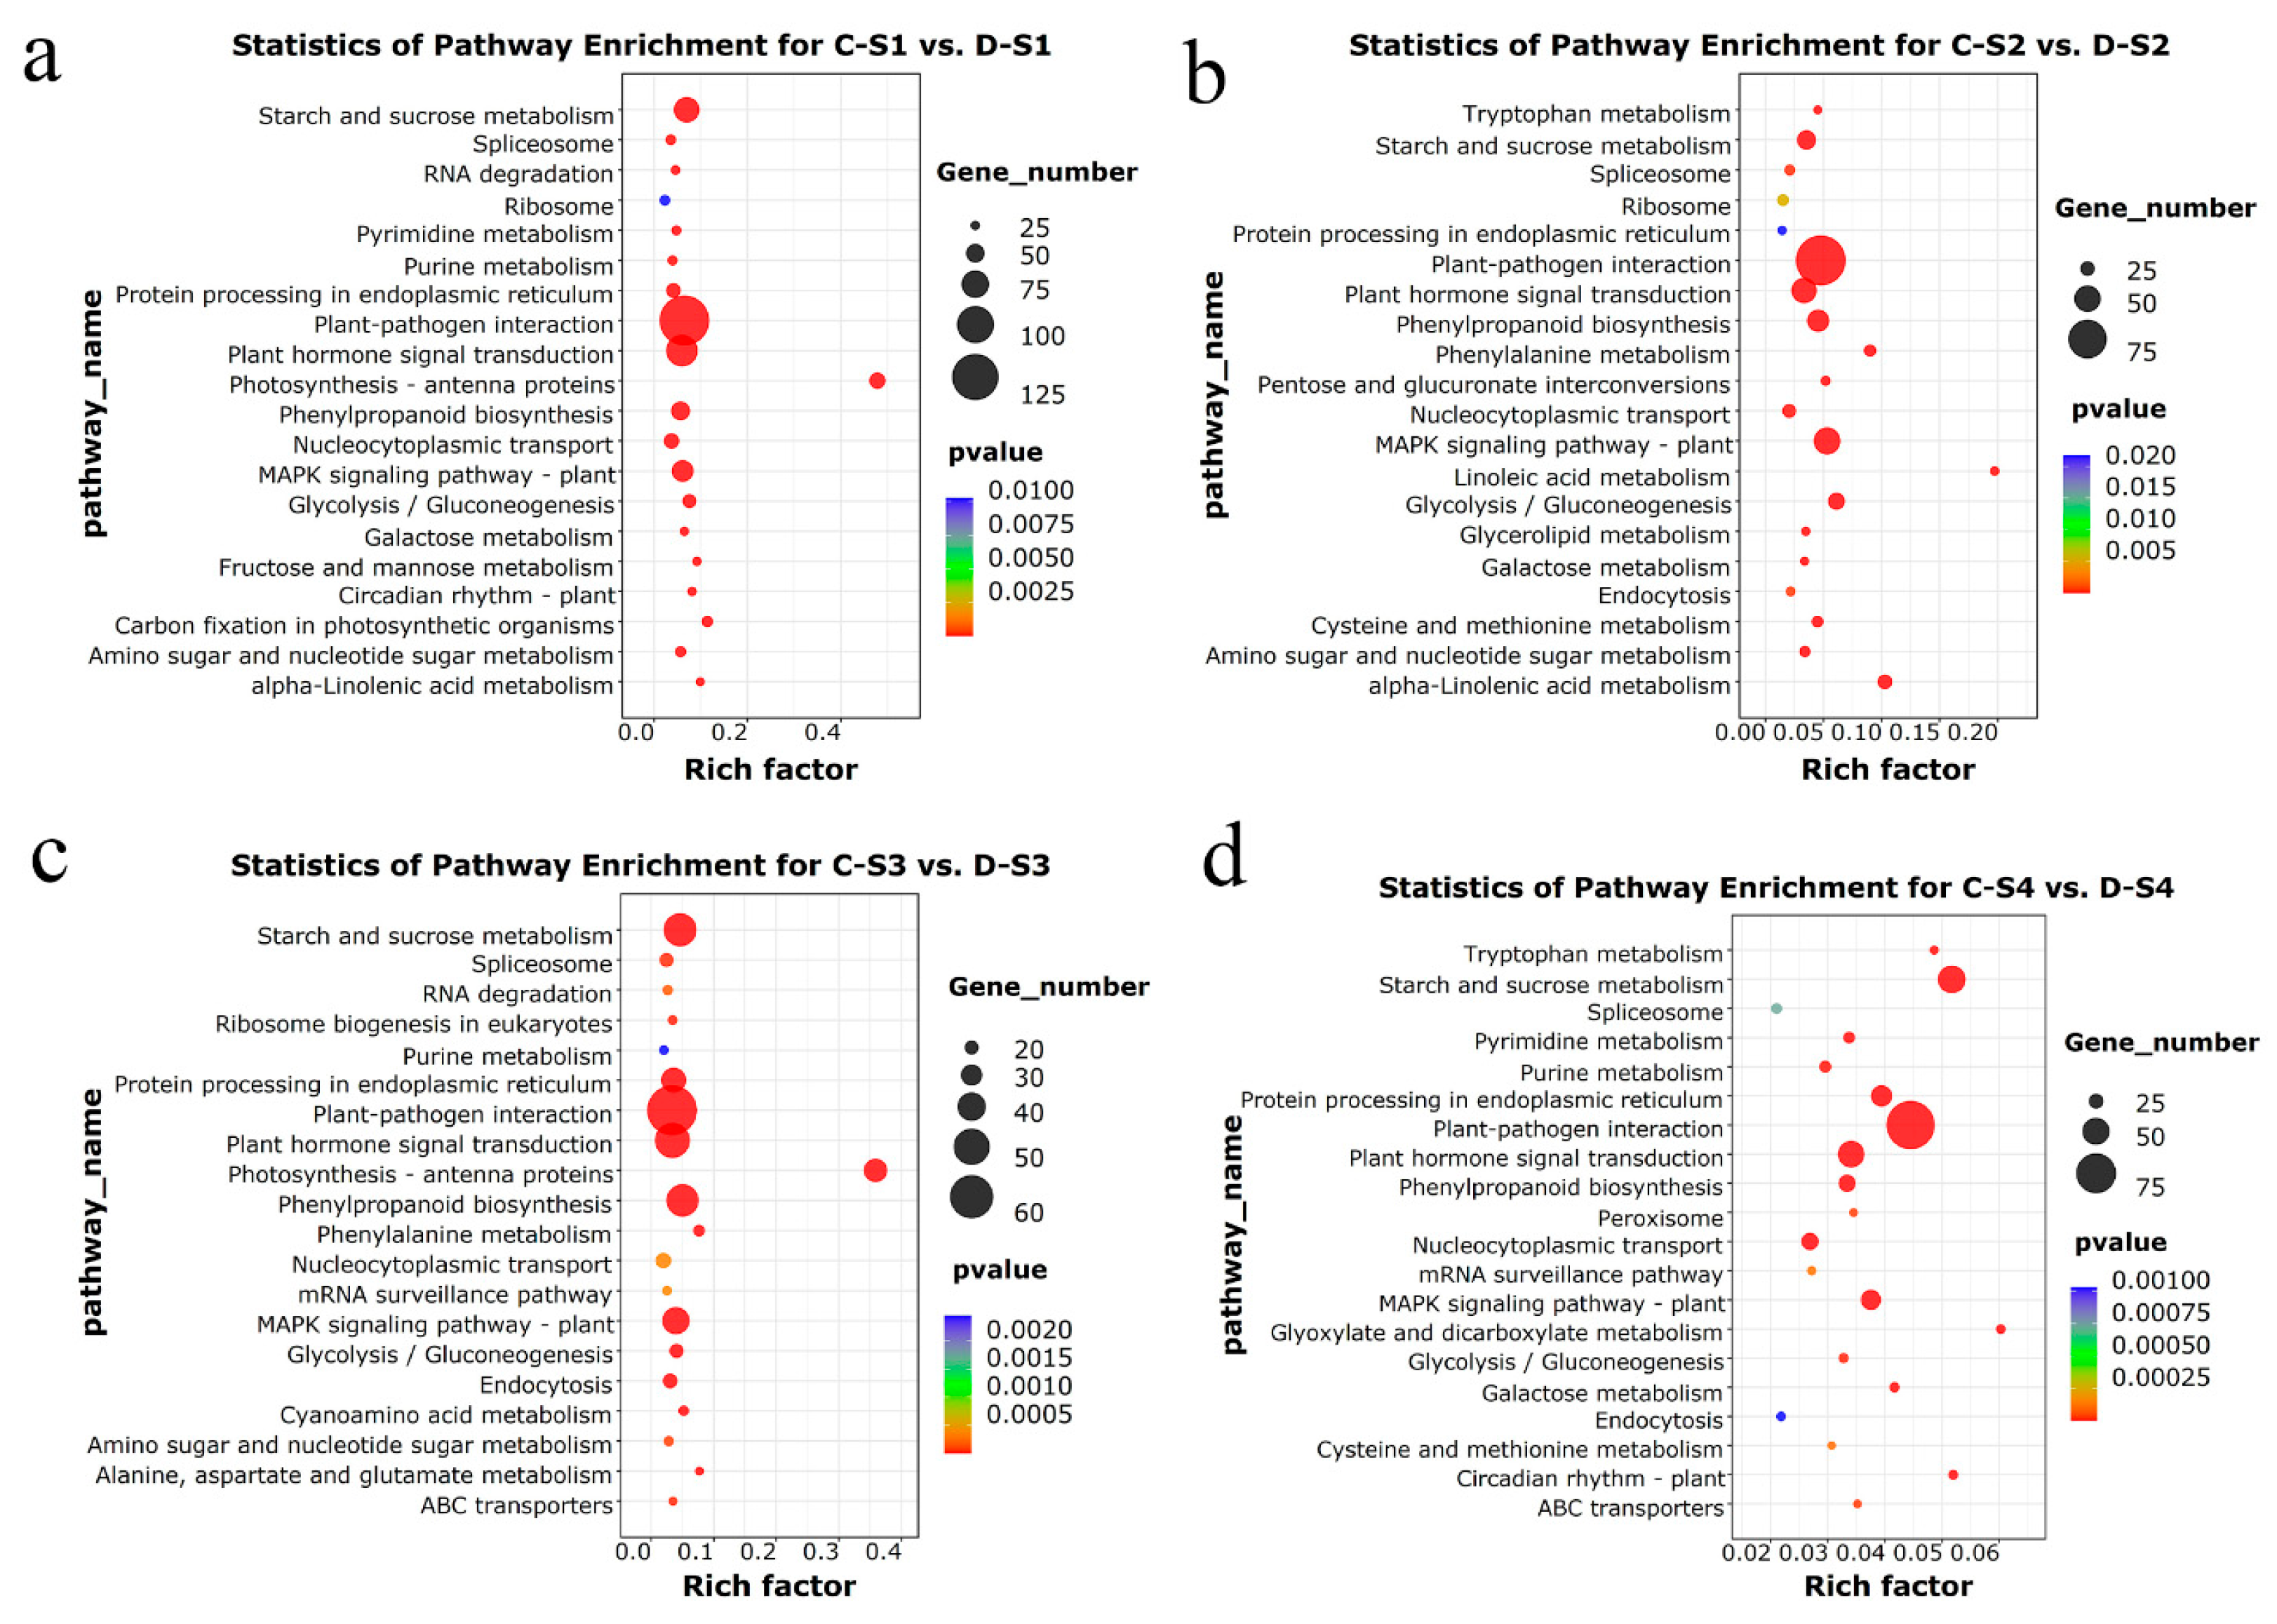
2.7. KEGG Enrichment Analysis of DEGs

To further investigate the metabolic pathways involved in spike development, Kyoto Encyclopedia of Genes and Genomes (KEGG) pathway analysis was performed. We identified 99 unique KEGG enrichment pathways in the four different comparison groups (Table S6). The top 20 KEGG pathways with the smallest significant q-values were selected from each comparison group (Figure 6). In the C-S1 vs. D-S1 group, the most enriched pathways were plant hormone signal transduction, starch and sucrose metabolism, MAPK signaling pathway-plant, photosynthetic antenna proteins, and carbon fixation in photosynthetic organisms (Figure 6a). In the C-S2 vs. D-S2 group, plant-pathogen interaction, MAPK signaling pathway-plant, plant hormone signal transduction, glycolysis/gluconeogenesis, and phenylpropanoid biosynthesis were significantly enriched (Figure 6b). Additionally, in the C-S3 vs. D-S3 group, plant hormone signal transduction, starch and sucrose metabolism, photosynthetic antenna proteins, and phenylpropanoid biosynthesis were significantly enriched (Figure 6c). Moreover, plant-pathogen interaction, starch and sucrose metabolism, plant hormone signal transduction, glyoxylate and dicarboxylate metabolism, and circadian rhythm-plant were significantly enriched in the C-S4 vs. D-S4 group (Figure 6d). Simultaneously, 31 common KEGG enrichment pathways were identified across the four different comparison groups, including plant hormone signal transduction, starch and sucrose metabolism, glyoxylate and dicarboxylate metabolism, and circadian rhythm-plant (Figure S2), which may be closely related to spike development.

2.8. Important Regulatory Pathways and DEGs Associated with Spike Development

Through the KEGG enrichment analysis, we found that many DEGs were involved in plant hormone signal transduction, starch and sucrose metabolism, photosynthetic antenna proteins, and circadian rhythm, which are considered important regulatory pathways related to spike development and flowering time. Therefore, we further analyzed the expression levels of genes associated with the four pathways in each comparison group.
Fifty-two DEGs involved in plant hormone signal transduction were identified in the four comparison groups (Table S7). Most of the DEGs were related to auxin-responsive proteins (IAA and SAUR). Several DEGs associated with the abscisic acid receptor (PYL5 and PYL9), ABA protein phosphatase 2C (PP2C), ethylene receptor, and brassinosteroid LRR receptor kinase (BRI1) signaling pathways were also identified. Two genes associated with DELLA protein GAI were uniquely found and upregulated in the C-S1 vs. D-S1 group (Table 1). The results indicated that the expression of these genes may be one of the important reasons why line 18-1-5 headed earlier than its wheat parents. Additionally, we found that 144 DEGs were involved in the starch and sucrose metabolism pathway (Table S8). Four DEGs were commonly shared in all comparison groups, among which one gene associated with sucrose synthase 1 (SUS1) was highly expressed. Likewise, seven genes associated with trehalose 6-phosphate phosphatase (TPP) RA3 were identified and upregulated in the C-S1 vs. D-S1 group, of which two were also identified in the C-S3 vs. D-S3 and C-S4 vs. D-S4 comparison groups, respectively, but their expression levels were downregulated.
Furthermore, we identified 53 DEGs in the photosynthetic antenna proteins pathway, which were mainly related to chlorophyll a/b-binding protein (Table S9). Among these, 44 were identified and upregulated in the C-S1 vs. D-S1 group (Table 1), while 33 and 8 were found and downregulated in the C-S3 vs. D-S3 and C-S4 vs. D-S4 groups, respectively. Additionally, 47 DEGs related to the circadian rhythm pathway were identified (Table S10), of which two genes related to two-component response regulator-like PRR37 were shared and downregulated in all the comparison groups. Three genes associated with the protein HEADING DATE 3A were exclusively identified and upregulated, while two related to the protein FLOWERING LOCUS T were downregulated in the C-S1 vs. D-S1 group. Similarly, three and one genes associated with the zinc finger protein CONSTANS-LIKE were uniquely identified and upregulated in the C-S1 vs. D-S1 and C-S4 vs. D-S4 groups, respectively, while two genes related to the zinc finger protein CONSTANS-LIKE were exclusively found and downregulated in the C-S3 vs. D-S3 group. Moreover, three genes related to cycling DOF factor 2 were also found and downregulated.

2.9. TFs Associated with Spike Development

Transcription factors (TFs) are involved in the regulation of plant development and flowering. In all libraries, we identified a total of 577 TFs, which were classified into 48 transcription factor families (Table S11). Among these, 339, 114, 104, and 172 TFs were identified in the C-S1 vs. D-S1, C-S2 vs. D-S2, C-S3 vs. D-S3, and C-S4 vs. D-S4 comparison groups, respectively, and eight were common TFs. The key TFs associated with the plant flowering process were found, including bHLH (40 DEGs), bZIP (19 DEGs), MADS-box (49 DEGs), MYB (14 DEGs), NAC (38 DEGs), SBP (8 DEGs), WRKY (43 DEGs), and NF-Y (10 DEGs).
Among the bHLH gene family, we found most bHLH transcription factors to be significantly expressed in the four different developmental stages, of which TabHLH25 was highly expressed in the C-S1 vs. D-S1 group, while TabHLH93 was significantly downregulated in all comparison groups (Table 2). Among the bZIP gene family, the expression of TaHY5 was upregulated in the C-S1 vs. D-S1 and C-S2 vs. D-S2 groups, and TabZIP44 was highly expressed in the C-S4 vs. D-S4 group. For the MADS-box gene family, many known genes related to flowering time, including TaFUL2, TaAGL6, TaSEP3, TaAG1, and TaSEP1-2, were upregulated in the C-S1 vs. D-S1 group, as well as TaVRT-2 was highly expressed in the C-S4 vs. D-S4 group. Interestingly, TaSEP6 and TaMADS32 were uniquely identified in the C-S1 vs. D-S1 group and expressed at high levels. Additionally, in the MYB gene family, the expression of TaMYB94, TaMYB30, and TaMYB44 was significantly upregulated in the C-S3 vs. D-S3 and C-S4 vs. D-S4 groups. Similarly, in the NAC gene family, TaNAC2 was highly expressed in the C-S1 vs. D-S1 group, and TaNAC8 was always significantly upregulated across the four different developmental stages. All SBP transcription factor genes were downregulated in the comparison groups, such as TaSPL17. Among the WRKY gene family, TaWRKY71 was exclusively identified and expressed at a high level in the C-S1 vs. D-S1 group. The expression of TaWRKY46, TaWRKY11, and TaWRKY24 was upregulated in the C-S1 vs. D-S1, C-S2 vs. D-S2, and C-S4 vs. D-S4 groups, respectively. Among the NF-Y gene family, the expression of TaNF-YB5 was highly expressed in the C-S1 vs. D-S1 group, and TaNF-YC6 was upregulated in the C-S4 vs. D-S4 group.

2.10. Quantitative Real-Time PCR Validation of Spike Development-Related DEGs

To verify the reliability of our transcriptome data, we selected fifteen DEGs from circadian rhythm, photosynthetic antenna proteins, phytohormones, and transcription factors, and performed qRT-PCR analysis in all groups. Among these genes, ten were upregulated, three were downregulated, and two were up- or downregulated. The qRT-PCR expression patterns of the fifteen validated genes were found to follow the same trend as the RNA-seq results, further confirming the accuracy of the RNA-seq data acquired in this study (Figure 7).

3. Discussion

3.1. Wheat–Alien Species Are Potentially Valuable Germplasm Resources for Improving Early Heading and Maturity

Early heading and maturity play crucial roles in enhancing the multiple cropping index, optimizing land use efficiency, and maximizing final grain yield. Owing to these advantages, numerous early-maturing wheat varieties have been developed and released across various countries [38]. Nevertheless, the limited genetic diversity of cultivated wheat, resulting from the excessive reliance on early-maturing resources over time, has hindered advancements in grain yield improvements [39]. Numerous studies have demonstrated that transferring beneficial genes from wild relatives into wheat through distant hybridization is an effective strategy for improving wheat and increasing genetic diversity [40,41]. To date, several wheat early-maturing germplasms containing alien chromatin from wild relatives have been successfully developed, including wheat–rye 5R(5A) substitution lines [42], two wheat–barley disomic addition lines WB0528 and WB0647 [43], a wheat–barley 7H addition line [44], a wheat–P. huashanica 6Ns disomic addition line [45], and a wheat–P. huashanica 7Ns ditelosomic addition line [46]. In the present study, we found that the wheat–P. huashanica 7Ns disomic addition line 18-1-5 showed significantly faster spike development than its wheat parents from the double ridge stage, thereby resulting in 9–11 days earlier heading and 8–10 days earlier maturation (Figure 2 and Figure 3). Pedigree analysis revealed that chromosome 7Ns of P. huashanica contains genes that significantly accelerate heading and maturity in wheat. Previous studies have confirmed that the double ridge stage is a key point that determines flower induction and floral meristem development in wheat, thereby ensuring high and stable yields [26,47]. Accordingly, these findings suggest that early spike development, particularly during the double ridge stage, may be a significant factor contributing to earlier heading and maturation in line 18-1-5. This line represents a potentially valuable germplasm for breeding early-maturing wheat cultivars. Wheat heading time is primarily determined by VRN, PPD, and Eps genes [4,5]. However, the main factor controlling early heading in line 18-1-5 specifically still needs further research.

3.2. DEGs and Pathways Associated with Spike Development

In this study, we identified thousands of DEGs associated with spike development, most of which were differentially expressed at the double ridge stage (S1) (Figure 4), suggesting that this developmental period may be pivotal for the flowering initiation of 18-1-5. This result is similar to those reported by Feng et al. [48] and Liu et al. [25]. The GO analysis showed that pathways related to spike development, including carbohydrate metabolic process, photosynthesis, response to abscisic acid, and ethylene-activated signaling pathway, were significantly enriched across various comparison groups (Figure 5). The KEGG analysis revealed that the principal enrichment pathways included plant hormone signal transduction, starch and sucrose metabolism, photosynthetic antenna proteins, and circadian rhythm-plant (Figure 6). RNA-seq analysis using wheat PHYTOCHROME B and PHYTOCHROME C mutants identified many PHYB-regulated genes, which were mainly enriched in components of the auxin, gibberellin, and brassinosteroid biosynthesis and signaling pathways [49]. RNA-seq analysis at the double ridge stage and androgynous primordium differentiation stage showed that DEGs were mainly involved in carbohydrate metabolism, trehalose metabolic process, photosynthesis, light reaction, and hormone signaling [26]. A recent study revealed the different molecular mechanisms of flowering time between “Truman” and “Deguo 2” and found that a large number of DEGs were involved in circadian rhythm, plant hormone signaling, phenolamides, and antioxidants [50]. Our findings show slight deviations from previous studies, underscoring the complexity inherent within the regulatory network governing flowering time. Overall, these results suggest that DEGs within these critical pathways play potentially significant roles in wheat spike development processes.

3.3. Plant Hormone Signal Transduction and Starch and Sucrose Metabolism-Related Genes Involved in Spike Development

Plant hormones, such as IAA, ABA, BR, GA, MeJA, and ethylene, play a vital role in regulating plant flowering time by coordinating various signal transduction pathways. For example, AUXIN RESPONSE FACTOR4 (FaARF4) promotes flowering by activating the floral meristem identity genes APETALA1 (AP1) and FRUITFULL (FUL) in woodland strawberry [51]. The overexpression of the AUX/IAA gene TaIAA15 causes early flowering time by interacting with the auxin response factor (ARF) in wheat [52]. The loss-of-function of the auxin-responsive gene OsSAUR56 results in an early heading date in rice [53]. Moreover, BRI1-EMS-SUPPRESSOR 1 (BES1), a key regulator in the BR pathway, positively regulates photoperiodic flowering in Arabidopsis through the BES1-BEE1-FT signaling pathway [54]. DELLA degradation by GA promotes flowering through the GAF1-TPR-dependent repression of floral repressors in Arabidopsis [55]. GA signaling regulates flowering via the DELLA–BRAHMA–NF-YC module in Arabidopsis [56]. In Arabidopsis, ethylene can accelerate the transition from vegetative growth to flowering [57]. Some ethylene receptor genes (AcERS1b, AcETR2a, and AcETR2b) play important roles in affecting pineapple flowering [58]. In this research, we found that many DEGs associated with the hormone signal transduction pathway, such as ARF, AUX/IAA, SAUR, DELLA, BRI1, and ETR, were differentially expressed at different developmental stages (Table 1; Table S7), indicating that the flowering time of 18-1-5 may be related to changes in endogenous hormone levels caused by the upregulation/downregulation of these genes.
Previous studies reported that starch and sucrose participate in the regulation of plant flowering transition. The starch content in both leaves and buds increases during the flower induction process [59]. The expression level of the key starch synthase gene GBSSI related to starch deposition can promote plant flowering by increasing the CO expression [60]. The trehalose precursor trehalose-6-phosphate (T6P), dephosphorylated by trehalose-6-phosphate phosphatase (TPP), is suggested to function as a proxy for carbohydrate status in plants, and the loss of the gene encoding T6P synthase 1 (TPS1) can cause Arabidopsis to flower extremely late [61]. The overexpression of the gene encoding an O-linked N-acetylglucosamine (O-GlcNAc) transferase (TaOGT1) accelerates heading date in winter wheat, which is mainly associated with sugar content and the transcript levels of flowering time genes [62]. In our study, one gene linked to sucrose synthase 1 (SUS1) was highly expressed in all comparison groups, and seven genes associated with TPP were upregulated in the C-S1 vs. D-S1 group (Table 1). These results suggested that the expression of genes related to SUS1 and TPP may promote spike development and early flowering of 18-1-5, and that TPP-related genes may mainly function at the double-ridge stage.

3.4. Photosynthetic Antenna Proteins and Circadian Rhythm-Related Genes Involved in Spike Development

The antenna system is an important regulator in PSI and PSII for photosynthesis [63]. Light-harvesting chlorophyll a/b-binding (LHC) proteins, also known as antenna proteins, play essential roles in absorbing light and transferring energy for plant growth and development [64]. In previous studies, Zm00001d009589 (lhcb3) was reported to be involved in chloroplast development [65]. RNA-seq analysis revealed many DEGs related to photosynthetic antenna proteins in response to BR signaling in maize [66]. In this study, we found that 44 DEGs related to chlorophyll a/b-binding protein were identified and upregulated in the C-S1 vs. D-S1 group (Table 1; Table S9), suggesting that the upregulated expression of these genes at the double ridge stage (S1) may be important for accelerating the early development and flowering of 18-1-5.
Circadian rhythm plays a pivotal role in the regulation of plant flowering. The pseudoresponse regulator protein 37 (PRR37), which is regulated by the circadian clock, modulates flowering time by activating the expression of the floral inhibitor CO and repressing the expression of the floral activators Early Heading Date 1 (Ehd1) and FT in sorghum [67,68]. Heading date 3a (Hd3a), a rice ortholog of the Arabidopsis FT gene, is upregulated by Hd1, a homolog of CO, and promotes heading time under SD conditions [69,70]. Rice Flowering Locus T 1 (RFT1) regulates heading date and influences yield traits in rice [71]. The overexpression of the CONSTANS (CO)-like protein OsCOL15 results in a delayed flowering phenotype by promoting the flowering repressor Grain number, plant height, and heading date 7 (Ghd7) and repressing the flowering activator Rice Indeterminate 1 (RID1) in rice [72]. CO-like 9 (OsCOL9) can delay flowering time in rice by repressing the Ehd1 pathway [73]. LATE BLOOMER2 (LATE2) is a cycling DOF factor (CDF) homolog that can regulate FT expression and flowering time without affecting the expression of CO-like genes [74]. In this study, we found that several genes described as two-component response regulator-like PRR37, protein HEADING DATE 3A, protein FLOWERING LOCUS T, zinc finger protein CONSTANS-LIKE, and cycling DOF factor 2 were differentially expressed at the different developmental stages (Table 1), indicating that the upregulation/downregulation of these genes may be involved in the spike development process for 18-1-5.

3.5. TFs Involved in Spike Development

TFs, such as bHLH, bZIP, MADS-box, MYB, NAC, SBP, WRKY, and NF-Y, play important roles in the regulation of plant development and flowering. For example, AtbHLH93 has been shown to promote flowering under SD conditions by repressing the floral repressor MAF5 in Arabidopsis [75]. NO FLOWERING IN SHORT DAY (NFL), a bHLH transcription factor, promotes flowering specifically under SD conditions through the GA signaling pathway in Arabidopsis [76]. In this study, TabHLH25 was highly expressed in the C-S1 vs. D-S1 group, and TabHLH93 was significantly downregulated in all comparison groups (Table 2). The results suggested that TabHLH25 and TabHLH93 may be potentially important for affecting the spike development of 18-1-5. Reports have shown that the bZIP transcription factor ELONGATED HYPOCOTYL 5 (HY5), a positive regulator of light signaling, promotes photomorphogenesis by directly or indirectly interacting with several other downstream factors and controls almost one-third of the gene expression of the Arabidopsis genome [77]. In this study, we discovered that TaHY5 was highly expressed in the C-S1 vs. D-S1 and C-S2 vs. D-S2 groups (Table 2), speculating that this gene might indirectly affect wheat heading time by interacting with other factors. Many studies have demonstrated that MADS-box genes encoding a family of transcription factors control flowering time and diverse developmental processes in plants [78,79]. In this research, we found that several known MADS-box genes, including TaFUL2, TaAGL6, TaSEP3, TaAG1, TaVRT2, and TaSEP1-2, were significantly upregulated (Table S11), suggesting that these genes play important roles in regulating spike development for 18-1-5. Specifically, two MADS-box transcription factor genes, TaSEP6 and TaMADS32, were highly expressed in the C-S1 vs. D-S1 group (Table 2). SEPALLATA (SEP)-like genes participate in every step of reproductive growth, ranging from the initiation of inflorescence meristems to the determination of floral organs [80]. OsMADS32 has been proven to interact with PISTILLATA (PI)-like proteins and regulate flower development in rice [81]. Therefore, we speculated that TaSEP6 and TaMADS32 might be essential in regulating the spike development of 18-1-5.
Increased levels of MYB30 could accelerate flowering by interacting with the FT promoter in Arabidopsis [82]. The transcription factor TaMYB72 not only promotes flowering in rice but also directly activates the expression of TaFT, thereby promoting heading and enhancing grain yield traits in wheat [83,84]. In our study, TaMYB94, TaMYB30, and TaMYB44 were significantly upregulated in the C-S3 vs. D-S3 and C-S4 vs. D-S4 groups, suggesting that they may affect the flowering time of 18-1-5. Additionally, we also found that TaNAC2 was highly expressed in the C-S1 vs. D-S1 group (Table 2). The Picea wilsonii transcription factor PwNAC2 has been proven to interact with the Resemble-FCA-contain-PAT1 domain (PwRFCP1) to participate in flowering regulation [85]. Thus, we speculated that TaNAC2 may take part in flowering induction for 18-1-5. Our study found that the SBP transcription factor gene TaSPL17 was downregulated in the C-S2 vs. D-S2 group. Its orthologous gene in Arabidopsis is ATSPL9, which can regulate flowering time by promoting the transcription of FUL, SOC1, and AGL42 [86,87]. Thus, we deduced that the transcription of TaSPL17 may be suppressed during spike development, thereby affecting TaSPL17 activity and heading time. In this research, the expression of TaWRKY71 was significantly upregulated in the C-S1 vs. D-S1 group. AtWRKY71 accelerates flowering via the direct activation of FT and LEAFY (LFY) in Arabidopsis [88]. Thus, we hypothesized that TaWRKY71 may promote flowering for 18-1-5. Previous studies have shown that NF-YB and NF-YC genes can regulate flowering in plants [89,90]. Our study found that TaNF-YB5 and TaNF-YC6 were significantly upregulated (Table 2), suggesting that these two genes may also be involved in the heading time of 18-1-5. In summary, the key TFs identified in this study are pivotal for the regulation of spike development and flowering time in 18-1-5, but their specific regulatory mechanism needs further exploration.

4. Materials and Methods

4.1. Plant Materials

The plant materials used in the current study included common wheat Triticum aestivum cv. Chinese Spring (CS, 2n = 6x = 42, AABBDD, from Sichuan province, China), the Chinese Spring ph2b (CSph2b) mutant, and the wheat–P. huashanica 7Ns disomic addition line 18-1-5 (2n = 44 = 42W + II7Ns). The 7Ns disomic addition line 18-1-5 was developed and identified from the BC1F5 generation of CSph2b/P. huashanica accession ZY3156 (2n = 2x = 14, NsNs, from Shaanxi province, China)//CS///CS [35]. All the materials were preserved at the Triticeae Research Institute, Sichuan Agricultural University, China.

4.2. GISH and FISH Analyses

Chromosome preparation of root-tip cells at mitotic metaphase was conducted and subjected to sequential GISH and FISH analyses [35,91]. The total genomic DNA of P. huashanica was labeled with dUTP-ATO-550 (Jena Bioscience, Jena, Germany) and used as a probe for GISH, and CS genomic DNA was included as blocking DNA. Five oligonucleotide probes, Oligo-pSc119.2, Oligo-pTa535, Oligo-pSc200, Oligo-44, and Oligo-pTa71A-2, were labeled with TAMRA-5′ or 6-FAM-5′ for FISH [36,37]. An Olympus BX63 fluorescence microscope equipped with a Photometric SenSys DP-70 CCD camera (Olympus Corporation, Tokyo, Japan) was used to capture the chromosome fluorescent signals.

4.3. Phenotypic Characterization

The seeds of CS, CSph2b, and 18-1-5 were planted in a randomized complete block design with three replicates in the fields at the Wenjiang experimental field (Chengdu, China) during three consecutive growing seasons from 2020 to 2023. The field layout consisted of 50 rows for each material, with each row being 1.5 m in length and 0.3 m in spacing, with 15 grains per row. Spike differentiation, including apex elongation, single-ridge, double-ridge, glume primordia differentiation, floret primordia differentiation, stamen and pistil differentiation, anther separation, and tetrad stages, was investigated for the main stems of ten randomly selected plants at seven-day intervals, using a stereomicroscope (ZEISS SteREO Discovery.V20) following the wheat spike differentiation criteria [92]. The heading time was recorded as days from the sowing date to the date when approximately 50% of spikes fully emerged from the flag leaf sheath. The maturity time was calculated from the sowing date to the date when their endosperm turned waxy and the grains had a 40% moisture content [93]. Statistical analysis of phenotypic data was performed using SPSS version 25.0 (IBM Corp., Armonk, NY, USA). Student’s t-test was conducted to determine the significance level of phenotypic differences between 18-1-5 and its wheat parents.

4.4. RNA Extraction, Library Construction, and Illumina Sequencing

Young spikes from the main stems of each material at four different developmental stages, namely, the double-ridge stage (S1), the glume primordia differentiation stage (S2), the floret primordia differentiation stage (S3), and the stamen and pistil differentiation stage (S4), were collected. Approximately 40–50 young spikes at each developmental stage were pooled with three biological replicates. The collected samples were immediately frozen in liquid nitrogen and stored at −80 °C for subsequent RNA extraction. Total RNA was isolated using Trizol reagent (Invitrogen, Carlsbad, CA, USA) according to the manufacturer’s procedure. RNA concentration was quantified using a NanoDrop 2000 spectrophotometer (Thermo Fisher Scientific, Wilmington, DE, USA). RNA purity and integrity were checked using a 2100 Bioanalyzer RNA 6000 Nano LabChip Kit (Agilent, Santa Clara, CA, USA). High-quality RNA samples with RIN number > 7.0 were used to construct the sequencing library.
The mRNA was purified from total RNA (5 μg) using Dynabeads Oligo (dT) (Thermo Fisher, CA, USA) with two rounds of purification and subjected to RNA fragmentation. Afterward, the cleaved RNA fragments were reverse-transcribed to create the first-strand cDNA by SuperScript™ II Reverse Transcriptase (Invitrogen, USA), followed by the synthesis of the second-strand cDNA. The cDNA library was constructed by PCR amplification, and the average insert size for the final cDNA libraries was 300 ± 50 bp [94]. Finally, the 2 × 150 bp paired-end sequencing (PE150) was performed on an Illumina NovaSeq™ 6000 platform (LC-Bio Technology Co., Ltd., Hangzhou, China) following the vendor’s recommended protocol.

4.5. Transcriptome Analysis

Raw reads in FASTQ format were first processed using in-house Perl scripts. The poly-N, adapters, and low-quality reads from raw data were removed to obtain high-quality clean reads for all downstream analyses, and the sequence quality of clean data, including Q20, Q30, and GC-content, was verified using FastQC (http://www.bioinformatics.babraham.ac.uk/projects/fastqc/, accessed on 10 September 2024). After that, the clean reads of all samples were mapped to the CS reference genome (IWGSC Refseq v1.1, https://wheat-urgi.versailles.inra.fr/Seq-Repository/Annotations, accessed on 5 June 2025) using the HISAT2 v2.2.0 package [95]. StringTie v2.1.2 (http://ccb.jhu.edu/software/stringtie/, accessed on 20 September 2024) [96] and GffCompare (http://ccb.jhu.edu/software/stringtie/gffcompare.shtml, accessed on 28 September 2024) software were used to assemble the transcripts and reconstruct a comprehensive transcriptome, respectively.
The fragment per kilobase of transcript per million mapped reads (FPKM) value was calculated to estimate the expression level of genes in each sample. Differential gene expression analysis was performed using DESeq2 v1.26.0 software between two different groups [97]. The genes with the parameter of false discovery rate (FDR) < 0.05 and |log2(foldchange)| ≥ 1 were considered as differentially expressed genes (DEGs). Gene functions were annotated using the Nr, Swiss-Prot, COG, KEGG, GO, KOG, Pfam, and eggNOG databases. Significant GO and KEGG enrichment analyses for DEGs were performed using the OmicStudio tools (https://www.omicstudio.cn/tool, accessed on 25 June 2025) with a Q-value less than 0.05.

4.6. Transcription Factor Analysis

To identify transcription factor (TF) changes during spike development, the nucleotide sequences of DEGs from IWGSC RefSeq v1.1 were extracted and subjected to the identification and classification of TFs using the online tool iTAK (Plant Transcription factor & Protein Kinase Identifier and Classifier, http://itak.feilab.net/cgi-bin/itak/index.cgi, accessed on 5 June 2025) [98].

4.7. qRT-PCR Analysis

To validate the RNA-seq results, fifteen DEGs obtained from the sequencing data were selected for qRT-PCR analysis. Total RNA extraction from the collected samples was conducted as described above. Gene-specific primers were designed with Primer Premier 5 software (Premier Biosoft, Palo Alto, CA, USA) (Table S12). cDNA was synthesized from 1.5 μg of DNase-treated total RNA using the Thermo RevertAid First Strand cDNA Synthesis Kit (Thermo-Fisher Scientific, Shanghai, China). The qRT-PCR was performed using the SYBR Premix pro Taq HS qPCR Kit (Accurate Bio Co., Ltd., Changsha, Hunan, China) following the manufacturer’s recommendations on the CFX96 Real-Time PCR System (Bio-Rad, Hercules, CA, USA) as described previously [99]. Each experiment included three technical replicates and at least three biological replicates. The wheat Actin gene was used as the internal reference gene for normalization. Relative expression levels were calculated using the 2−ΔΔCt method [100].

5. Conclusions

In the present study, we found that the spike development of the wheat–P. huashanica 7Ns disomic addition line 18-1-5, particularly from the double ridge stage, was distinctly faster than that of its wheat parents, thereby leading to early heading and maturation. The transcriptome analysis of four different spike development stages revealed several key genes involved in plant hormone signal transduction, starch and sucrose metabolism, photosynthetic antenna proteins, and circadian rhythm, which were differentially expressed at different developmental stages, especially at the double ridge stage, implying their influence on the spike development and flowering time. Additionally, a large number of differentially expressed TFs, including bHLH, bZIP, MADS-box, NAC, WRKY, SBP, NF-Y, and MYB gene families, were also found, but only a few TFs, such as TabHLH93, TaHY5, TaSEP6, TaSPL17, TaMYB30, TaNAC2, TaNF-YB5, and TaWRKY71, were significantly up- or downregulated, suggesting that they might play important roles in affecting the spike development and flowering time of 18-1-5. Our results provide useful information for future investigations into the molecular mechanisms of wheat heading, such as gene function validation and protein–protein interactions.

Supplementary Materials

The following supporting information can be downloaded at: https://www.mdpi.com/article/10.3390/plants14132077/s1. Table S1. Heading and maturity time of 18-1-5 and its wheat parents CS and CSph2b under field conditions. Table S2. Spike development dynamics of 18-1-5 and its wheat parents CS and CSph2b under field conditions. Table S3. Summary of RNA sequencing data. Table S4. Expression analysis of DEGs in different comparison groups. Table S5. GO enrichment analysis of DEGs in different comparison groups. Table S6. KEGG enrichment pathways of DEGs in different comparison groups. Table S7. DEGs involved in plant hormone signal transduction in different comparison groups. Table S8. DEGs involved in starch and sucrose metabolism in different comparison groups. Table S9. DEGs involved in photosynthetic antenna proteins in different comparison groups. Table S10. DEGs involved in circadian rhythm in different comparison groups. Table S11. Identification of transcription factors using DEGs. Table S12. List of primers used in this study for qRT-PCR. Figure S1. Common GO terms in four different comparison groups. Figure S2. Common KEGG enrichment pathways in four different comparison groups.

Author Contributions

B.T., Y.X. and H.P. analyzed the data and drafted the manuscript. M.W., W.Z., L.X., Y.W. and J.Z. performed the experiments. X.F., L.S., H.Z., Y.C., Y.Z., P.Q. and D.W. provided technical guidance. Y.L. and H.K. designed the experiment and formulated the questions. All authors have read and agreed to the published version of the manuscript.

Funding

This work was funded by the National Natural Science Foundation of China (No. 32200180), the Sichuan Science and Technology Program (2024NSFSC1968), the Science and Technology Bureau of Sichuan Province (2023NSFSC1995, 2024NSFSC1327, and 2025YFHZ0184), and the Science and Technology Bureau of Chengdu City (2024-YF05-00368-SN and 2024-YF05-01624-SN).

Data Availability Statement

The datasets generated and analyzed during the current study are available from the National Genomics Data Center (NGDC) under BioProject ID: PRJCA030627 (https://ngdc.cncb.ac.cn/).

Conflicts of Interest

The authors declare that they have no conflicts of interest.

Abbreviations

CSChinese Spring
CSph2bChinese Spring ph2b mutant
GISHGenomic in situ hybridization
FISHFluorescence in situ hybridization
DAPI4,6-diamidino-2-phenylindole
DEGsDifferentially expressed genes
GOGene Ontology
KEGGKyoto Encyclopedia of Genes and Genomes
TFsTranscription factors
FPKMFragment per kilobase of transcript per million mapped reads
qRT-PCRQuantitative real-time polymerase chain reaction

References

  1. Shiferaw, B.; Smale, M.; Braun, H.J.; Duveiller, E.; Reynolds, M.; Muricho, G. Crops that feed the world 10. Past successes and future challenges to the role played by wheat in global food security. Food Sec. 2013, 5, 291–317. [Google Scholar] [CrossRef]
  2. Fjellheim, S.; Boden, S.; Trevaskis, B. The role of seasonal flowering responses in adaptation of grasses to temperate climates. Front. Plant Sci. 2014, 5, 431. [Google Scholar] [CrossRef]
  3. Mizuno, N.; Matsunaka, H.; Yanaka, M.; Ishikawa, G.; Kobayashi, F.; Nakamura, K. Natural variations of wheat EARLY FLOWERING 3 highlight their contributions to local adaptation through fine-tuning of heading time. Theor. Appl. Genet. 2023, 136, 139. [Google Scholar] [CrossRef]
  4. Huang, M.; Mheni, N.; Brown-Guedira, G.; McKendry, A.; Griffey, C.; Van, S.D.; Costa, J.; Sneller, C. Genetic analysis of heading date in winter and spring wheat. Euphytica 2018, 214, 128. [Google Scholar] [CrossRef]
  5. Yan, L.; Fu, D.; Li, C.; Blechl, A.; Tranquilli, G.; Bonafede, M.; Sanchez, A.; Valarik, M.; Yasuda, S.; Dubcovsky, J. The wheat and barley vernalization gene VRN3 is an orthologue of FT. Proc. Natl. Acad. Sci. USA 2006, 103, 19581–19586. [Google Scholar] [CrossRef]
  6. Yan, L.; Loukoianov, A.; Tranquilli, G.; Helguera, M.; Fahima, T.; Dubcovsky, J. Positional cloning of the wheat vernalization gene VRN1. Proc. Natl. Acad. Sci. USA 2003, 100, 6263–6268. [Google Scholar] [CrossRef]
  7. Xie, L.; Zhang, Y.; Wang, K.; Luo, X.; Xu, D.; Tian, X.; Li, L.; Ye, X.; Xia, X.; Li, W.; et al. TaVrt2, an SVP-like gene, cooperates with TaVrn1 to regulate vernalization-induced flowering in wheat. New Phytol. 2021, 231, 834–848. [Google Scholar] [CrossRef]
  8. Yan, L.; Loukoianov, A.; Blechl, A.; Tranquilli, G.; Ramakrishna, W.; SanMiguel, P.; Bennetzen, J.L.; Echenique, V.; Dubcovsky, J. The wheat VRN2 gene is a flowering repressor down-regulated by vernalization. Science 2004, 303, 1640–1644. [Google Scholar] [CrossRef]
  9. Dubcovsky, J.; Loukoianov, A.; Fu, D.; Valarik, M.; Sanchez, A.; Yan, L. Effect of photoperiod on the regulation of wheat vernalization genes VRN1 and VRN2. Plant Mol. Biol. 2006, 60, 469–480. [Google Scholar] [CrossRef]
  10. Turner, A.; Beales, J.; Faure, S.; Dunford, R.P.; Laurie, D.A. The pseudo-response regulator Ppd-H1 provides adaptation to photoperiod in barley. Science 2005, 310, 1031–1034. [Google Scholar] [CrossRef]
  11. Boden, S.A.; Cavanagh, C.; Cullis, B.R.; Ramm, K.; Greenwood, J.; Jean Finnegan, E.; Trevaskis, B.; Swain, S.M. Ppd-1 is a key regulator of inflorescence architecture and paired spikelet development in wheat. Nat. Plants 2015, 1, 14016. [Google Scholar]
  12. Worland, A.J. The influence of flowering time genes on environmental adaptability in European wheats. Euphytica 1996, 89, 49–57. [Google Scholar] [CrossRef]
  13. Zikhali, M.; Wingen, L.U.; Griffiths, S. Delimitation of the Earliness per se D1 (Eps-D1) flowering gene to a subtelomeric chromosomal deletion in bread wheat (Triticum aestivum). J. Exp. Bot. 2016, 67, 287–299. [Google Scholar] [CrossRef]
  14. Balzan, S.; Johal, G.S.; Carraro, N. The role of auxin transporters in monocots development. Front. Plant Sci. 2014, 5, 393. [Google Scholar] [CrossRef]
  15. Domagalska, M.A.; Sarnowska, E.; Nagy, F.; Davis, S.J. Genetic analyses of interactions among gibberellin, abscisic acid, and brassinosteroids in the control of flowering time in Arabidopsis thaliana. PLoS ONE 2010, 5, e14012. [Google Scholar] [CrossRef]
  16. Yan, Z.; Deng, R.; Tang, H.; Zhang, H.; Zhu, S. Molecular basis of differential sensitivity to MeJA in floret opening between indica and japonica rice. Czech J. Genet. Plant Breed. 2024, 60, 136–148. [Google Scholar] [CrossRef]
  17. Bao, S.; Hua, C.; Shen, L.; Yu, H. New insights into gibberellin signaling in regulating flowering in Arabidopsis. J. Integr. Plant Biol. 2020, 62, 118–131. [Google Scholar] [CrossRef]
  18. Xu, F.; Li, T.; Xu, P.; Li, L.; Du, S.; Lian, H.; Yang, H. DELLA proteins physically interact with CONSTANS to regulate flowering under long days in Arabidopsis. FEBS Lett. 2016, 590, 541–549. [Google Scholar] [CrossRef]
  19. Moon, J.; Suh, S.S.; Lee, H.; Choi, K.R.; Hong, C.; Paek, N.C.; Kim, S.G.; Lee, I. The SOC1 MADS-box gene integrates vernalization and gibberellin signals for flowering in Arabidopsis. Plant J. 2003, 35, 613–623. [Google Scholar] [CrossRef]
  20. Pearce, S.; Vanzetti, L.S.; Dubcovsky, J. Exogenous gibberellins induce wheat spike development under short days only in the presence of VERNALIZATION1. Plant Physiol. 2013, 163, 1433–1445. [Google Scholar] [CrossRef]
  21. McMaster, G.S. Phytomers, phyllochrons, phenology and temperate cereal development. J. Agric. Sci. 2005, 143, 137–150. [Google Scholar] [CrossRef]
  22. Kamran, A.; Iqbal, M.; Spaner, D. Flowering time in wheat (Triticum aestivum L.): A key factor for global adaptability. Euphytica 2014, 197, 1–26. [Google Scholar] [CrossRef]
  23. Digel, B.; Pankin, A.; von Korff, M. Global transcriptome profiling of developing leaf and shoot apices reveals distinct genetic and environmental control of floral transition and inflorescence development in barley. Plant Cell 2015, 27, 2318–2334. [Google Scholar] [CrossRef]
  24. Li, Y.; Fu, X.; Zhao, M.; Zhang, W.; Li, B.; An, D.; Li, J.; Zhang, A.; Liu, R.; Liu, X. A Genome-wide view of transcriptome dynamics during early spike development in bread wheat. Sci. Rep. 2018, 8, 15338. [Google Scholar] [CrossRef]
  25. Liu, H.; Li, G.; Yang, X.; Kuijer, H.N.J.; Liang, W.; Zhang, D. Transcriptome profiling reveals phase-specific gene expression in the developing barley inflorescence. Crop J. 2020, 8, 71–86. [Google Scholar] [CrossRef]
  26. Yang, Y.; Zhang, X.; Wu, L.; Zhang, L.; Liu, G.; Xia, C.; Liu, X.; Kong, X. Transcriptome profiling of developing leaf and shoot apices to reveal the molecular mechanism and co-expression genes responsible for the wheat heading date. BMC Genom. 2021, 22, 468. [Google Scholar] [CrossRef]
  27. VanGessel, C.; Hamilton, J.; Tabbita, F.; Dubcovsky, J.; Pearce, S. Transcriptional signatures of wheat inflorescence development. Sci. Rep. 2022, 12, 17224. [Google Scholar] [CrossRef]
  28. Benaouda, S.; Stöcker, T.; Schoof, H.; Léon, J.; Ballvora, A. Transcriptome profiling at the transition to the reproductive stage uncovers stage and tissue-specific genes in wheat. BMC Plant Biol. 2023, 23, 25. [Google Scholar] [CrossRef]
  29. Gauley, A.; Pasquariello, M.; Yoshikawa, G.V.; Alabdullah, A.K.; Hayta, S.; Smedley, M.A.; Dixon, L.E.; Boden, S.A. Photoperiod-1 regulates the wheat inflorescence transcriptome to influence spikelet architecture and flowering time. Curr. Biol. 2024, 34, 2330–2343. [Google Scholar] [CrossRef]
  30. Chen, S.; Zhang, A.; Fu, J. The hybridization between Triticum aestivum and Psathyrostachys huashanica Keng. Acta Genet. Sin. 1991, 18, 508–512. [Google Scholar]
  31. Fu, J.; Wang, M.; Zhao, J.; Chen, S.; Hou, W.; Yang, Q. Studies on cytogenetics and utilization of wheat-Psathyrostachys huashanica medium material H8911 with resistance to wheat take-all fungus. Acta Bot. Boreal. Occident. Sin. 2003, 23, 2157–2162. [Google Scholar]
  32. Kang, H.; Zhang, H.; Fan, X.; Zhou, Y. Morphological and cytogenetic studies on the hybrid between bread wheat and Psathyrostachys huashanica Keng ex Kuo. Euphytica 2008, 162, 441–448. [Google Scholar] [CrossRef]
  33. Li, J.; Zhao, L.; Cheng, X.; Bai, G.; Li, M.; Wu, J.; Yang, Q.; Chen, X.; Yang, Z.; Zhao, J. Molecular cytogenetic characterization of a novel wheat-Psathyrostachys huashanica Keng T3DS-5NsL•5NsS and T5DL-3DS•3DL dual translocation line with powdery mildew resistance. BMC Plant Biol. 2020, 20, 163. [Google Scholar] [CrossRef] [PubMed]
  34. Pang, J.; Huang, C.; Wang, Y.; Wen, X.; Deng, P.; Li, T.; Wang, C.; Liu, X.; Chen, C.; Zhao, J.; et al. Molecular cytological analysis and specific marker development in wheat-Psathyrostachys huashanica keng 3Ns additional line with elongated glume. Int. J. Mol. Sci. 2023, 24, 6726. [Google Scholar] [CrossRef]
  35. Tan, B.; Wang, M.; Cai, L.; Li, S.; Zhu, W.; Xu, L.; Wang, Y.; Zeng, J.; Fan, X.; Sha, L.; et al. Cytogenetic and molecular marker analyses of a novel wheat-Psathyrostachys huashanica 7Ns disomic addition line with powdery mildew resistance. Int. J. Mol. Sci. 2022, 23, 10285. [Google Scholar] [CrossRef]
  36. Tang, Z.; Yang, Z.; Fu, S. Oligonucleotides replacing the roles of repetitive sequences pAs1, pSc119.2, pTa-535, pTa71, CCS1, and pAWRC.1 for FISH analysis. J. Appl. Genet. 2014, 55, 313–318. [Google Scholar] [CrossRef]
  37. Zhang, H.; Wang, F.; Zeng, C.; Zhu, W.; Xu, L.; Wang, Y.; Zeng, J.; Fan, X.; Sha, L.; Wu, D.; et al. Development and application of specific FISH probes for karyotyping Psathyrostachys huashanica chromosomes. BMC Genom. 2022, 23, 309. [Google Scholar] [CrossRef]
  38. Zhao, H.; Huang, X.; Yang, Z.; Li, F.; Ge, X. Synergistic optimization of crops by combining early maturation with other agronomic traits. Trends Plant Sci. 2023, 28, 1178–1191. [Google Scholar] [CrossRef]
  39. Johansson, E.; Lan, Y.; Olalekan, O.; Kuktaite, R.; Chawade, A.; Rahmatov, M. Alien introgression to wheat for food security: Functional and nutritional quality for novel products under climate change. Front. Nutr. 2024, 11, 1393357. [Google Scholar] [CrossRef]
  40. Mujeeb-Kazi, A.; Kazi, A.G.; Dundas, I.; Rasheed, A.; Ogbonnaya, F.; Kishii, M.; Bonnett, D.; Wang, R.C.; Xu, S.; Chen, P.; et al. Genetic diversity for wheat improvement as a conduit to food security. Adv. Agron. 2013, 122, 179–257. [Google Scholar]
  41. Kong, L.; Song, X.; Xiao, J.; Sun, H.; Dai, K.; Lan, C.; Singh, P.; Yuan, C.; Zhang, S.; Singh, R.; et al. Development and characterization of a complete set of Triticum aestivum-Roegneria ciliaris disomic addition lines. Theor. Appl. Genet. 2018, 131, 1793–1806. [Google Scholar] [CrossRef]
  42. Efremova, T.T.; Laĭkova, L.I.; Arbuzova, V.S.; Popova, O.M. Effect of the 5R(5A) alien chromosome substitution on the growth habit and winter hardiness of wheat. Russ. J. Genet. 2004, 40, 810–812. [Google Scholar] [CrossRef]
  43. Liu, S.; Chen, X.; Cai, Z.; Wu, J.; Zhao, J.; Yang, Q. Selection and identification of early mature derive lines from common wheat× cultivated barley hybrid progenies. J. Shanxi Agric. Univ. 2011, 31, 142–145. [Google Scholar]
  44. Farkas, A.; Molnár, I.; Kiss, T.; Karsai, I.; Molnár-Láng, M. Effect of added barley chromosomes on the flowering time of new wheat/winter barley addition lines in various environments. Euphytica 2014, 195, 45–55. [Google Scholar] [CrossRef]
  45. Wang, L.; Liu, Y.; Du, W.; Jing, F.; Wang, Z.; Wu, J.; Chen, X. Anatomy and cytogenetic identification of a wheat-Psathyrostachys huashanica keng line with early maturation. PLoS ONE 2015, 10, e0131841. [Google Scholar] [CrossRef] [PubMed]
  46. Tan, B.; Zhao, L.; Li, L.; Zhang, H.; Zhu, W.; Xu, L.; Wang, Y.; Zeng, J.; Fan, X.; Sha, L.; et al. Identification of a wheat-Psathyrostachys huashanica 7Ns ditelosomic addition line conferring early maturation by cytological analysis and newly developed molecular and FISH markers. Front. Plant Sci. 2021, 12, 784001. [Google Scholar] [CrossRef]
  47. Li, Y.; Li, L.; Zhao, M.; Guo, L.; Guo, X.; Zhao, D.; Batool, A.; Dong, B.; Xu, H.; Cui, S.; et al. Wheat FRIZZY PANICLE activates VERNALIZATION1-A and HOMEOBOX4-A to regulate spike development in wheat. Plant Biotechnol. J. 2021, 19, 1141–1154. [Google Scholar] [CrossRef]
  48. Feng, N.; Song, G.; Guan, J.; Chen, K.; Jia, M.; Huang, D.; Wu, J.; Zhang, L.; Kong, X.; Geng, S.; et al. Transcriptome profiling of wheat inflorescence development from spikelet initiation to floral patterning identified stage-specific regulatory genes. Plant Physiol. 2017, 174, 1779–1794. [Google Scholar] [CrossRef]
  49. Pearce, S.; Kippes, N.; Chen, A.; Debernardi, J.M.; Dubcovsky, J. RNA-seq studies using wheat PHYTOCHROME B and PHYTOCHROME C mutants reveal shared and specific functions in the regulation of flowering and shade-avoidance pathways. BMC Plant Biol. 2016, 16, 141. [Google Scholar] [CrossRef]
  50. Sun, F.; Niu, Y.; Song, T.; Han, B.; Liu, Z.; You, W.; Wang, P.; Su, P. Comparative transcriptome analysis reveals genetic mechanism for flowering response in two wheat (Triticum aestivum L.) cultivars. Russ. J. Genet. 2023, 59, 9–18. [Google Scholar] [CrossRef]
  51. Dong, X.; Li, Y.; Guan, Y.; Wang, S.; Luo, H.; Li, X.; Li, H.; Zhang, Z. Auxin-induced AUXIN RESPONSE FACTOR4 activates APETALA1 and FRUITFULL to promote flowering in woodland strawberry. Hortic. Res. 2021, 8, 115. [Google Scholar] [CrossRef]
  52. Su, P.; Sui, C.; Wang, S.; Liu, X.; Zhang, G.; Sun, H.; Wan, K.; Yan, J.; Guo, S. Genome-wide evolutionary analysis of AUX/IAA gene family in wheat identifies a novel gene TaIAA15-1A regulating flowering time by interacting with ARF. Int. J. Biol. Macromol. 2023, 227, 285–296. [Google Scholar] [CrossRef] [PubMed]
  53. Zhao, Z.; Chen, T.; Yue, J.; Pu, N.; Liu, J.; Luo, L.; Huang, M.; Guo, T.; Xiao, W. Small Auxin Up RNA 56 (SAUR56) regulates heading date in rice. Mol. Breed. 2023, 43, 62. [Google Scholar] [CrossRef] [PubMed]
  54. Wang, F.; Gao, Y.; Liu, Y.; Zhang, X.; Gu, X.; Ma, D.; Zhao, Z.; Yuan, Z.; Xue, H.; Liu, H. BES1-regulated BEE1 controls photoperiodic flowering downstream of blue light signaling pathway in Arabidopsis. New Phytol. 2019, 223, 1407–1419. [Google Scholar] [CrossRef]
  55. Fukazawa, J.; Ohashi, Y.; Takahashi, R.; Nakai, K.; Takahashi, Y. DELLA degradation by gibberellin promotes flowering via GAF1-TPR-dependent repression of floral repressors in Arabidopsis. Plant Cell 2021, 33, 2258–2272. [Google Scholar] [CrossRef] [PubMed]
  56. Zhang, C.; Jian, M.; Li, W.; Yao, X.; Tan, C.; Qian, Q.; Hu, Y.; Liu, X.; Hou, X. Gibberellin signaling modulates flowering via the DELLA-BRAHMA-NF-YC module in Arabidopsis. Plant Cell 2023, 35, 3470–3484. [Google Scholar] [CrossRef]
  57. Ogawara, T.; Higashi, K.; Kamada, H.; Ezura, H. Ethylene advances the transition from vegetative growth to flowering in Arabidopsis thaliana. J. Plant Physiol. 2003, 160, 1335–1340. [Google Scholar] [CrossRef]
  58. Li, Y.; Wu, Q.; Huang, X.; Liu, S.; Zhang, H.; Zhang, Z.; Sun, G. Molecular cloning and characterization of four genes encoding ethylene receptors associated with pineapple (Ananas comosus L.) flowering. Front. Plant Sci. 2016, 7, 710. [Google Scholar] [CrossRef]
  59. Bodson, M. Changes in the carbohydrate content of the leaf and the apical bud of Sinapis during transition to flowering. Planta 1977, 135, 19–23. [Google Scholar] [CrossRef]
  60. Serrano, G.; Herrera-Palau, R.; Romero, J.M.; Serrano, A.; Coupland, G.; Valverde, F. Chlamydomonas CONSTANS and the evolution of plant photoperiodic signaling. Curr. Biol. 2009, 19, 359–368. [Google Scholar] [CrossRef]
  61. Wahl, V.; Ponnu, J.; Schlereth, A.; Arrivault, S.; Langenecker, T.; Franke, A.; Feil, R.; Lunn, J.E.; Stitt, M.; Schmid, M. Regulation of flowering by trehalose-6-phosphate signaling in Arabidopsis thaliana. Science 2013, 339, 704–707. [Google Scholar] [CrossRef] [PubMed]
  62. Fan, M.; Miao, F.; Jia, H.; Li, G.; Powers, C.; Nagarajan, R.; Alderman, P.D.; Carver, B.F.; Ma, Z.; Yan, L. O-linked N-acetylglucosamine transferase is involved in fine regulation of flowering time in winter wheat. Nat. Commun. 2021, 12, 2303. [Google Scholar] [CrossRef] [PubMed]
  63. Liu, H.; Blankenship, R.E. On the interface of light-harvesting antenna complexes and reaction centers in oxygenic photosynthesis. Biochim. Biophys. Acta Bioenerg. 2019, 1860, 148079. [Google Scholar] [CrossRef]
  64. Peng, H.; Gao, J.; Song, X. Transcriptome analyses reveal photosynthesis-related genes involved in chloroplast development of the EMS-induced maize mutant. Plant Biotechnol. Rep. 2022, 16, 565–578. [Google Scholar] [CrossRef]
  65. Novoderezhkin, V.I.; Croce, R. The location of the low-energy states in Lhca1 favors excitation energy transfer to the core in the plant PSI-LHCI supercomplex. Photosynth. Res. 2023, 156, 59–74. [Google Scholar] [CrossRef]
  66. Li, H.; He, X.; Gao, Y.; Liu, W.; Song, J.; Zhang, J. Integrative analysis of transcriptome, proteome, and phosphoproteome reveals potential roles of photosynthesis antenna proteins in response to brassinosteroids signaling in maize. Plants 2023, 12, 1290. [Google Scholar] [CrossRef]
  67. Murphy, R.L.; Klein, R.R.; Morishige, D.T.; Brady, J.A.; Rooney, W.L.; Miller, F.R.; Dugas, D.V.; Klein, P.E.; Mullet, J.E. Coincident light and clock regulation of pseudoresponse regulator protein 37 (PRR37) controls photoperiodic flowering in sorghum. Proc. Natl. Acad. Sci. USA 2011, 108, 16469–16474. [Google Scholar] [CrossRef] [PubMed]
  68. Nasution, K.; Satyawan, D.; Yunus, M.; Dewi, A.; Melati, P.; Maryono, M.; Dwimahyani, I.; Enggarini, W.; Sobrizal, S. Detection of genomic loci associated with days to heading in tropical japonica rice through QTL-seq. Czech J. Genet. Plant Breed. 2025, 61, 23–30. [Google Scholar] [CrossRef]
  69. Zhang, H.; Wang, L.; Xie, Y.; Hao, L.; Wang, Z.; Yi, C.; Guo, H.; Gan, Y.; Xiang, G.; Yan, Z.; et al. QTL mapping for heading date and plant height using a RIL population in rice in different photoperiod environments. Czech J. Genet. Plant Breed. 2024, 60, 119–125. [Google Scholar] [CrossRef]
  70. Kojima, S.; Takahashi, Y.; Kobayashi, Y.; Monna, L.; Sasaki, T.; Araki, T.; Yano, M. Hd3a, a rice ortholog of the Arabidopsis FT gene, promotes transition to flowering downstream of Hd1 under short-day conditions. Plant Cell Physiol. 2002, 43, 1096–1105. [Google Scholar] [CrossRef]
  71. Zhu, Y.; Fan, Y.; Wang, K.; Huang, D.; Liu, W.; Ying, J.; Zhuang, J. Rice Flowering Locus T 1 plays an important role in heading date influencing yield traits in rice. Sci. Rep. 2017, 7, 4918. [Google Scholar] [CrossRef] [PubMed]
  72. Wu, W.; Zhang, Y.; Zhang, M.; Zhan, X.; Shen, X.; Yu, P.; Chen, D.; Liu, Q.; Sinumporn, S.; Hussain, K.; et al. The rice CONSTANS-like protein OsCOL15 suppresses flowering by promoting Ghd7 and repressing RID1. Biochem. Biophys. Res. Commun. 2018, 495, 1349–1355. [Google Scholar] [CrossRef] [PubMed]
  73. Liu, H.; Gu, F.; Dong, S.; Liu, W.; Wang, H.; Chen, Z.; Wang, J. CONSTANS-like 9 (COL9) delays the flowering time in Oryza sativa by repressing the Ehd1 pathway. Biochem. Biophys. Res. Commun. 2016, 479, 173–178. [Google Scholar] [CrossRef]
  74. Ridge, S.; Sussmilch, F.C.; Hecht, V.; Vander Schoor, J.K.; Lee, R.; Aubert, G.; Burstin, J.; Macknight, R.C.; Weller, J.L. Identification of LATE BLOOMER2 as a CYCLING DOF FACTOR Homolog reveals conserved and divergent features of the flowering response to photoperiod in Pea. Plant Cell 2016, 28, 2545–2559. [Google Scholar] [CrossRef] [PubMed]
  75. Sharma, N. Role of bHLH93 in Controlling Flowering Time in Arabidopsis thaliana. Ph.D. Thesis, The University of Texas at Austin, Austin, TX, USA, 2011. [Google Scholar]
  76. Sharma, N.; Xin, R.; Kim, D.H.; Sung, S.; Lange, T.; Huq, E. NO FLOWERING IN SHORT DAY (NFL) is a bHLH transcription factor that promotes flowering specifically under short-day conditions in Arabidopsis. Development 2016, 143, 682–690. [Google Scholar]
  77. Bhagat, P.K.; Verma, D.; Sharma, D.; Sinha, A.K. HY5 and ABI5 transcription factors physically interact to fine tune light and ABA signaling in Arabidopsis. Plant Mol. Biol. 2021, 107, 117–127. [Google Scholar] [CrossRef]
  78. Becker, A.; Theissen, G. The major clades of MADS-box genes and their role in the development and evolution of flowering plants. Mol. Phylogenet. Evol. 2003, 29, 464–489. [Google Scholar] [CrossRef]
  79. Nam, J.; DePamphilis, C.W.; Ma, H.; Nei, M. Antiquity and evolution of the MADS-box gene family controlling flower development in plants. Mol. Biol. Evol. 2003, 20, 1435–1447. [Google Scholar] [CrossRef]
  80. Chen, L.; Yan, Y.; Ke, H.; Zhang, Z.; Meng, C.; Ma, L.; Sun, Z.; Chen, B.; Liu, Z.; Wang, G.; et al. SEP-like genes of Gossypium hirsutum promote flowering via targeting different loci in a concentration-dependent manner. Front. Plant Sci. 2022, 13, 990221. [Google Scholar] [CrossRef]
  81. Wang, H.; Zhang, L.; Cai, Q.; Hu, Y.; Jin, Z.; Zhao, X.; Fan, W.; Huang, Q.; Luo, Z.; Chen, M.; et al. OsMADS32 interacts with PI-like proteins and regulates rice flower development. J. Integr. Plant Biol. 2015, 57, 504–513. [Google Scholar] [CrossRef]
  82. Liu, L.; Zhang, J.; Adrian, J.; Gissot, L.; Coupland, G.; Yu, D.; Turck, F. Elevated levels of MYB30 in the phloem accelerate flowering in Arabidopsis through the regulation of FLOWERING LOCUS T. PLoS ONE 2014, 9, e89799. [Google Scholar] [CrossRef] [PubMed]
  83. Zhang, L.; Liu, G.; Jia, J.; Zhao, G.; Xia, C.; Zhang, L.; Li, F.; Zhang, Q.; Dong, C.; Gao, S.; et al. The wheat MYB-related transcription factor TaMYB72 promotes flowering in rice. J. Integr. Plant Biol. 2016, 58, 701–704. [Google Scholar] [CrossRef] [PubMed]
  84. Wu, L.; Xie, Z.; Li, D.; Chen, Y.; Xia, C.; Kong, X.; Liu, X.; Zhang, L. TaMYB72 directly activates the expression of TaFT to promote heading and enhance grain yield traits in wheat (Triticum aestivum L.). J. Integr. Plant Biol. 2024, 66, 1266–1269. [Google Scholar] [CrossRef]
  85. Zhang, H.; Cui, X.; Guo, Y.; Luo, C.; Zhang, L. Picea wilsonii transcription factor NAC2 enhanced plant tolerance to abiotic stress and participated in RFCP1-regulated flowering time. Plant Mol. Biol. 2018, 98, 471–493. [Google Scholar] [CrossRef]
  86. Wu, G.; Poethig, R.S. Temporal regulation of shoot development in Arabidopsis thaliana by miR156 and its target SPL3. Development 2006, 133, 3539–3547. [Google Scholar] [CrossRef]
  87. Yamaguchi, A.; Wu, M.; Yang, L.; Wu, G.; Poethig, R.S.; Wagner, D. The microRNA-regulated SBP-Box transcription factor SPL3 is a direct upstream activator of LEAFY, FRUITFULL, and APETALA1. Dev. Cell 2009, 17, 268–278. [Google Scholar] [CrossRef] [PubMed]
  88. Yu, Y.; Liu, Z.; Wang, L.; Kim, S.G.; Seo, P.J.; Qiao, M.; Wang, N.; Li, S.; Cao, X.; Park, C.M.; et al. WRKY71 accelerates flowering via the direct activation of FLOWERING LOCUS T and LEAFY in Arabidopsis thaliana. Plant J. 2016, 85, 96–106. [Google Scholar] [CrossRef]
  89. Hwang, Y.H.; Kim, S.K.; Lee, K.C.; Chung, Y.S.; Lee, J.H.; Kim, J.K. Functional conservation of rice OsNF-YB/YC and Arabidopsis AtNF-YB/YC proteins in the regulation of flowering time. Plant Cell Rep. 2016, 35, 857–865. [Google Scholar] [CrossRef]
  90. Wang, R.; Zhu, L.; Zhang, Y.; Fan, J.; Li, L. Genome-wide analysis of poplar NF-YB gene family and identified PtNF-YB1 important in regulate flowering timing in transgenic plants. BMC Plant Biol. 2019, 19, 251. [Google Scholar] [CrossRef]
  91. Han, F.; Lamb, J.; Birchler, J.A. High frequency of centromere inactivation resulting in stable dicentric chromosomes of maize. Proc. Natl. Acad. Sci. USA 2006, 103, 3238–3243. [Google Scholar] [CrossRef]
  92. Cui, J.; Wang, Y.; Wang, H. Differentiation and formation of winter wheat spikes. In The Spike of Wheat; Cui, J., Guo, T., Eds.; China Agriculture Press: Beijing, China, 2008; pp. 22–33. [Google Scholar]
  93. Guo, W.; Fan, G. Wheat. In Treatise on Crop Cultivation; Yang, W., Tu, N., Eds.; China Agriculture Press: Beijing, China, 2011; pp. 77–78. [Google Scholar]
  94. Liu, Z.; Niu, F.; Yuan, S.; Feng, S.; Li, Y.; Lu, F.; Zhang, T.; Bai, J.; Zhao, C.; Zhang, L. Comparative transcriptome analysis reveals key insights into fertility conversion in the thermo-sensitive cytoplasmic male sterile wheat. Int. J. Mol. Sci. 2022, 23, 14354. [Google Scholar] [CrossRef] [PubMed]
  95. Kim, D.; Langmead, B.; Salzberg, S.L. HISAT: A fast spliced aligner with low memory requirements. Nat. Methods 2015, 12, 357–360. [Google Scholar] [CrossRef] [PubMed]
  96. Pertea, M.; Pertea, G.M.; Antonescu, C.M.; Chang, T.; Mendell, J.T.; Salzberg, S.L. StringTie enables improved reconstruction of a transcriptome from RNA-seq reads. Nat. Biotechnol. 2015, 33, 290–295. [Google Scholar] [CrossRef]
  97. Love, M.I.; Huber, W.; Anders, S. Moderated estimation of fold change and dispersion for RNA-seq data with DESeq2. Genome Biol. 2014, 15, 550. [Google Scholar] [CrossRef] [PubMed]
  98. Zhang, Y.; Jiao, C.; Sun, H.; Rosli, H.; Pombo, M.A.; Zhang, P.; Banf, M.; Dai, X.; Martin, G.B.; Giovannoni, J.J.; et al. iTAK: A program for genome-wide prediction and classification of plant transcription factors, transcriptional regulators, and protein kinases. Mol. Plant 2016, 9, 1667–1670. [Google Scholar] [CrossRef]
  99. Yang, X.; Jiang, Y.; Yu, X.; Zhang, H.; Wang, Y.; Guan, F.; Long, L.; Li, H.; Li, W.; Jiang, Q.; et al. Fine mapping and transcriptome sequencing reveal candidate genes conferring all-stage resistance to stripe rust on chromosome arm 1AL in Chinese wheat landrace AS1676. Crop J. 2023, 11, 1501–1511. [Google Scholar] [CrossRef]
  100. Livak, K.J.; Schmittgen, T.D. Analysis of relative gene expression data using real-time quantitative PCR and the 2−ΔΔCT method. Methods 2001, 25, 402–408. [Google Scholar] [CrossRef]
Figure 1. GISH and FISH identification of wheat–P. huashanica 7Ns disomic addition line 18-1-5. (a) P. huashanica genomic DNA labeled in red as a GISH probe. (b,c) Oligo-pTa535 (red), Oligo-pSc119.2 (green), Oligo-pSc200 (red), Oligo-pTa71A-2 (green), and Oligo-44 (yellow) as FISH probes. Arrows indicate P. huashanica chromosome 7Ns in 18-1-5. Scale bars: 10 μm.
Plants 14 02077 g001
Figure 2. Investigation of heading and maturity times for wheat–P. huashanica 7Ns disomic addition line 18-1-5 and its wheat parents. (a,b) Statistical analysis and phenotype visualization of heading time under field conditions. (c,d) Statistical analysis and phenotype visualization of maturity time under field conditions. ** p < 0.01, two-tailed t-test. Error bars represent the standard deviation. Scale bars: 30 cm.
Plants 14 02077 g002
Figure 3. Dynamic observations of spike differentiation for 18-1-5 and its wheat parents under field conditions. (ap) Microscope visualization showing the different spike development stages at 24, 34, 43, 53, 60, 67, 74, 82, 89, 96, 102, 110, 118, 126, 135, and 143 days after sowing, respectively. The sowing date for all the materials was 21 October 2022. The red arrow indicates the differences in spike development between 18-1-5 and its wheat parents. Scale bars: (al) 0.5 mm; (mo) 2 mm; (p) 0.5 cm.
Plants 14 02077 g003
Figure 4. Distribution of DEGs at four different developmental stages. (a) The number of DEGs in each comparison group. (b) Venn diagram of upregulated DEGs in each comparison group. (c) Venn diagram of downregulated DEGs in each comparison group. The capital letter “C” represents 18-1-5, and “D” indicates CS and CSph2b. S1, S2, S3, and S4 represent the double-ridge stage, the glume primordia differentiation stage, the floret primordia differentiation stage, and the stamen and pistil differentiation stage, respectively.
Plants 14 02077 g004
Figure 5. GO enrichment analysis of DEGs in each comparison group. (a) The most significantly enriched GO terms of C-S1 vs. D-S1. (b) The most significantly enriched GO terms of C-S2 vs. D-S2. (c) The most significantly enriched GO terms of C-S3 vs. D-S3. (d) The most significantly enriched GO terms of C-S4 vs. D-S4. The capital letter “C” represents 18-1-5, and “D” indicates CS and CSph2b. S1, S2, S3, and S4 represent the double-ridge stage, the glume primordia differentiation stage, the floret primordia differentiation stage, and the stamen and pistil differentiation stage, respectively.
Plants 14 02077 g005
Figure 6. KEGG enrichment analysis of DEGs in each comparison group. (a) Top 20 KEGG enrichment scatter plot of DEGs in C-S1 vs. D-S1. (b) Top 20 KEGG enrichment scatter plot of DEGs in C-S2 vs. D-S2. (c) Top 20 KEGG enrichment scatter plot of DEGs in C-S3 vs. D-S3. (d) Top 20 KEGG enrichment scatter plot of DEGs in C-S4 vs. D-S4. The capital letter “C” represents 18-1-5, and “D” indicates CS and CSph2b. S1, S2, S3, and S4 represent the double-ridge stage, the glume primordia differentiation stage, the floret primordia differentiation stage, and the stamen and pistil differentiation stage, respectively.
Plants 14 02077 g006
Figure 7. The expression level validation of fifteen DEGs using qRT-PCR. An empty histogram indicates that either RNA-seq could not detect the gene at this stage or that its expression level was low, with |log2(foldchange)| < 1. The capital letter “C” represents 18-1-5, and “D” indicates CS and CSph2b. S1, S2, S3, and S4 represent the double-ridge stage, the glume primordia differentiation stage, the floret primordia differentiation stage, and the stamen and pistil differentiation stage, respectively. Error bars represent the standard deviation.
Plants 14 02077 g007
Table 1. DEGs related to spike development in important regulatory pathways.
KEGG PathwaysGene IDFunctional AnnotationC1 vs. D1C2 vs. D2C3 vs. D3C4 vs. D4
Plant hormone signal transductionTraesCS3A02G233000DELLA protein GAI3.04 ↑---
TraesCS3D02G220100DELLA protein GAI3.21 ↑---
Starch and sucrose metabolismTraesCS4A02G446700Sucrose synthase 1 (SUS1)6.33 ↑5.62 ↑3.53 ↑3.27 ↑
TraesCS2A02G161000Trehalose 6-phosphate phosphatase RA310.63 ↑---
TraesCS2A02G161100Trehalose 6-phosphate phosphatase RA322.77 ↑---
TraesCS2A02G161200Trehalose 6-phosphate phosphatase RA37.00 ↑-2.26 ↓-
TraesCS2B02G187100Trehalose 6-phosphate phosphatase RA33.17 ↑---
TraesCS2B02G187200Trehalose 6-phosphate phosphatase RA35.71 ↑---
TraesCS2D02G168100Trehalose 6-phosphate phosphatase RA310.49 ↑--2.29 ↓
TraesCS2D02G168200Trehalose 6-phosphate phosphatase RA33.66 ↑---
Photosynthetic antenna proteinsTraesCS7A02G227100Chlorophyll a/b-binding protein 1B-21, chloroplastic3.90 ↑---
TraesCS7B02G192500Chlorophyll a/b-binding protein 1B-21, chloroplastic5.49 ↑---
TraesCS7D02G227300Chlorophyll a/b-binding protein 1B-21, chloroplastic4.81 ↑---
Circadian rhythm—plantTraesCSU02G199500Two-component response regulator-like PRR3737.05 ↑8.16 ↑69.31 ↑4.75 ↑
TraesCSU02G221500Two-component response regulator-like PRR3747.40 ↑7.29 ↑73.61 ↑7.61 ↑
TraesCS3A02G143100Protein HEADING DATE 3A (Hd3a)4.77 ↑---
TraesCS3B02G162000Protein HEADING DATE 3A (Hd3a)13.85 ↑---
TraesCS3D02G144500Protein HEADING DATE 3A (Hd3a)8.87 ↑---
TraesCS2B02G365300Protein FLOWERING LOCUS T4.98 ↓---
TraesCS5A02G297300Protein FLOWERING LOCUS T5.41 ↓---
TraesCS6A02G286400Zinc finger protein CONSTANS-LIKE 102.73 ↑---
TraesCS4B02G045700Zinc finger protein CONSTANS-LIKE 167.03 ↑---
TraesCS7B02G113400Zinc finger protein CONSTANS-LIKE 162.23 ↑---
TraesCS7D02G209000Zinc finger protein CONSTANS-LIKE 16---3.42 ↓
TraesCS6D02G274100Zinc finger protein CONSTANS-LIKE 16--2.31 ↓-
TraesCS2D02G351900Zinc finger protein CONSTANS-LIKE 5--5.67 ↓-
TraesCS3D02G185500Cycling DOF factor 22.52 ↓---
TraesCS3A02G180600Cycling DOF factor 2--2.08 ↓-
TraesCS3B02G210300Cycling DOF factor 2---2.27 ↓
The values represent the FPKM multiple of up- or downregulated DEGs. “-” indicates that either RNA-seq could not detect the gene at this stage or that its expression level was low, with |log2(foldchange)| < 1. The arrows “↑” and “↓” indicate gene up-regulation and down-regulation, respectively. The capital letter “C” represents 18-1-5, and “D” indicates CS and CSph2b.
Table 2. The key transcription factor genes associated with spike development.
TFs FamilyGene NameGene IDC1 vs. D1C2 vs. D2C3 vs. D3C4 vs. D4
bHLHTabHLH25-5BTraesCS5B02G5184003.23 ↑---
TabHLH25TraesCSU02G0752003.99 ↑2.97 ↓--
TabHLH93TraesCS7A02G54330032.90 ↓10.54 ↓50.51 ↓111.88 ↓
bZIPTaHY5TraesCS3A02G1289002.07 ↑2.57 ↑--
TabZIP44TraesCS6B02G124700-3.29 ↓-4.02 ↑
MADS-boxTaSEP6-7ATraesCS7A02G12200031.03 ↑---
TaSEP6-7BTraesCS7B02G02080017.46 ↑---
TaSEP6-7DTraesCS7D02G1205008.30 ↑---
TaMADS32-3ATraesCS3A02G2844002.18 ↑---
TaMADS32-3BTraesCS3B02G3183002.36 ↑---
TaMADS32-3DTraesCS3D02G2842002.61 ↑---
MYBTaMYB94TraesCS2A02G157600--2.53 ↑2.76 ↑
TaMYB30TraesCS2B02G183100--2.16 ↑2.42 ↑
TaMYB44TraesCS6B02G201700--3.15 ↑3.63 ↑
NACTaNAC2-5ATraesCS5A02G4683006.48 ↑---
TaNAC2-5BTraesCS5B02G48090010.83 ↑---
TaNAC8TraesCS2D02G3365002.66 ↑1.52 ↑1.05 ↑3.66 ↑
SBPTaSPL17-7ATraesCS7A02G246500-2.48 ↑--
TaSPL17-7BTraesCS7B02G144900-2.51 ↑--
TaSPL17-7DTraesCS7D02G245200-2.83 ↑--
WRKYTaWRKY71-6ATraesCS6A02G1469004.28 ↑---
TaWRKY71-6BTraesCS6B02G1751005.86 ↑---
TaWRKY71-6DTraesCS6D02G1362005.94 ↑---
TaWRKY46TraesCS5B02G1838002.80 ↑---
TaWRKY11TraesCS2D02G431000-2.31 ↑--
TaWRKY24TraesCS3B02G379200---2.49 ↑
NF-YTaNF-YB5-3ATraesCS3A02G4571008.09 ↑---
TaNF-YB5-3DTraesCS3D02G45010024.10 ↑---
TaNF-YC6TraesCS5D02G265000---2.96 ↑
The values represent the FPKM multiple of up- or downregulated DEGs. “-” indicates that either RNA-seq could not detect the gene at this stage or that its expression level was low, with |log2(foldchange)| < 1. The arrows “↑” and “↓” indicate gene up-regulation and down-regulation, respectively. The capital letter “C” represents 18-1-5, and “D” indicates CS and CSph2b.
Disclaimer/Publisher’s Note: The statements, opinions and data contained in all publications are solely those of the individual author(s) and contributor(s) and not of MDPI and/or the editor(s). MDPI and/or the editor(s) disclaim responsibility for any injury to people or property resulting from any ideas, methods, instructions or products referred to in the content.

