
Characterization of a Unique Pair of Ferredoxin and Ferredoxin NADP+ Reductase Isoforms That Operates in Non-Photosynthetic Glandular Trichomes

Abstract
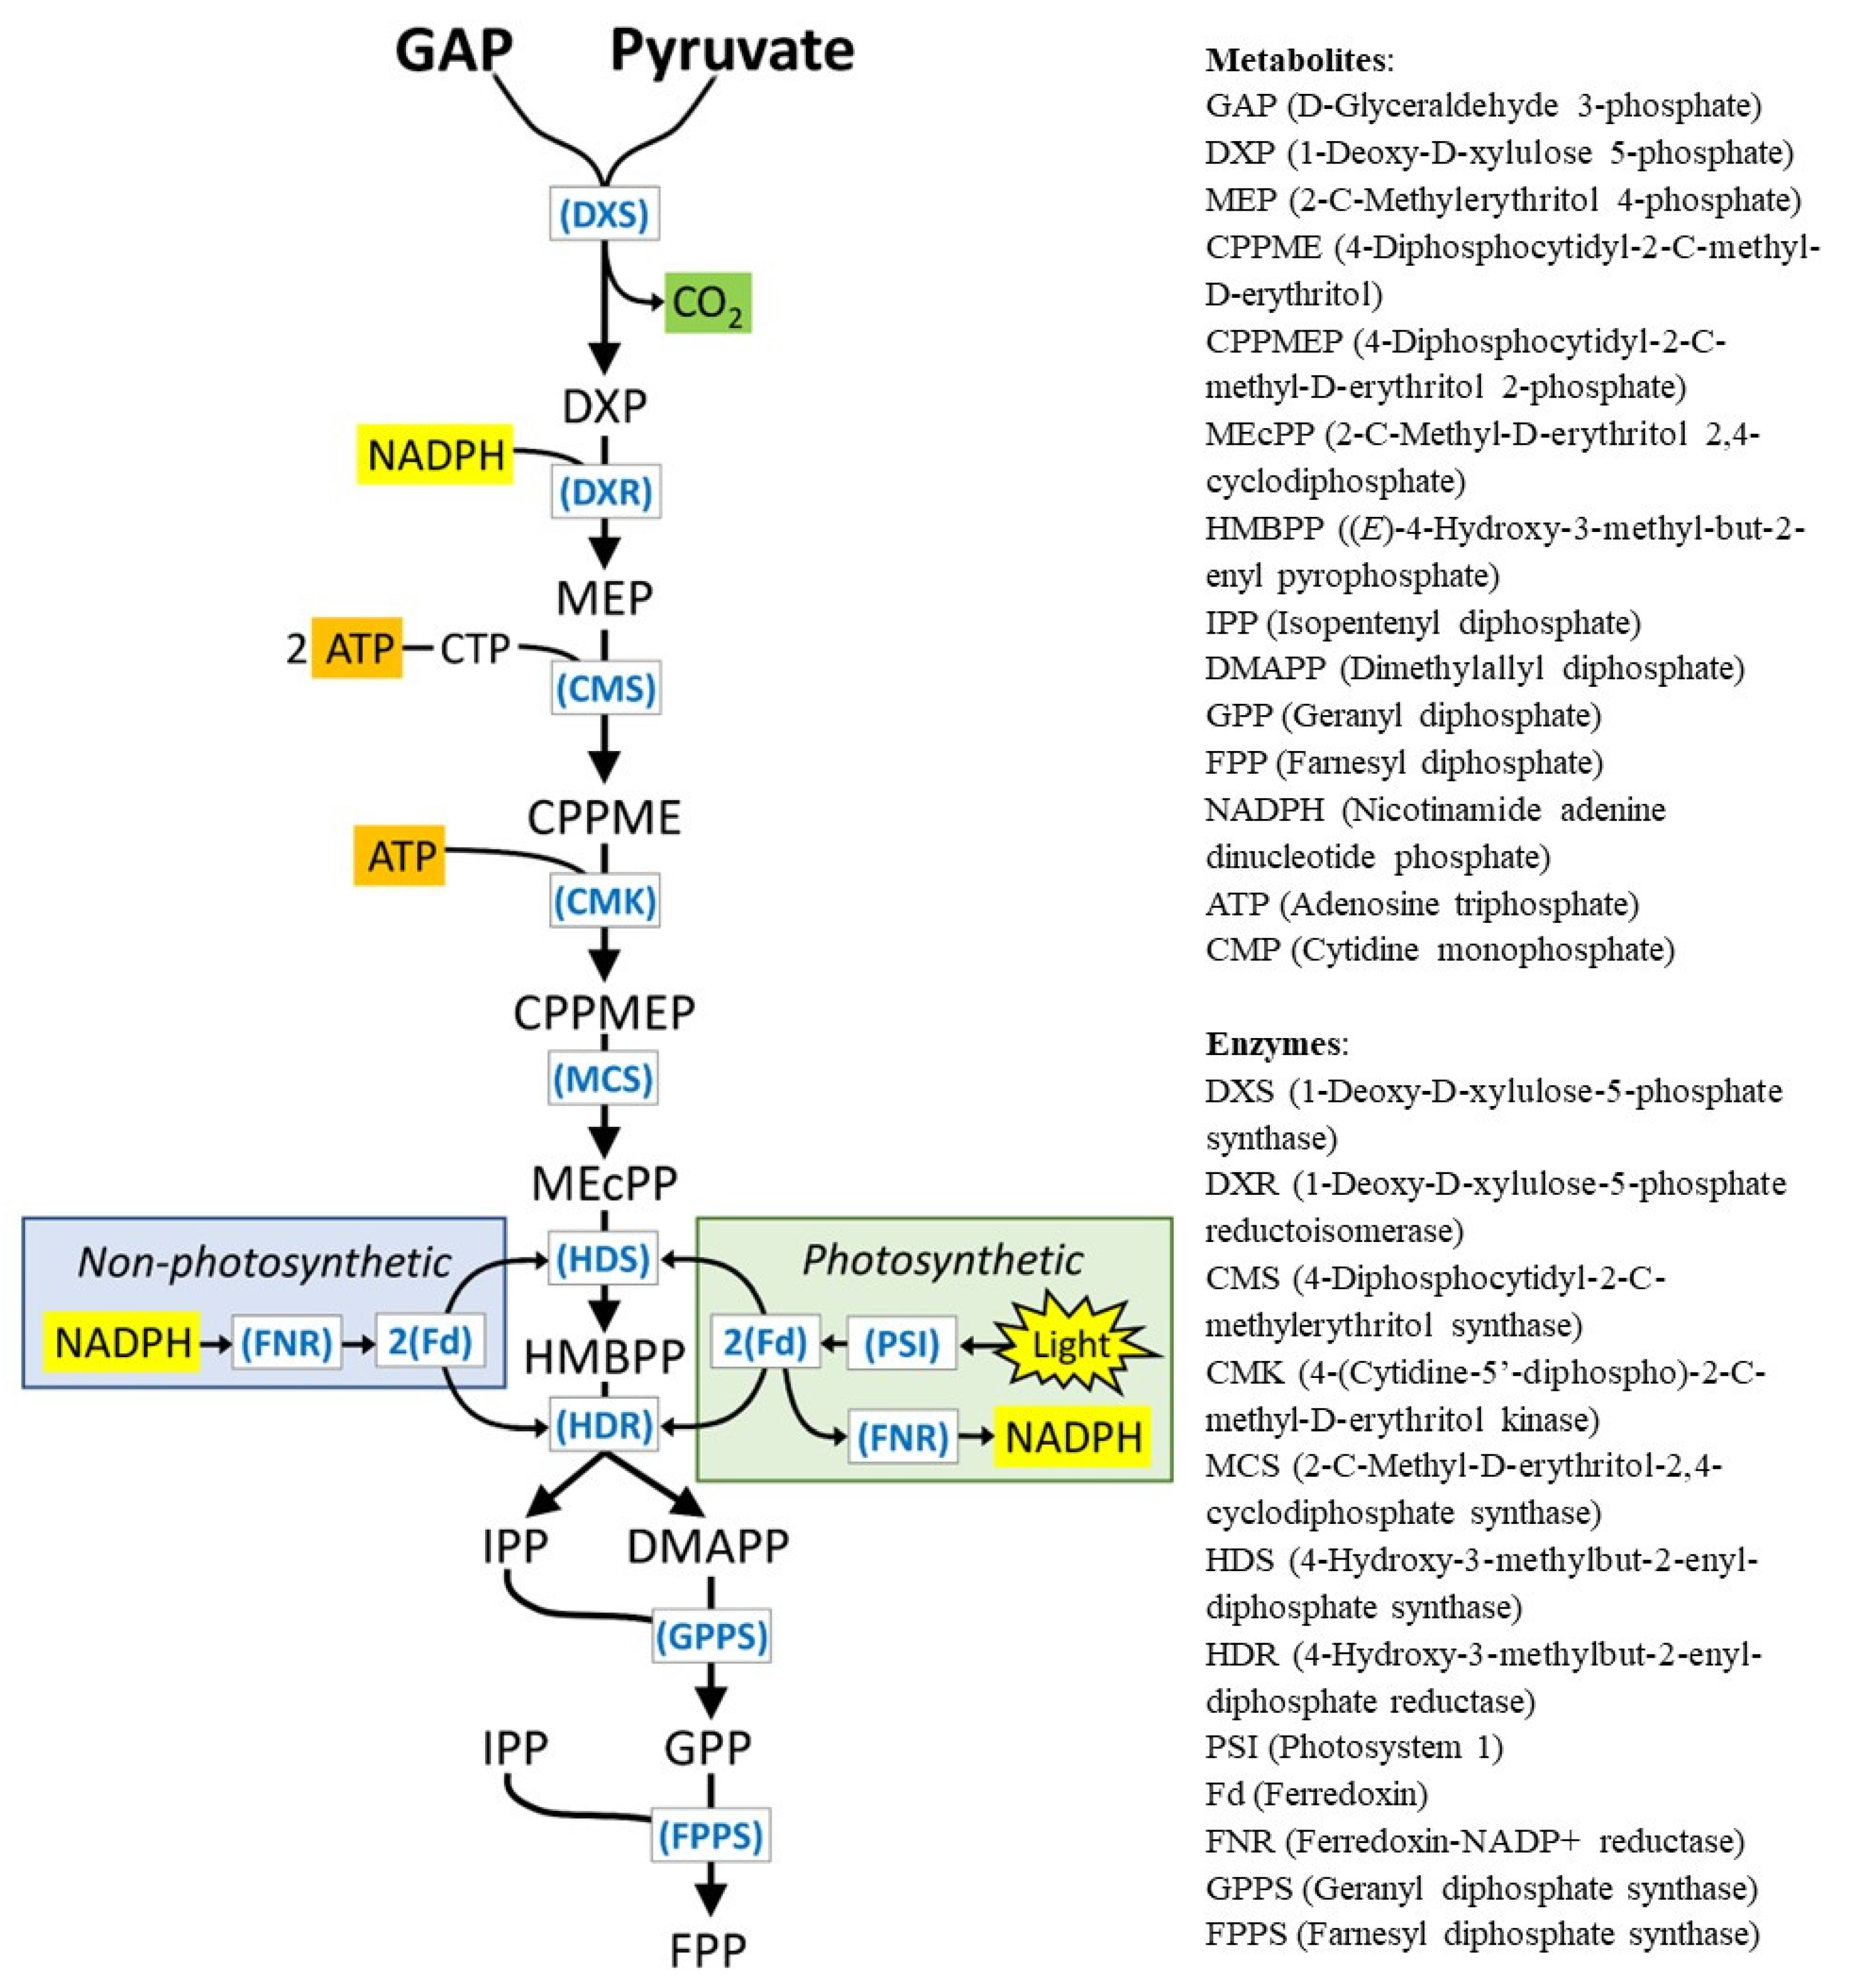
1. Introduction
2. Materials and Methods
2.1. Plant Growth Conditions
2.2. Cloning of Fd and FNR Genes
2.3. Heterologous Expression of Genes in E. coli and Purification of Recombinant Proteins
2.4. Spectral Analyses
2.5. Enzyme Assays
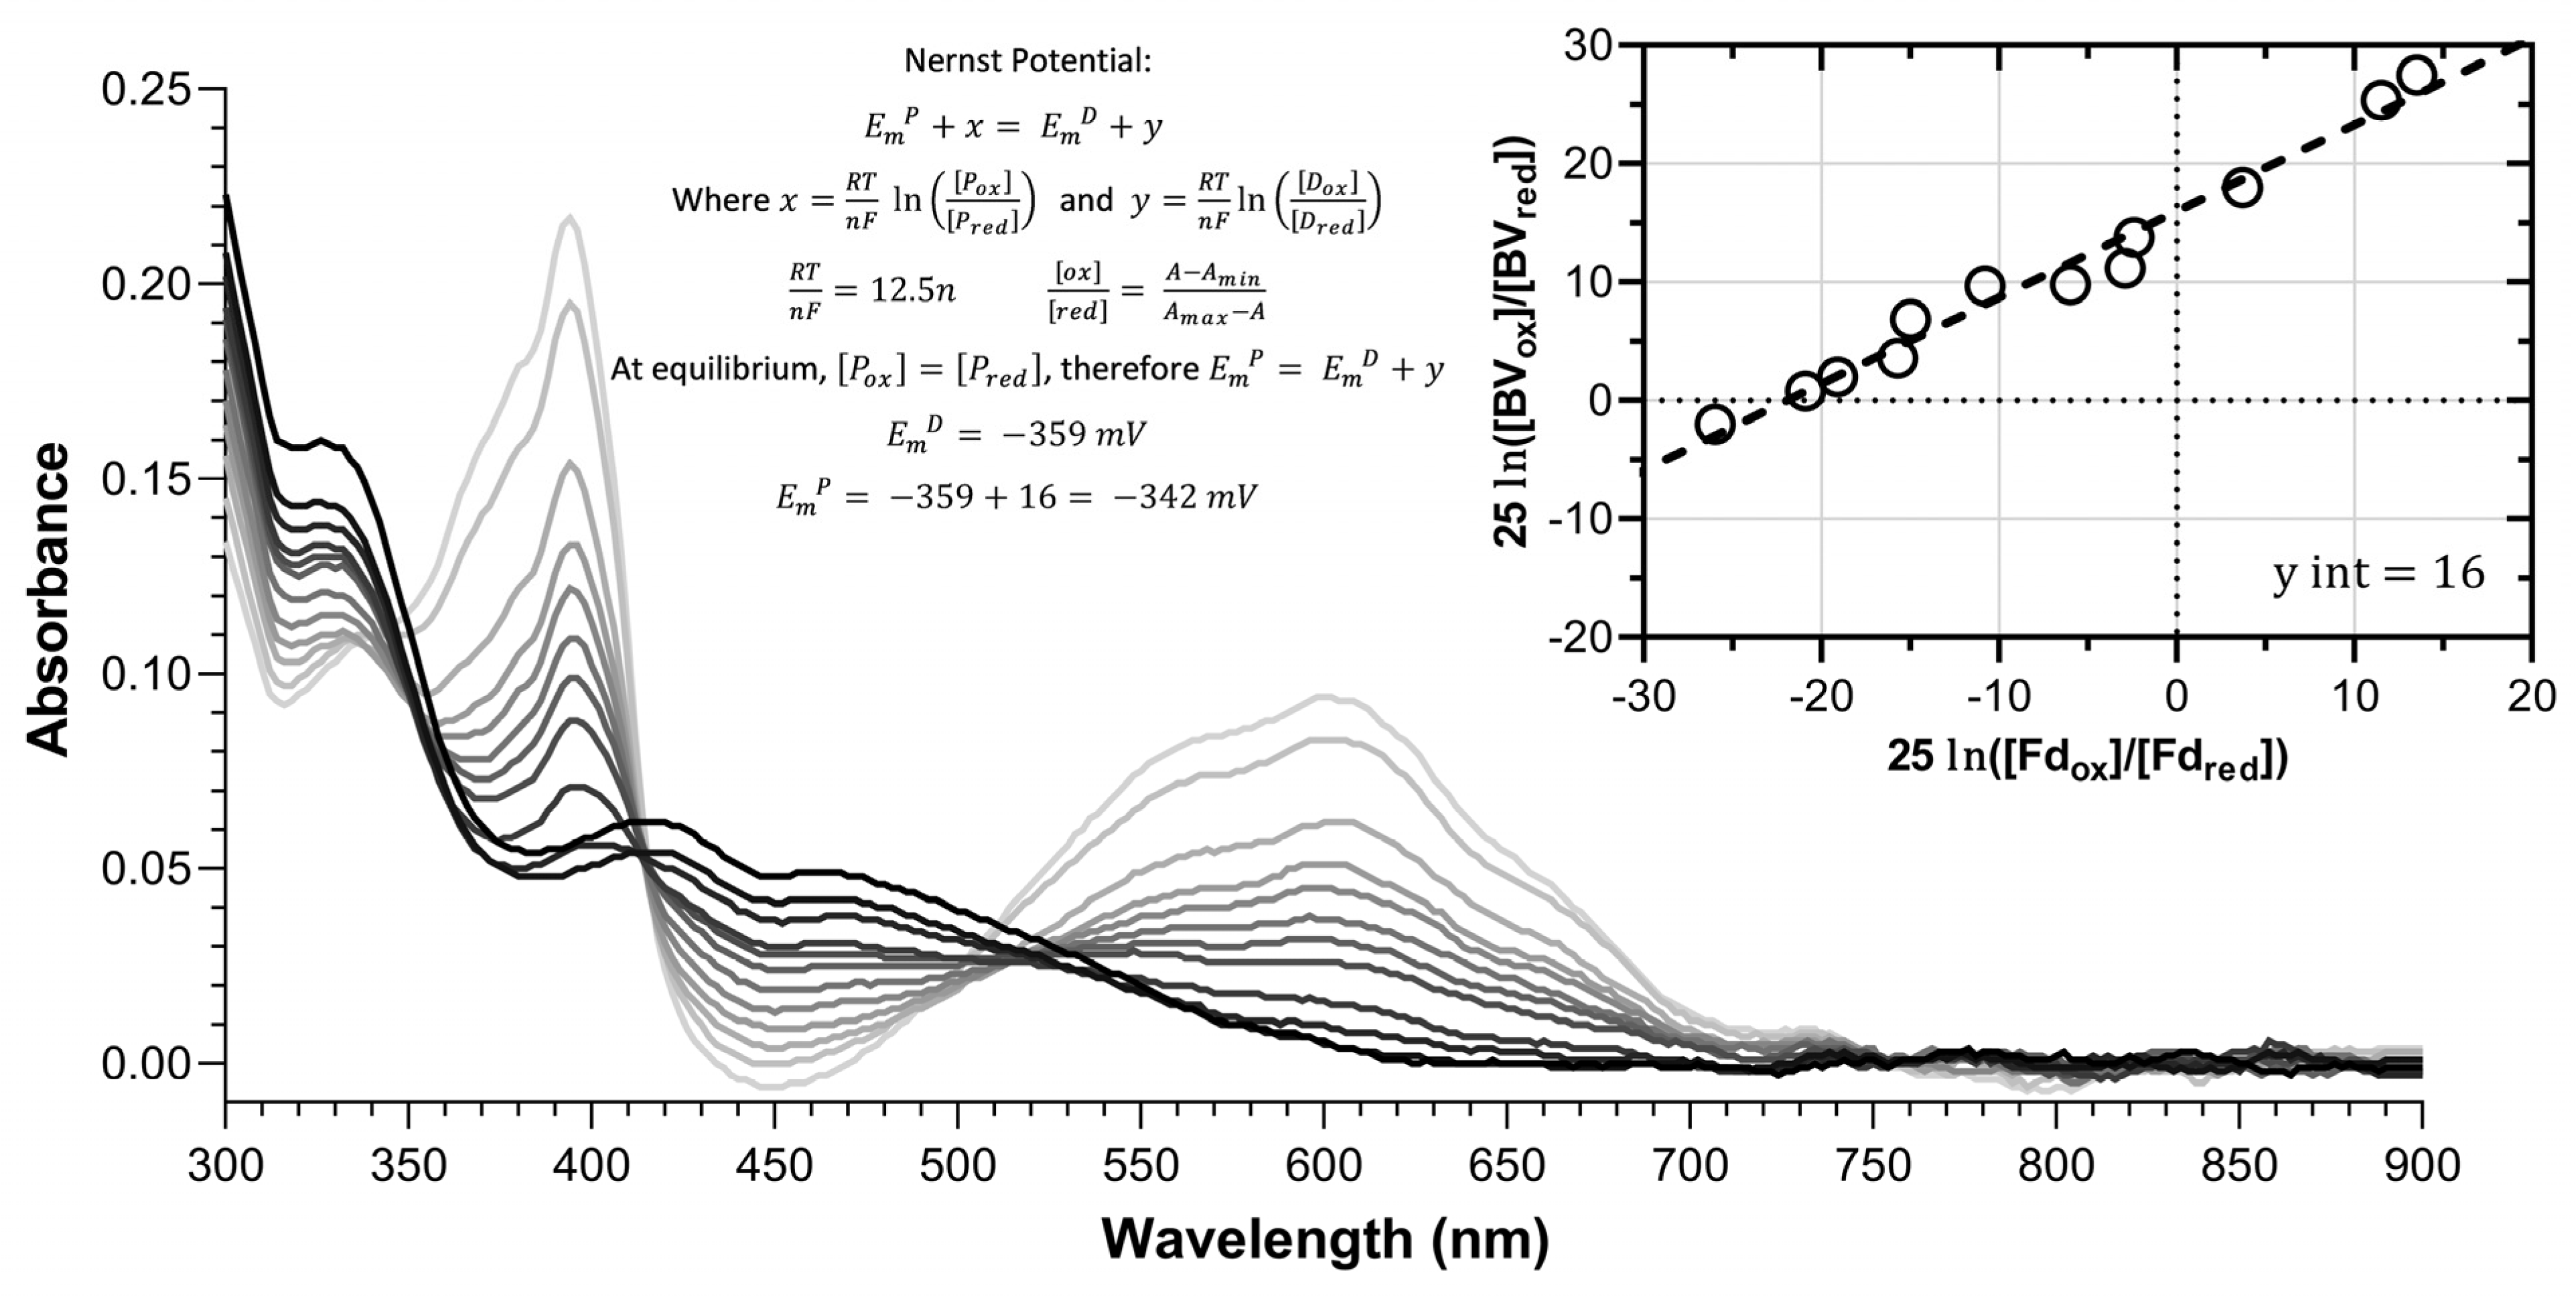
2.6. Photoreduction to Obtain Redox Potentials
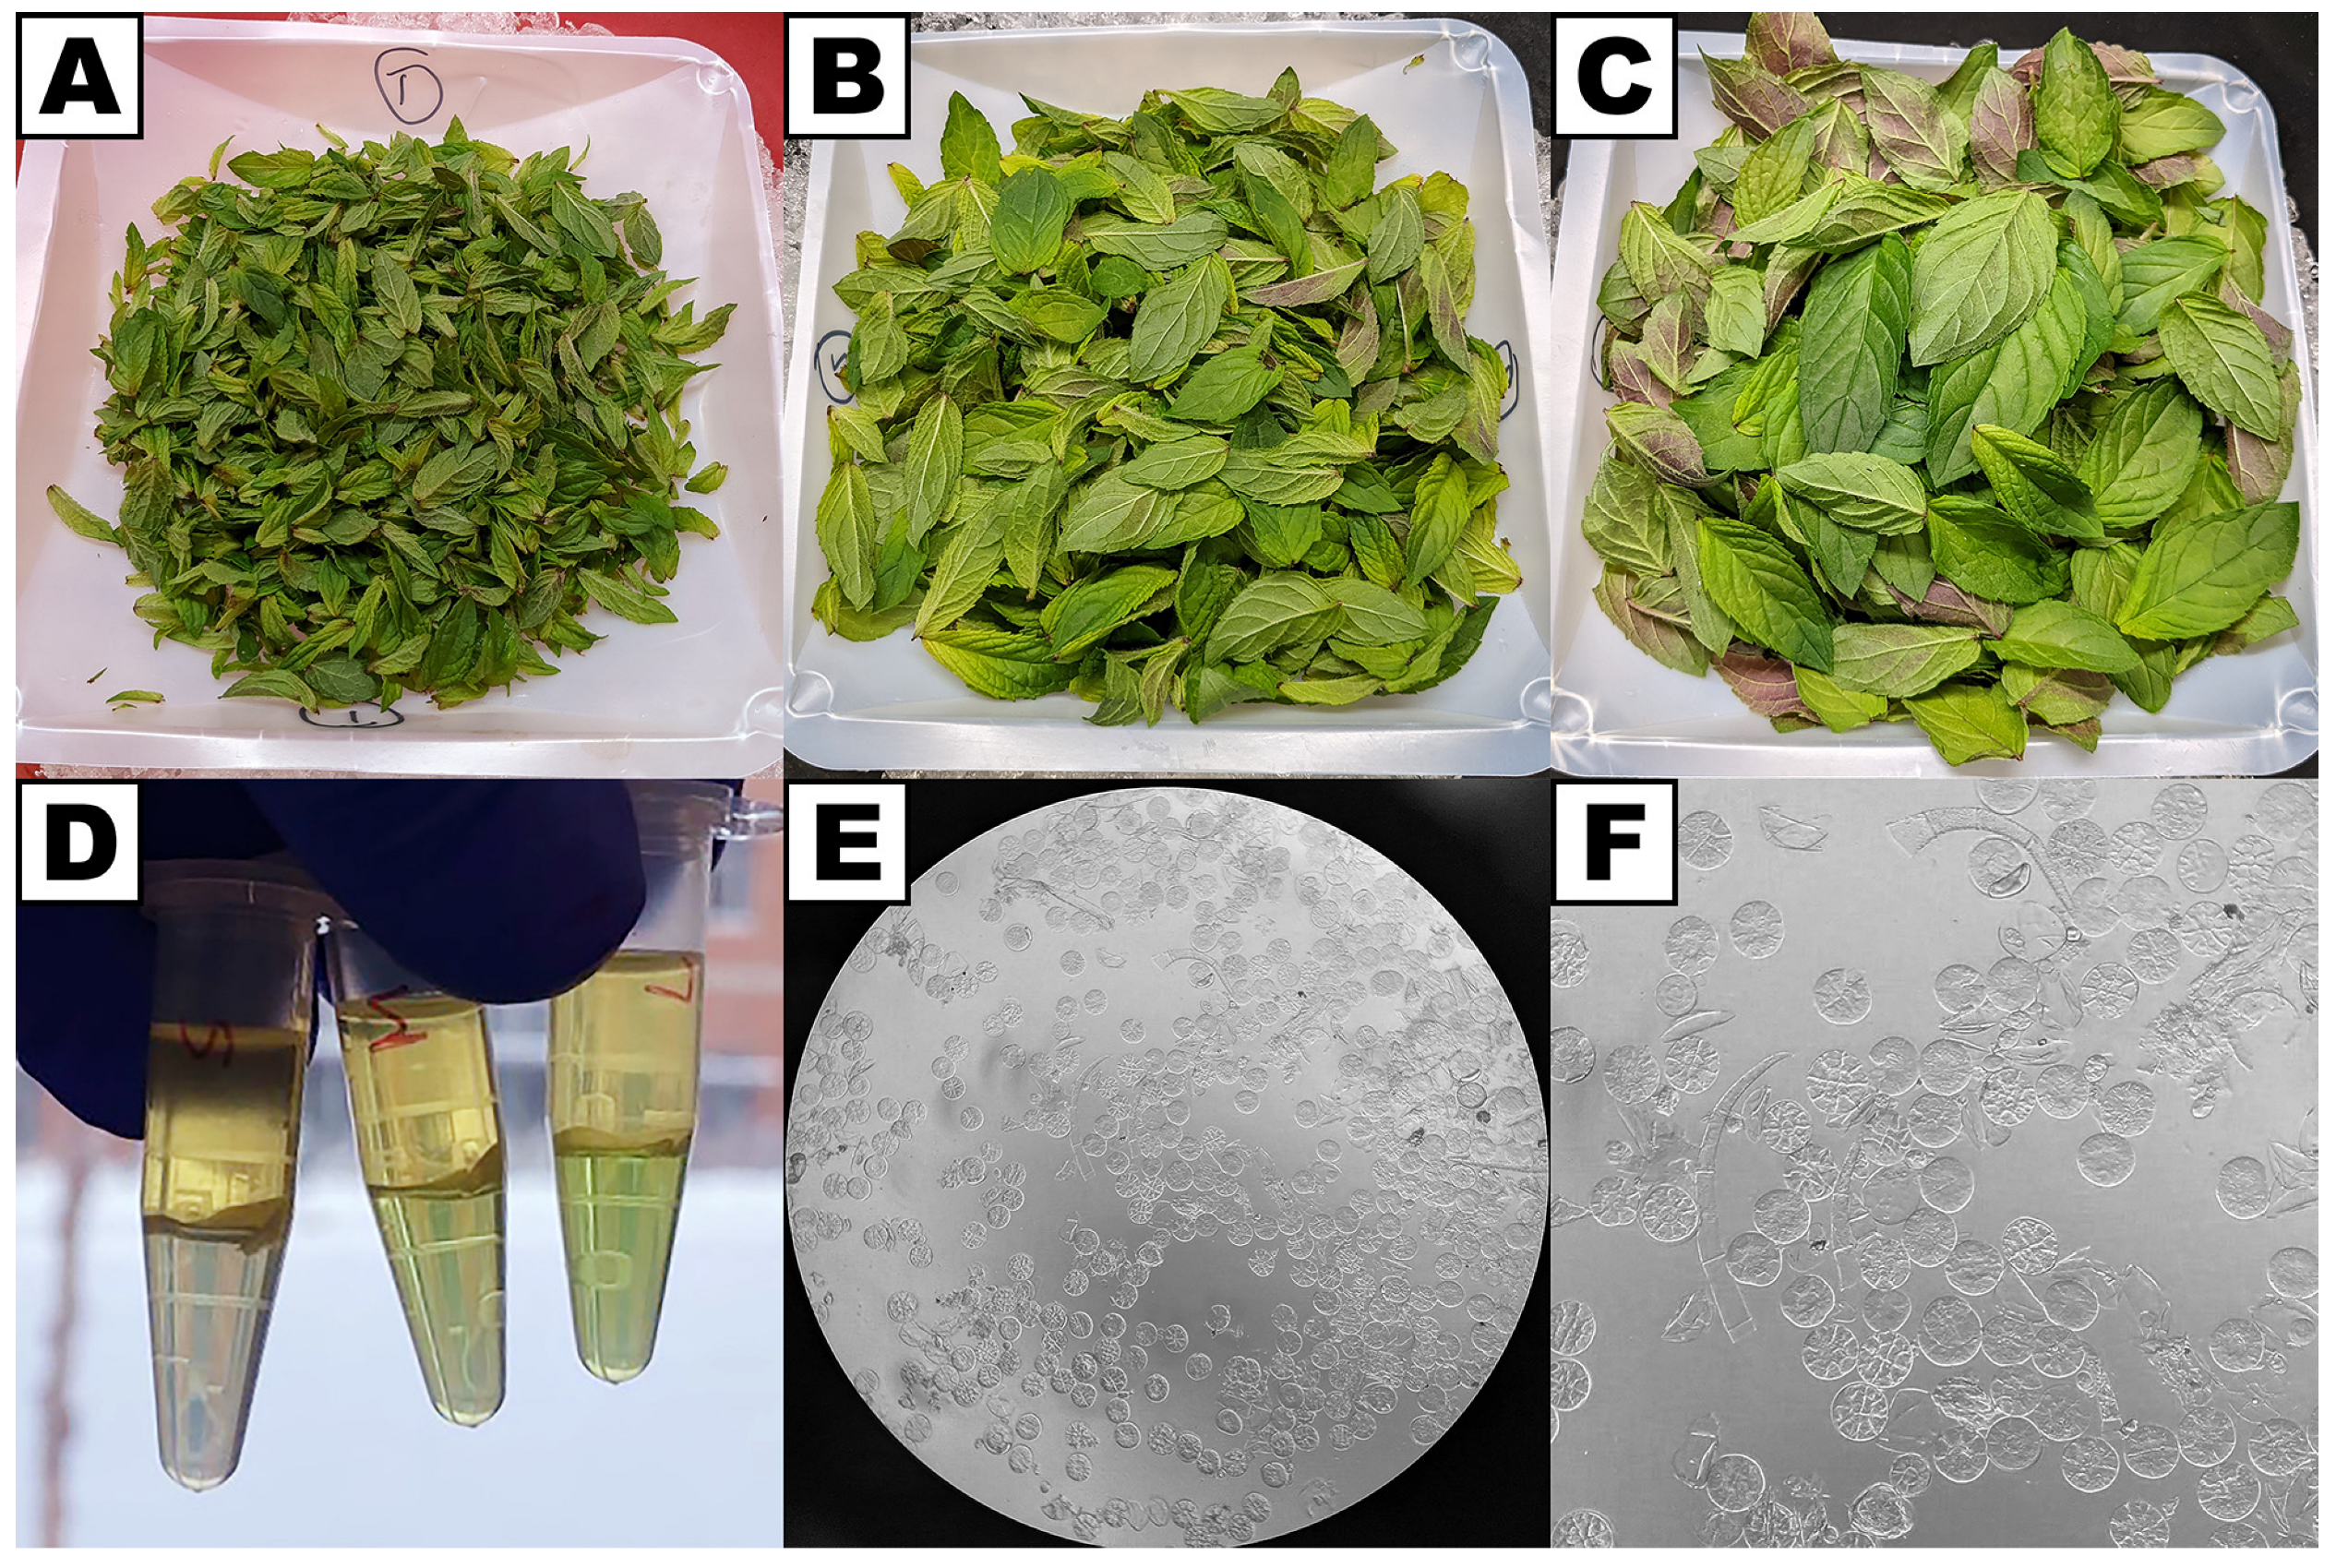
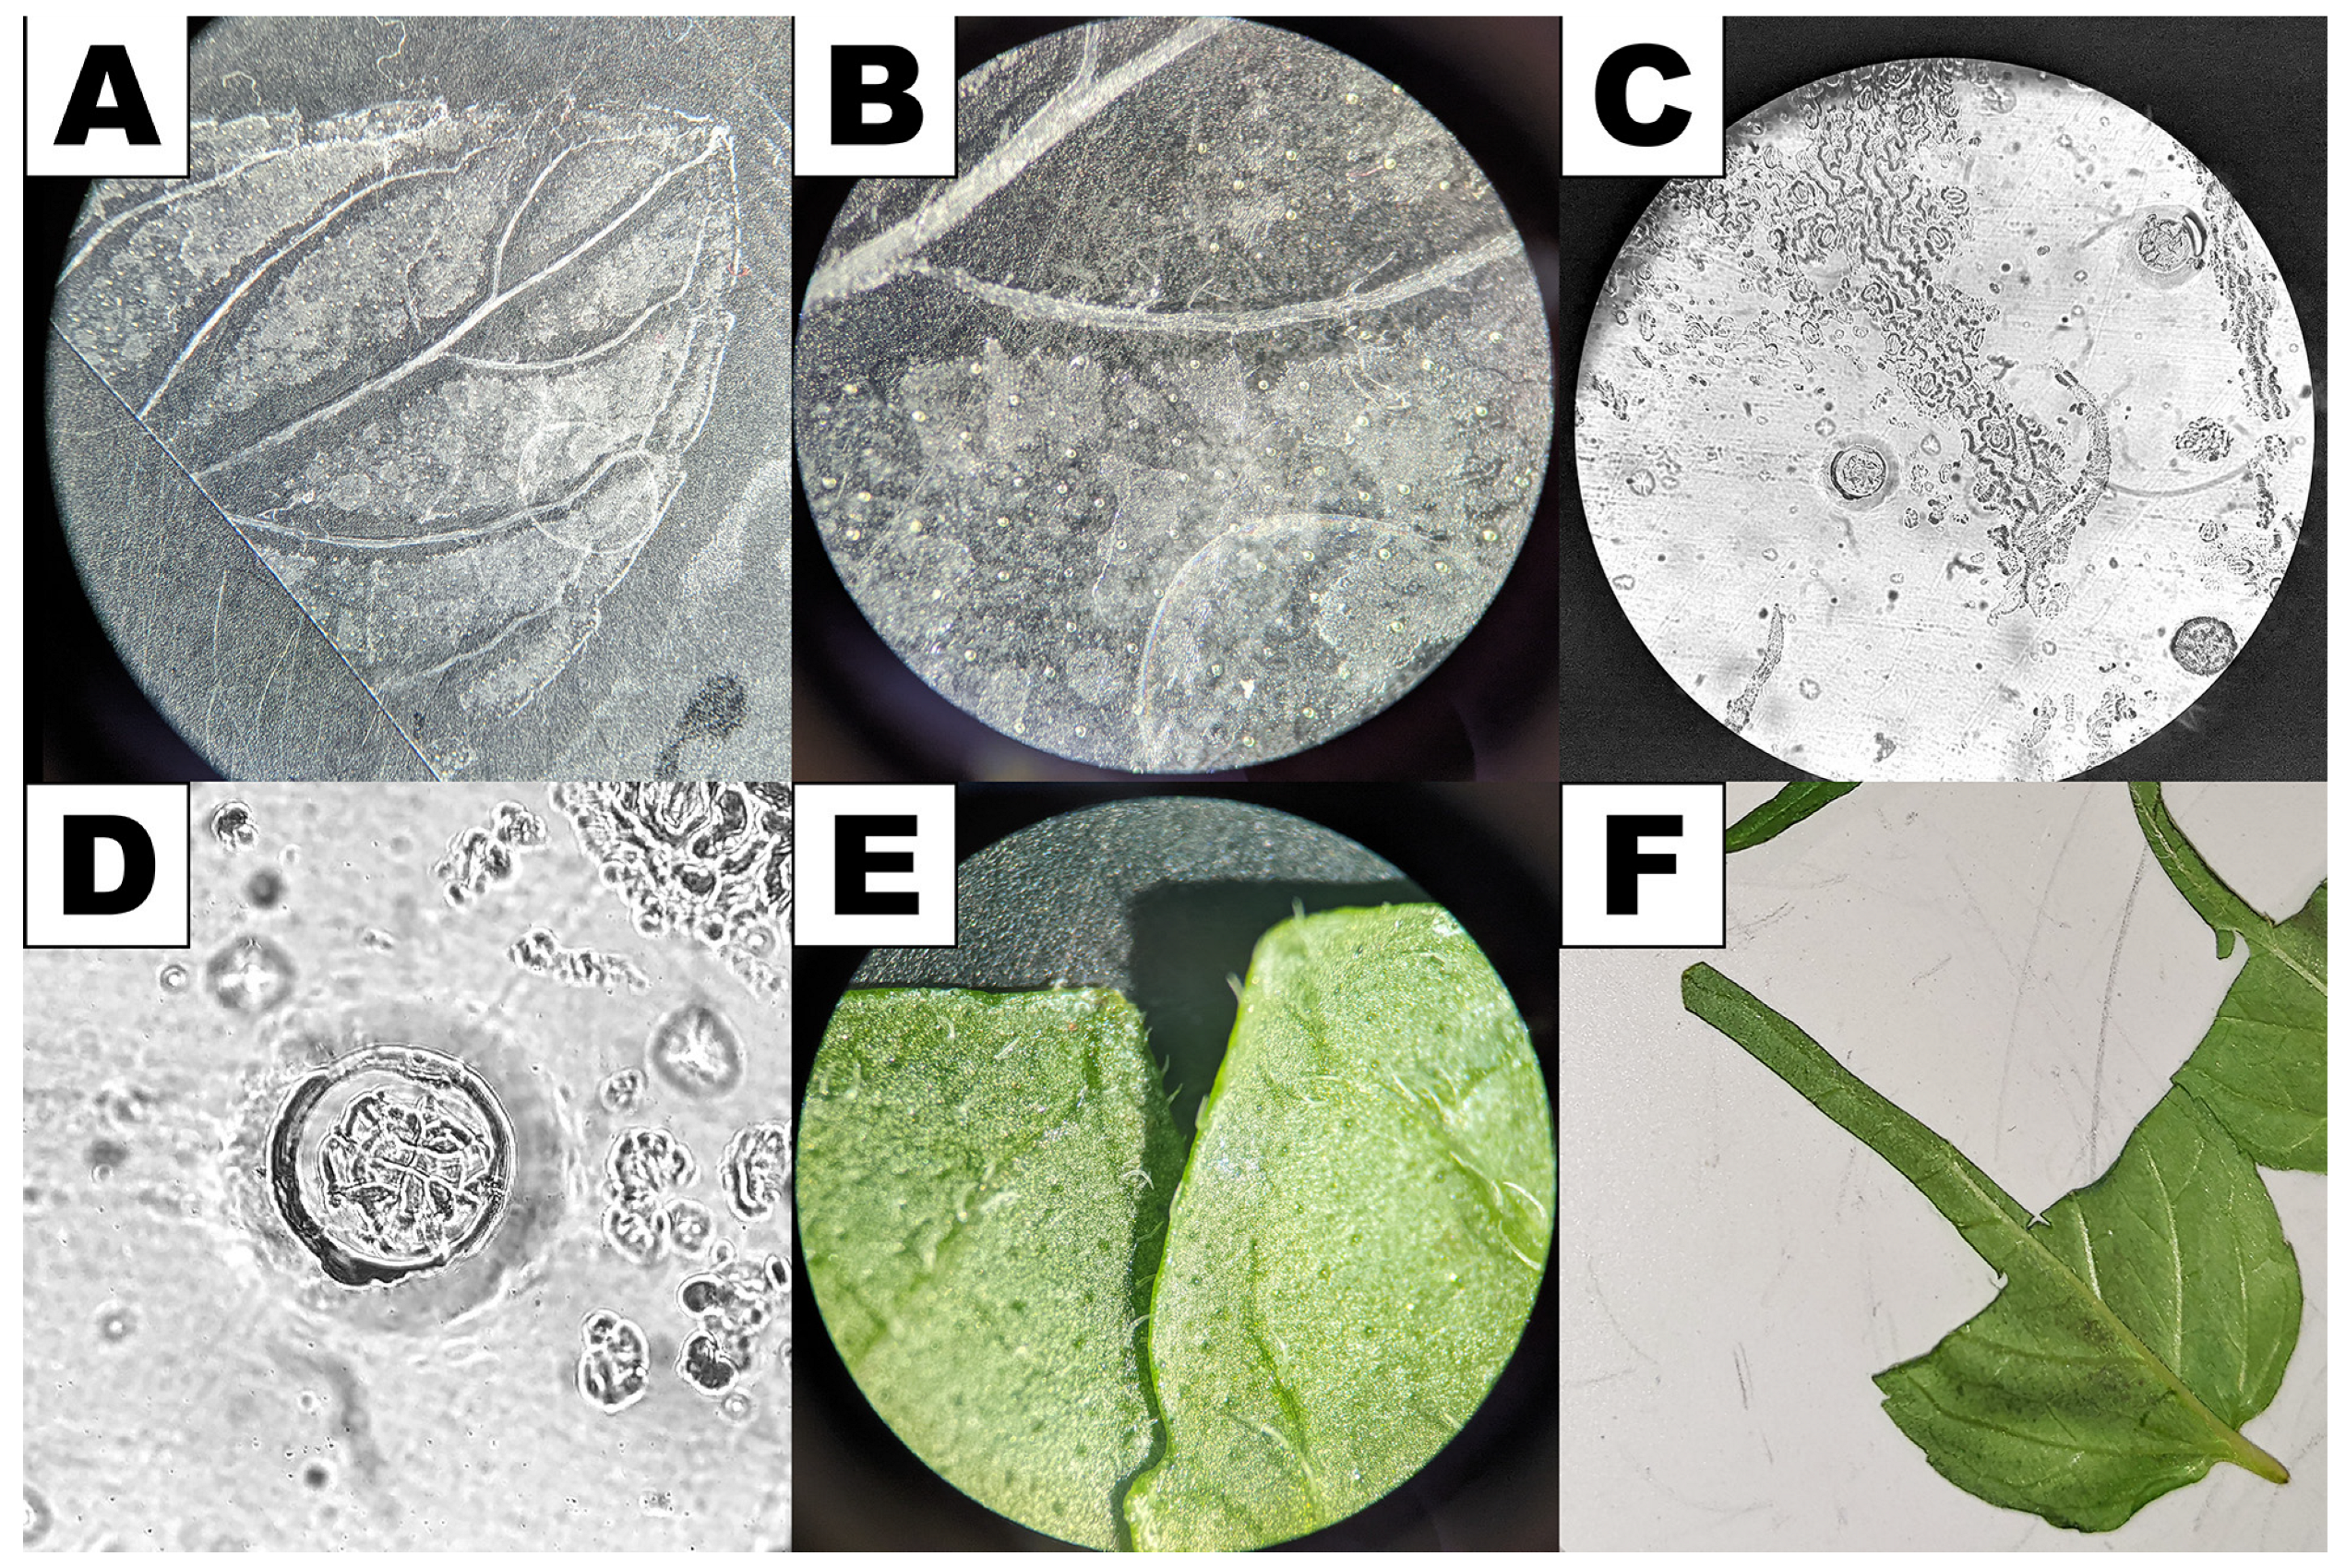
2.7. Tissue Collection for qPCR Assays
2.8. qPCR Assays
3. Results and Discussion
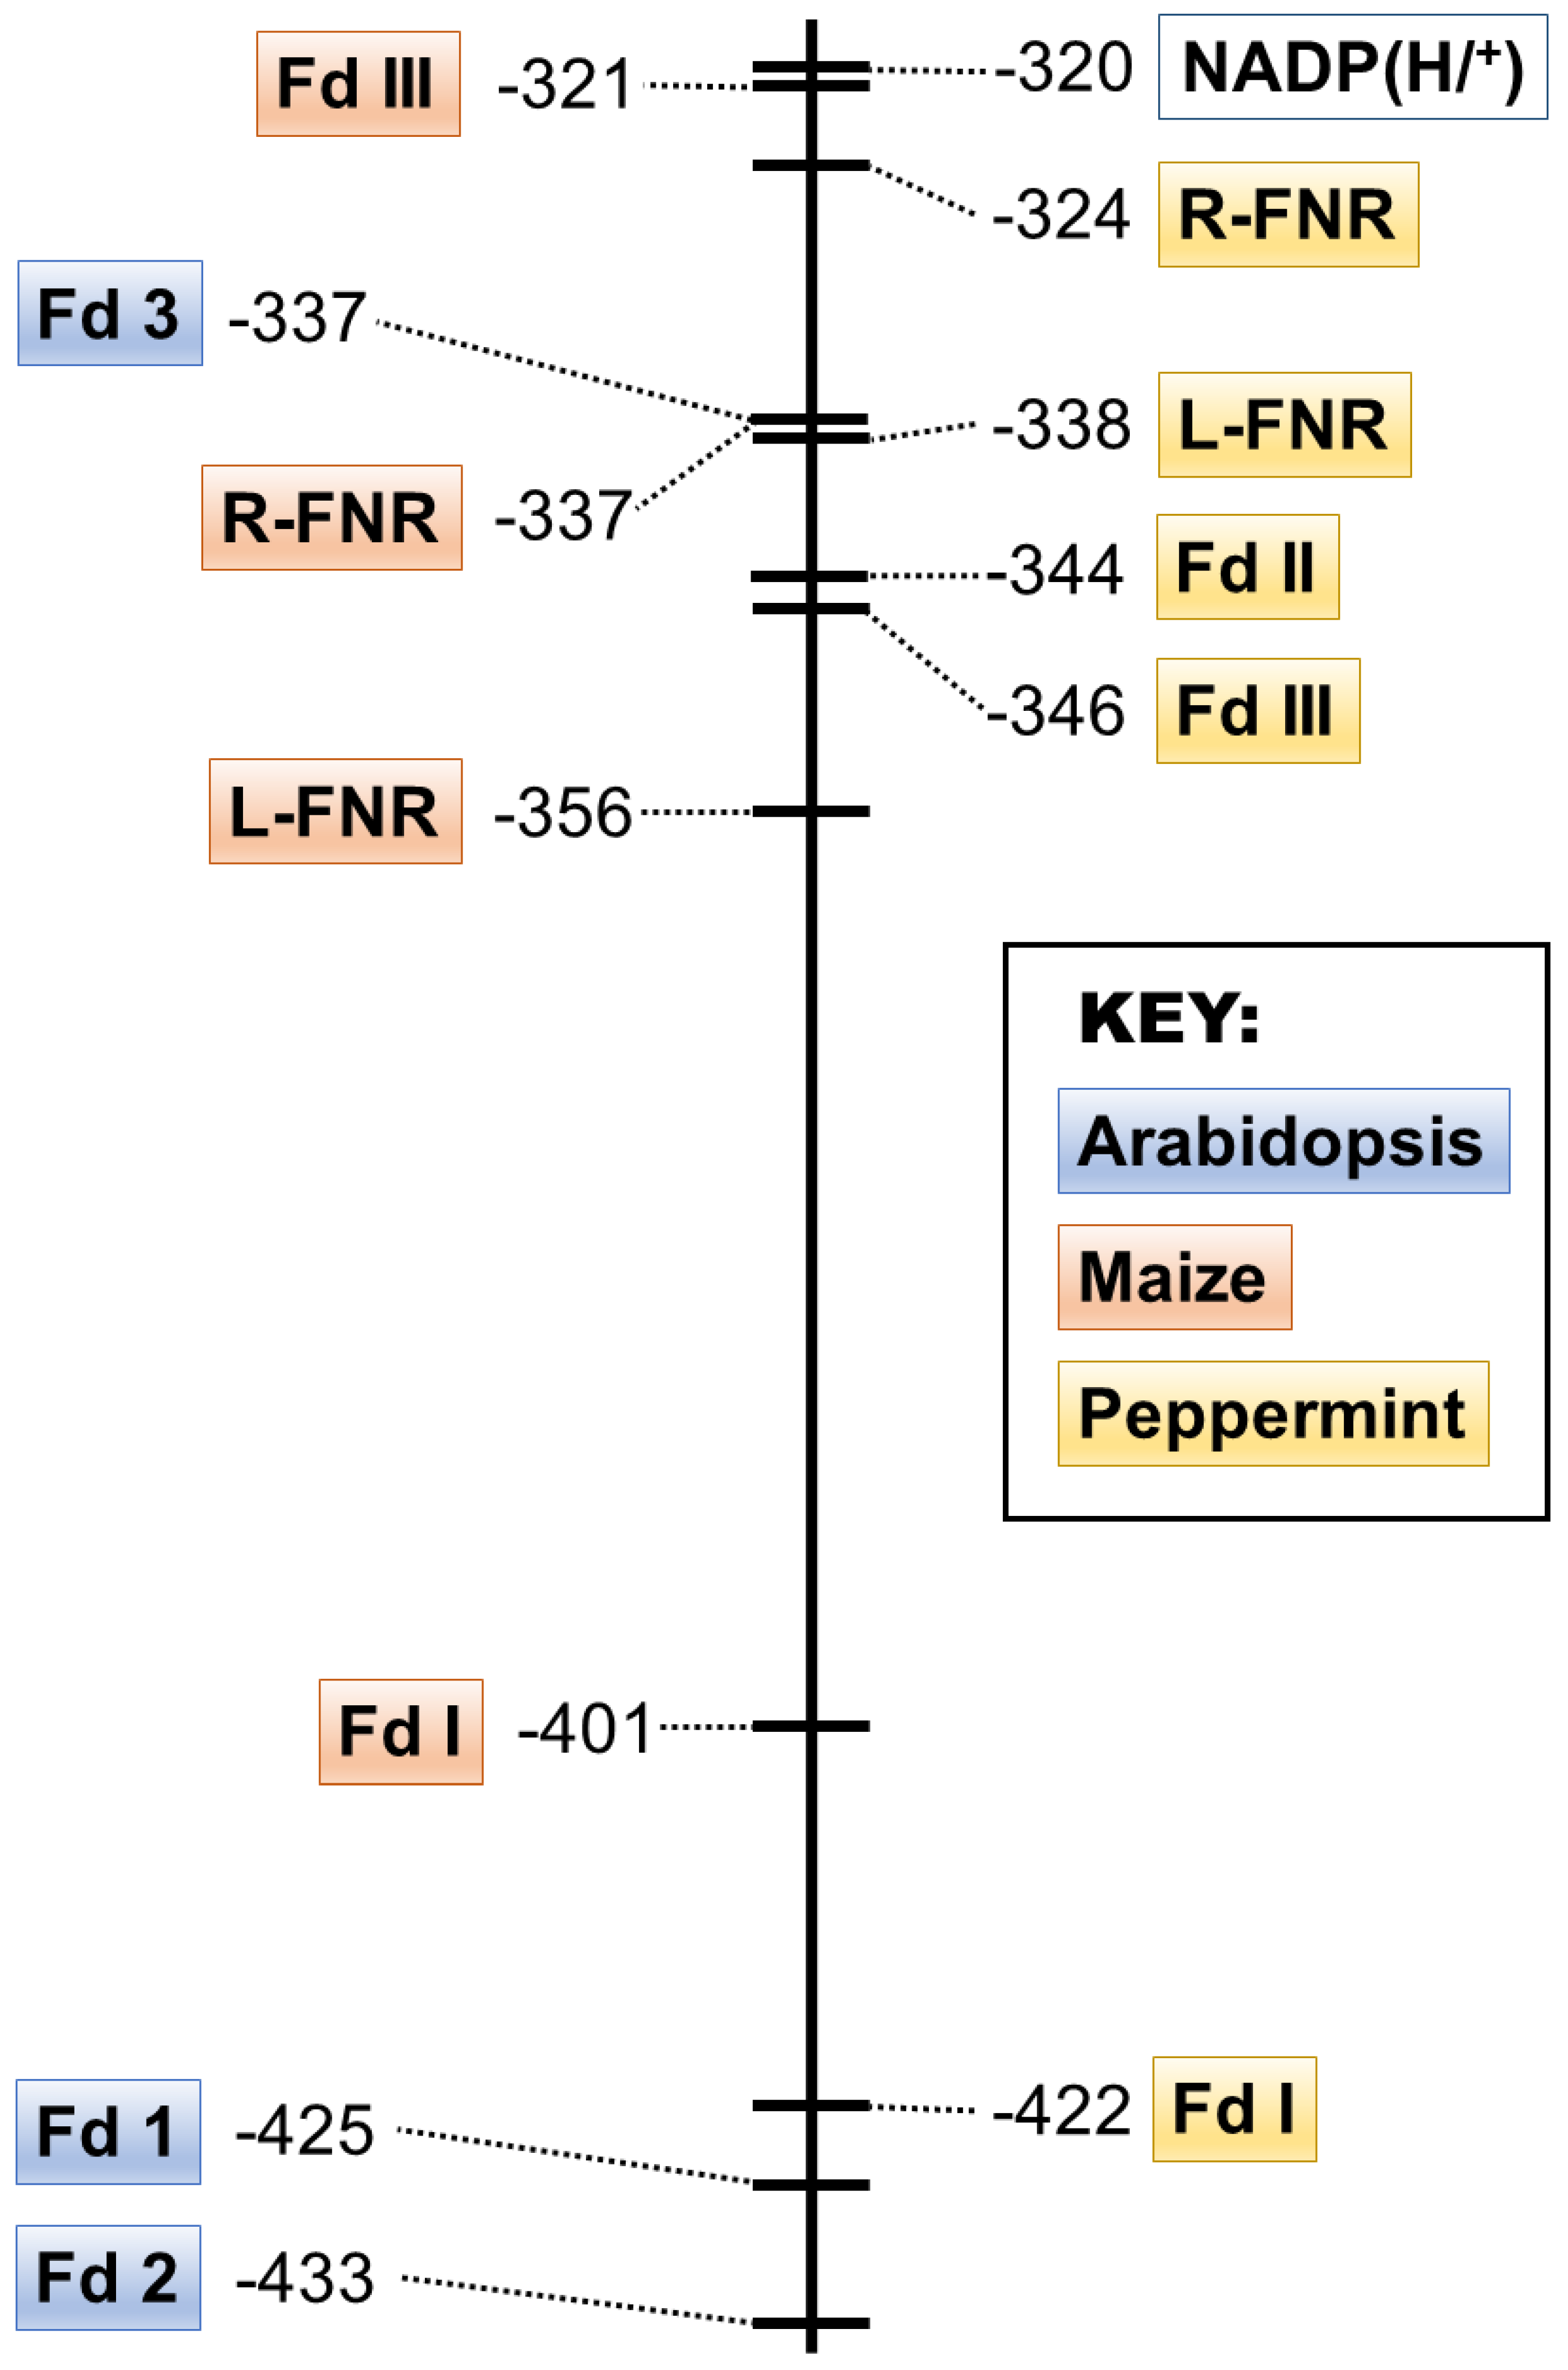
3.1. L-FNR and R-FNR of Peppermint Are Archetypal Leaf and Root Isoforms, Respectively
3.2. Peppermint R-FNR Interacts Favorably with Root-Type Fd Isoforms, While L-FNR Has Lower Specificity Constants with All Fd Isoforms
3.3. The Redox Potentials of Peppermint Fd I and Fd II/Fd III Are Typical for Leaf-Type and Root-Type Fd Isoforms, Respectively
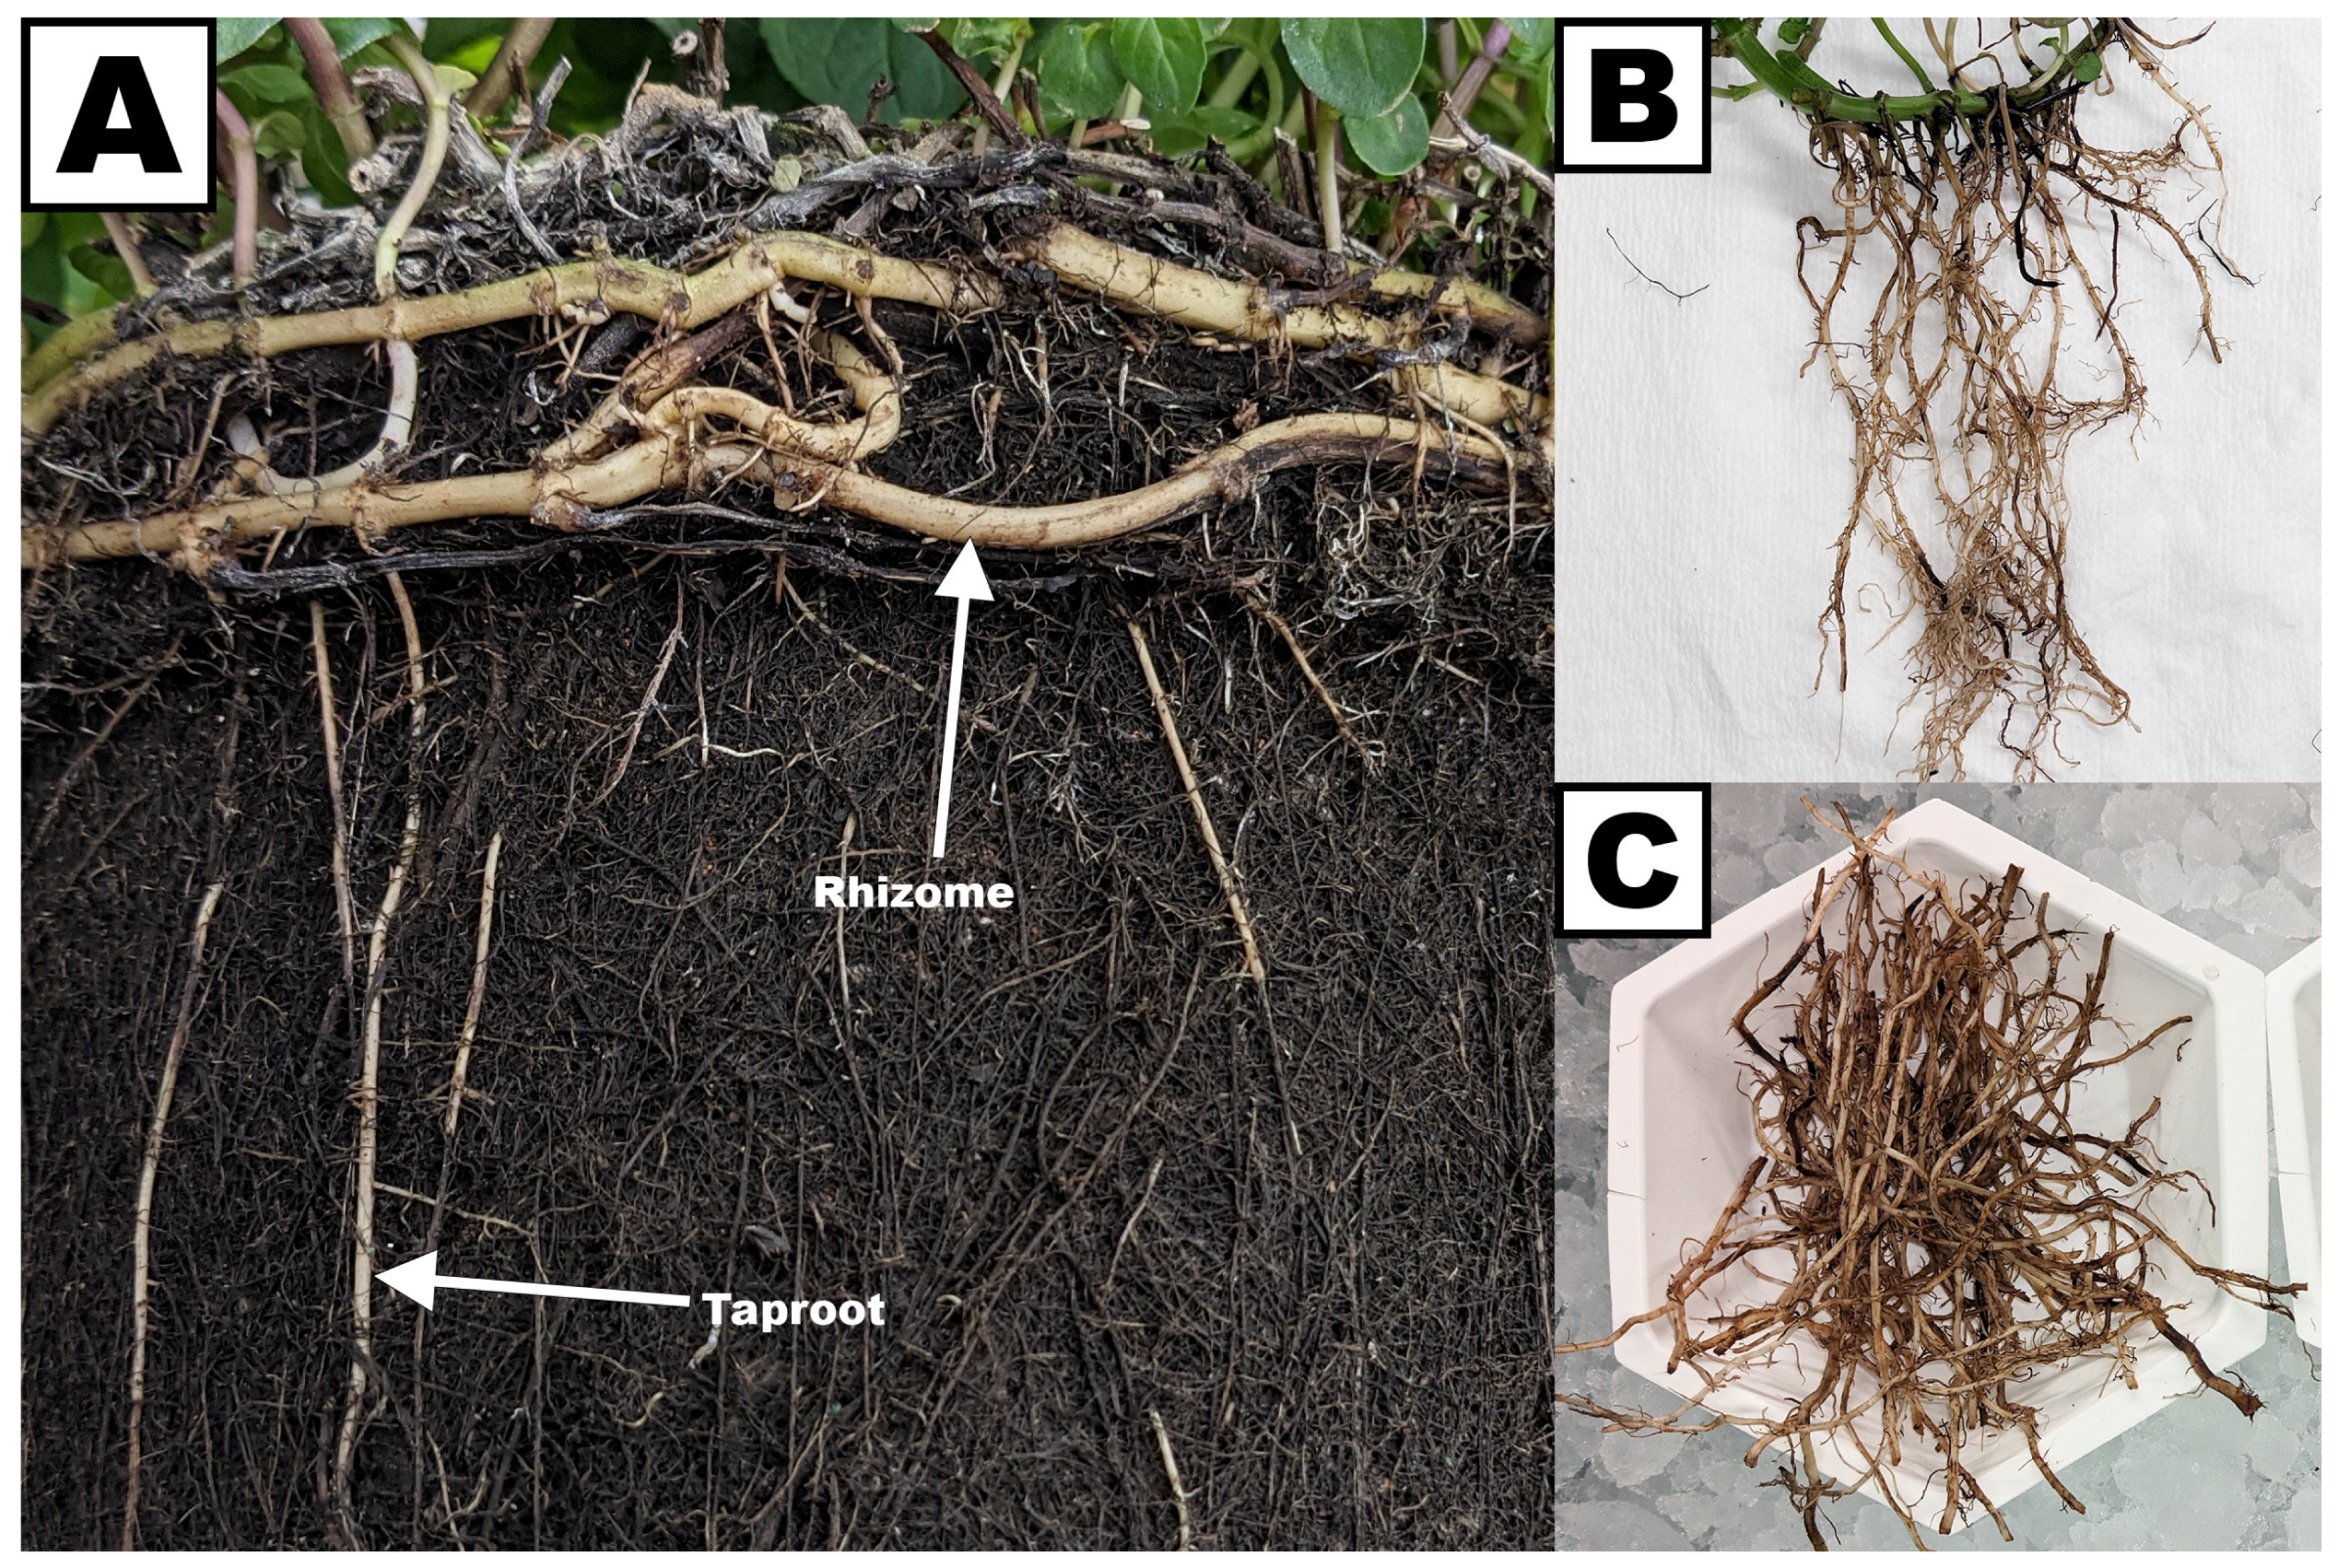
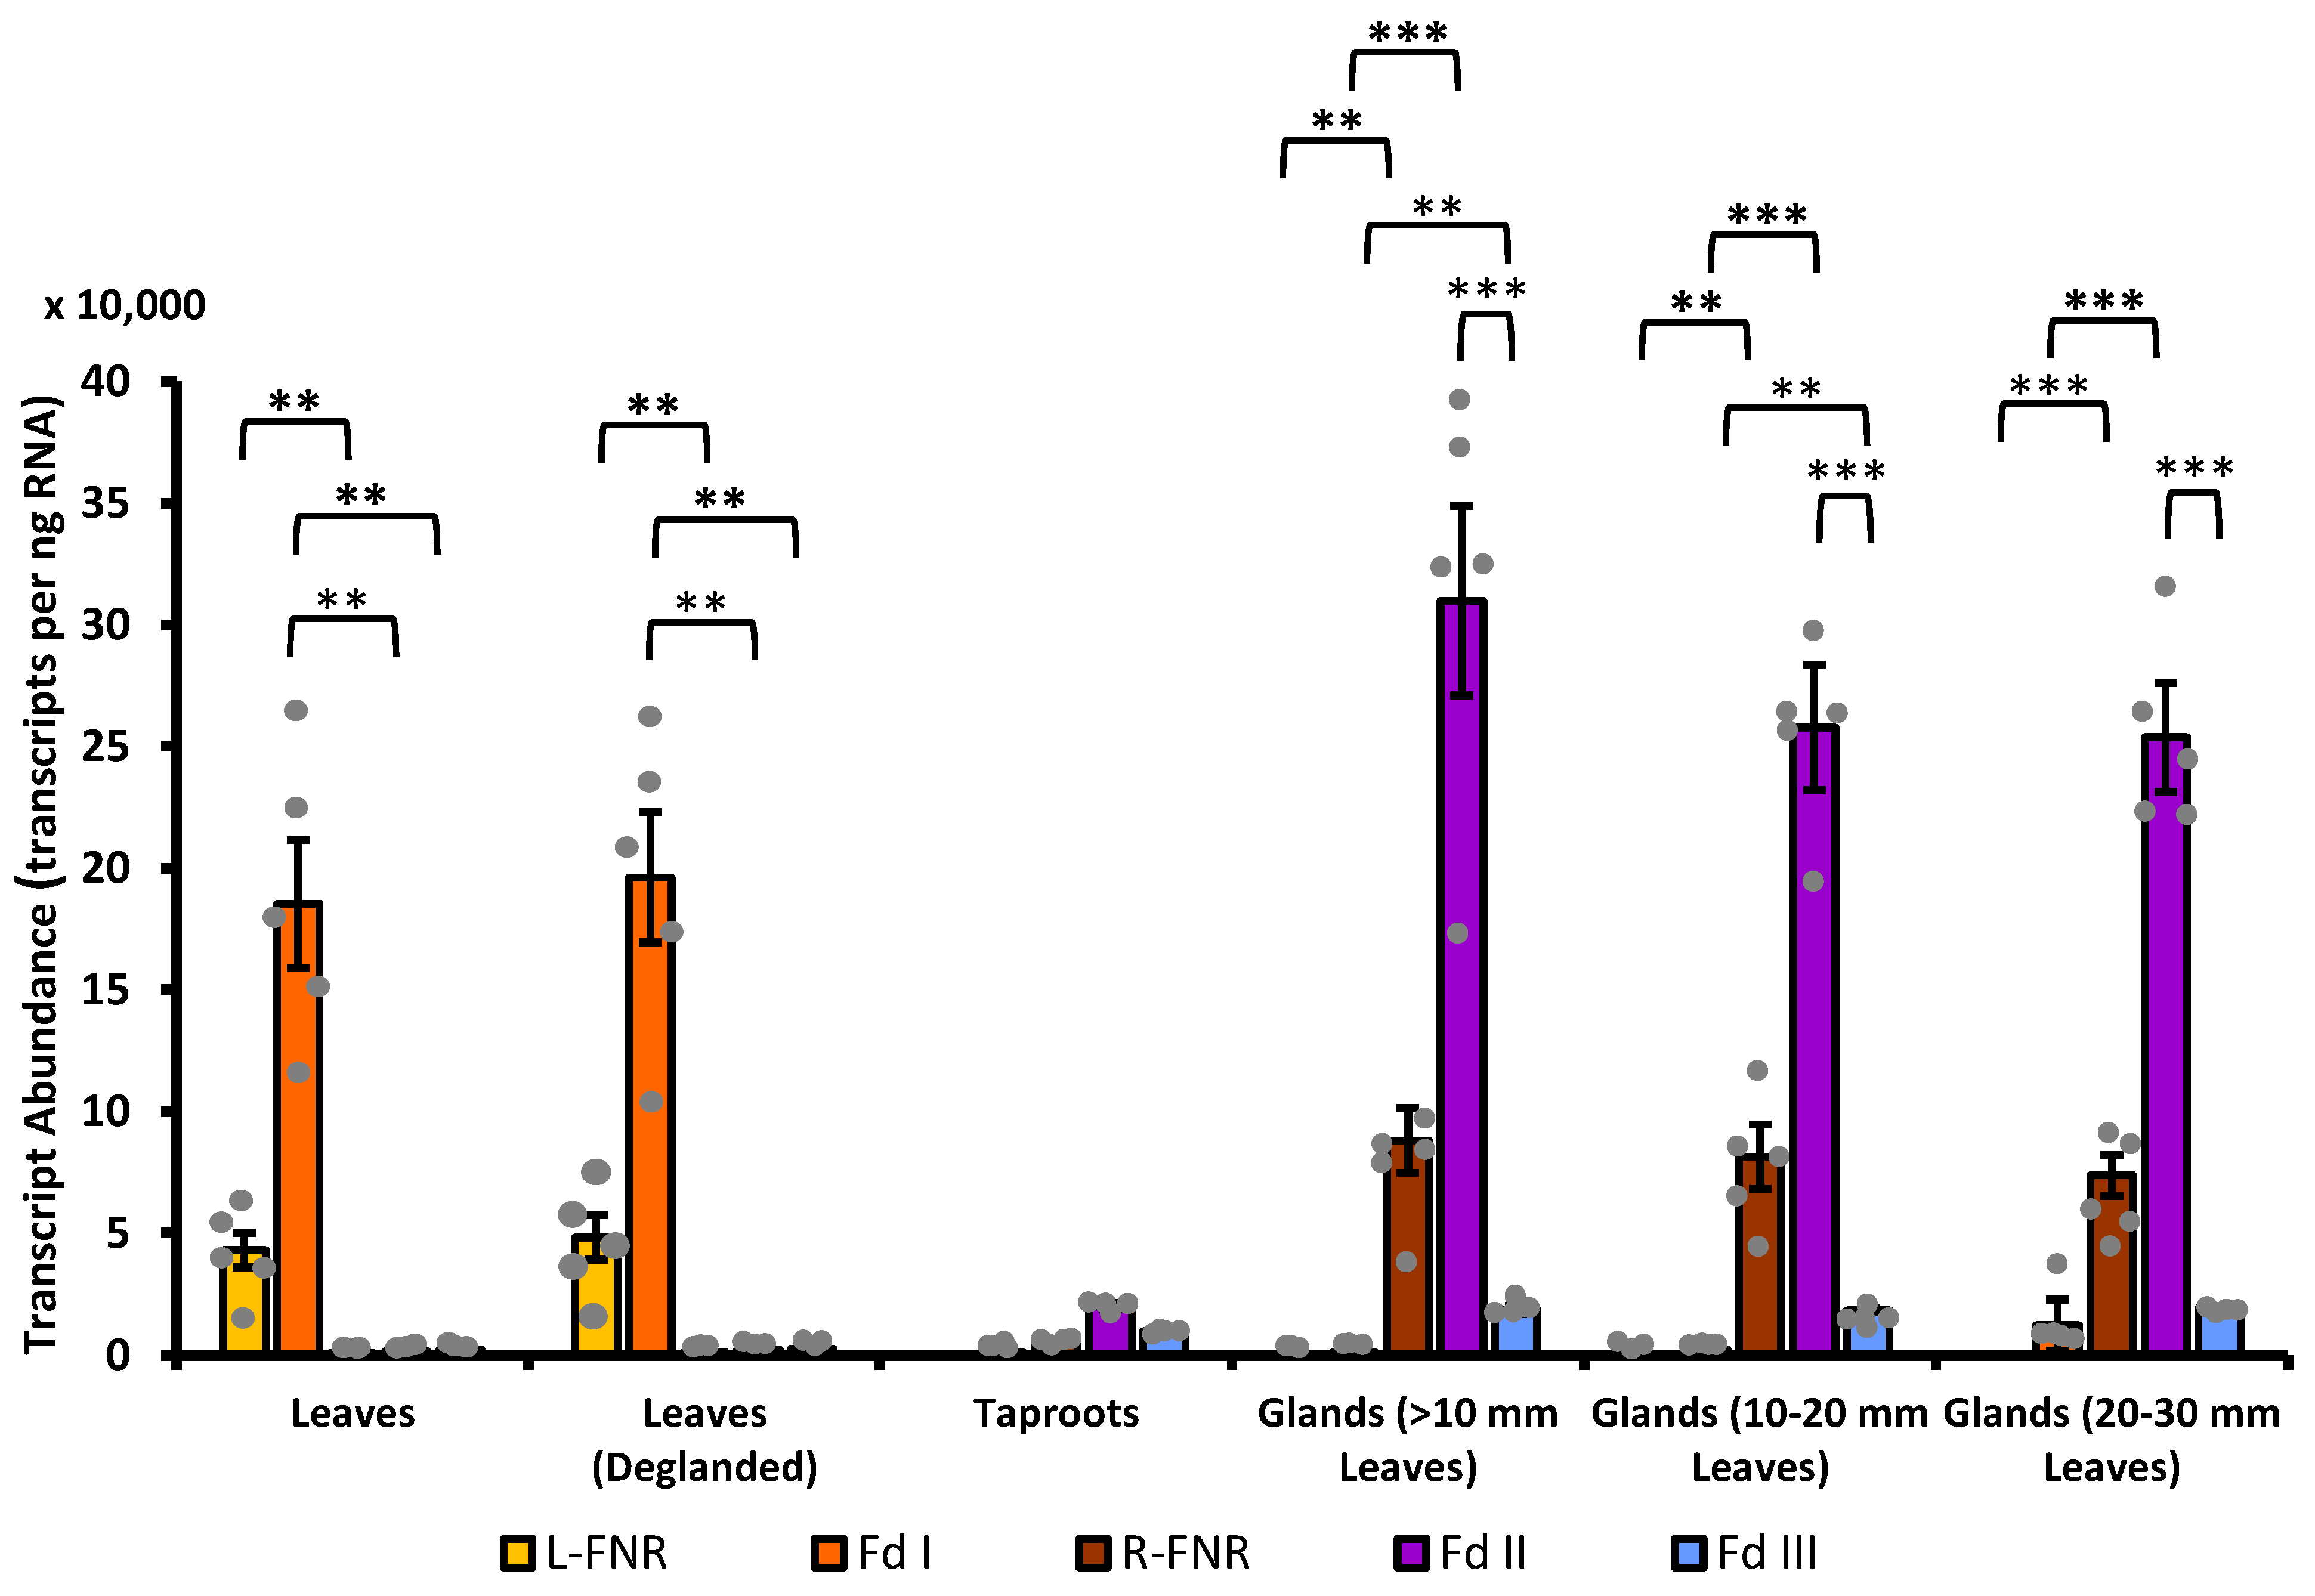
3.4. Fd II Is Expressed in Non-Photosynthetic Cells of Peppermint, with Particularly High Transcript Abundance in Secretory-Stage Glandular Trichomes
4. Conclusions
Supplementary Materials
Author Contributions
Funding
Data Availability Statement
Acknowledgments
Conflicts of Interest
References
- Oldfield, E.; Lin, F.Y. Terpene biosynthesis: Modularity rules. Angew. Chem. 2012, 51, 1124–1137. [Google Scholar] [CrossRef] [PubMed]
- Rodríguez-Concepción, M.; Boronat, A. Breaking new ground in the regulation of the early steps of plant isoprenoid biosynthesis. Curr. Opin. Plant Biol. 2015, 25, 17–22. [Google Scholar] [CrossRef]
- Hemmerlin, A.; Harwood, J.L.; Bach, T.J. A raison d’être for two distinct pathways in the early steps of plant isoprenoid biosynthesis? Prog. Lipid Res. 2012, 51, 95–148. [Google Scholar] [CrossRef] [PubMed]
- Lipko, A.; Swiezewska, E. Isoprenoid generating systems in plants—A handy toolbox how to assess contribution of the mevalonate and methylerythritol phosphate pathways to the biosynthetic process. Prog. Lipid Res. 2016, 63, 70–92. [Google Scholar] [CrossRef]
- Amelunxen, F. Elektronenmikroskopische Untersuchungen an den Drüsenschuppen von Mentha piperita L. Planta Med. 1965, 13, 457–473. [Google Scholar] [CrossRef]
- Amelunxen, F.; Wahlig, T.; Arbeiter, H. Über den Nachweis des ätherischen Öls in isolierten Drüsenhaaren und Drüsenschuppen von Mentha piperita L. Z. Pflanzenphysiol. 1969, 61, 68–72. [Google Scholar]
- McCaskill, D.; Croteau, R. Monoterpene and sesquiterpene biosynthesis in glandular trichomes of peppermint (Mentha × piperita) rely exclusively on plastid-derived isopentenyl diphosphate. Planta 1995, 197, 49–56. [Google Scholar] [CrossRef]
- Eisenreich, W.; Sagner, S.; Zenk, M.H.; Bacher, A. Monoterpenoid essential oils are not of mevalonoid origin. Tetrahedron Lett. 1997, 38, 3889–3892. [Google Scholar] [CrossRef]
- Lange, B.M.; Wildung, M.R.; Stauber, E.J.; Sanchez, C.; Pouchnik, D.; Croteau, R. Probing essential oil biosynthesis and secretion by functional evaluation of expressed sequence tags from mint glandular trichomes. Proc. Natl. Acad. Sci. USA 2000, 97, 2934–2939. [Google Scholar] [CrossRef]
- Turner, G.W.; Gershenzon, J.; Croteau, R.B. Development of peltate glandular trichomes of peppermint. Plant Physiol. 2000, 124, 665–680. [Google Scholar] [CrossRef]
- Turner, G.W.; Gershenzon, J.; Croteau, R.B. Distribution of peltate glandular trichomes on developing leaves of peppermint. Plant Physiol. 2000, 124, 655–664. [Google Scholar] [CrossRef]
- Mahmoud, S.S.; Croteau, R.B. Metabolic engineering of essential oil yield and composition in mint by altering expression of deoxyxylulose phosphate reductoisomerase and menthofuran synthase. Proc. Natl. Acad. Sci. USA 2001, 98, 8915–8920. [Google Scholar] [CrossRef]
- Rios-Estepa, R.; Turner, G.W.; Lee, J.M.; Croteau, R.B.; Lange, B.M. A systems biology approach identifies the biochemical mechanisms regulating monoterpenoid essential oil composition in peppermint. Proc. Natl. Acad. Sci. USA 2008, 105, 2818–2823. [Google Scholar] [CrossRef] [PubMed]
- Rios-Estepa, R.; Lange, I.; Lee, J.M.; Lange, B.M. Mathematical modeling-guided evaluation of biochemical, developmental, environmental, and genotypic determinants of essential oil composition and yield in peppermint leaves. Plant Physiol. 2010, 152, 2105–2119. [Google Scholar] [CrossRef] [PubMed]
- Lange, B.M.; Mahmoud, S.S.; Wildung, M.R.; Turner, G.W.; Davis, E.M.; Lange, I.; Baker, R.C.; Boydston, R.A.; Croteau, R.B. Improving peppermint essential oil yield and composition by metabolic engineering. Proc. Natl. Acad. Sci. USA 2011, 108, 16944–16949. [Google Scholar] [CrossRef] [PubMed]
- Lange, B.M.; Rios-Estepa, R. Kinetic Modeling of Plant Metabolism and Its Predictive Power: Peppermint Essential Oil Biosynthesis as an Example. In Plant Metabolism: Methods and Protocols; Sriram, G., Ed.; Humana Press: Totowa, NJ, USA, 2014; pp. 287–311. [Google Scholar] [CrossRef]
- Johnson, S.R.; Lange, I.; Srividya, N.; Lange, B.M. Bioenergetics of monoterpenoid essential oil biosynthesis in nonphotosynthetic glandular trichomes. Plant Physiol. 2017, 175, 681–695. [Google Scholar] [CrossRef]
- Zager, J.J.; Lange, B.M. Assessing flux distribution associated with metabolic specialization of glandular trichomes. Trends Plant Sci. 2018, 23, 638–647. [Google Scholar] [CrossRef] [PubMed]
- Banerjee, A.; Sharkey, T.D. Methylerythritol 4-phosphate (MEP) pathway metabolic regulation. Nat. Prod. Rep. 2014, 31, 1043–1055. [Google Scholar] [CrossRef]
- Seemann, M.; Bui, B.T.S.; Wolff, M.; Tritsch, D.; Campos, N.; Boronat, A.; Marquet, A.; Rohmer, M. Isoprenoid biosynthesis through the methylerythritol phosphate pathway: The (E)-4-hydroxy-3-methylbut-2-enyl diphosphate synthase (GcpE) is a [4Fe–4S] protein. Angew. Chem. 2002, 114, 4513–4515. [Google Scholar] [CrossRef]
- Wolff, M.; Seemann, M.; Tse Sum Bui, B.; Frapart, Y.; Tritsch, D.; Estrabot, A.G.; Rodríguez-Concepción, M.; Boronat, A.; Marquet, A.; Rohmer, M. Isoprenoid biosynthesis via the methylerythritol phosphate pathway: The (E)-4-hydroxy-3-methylbut-2-enyl diphosphate reductase (LytB/IspH) from Escherichia coli is a [4Fe-4S] protein. FEBS Lett. 2003, 541, 115–120. [Google Scholar] [CrossRef]
- Bowsher, C.G.; Hucklesby, D.P.; Emes, M.J. Induction of ferredoxin-NADP+ oxidoreductase and ferredoxin synthesis in pea root plastids during nitrate assimilation. Plant J. 1993, 3, 463–467. [Google Scholar] [CrossRef]
- Seemann, M.; Tse Sum Bui, B.; Wolff, M.; Miginiac-Maslow, M.; Rohmer, M. Isoprenoid biosynthesis in plant chloroplasts via the MEP pathway: Direct thylakoid/ferredoxin-dependent photoreduction of GcpE/IspG. FEBS Lett. 2006, 580, 1547–1552. [Google Scholar] [CrossRef] [PubMed]
- Arnon, D.I.; Tang, G.M.S. Photoreduction of NADP+ by a chloroplast photosystem II preparation: Effect of light intensity. FEBS Lett. 1989, 253, 253–256. [Google Scholar] [CrossRef]
- Mondal, J.; Bruce, B.D. Ferredoxin: The central hub connecting photosystem I to cellular metabolism. Photosynthetica 2018, 56, 279–293. [Google Scholar] [CrossRef]
- Kimata, Y.; Hase, T. Localization of ferredoxin isoproteins in mesophyll and bundle sheath cells in maize leaf. Plant Physiol. 1989, 89, 1193–1197. [Google Scholar] [CrossRef] [PubMed]
- Piubelli, L.; Aliverti, A.; Bellintani, F.; Zanetti, G. Mutations of Glu92 in ferredoxin I from spinach leaves produce proteins fully functional in electron transfer but less efficient in supporting NADP+ photoreduction. Eur. J. Biochem. 1996, 236, 465–469. [Google Scholar] [CrossRef] [PubMed]
- Corrado, M.E.; Aliverti, A.; Zanetti, G.; Mayhew, S.G. Analysis of the oxidation-reduction potentials of recombinant ferredoxin-NADP+ reductase from spinach chloroplasts. Eur. J. Biochem. 1996, 239, 662–667. [Google Scholar] [CrossRef]
- Matsumura, T.; Kimata-Ariga, Y.; Sakakibara, H.; Sugiyama, T.; Murata, H.; Takao, T.; Shimonishi, Y.; Hase, T. Complementary DNA cloning and characterization of ferredoxin localized in bundle-sheath cells of maize leaves. Plant Physiol. 1999, 119, 481–488. [Google Scholar] [CrossRef]
- Aliverti, A.; Faber, R.; Finnerty, C.M.; Ferioli, C.; Pandini, V.; Negri, A.; Karplus, P.A.; Zanetti, G. Biochemical and crystallographic characterization of ferredoxin−NADP+ reductase from nonphotosynthetic tissues. Biochemistry 2001, 40, 14501–14508. [Google Scholar] [CrossRef]
- Hanke, G.T.; Kimata-Ariga, Y.; Taniguchi, I.; Hase, T. A post genomic characterization of Arabidopsis ferredoxins. Plant Physiol. 2004, 134, 255–264. [Google Scholar] [CrossRef]
- Kurisu, G.; Kusunoki, M.; Katoh, E.; Yamazaki, T.; Teshima, K.; Onda, Y.; Kimata-Ariga, Y.; Hase, T. Structure of the electron transfer complex between ferredoxin and ferredoxin- NADP+ reductase. Nat. Struct. Biol. 2001, 8, 5. [Google Scholar] [CrossRef] [PubMed]
- Kinoshita, M.; Kim, J.Y.; Kume, S.; Sakakibara, Y.; Sugiki, C.; Kojima, G.; Kurisu, T.; Ikegami, T.; Hase, T.; Kimata-Ariga, Y.; et al. Physicochemical nature of interfaces controlling ferredoxin NADP+ reductase activity through its interprotein interactions with ferredoxin. Biochim. Biophys. Acta 2015, 1847, 1200–1211. [Google Scholar] [CrossRef]
- Morigasaki, S.; Takata, K.; Sanada, Y.; Wada, K.; Yee, B.C.; Shin, S.; Buchanan, B.B. Novel forms of ferredoxin and ferredoxin-NADP reductase from spinach roots. Arch. Biochem. Biophys. 1990, 283, 75–80. [Google Scholar] [CrossRef] [PubMed]
- Hase, T.; Kimata, Y.; Yonekura, K.; Matsumura, T.; Sakakibara, H. Molecular Cloning and differential expression of the maize ferredoxin gene family. Plant Physiol. 1991, 96, 77–83. [Google Scholar] [CrossRef]
- Hase, T.; Mizutani, S.; Mukohata, Y. Expression of maize ferredoxin cDNA in Escherichia coli: Comparison of photosynthetic and nonphotosynthetic ferredoxin isoproteins and their chimeric molecule. Plant Physiol. 1991, 97, 1395–1401. [Google Scholar] [CrossRef] [PubMed]
- Onda, Y.; Matsumura, T.; Kimata-Ariga, Y.; Sakakibara, H.; Sugiyama, T.; Hase, T. Differential interaction of maize root ferredoxin:NADP+ oxidoreductase with photosynthetic and non-photosynthetic ferredoxin isoproteins. Plant Physiol. 2000, 123, 1037–1046. [Google Scholar] [CrossRef] [PubMed]
- Akashi, T.; Matsumura, T.; Ideguchi, T.; Iwakiri, K.; Kawakatsu, T.; Taniguchi, I.; Hase, T. Comparison of the electrostatic binding sites on the surface of ferredoxin for two ferredoxin-dependent enzymes, ferredoxin-NADP+ reductase and sulfite reductase. J. Biol. Chem. 1999, 274, 29399–29405. [Google Scholar] [CrossRef] [PubMed]
- Shinohara, F.; Kurisu, G.; Hanke, G.; Bowsher, C.; Hase, T.; Kimata-Ariga, Y. Structural basis for the isotype-specific interactions of ferredoxin and ferredoxin: NADP+ oxidoreductase: An evolutionary switch between photosynthetic and heterotrophic assimilation. Photosynth. Res. 2017, 134, 281–289. [Google Scholar] [CrossRef] [PubMed]
- Gang, D.R.; Wang, J.; Dudareva, N.; Nam, K.H.; Simon, J.E.; Lewinsohn, E.; Pichersky, E. An investigation of the storage and biosynthesis of phenylpropenes in sweet basil. Plant Physiol. 2001, 125, 539–555. [Google Scholar] [CrossRef] [PubMed]
- Ahkami, A.; Johnson, S.R.; Srividya, N.; Lange, B.M. Multiple levels of regulation determine monoterpenoid essential oil compositional variation in the mint family. Mol. Plant 2015, 8, 188–191. [Google Scholar] [CrossRef] [PubMed]
- Cheniclet, C.; Cardé, J.-P. Presence of leucoplasts in secretory cells and of monoterpenes in the essential oil: A correlative study. Isr. J. Plant Sci. 1985, 34, 219–238. [Google Scholar]
- Schenk, P.M.; Baumann, S.; Mattes, R.; Steinbiss, H.H. Improved high-level expression system for eukaryotic genes in Escherichia coli using T7 RNA polymerase and rare ArgtRNAs. Biotechniques 1995, 19, 196–198, 200. [Google Scholar]
- Ailenberg, M.; Silverman, M. Description of a one step staggered reannealing method for directional cloning of PCR-generated DNA using sticky-end ligation without employing restriction enzymes. Biochem. Mol. Biol. Int. 1996, 39, 771–779. [Google Scholar] [CrossRef] [PubMed]
- Schägger, H. Tricine–SDS-PAGE. Nat. Protoc. 2006, 1, 16–22. [Google Scholar] [CrossRef] [PubMed]
- Fazekas de St Groth, S.; Webster, R.G.; Datyner, A. Two new staining procedures for quantitative estimation of proteins on electrophoretic strips. Biochim. Biophys. Acta 1963, 71, 377–391. [Google Scholar] [CrossRef]
- Bradford, M.M. A rapid and sensitive method for the quantitation of microgram quantities of protein utilizing the principle of protein-dye binding. Anal. Biochem. 1976, 72, 248–254. [Google Scholar] [CrossRef] [PubMed]
- Aliverti, A.; Curti, B.; Vanoni, M.A. Identifying and Quantitating FAD and FMN in Simple and in Iron-Sulfur-Containing Flavoproteins. In Flavoprotein Protocols; Chapman, S.K., Reid, G.A., Eds.; Humana Press: Totowa, NJ, USA, 1999; pp. 9–23. [Google Scholar] [CrossRef]
- Buchanan, B.B.; Arnon, D.I. Ferredoxins from photosynthetic bacteria, algae, and higher plants. In Methods in Enzymology; Academic Press: Cambridge, MA, USA, 1971; pp. 413–440. [Google Scholar] [CrossRef]
- Zanetti, G.; Curti, B. Ferredoxin-NADP+ oxidoreductase. Methods Enzymol. 1980, 69, 250–255. [Google Scholar] [CrossRef]
- Foust, G.P.; Mayhew, S.G.; Massey, V. Complex formation between ferredoxin triphosphopyridine nucleotide reductase and electron transfer proteins. J. Biol. Chem. 1969, 244, 964–970. [Google Scholar] [CrossRef]
- Massey, V.; Hemmerich, P. A photochemical procedure for reduction of oxidation-reduction proteins employing deazariboflavin as catalyst. J. Biol. Chem. 1977, 252, 5612–5614. [Google Scholar] [CrossRef] [PubMed]
- Aliverti, A.; Deng, Z.; Ravasi, D.; Piubelli, L.; Karplus, P.A.; Zanetti, G. Probing the function of the invariant glutamyl residue 312 in spinach ferredoxin-NADP+ reductase. J. Biol. Chem. 1998, 273, 34008–34015. [Google Scholar] [CrossRef]
- Mansurova, M.; Koay, M.S.; Gärtner, W. Synthesis and electrochemical properties of structurally modified flavin compounds. Eur. J. Org. Chem. 2008, 32, 5401–5406. [Google Scholar] [CrossRef]
- Chapman, S.K.; Reid, G.A. Flavoprotein Protocols; Methods in Molecular Biology Series; Humana: Totowa, NJ, USA, 1999; Volume 12, pp. 1–256. [Google Scholar] [CrossRef]
- Mayhew, S.G. Potentiometric measurement of oxidation-reduction potentials. Methods Mol. Biol. 1999, 131, 49–59. [Google Scholar] [CrossRef] [PubMed]
- Maklashina, E.; Cecchini, G. Determination of flavin potential in proteins by xanthine/xanthine oxidase method. Bio-Protocol 2020, 10, e3571. [Google Scholar] [CrossRef] [PubMed]
- Hou, Y.; Zhang, H.; Miranda, L.; Lin, S. Serious overestimation in quantitative PCR by circular (supercoiled) plasmid standard: Microalgal pcna as the model gene. PLoS ONE 2010, 5, e9545. [Google Scholar] [CrossRef] [PubMed]
- Kibbe, W.A. OligoCalc: An online oligonucleotide properties calculator. Nucleic Acids Res. 2007, 35, W43–W46. [Google Scholar] [CrossRef] [PubMed]
- Gopalam, R.; Rupwate, S.D.; Tumaney, A.W. Selection and validation of appropriate reference genes for quantitative real-time PCR analysis in Salvia hispanica. PLoS ONE 2017, 12, e0186978. [Google Scholar] [CrossRef] [PubMed]
- Aminfar, Z.; Rabiei, B.; Tohidfar, M.; Mirjalili, M.H. Selection and validation of reference genes for quantitative real-time PCR in Rosmarinus officinalis L. in various tissues and under elicitation. Biocatal. Agric. Biotechnol. 2019, 20, 101246. [Google Scholar] [CrossRef]
- Grabia, S.; Smyczynska, U.; Pagacz, K.; Fendler, W. NormiRazor: Tool applying GPU-accelerated computing for determination of internal references in microRNA transcription studies. BMC Bioinformat. 2020, 21, 425. [Google Scholar] [CrossRef]
- Vandesompele, J.; Preter, K.D.; Pattyn, F.; Poppe, B.; Roy, N.V.; Paepe, A.D.; Speleman, F. Accurate normalization of real-time quantitative RT-PCR data by geometric averaging of multiple internal control genes. Genome Biol. 2002, 3, 1–12. [Google Scholar] [CrossRef]
- Bustin, S.A.; Benes, V.; Garson, J.A.; Hellemans, J.; Huggett, J.; Kubista, M.; Mueller, R.; Nolan, T.; Pfaffl, M.W.; Shipley, G.L.; et al. The MIQE guidelines: Minimum information for publication of quantitative real-time PCR experiments. Clin. Chem. 2009, 55, 611–622. [Google Scholar] [CrossRef]
- Kimata-Ariga, Y.; Nishimizu, Y.; Shinkoda, R. Molecular mechanism of negative cooperativity of ferredoxin-NADP + reductase by ferredoxin and NADP(H): Role of the ion pair of ferredoxin Arg40 of and FNR Glu154. J. Biochem. 2022, 172, 377–383. [Google Scholar] [CrossRef] [PubMed]
- Aliverti, A.; Pandini, V.; Zanetti, G. Domain exchange between isoforms of ferredoxin-NADP+ reductase produces a functional enzyme. Biochim. Biophys. Acta 2004, 1696, 93–101. [Google Scholar] [CrossRef]
- Zanetti, G.; Morelli, D.; Ronchi, S.; Negri, A.; Aliverti, A.; Curti, B. Structural studies on the interaction between ferredoxin and ferredoxin-NADP+ reductase. Biochemistry 1988, 27, 3753–3759. [Google Scholar] [CrossRef]
- Knaff, D.B. Ferredoxin and Ferredoxin-Dependent Enzymes. In Oxygenic Photosynthesis: The Light Reactions; Ort, D.R., Yocum, C.F., Heichel, I.F., Eds.; Springer: Dordrecht, The Netherlands, 1996; pp. 333–361. [Google Scholar] [CrossRef]
- Martínez-Júlvez, M.; Medina, M.; Hurley, J.K.; Hafezi, R.; Brodie, T.B.; Tollin, G.; Gómez-Moreno, C. Lys75 of Anabaena ferredoxin−NADP+ reductase is a critical residue for binding ferredoxin and flavodoxin during electron transfer. Biochemistry 1998, 37, 13604–13613. [Google Scholar] [CrossRef] [PubMed]
- Hurley, J.K.; Hazzard, J.T.; Martínez-Júlvez, M.; Medina, M.; Gómez-Moreno, C.; Tollin, G. Electrostatic forces involved in orienting Anabaena ferredoxin during binding to Anabaena ferredoxin:NADP+ reductase: Site-specific mutagenesis, transient kinetic measurements, and electrostatic surface potentials. Protein Sci. 1999, 8, 1614–1622. [Google Scholar] [CrossRef]
- Bovy, A.; Van Den Berg, C.; De Vrieze, G.; Thompson, W.F.; Weisbeek, P.; Smeekens, S. Light-regulated expression of the Arabidopsis thaliana ferredoxin gene requires sequences upstream and downstream of the transcription initiation site. Plant Mol. Biol. 1995, 27, 27–39. [Google Scholar] [CrossRef] [PubMed]
- Kimata-Ariga, Y.; Matsumura, T.; Kada, S.; Fujimoto, H.; Fujita, Y.; Endo, T.; Mano, J.; Sato, F.; Hase, T. Differential electron flow around photosystem I by two C4-photosynthetic-cell-specific ferredoxins. EMBO J. 2000, 19, 5041–5050. [Google Scholar] [CrossRef] [PubMed]
- Sakakibara, H. Differential response of genes for ferredoxin and ferredoxin: NADP+ oxidoreductase to nitrate and light in maize leaves. J. Plant Physiol. 2003, 160, 65–70. [Google Scholar] [CrossRef]
- Champagne, A.; Boutry, M. Proteomics of terpenoid biosynthesis and secretion in trichomes of higher plant species. Biochim. Biophys. Acta 2016, 1864, 1039–1049. [Google Scholar] [CrossRef]


| kcatNADPH (s−1) | KmNADPH (μM) | kcat/KmNADPH (μM−1s−1) | kcatacceptor (s−1) | Kmacceptor (μM) | kcat/Kmacceptor (μM−1s−1) | |
|---|---|---|---|---|---|---|
| R-FNR | 266.6 ± 12.0 | 58.6 ± 8.4 | 4.5 ± 0.6 | 191.1 ± 15.4 | 189.8 ± 42.8 | 1.0 ± 0.2 |
| L-FNR * | 48.0 ± 10.5 | 178.0 ± 23 | 0.3 ± 0.1 | 51.7 ± 1.6 | 76.4 ± 8.5 | 0.7 ± 0.1 |
| kcat (s−1) | KmFd (µM) | kcat/KmFd (µM−1s−1) | kcat (s−1) | KmFd (µM) | kcat/KmFd (µM−1s−1) | |
|---|---|---|---|---|---|---|
| R-FNR | L-FNR * | |||||
| Fd I * | 281.2 ± 19.6 | 3.6 ± 0.6 | 78.3 ± 10.4 | 125.2 ± 2.4 | 2.3 ± 0.1 | 54.2 ± 2.6 |
| Fd II | 428.2 ± 9.2 | 1.9 ± 0.1 | 221.8 ± 12.7 | 304 ± 7.8 | 2.8 ± 0.2 | 108.9 ± 7.8 |
| Fd III | 428 ± 10.8 | 2.3 ± 0.2 | 189.4 ± 19.5 | 285.6 ± 6.6 | 2.9 ± 0.2 | 98.1 ± 7.2 |
Disclaimer/Publisher’s Note: The statements, opinions and data contained in all publications are solely those of the individual author(s) and contributor(s) and not of MDPI and/or the editor(s). MDPI and/or the editor(s) disclaim responsibility for any injury to people or property resulting from any ideas, methods, instructions or products referred to in the content. |
© 2024 by the authors. Licensee MDPI, Basel, Switzerland. This article is an open access article distributed under the terms and conditions of the Creative Commons Attribution (CC BY) license (https://creativecommons.org/licenses/by/4.0/).
Share and Cite
Polito, J.T.; Lange, I.; Barton, K.E.; Srividya, N.; Lange, B.M. Characterization of a Unique Pair of Ferredoxin and Ferredoxin NADP+ Reductase Isoforms That Operates in Non-Photosynthetic Glandular Trichomes. Plants 2024, 13, 409. https://doi.org/10.3390/plants13030409
Polito JT, Lange I, Barton KE, Srividya N, Lange BM. Characterization of a Unique Pair of Ferredoxin and Ferredoxin NADP+ Reductase Isoforms That Operates in Non-Photosynthetic Glandular Trichomes. Plants. 2024; 13(3):409. https://doi.org/10.3390/plants13030409
Chicago/Turabian StylePolito, Joshua T., Iris Lange, Kaylie E. Barton, Narayanan Srividya, and B. Markus Lange. 2024. "Characterization of a Unique Pair of Ferredoxin and Ferredoxin NADP+ Reductase Isoforms That Operates in Non-Photosynthetic Glandular Trichomes" Plants 13, no. 3: 409. https://doi.org/10.3390/plants13030409
APA StylePolito, J. T., Lange, I., Barton, K. E., Srividya, N., & Lange, B. M. (2024). Characterization of a Unique Pair of Ferredoxin and Ferredoxin NADP+ Reductase Isoforms That Operates in Non-Photosynthetic Glandular Trichomes. Plants, 13(3), 409. https://doi.org/10.3390/plants13030409