Article

Comparative Genome-Wide Identification of the Fatty Acid Desaturase Gene Family in Tea and Oil Tea

1
The Laboratory of Forestry Genetics, Central South University of Forestry and Technology, Changsha 410004, China
2
National Forest and Seedling Workstation of Hunan Province, The Forestry Department of Hunan Province, Changsha 410004, China
3
Agricultural Genomics Institute at Shenzhen, Chinese Academy of Agricultural Sciences, Shenzhen 518000, China
*
Authors to whom correspondence should be addressed.
Plants 2024, 13(11), 1444; https://doi.org/10.3390/plants13111444
Submission received: 10 April 2024 / Revised: 7 May 2024 / Accepted: 16 May 2024 / Published: 23 May 2024
(This article belongs to the Special Issue Molecular Biology and Bioinformatics of Forest Trees)

Abstract

:
Camellia oil is valuable as an edible oil and serves as a base material for a range of high-value products. Camellia plants of significant economic importance, such as Camellia sinensis and Camellia oleifera, have been classified into sect. Thea and sect. Oleifera, respectively. Fatty acid desaturases play a crucial role in catalyzing the formation of double bonds at specific positions of fatty acid chains, leading to the production of unsaturated fatty acids and contributing to lipid synthesis. Comparative genomics results have revealed that expanded gene families in oil tea are enriched in functions related to lipid, fatty acid, and seed processes. To explore the function of the FAD gene family, a total of 82 FAD genes were identified in tea and oil tea. Transcriptome data showed the differential expression of the FAD gene family in mature seeds of tea tree and oil tea tree. Furthermore, the structural analysis and clustering of FAD proteins provided insights for the further exploration of the function of the FAD gene family and its role in lipid synthesis. Overall, these findings shed light on the role of the FAD gene family in Camellia plants and their involvement in lipid metabolism, as well as provide a reference for understanding their function in oil synthesis.

1. Introduction

The genus Camellia, a member of the family Theaceae, is one of the largest and most economically valuable genera in the family [1]. It includes many representative species, such as Camellia sinensis, Camellia oleifera, and Camellia chekiangoleosa, which have significant applications in tea leaves and oil production, as well as ornamental purposes [2,3,4]. These plants exhibit variations in plant morphology, economic properties, and oil content composition [5,6]. The basic metabolic pathways of fatty acid biosynthesis have been extensively studied in model plants, with a particular focus on important oil-producing plants, such as olive, soybean, and peanut, that regulate the accumulation of oleic acid and linoleic acid [7,8,9]. However, there is an urgent need for functional genomics research on fatty acid biosynthesis pathways specific to oil tea plants. In recent years, important progress has been achieved in the assembly and annotation of oil tea genomes, providing a foundation for exploring potential genetic markers and genes, and promoting the transition from traditional breeding to genomics-assisted breeding in oil tea production. Among them, C. oleifera var. “Nanyongensis” (CON), recognized as the wild progenitor of cultivated diploid oil tea, holds considerable significance [10]. Meanwhile, C. chekiangoleosa, a prominent oil tea plant, has a long tradition of cultivation in southern China [11]. Within the section Oleifera, C. lanceoleosa, a wild diploid species, has primarily evolved through natural selection, endowing it with distinctive characteristics [12]. Decoding the genomes of these oil tea plants could help identify potential genetic markers and genes, enabling a transition from traditional breeding to genomics-assisted breeding in oil tea production.
Fatty acid desaturases (FADs) play a critical role in plant lipid metabolism by introducing double bonds into hydrocarbon chains, thus, influencing the composition of fatty acids in oils [13]. Numerous FAD genes have been isolated and characterized from various plants, including soybean, peanut, and tung tree [14,15,16]. In soybean roots, the transcription levels of GsSLD1 and GsSLD2 genes are significantly up-regulated after 1 and 2 h of salt stress, indicating that these FAD genes may regulate the cell membranes of soybean [17]. In Arabidopsis FAD6 mutants, polyunsaturated fatty acid levels in chloroplast membranes drop significantly under cold stress, reducing cold tolerance [18]. In bananas, Fusarium oxysporum f. sp. cubense tropical race 4 (FocTR4) affects the expression of several MaFADs and greatly induces the accumulation of fatty acids in roots [19]. FAD genes play pivotal roles in various aspects of plant life, including growth, development, and responses to environmental stresses. FAD genes have been found in various plants, including Triticum aestivum, Oryza sativa, Musa acuminata, Glycine max, Brassica napus, and others [17,19,20,21,22].
Based on their subcellular localization, membrane-bound FADs can be classified into plastidial FADs (FAD4, FAD5, FAD6, FAD7, and FAD8), which desaturate membrane lipids within plastid membranes, and endoplasmic reticulum FADs (FAD2 and FAD3), responsible for synthesizing unsaturated glycerides [23]. Among them, FAD2 in oil tea plays a crucial role in converting oleic acid to linoleic acid and is a key enzyme in oil synthesis and metabolism [24]. In existing studies, there has been extensive research on the seed oil content and unsaturated fatty acid composition in Camellia species. Results have shown that the seed oil content in Camellia species is generally high, with some species reaching over 40%. An analysis of 25 Camellia species in experiments revealed that the majority have an unsaturated fatty acid content exceeding 85%, with 14 species having oleic acid and linoleic acid contents above 85% [25]. Additionally, another study found that C. oleifera and Camellia albogigas, among other Camellia species, have high unsaturated fatty acid proportions, reaching 86% and 83%, respectively, while C. sinensis has a comparatively lower unsaturated fatty acid content at 69.60% [26]. These research findings indicate that Camellia species seeds are generally rich in unsaturated fatty acids, with oleic acid being a predominant component. Due to artificial selection pressures, oil tea plants have transitioned into being a woody oil crop that is primarily cultivated for the production of seed oil [10]. This domestication process has rendered oil tea an ideal model for studying the genetic and physiological mechanisms underlying the traits associated with seed oil production and domestication. In this study, we conducted a genome-wide identification of FAD genes in tea and oil tea, characterized their gene structures, chromosomal distributions, cis-acting elements, conserved motifs, and the phylogenetic relationships of their proteins. Additionally, we performed a comparative analysis of gene expression within the FAD gene family in tea and oil tea to uncover the mechanisms of fatty acid accumulation in seeds.

2. Results

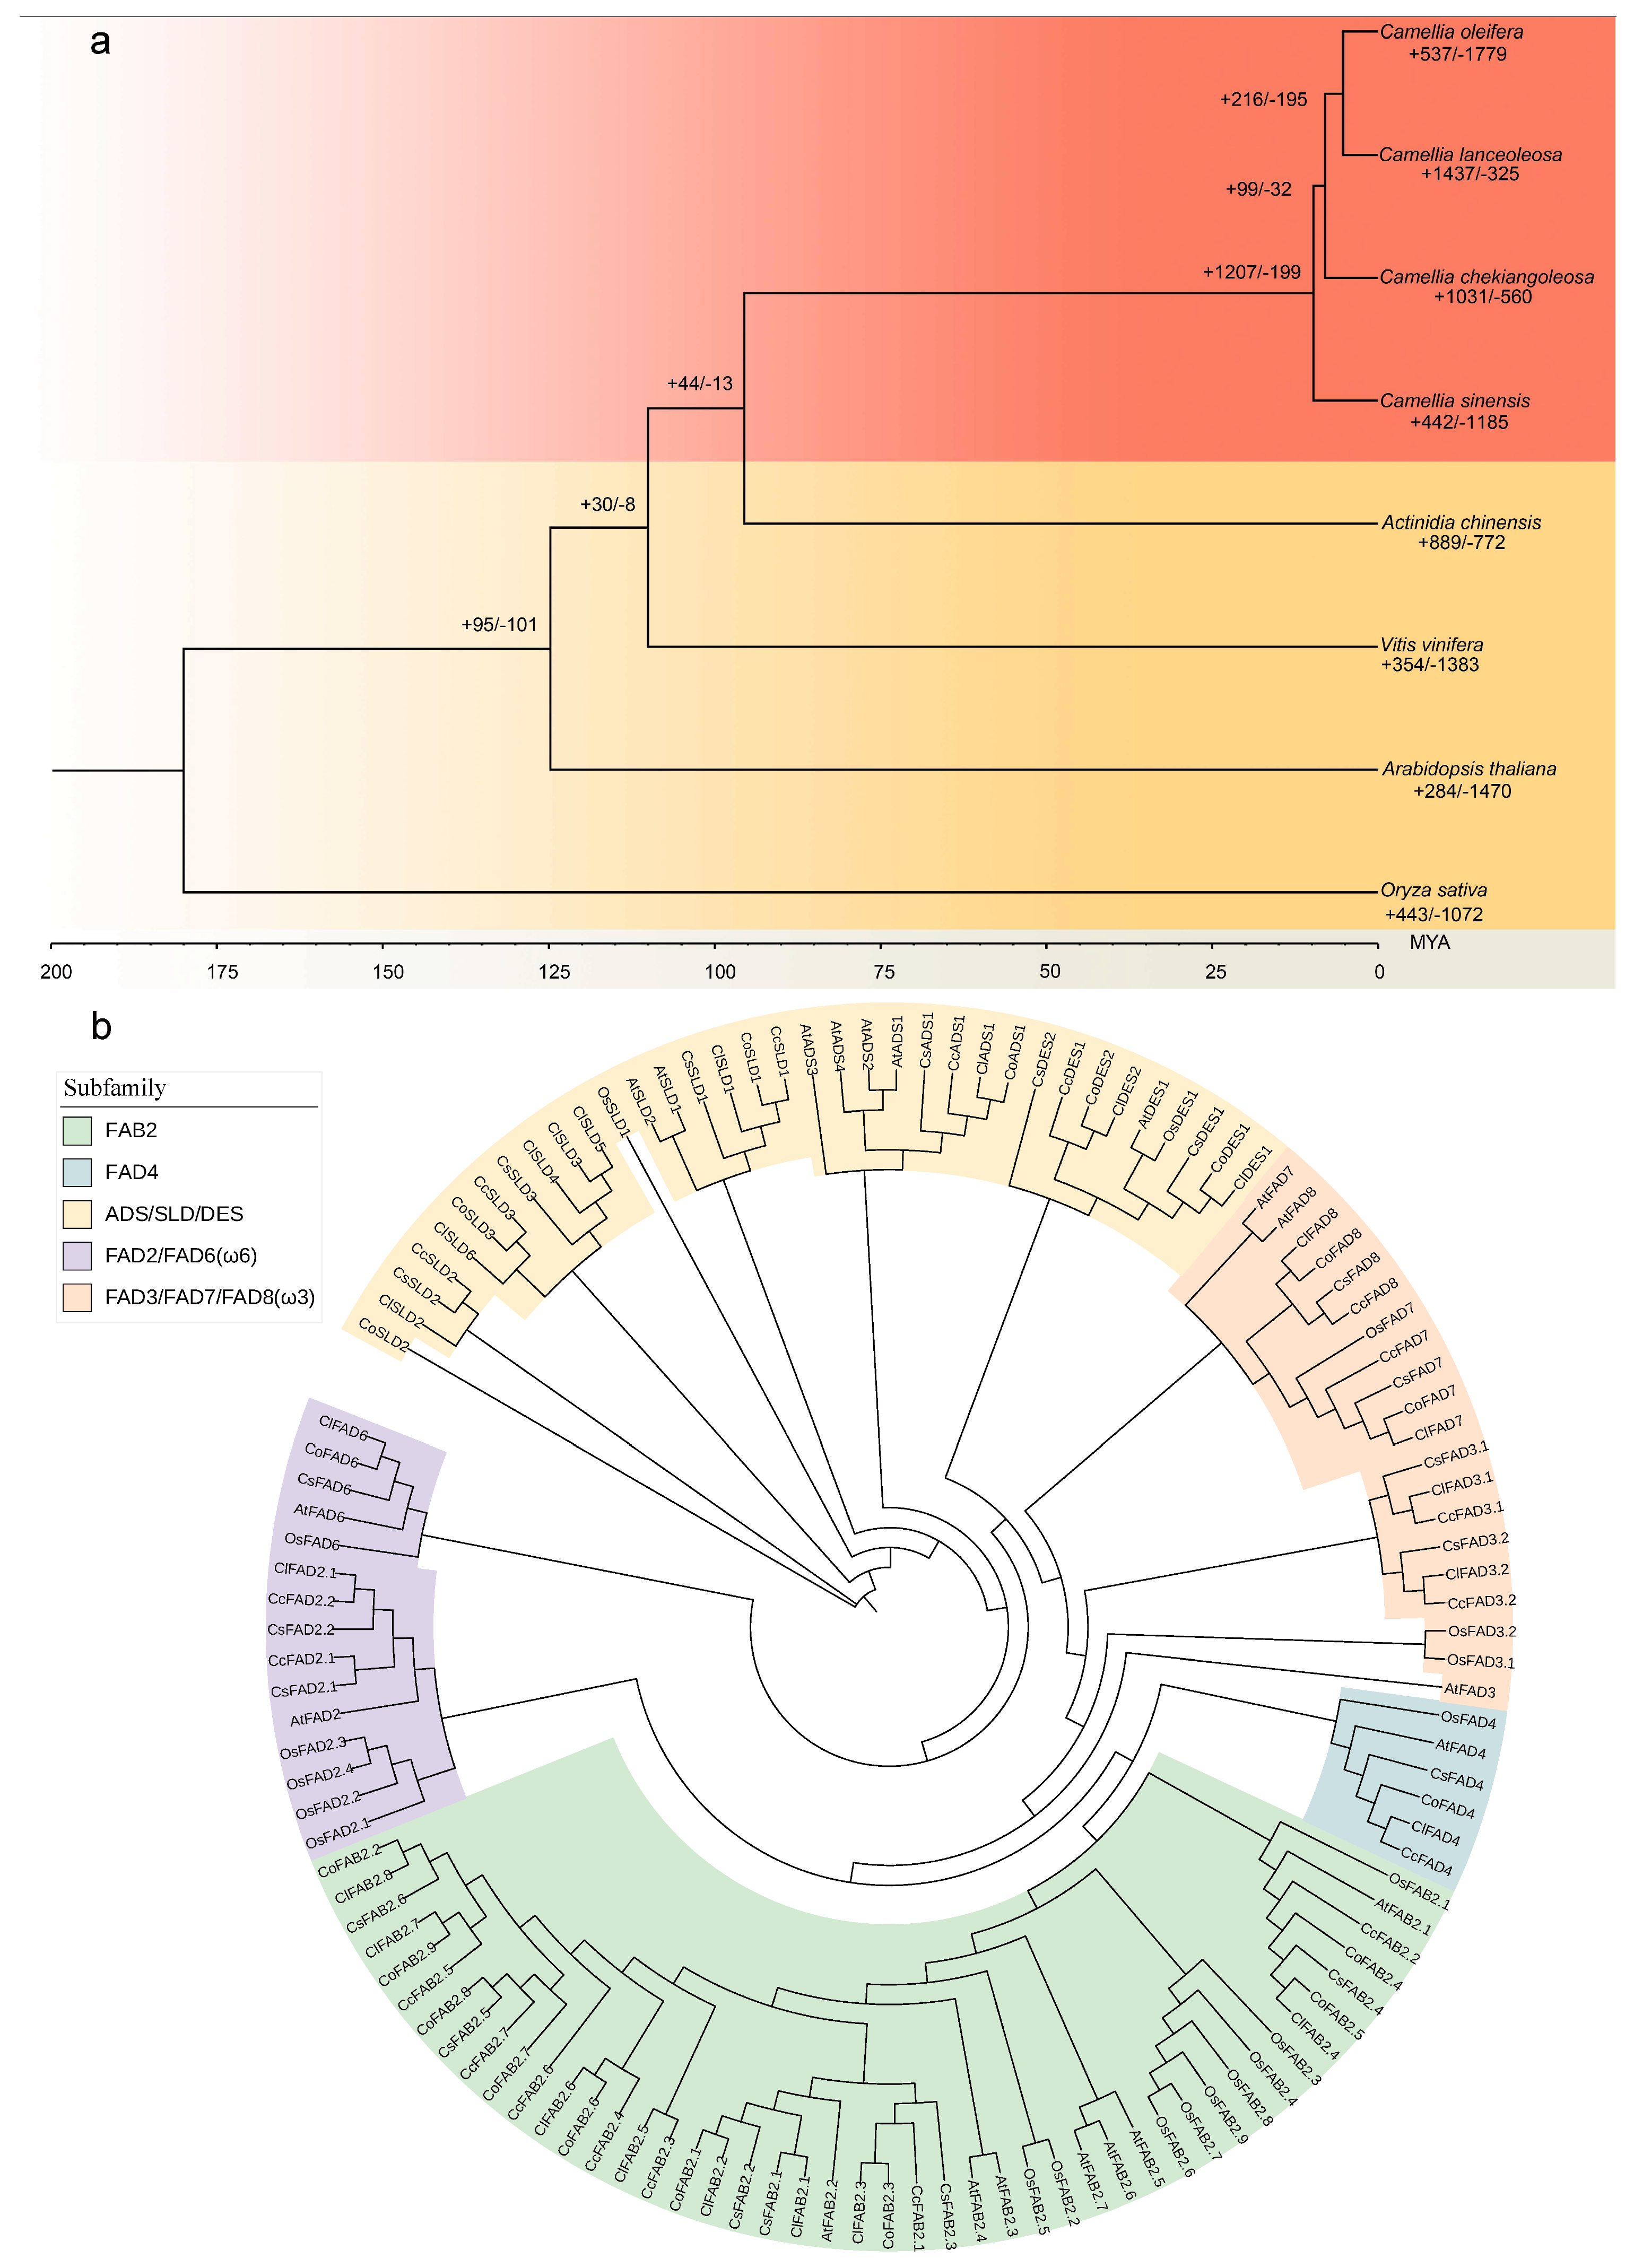
2.1. Genome Evolution and Expansion Analyses

A phylogenetic tree was constructed on the basis of 391 single-copy gene families from C. oleifera, C. chekiangoleosa, C. lanceoleosa, C. sinensis, Arabidopsis thaliana, Oryza sativa, Vitis vinifera, and Actinidia chinensis (Figure 1a). We identified a total of 6923 gene families that were common to all eight species. Additionally, we observed 881 gene clusters that were shared among C. sinensis, C. oleifera, C. chekiangoleosa, and C. lanceoleosa (Figure S1). A total of 1437 families, significantly expanded in the C. lanceoleosa lineage (p < 0.01), underwent gene ontology (GO) annotations related to functions associated with lipid, fatty acid, and seed processes. Studying lipid and fatty acid profiles in seeds is crucial for understanding seed-specific lipid metabolism and essential fatty acid synthesis. And the functionality related to stress responses, such as “response to salt stress” (GO:0009651), contributes to the adaptability of oil tea to its environment. Furthermore, the phylogenetic tree constructed using single-copy genes revealed multiple branches. Two wild species, C. oleifera and C. lanceoleosa, were closely connected on a single branch of the evolutionary tree. Specifically, the divergence of C. lanceoleosa from C. chekiangoleosa occurred approximately 7.9 million years ago, followed by the separation of C. lanceoleosa from C. oleifera approximately 5.2 million years ago (Figure 1a).

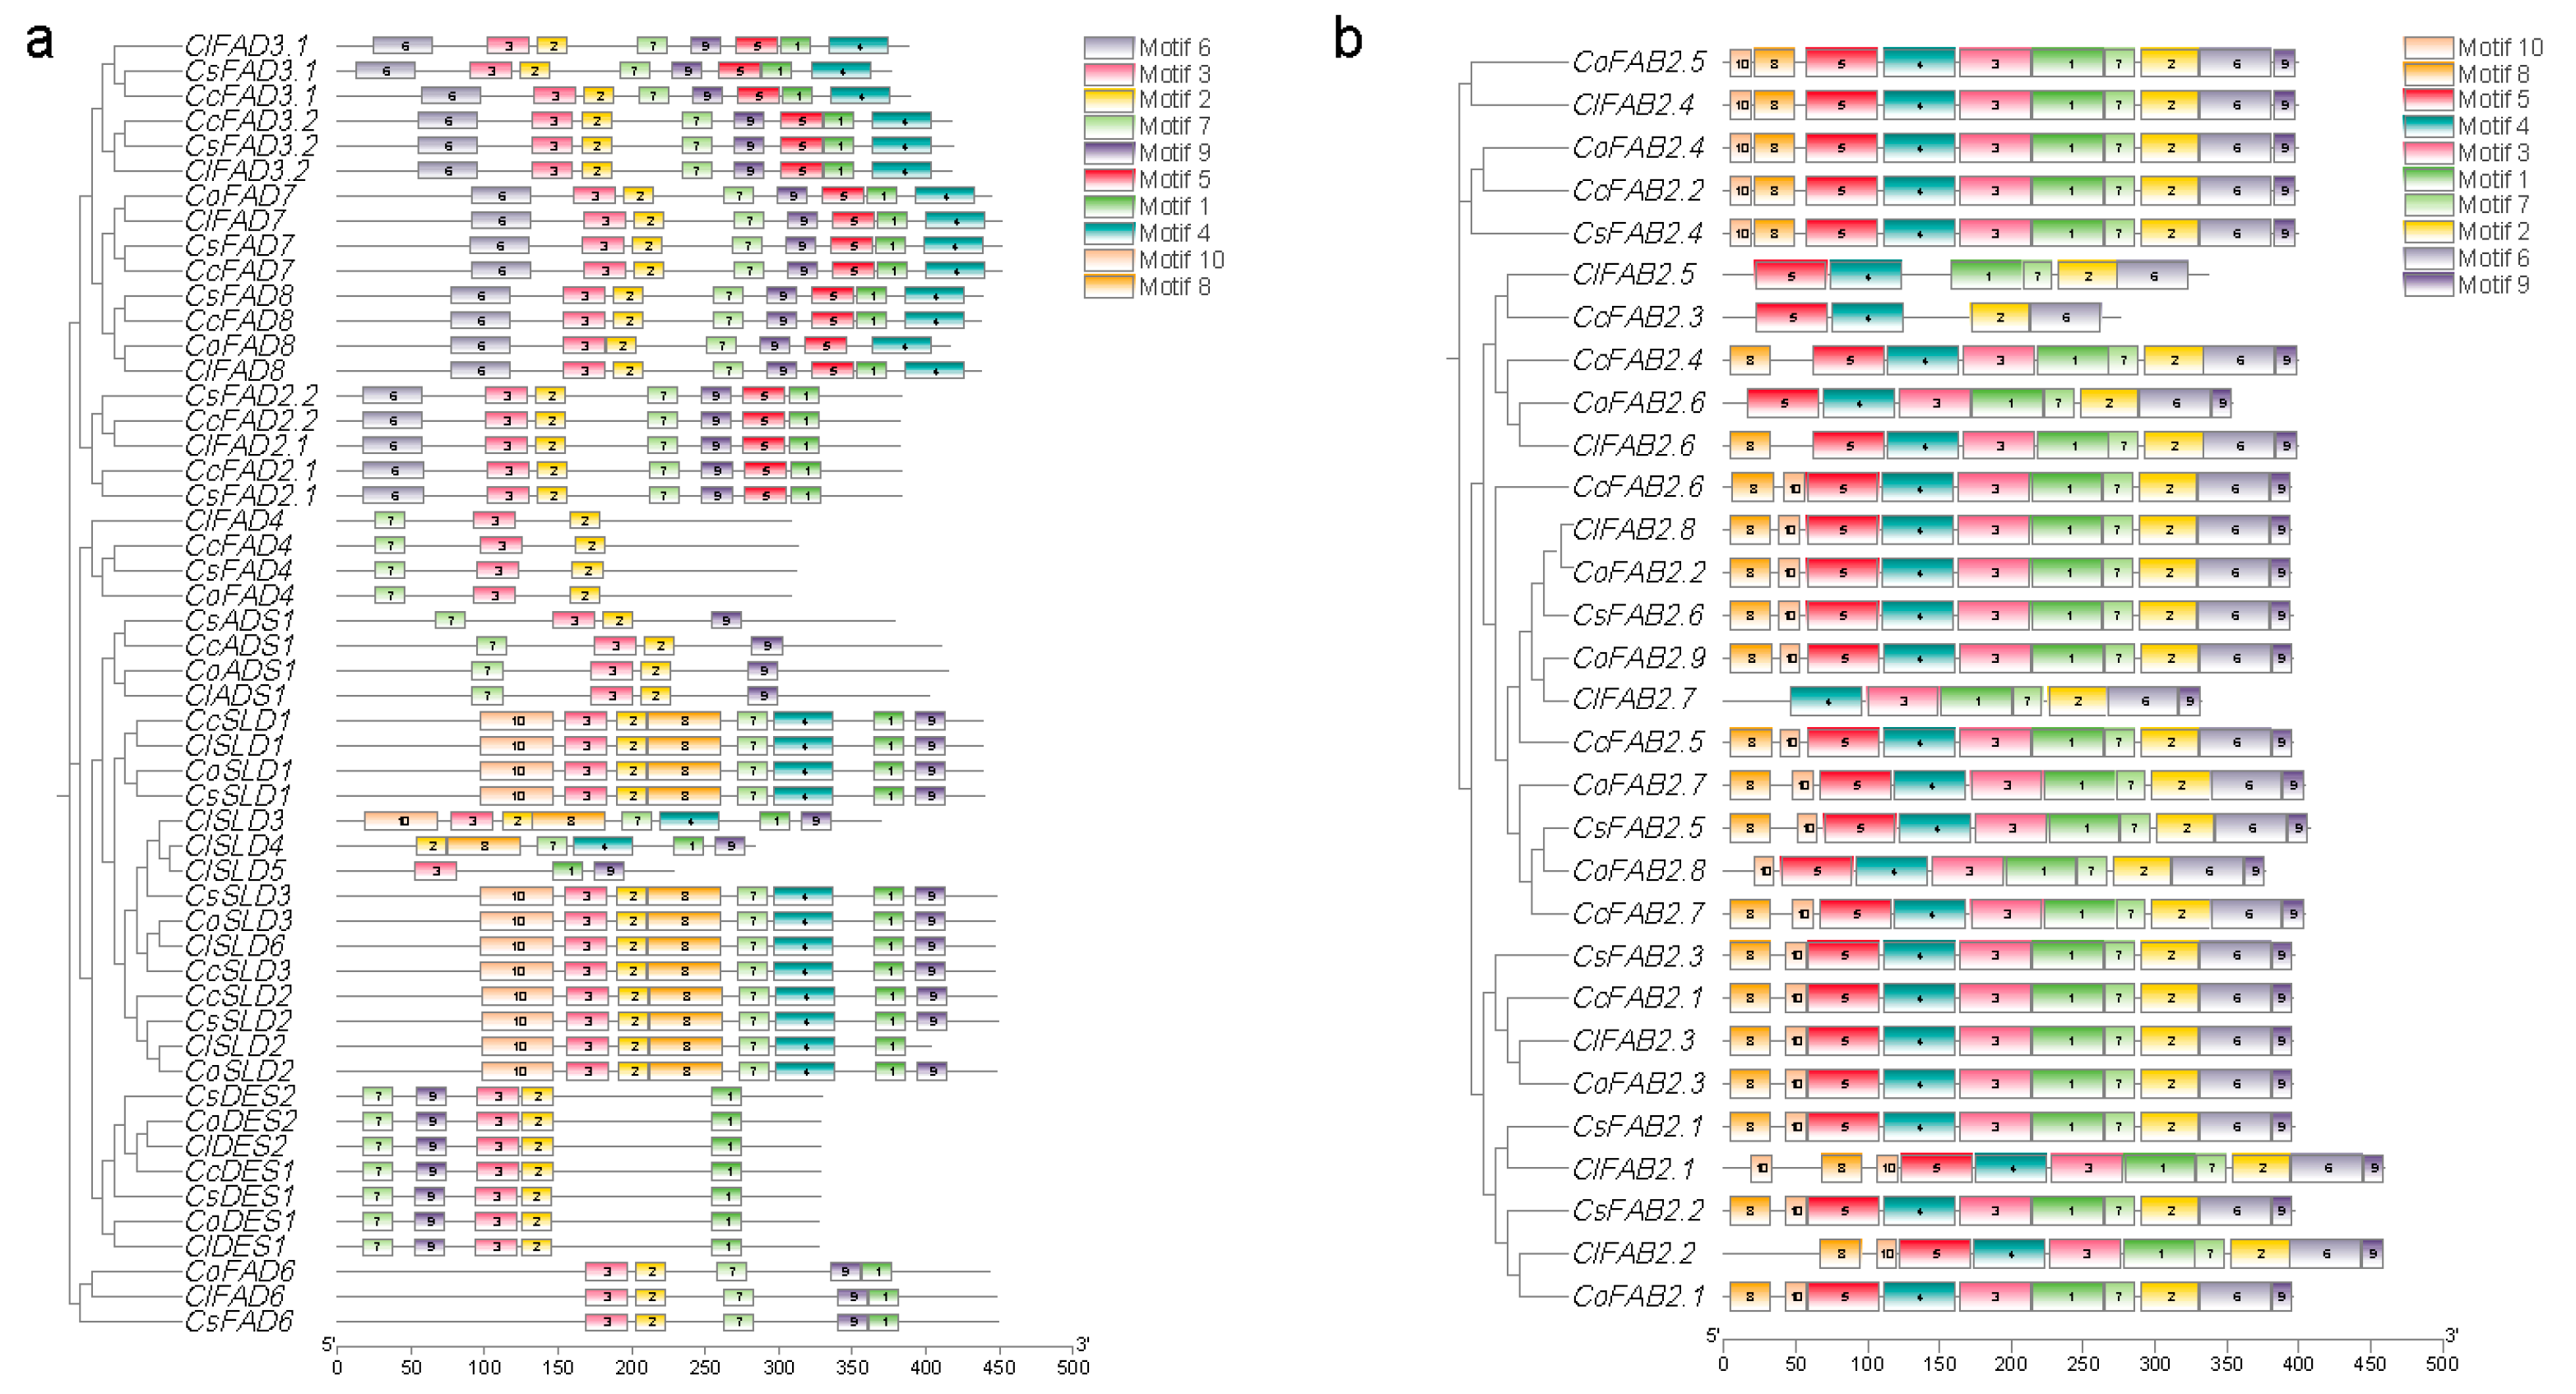
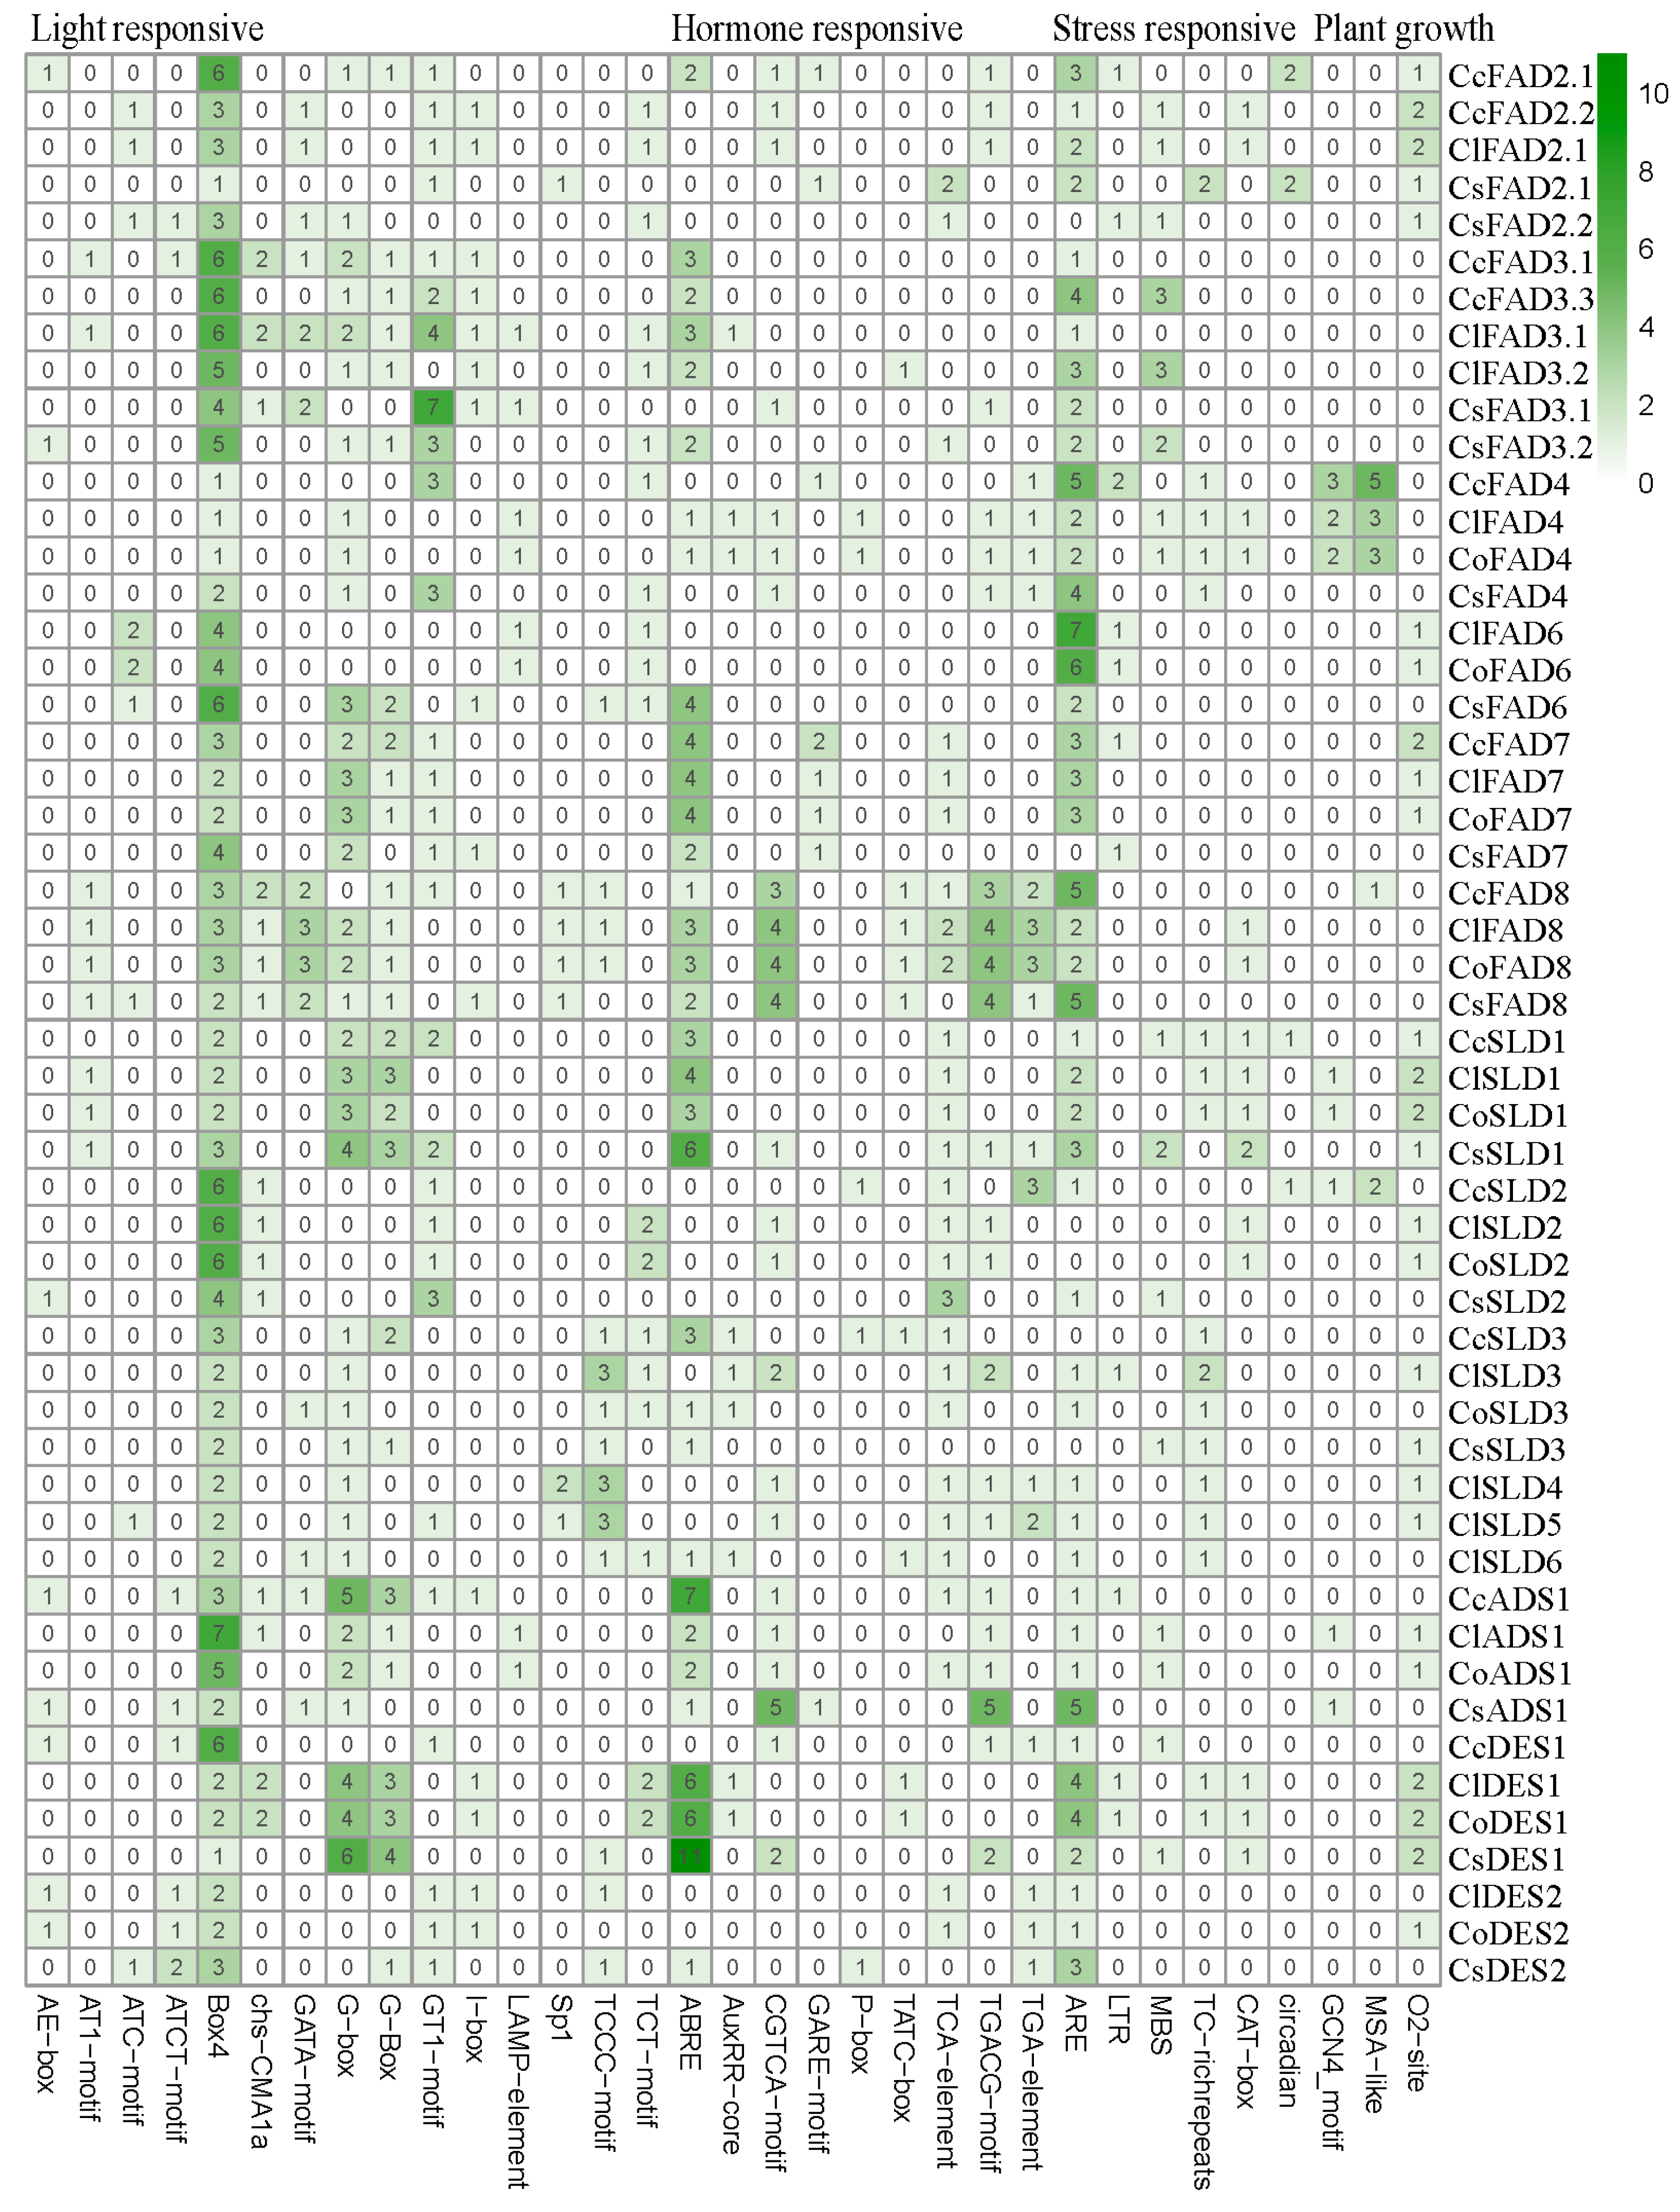
2.2. Identification and Bioinformatic Analysis of FAD Gene Family

In total, we successfully identified 24 ClFAD genes, 19 CoFAD genes, 19 CcFAD genes, and 20 CsFAD genes within the genome. Compared to the other two varieties, the higher quantity of the FAD gene family in C. lanceoleosa was consistent with the results of the comparative genomics, suggesting that this oil tea may possess greater activity or a richer potential for fatty acid biosynthesis. We conducted an analysis of the encoded protein size, molecular weight, isoelectric points, and subcellular localization of the FAD gene members (Table S2). Their encoded protein size ranged from 229 amino acids to 460 amino acids. The theoretical molecular weight of FADs varied from 25,371.67 to 52,663.39 Da, with the isoelectric points (pI) ranging from 5.21 to 9.78. With the exception of CcFAB2.3, which was located in the mitochondrion, the majority of the FAB gene members were predicted to be primarily localized within the chloroplast and cytoplasm. It was observed that FAD7 and FAD8 were, respectively, localized within the plasma membrane and the chloroplast.
According to their distinct functions, membrane-bound FADs can be further classified into five subfamilies, including FAB2, FAD4, FAD2/FAD6 (Omega-6 desaturases, ω6), FAD3/FAD7/FAD8 (Omega-3 desaturases, ω3), and ADS/SLD/DES. In these four Camellia species, each subfamily collectively contained 30, 4, 8, 14, and 26 FAD members, respectively (Figure 1b).
ClFAD6, CoFAD6, and CsFAD6 exhibited the highest exon count, each containing 10 exons. In the Omega-3 desaturases subfamily, FAD3 genes typically feature eight to nine exons, along with eight exons in both FAD7 and FAD8. In the ADS cluster, ClADS1, CsADS1, and CcADS1 each had five exons, while CoADS1 had six exons. Members of the DES and SLD subfamilies typically only had one to two exons (Figure S2).
We identified conserved domains, including FA_desaturase, lipid_DES, cyt-b5, and TMEM189_B, through an analysis with the CDD and SMART databases. In most tea and oil tea FAD genes, the FAB2 class contained one lengthy FA_desaturase_2 domain. The FAD4 class contained one B domain of TMEM. The DES class featured one C-terminal FA_desaturase domain and one Lipid_DES domain at its N-terminal side. The SLD class contained a C-terminal FA_desaturase domain and an N-terminal cytochrome b5 (Cyt-b5) domain.
There were 10 motifs identified in the FAD gene family (Figure 2). In tea and oil tea, the motif sequence within the FAB2(SAD) subfamily was highly conserved, with the majority following the order of motif 8, 10, 5, 4, 3, 1, 7, 2, 6, 9 (Figure 2b). It could be summarized that FAD proteins within the same subfamily exhibited a substantial similarity in terms of conserved motif types, numbers, and distributions.
We conducted a cis-acting elements analysis on the upstream 2 kb sequences of the FAD genes using PlantCARE [27] (Figure 3 and Figure S3). To comprehensively investigate the potential biological functions of the FAD gene family, we identified 29 distinct elements closely associated with light responsiveness. Light-responsive elements, such as Box 4 (258), were identified in all the promoters of FADs except ClFAB2.2, CoFAB2.1, and CsFAB2.2. Notable elements also included G-Box motifs (90), GT1-motif (75), TCT-motif (43), and TCCC-motif (42). Additionally, a spectrum of elements related to plant growth and development emerged, featuring O2-site (45), CAT-box motifs (23), circadian elements (18), and GCN4_motif (15). Remarkably, our analysis unveiled the presence of ARE elements (166), MBS motifs (37), and TC-rich repeats (36), all underscoring their roles as stress-responsive elements. Furthermore, our investigation revealed a multitude of cis-acting elements with hormone responsiveness. This encompassed a substantial number of ABRE motifs (183), indicative of a strong response to abscisic acid. Additionally, we observed TGACG-motif (65), associated with MeJA responsiveness. There were also TCA-element motifs (55), demonstrating a correlation with salicylic acid, alongside P-box sites (22), GARE-motif (17), and TATC-box motifs (16), all indicative of a response to gibberellic acid.

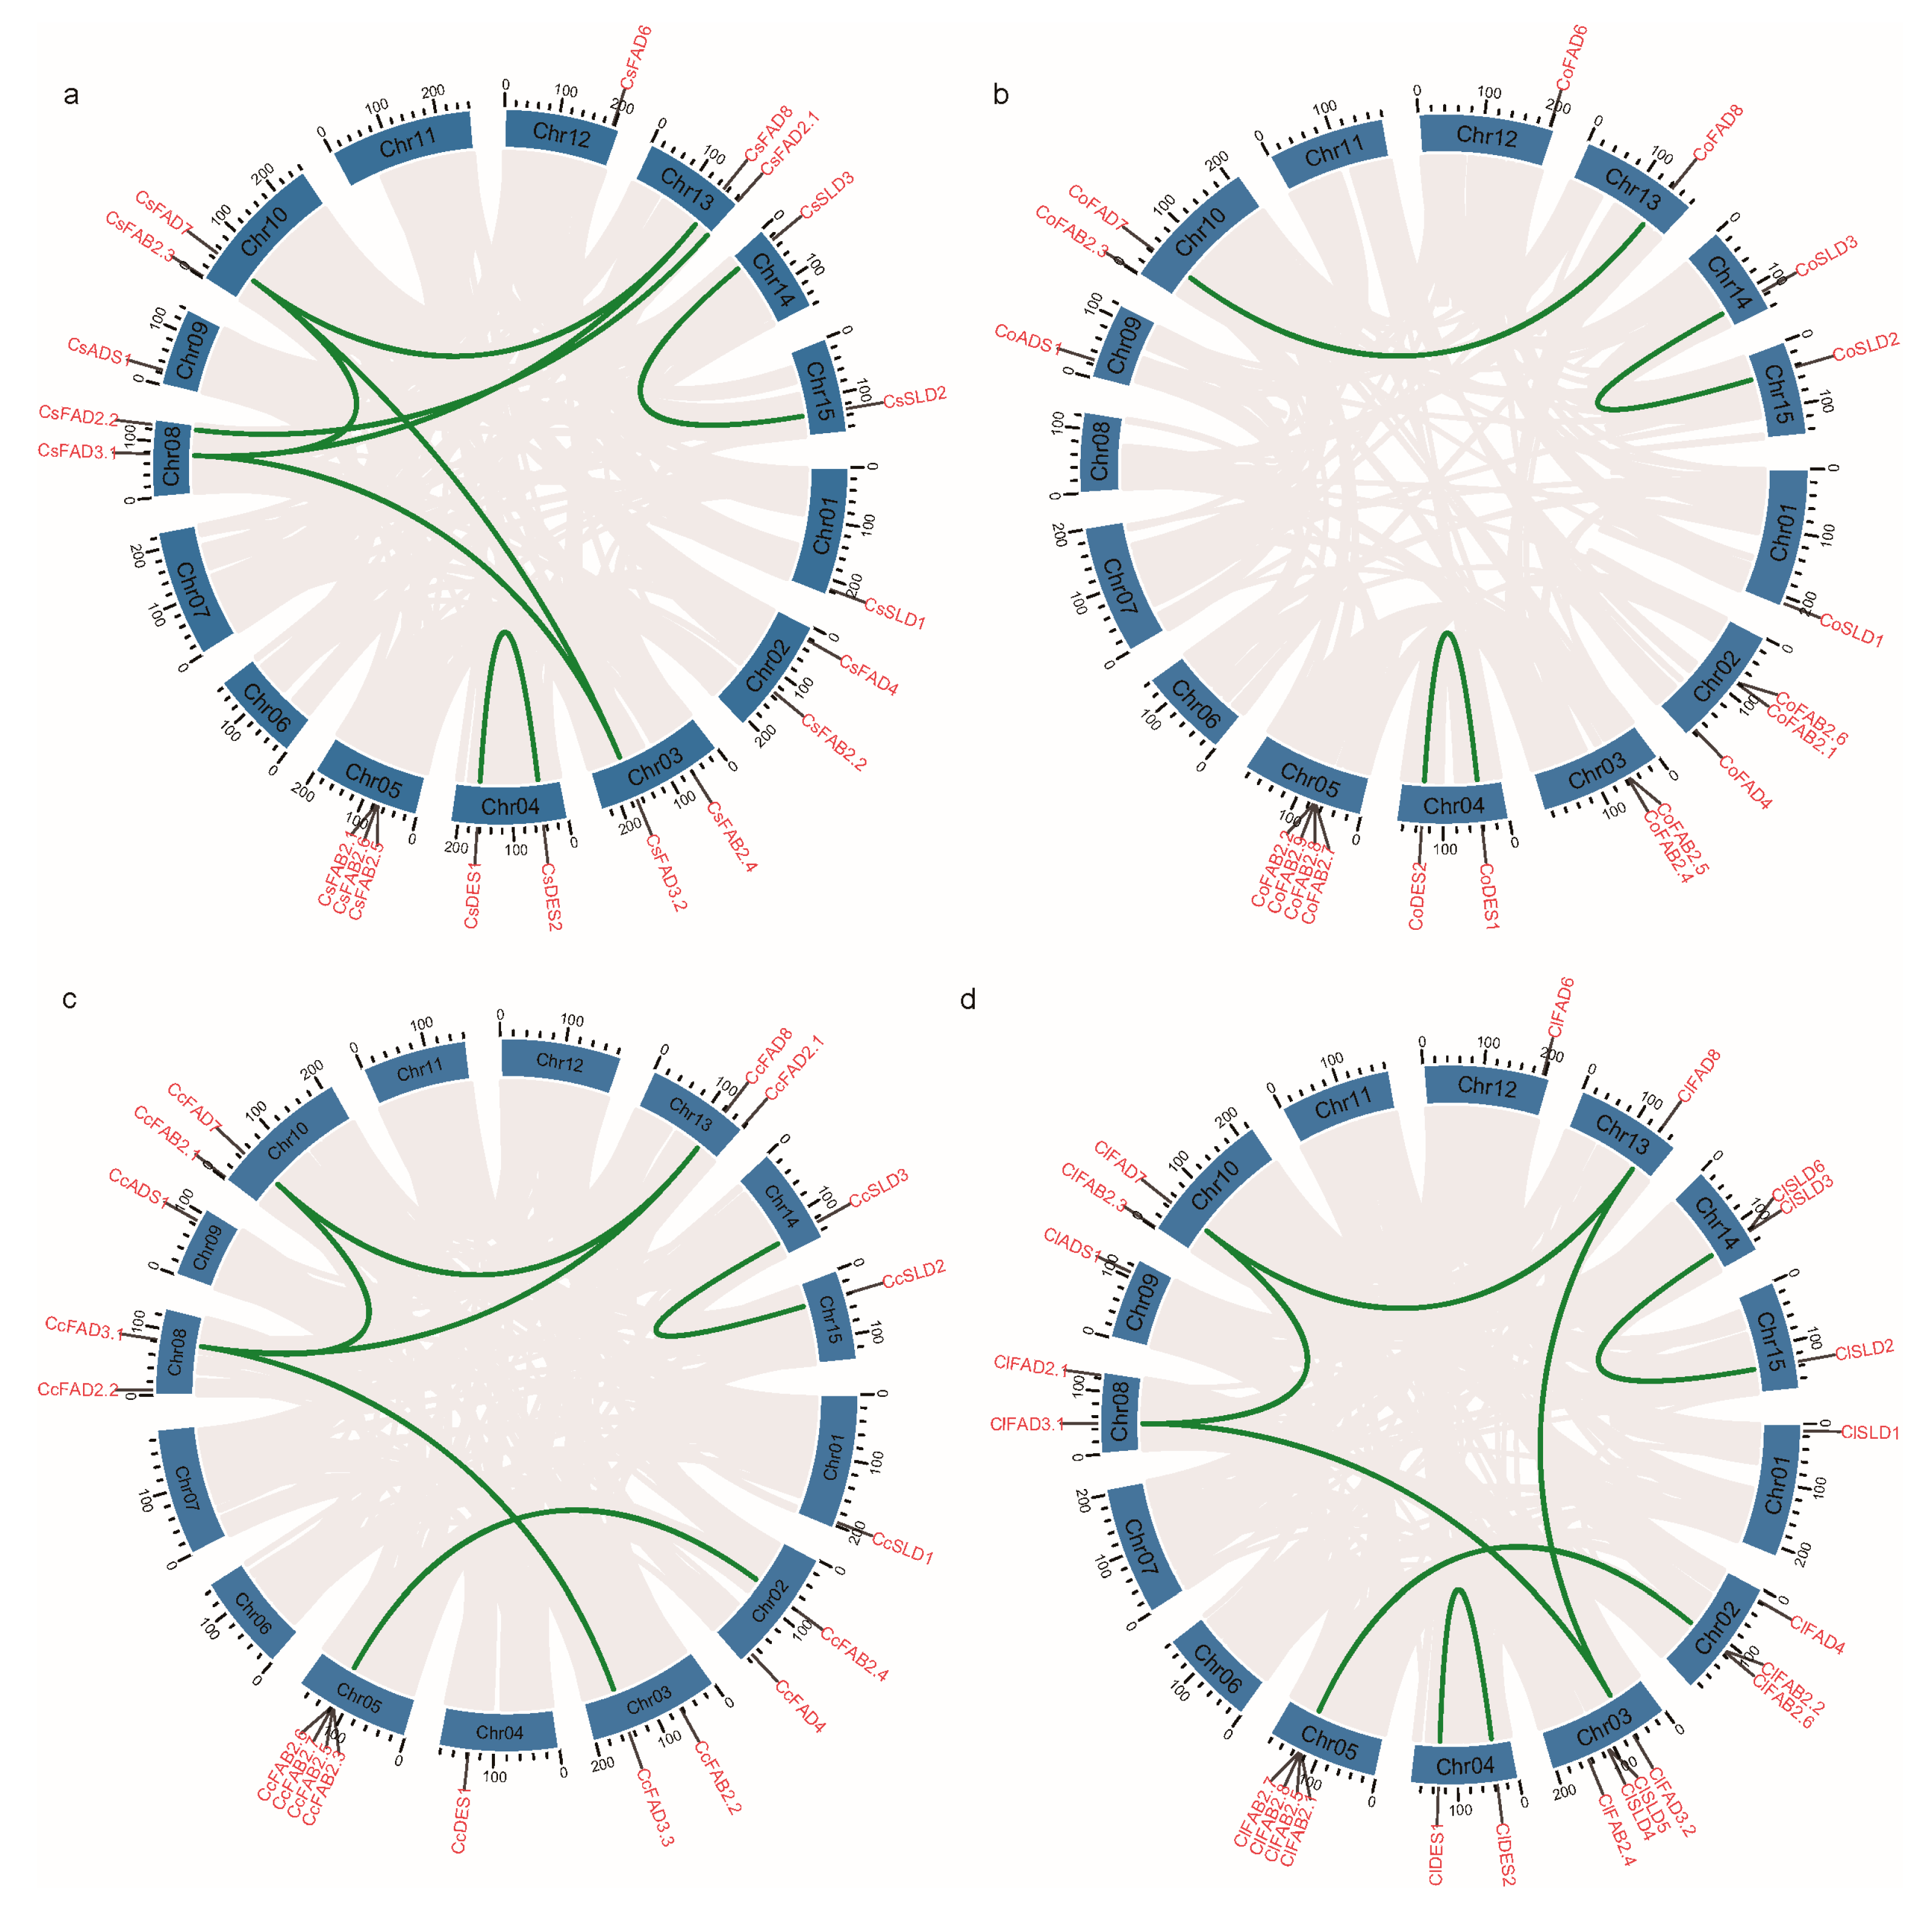
2.3. Chromosomal Location and Duplication Events of FAD Genes

In this study, we performed a comprehensive synteny analysis among four tea plant species, namely, C. sinensis (Cs), C. oleifera (Co), C. chekiangoleosa (Cc), and C. lanceoleosa (Cl). All four species, each possessing 15 chromosomes, exhibited a robust collinearity (Figure S4). To maintain consistency in describing the chromosomal locations of the gene family members, we adopted the chromosome nomenclature of C. oleifera. The chromosomal distribution of genes among the tea plant species (Cs, Co, Cc, and Cl) revealed intriguing patterns (Figure 4). Notably, within the FAD3/FAD7/FAD8 (ω3) subfamily, FAD7 genes consistently resided on chromosome 10 (Chr10) across all four species, while FAD8 genes exhibited a commonality in being located on chromosome 13 (Chr13). In the ADS/SLD/DES subfamily, ADS genes were clustered on chromosome 9 (Chr09) and DES genes were clustered on chromosome 4 (Chr04) for Cs, Co, Cc, and Cl. Furthermore, SLD genes demonstrated a shared presence on chromosomes 1 (Chr01), 14 (Chr14), and 15 (Chr15). This shared chromosomal distribution underscored the conserved nature of genomic organization among these tea plant species. Remarkably, the FAB2 genes on chromosome 5 (Chr05) exhibited closely positioned locations, suggesting a potential origin through duplication events. Specifically, in C. sinensis (Cs), the CsFAB2.1, CsFAB2.5, and CsFAB2.6 genes were tightly clustered on Chr05 (Figure 4a). In C. lanceoleosa (Cl), the ClFAB2.1, ClFAB2.5, ClFAB2.7, and ClFAB2.8 genes were also located in proximity on Chr05 (Figure 4d). Additionally, the CoFAB2.2, CoFAB2.7, CoFAB2.8, CoFAB2.9, CcFAB2.3, CcFAB2.5, CcFAB2.6, and CcFAB2.7 genes in C. oleifera (Co) and C. chekiangoleosa (Cc) were tightly clustered on Chr05 as well (Figure 4b,c). This implied a mechanism for the expansion of the FAD gene family, indicating that these genes might have arisen through duplication.
To further investigate gene duplication events within the FAD gene family, we conducted a collinearity analysis, identifying a total of 24 pairs of segmental duplication genes (Figure 4). Among them, C. lanceoleosa displayed seven duplicated gene pairs, including ClFAD7/ClFAD8, ClFAD7/ClFAD3.1, ClFAD3.1/ClFAD3.2, ClDES1/ClDES2, ClFAD8/ClFAD3.2, ClSLD2/ClSLD3, and ClFAB2.1/ClFAB2.2. C. sinensis exhibited eight pairs, such as CsFAD7/CsFAD8, CsFAD7/CsFAD3.1, CsFAD8/CsFAD3.1, CsFAD3.1/CsFAD3.2, CsFAD7/CsFAD3.2, CsDES1/CsDES2, CsSLD2/CsSLD3, and CsFAD2.1/CsFAD2.2.

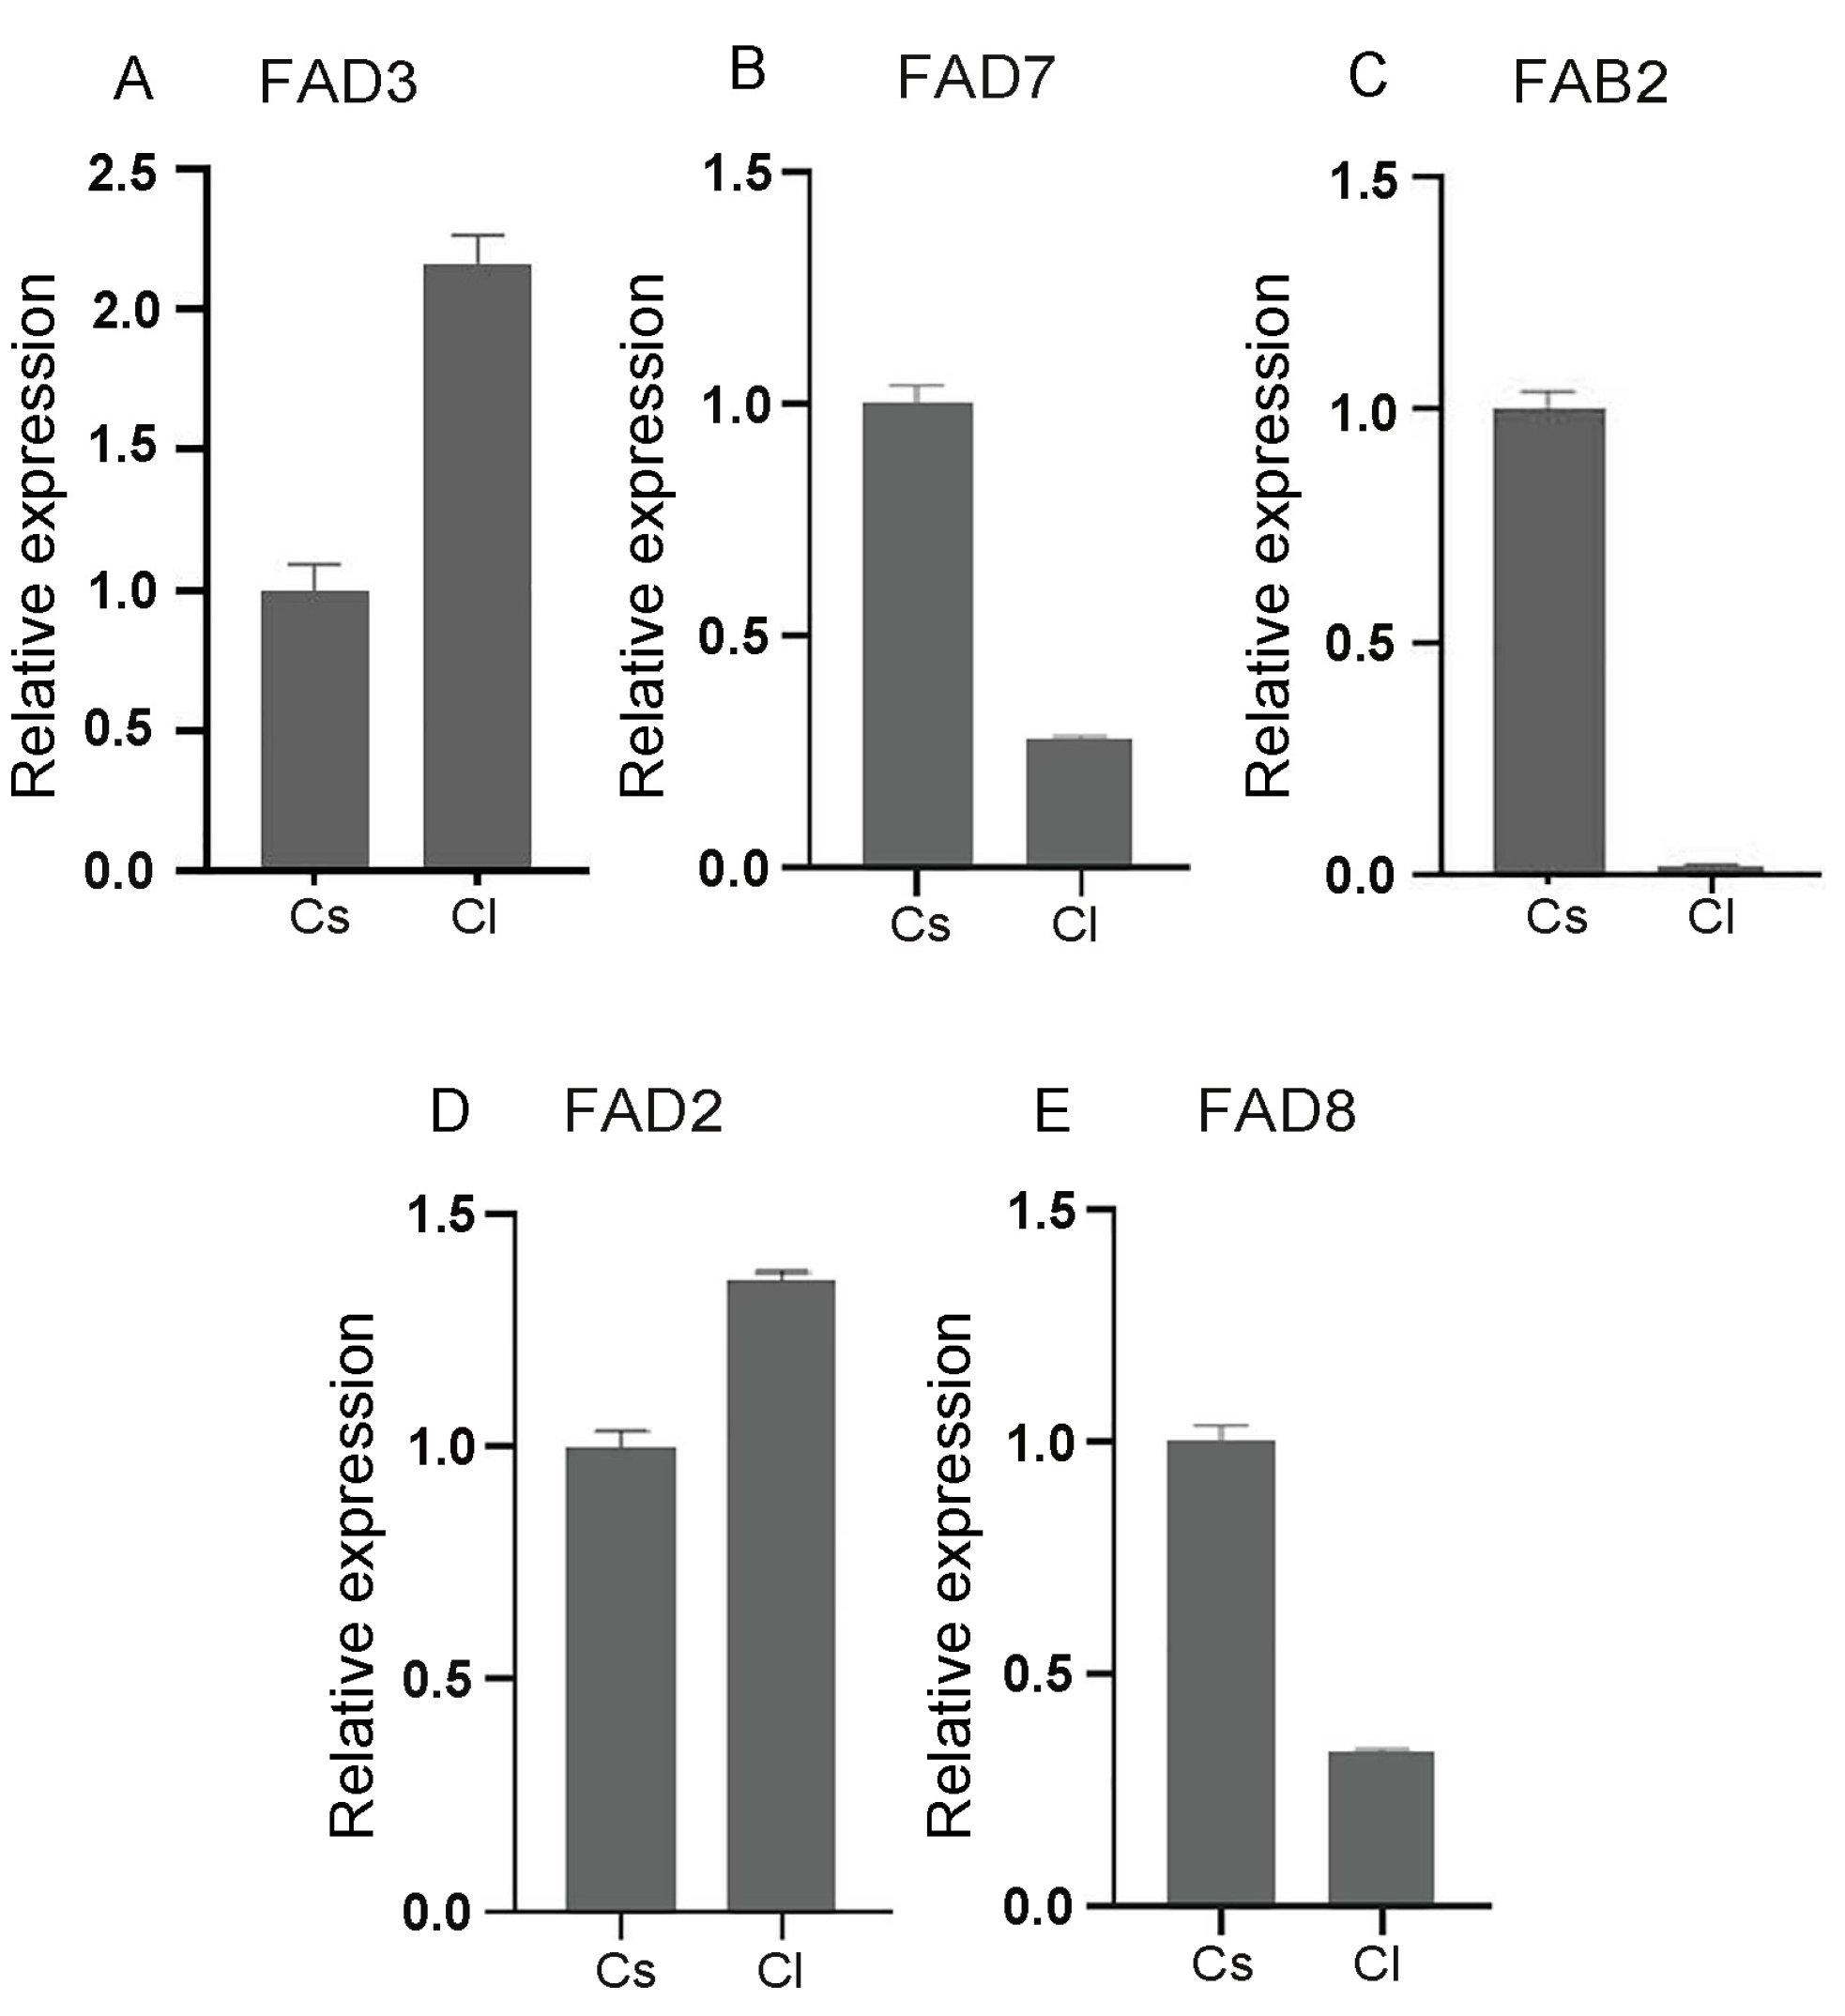
2.4. Comparative Expression Analysis of the FAD Gene Family in Seeds of Tea and Oil Tea

Almost all species of the Camellia species have seeds from which oil can be extracted. The expression heatmap (Figure 5) revealed that FAD3.2, FAD6, and DES1 were highly expressed in the seeds of C. lanceoleosa when comparing the FAD gene family between tea and oil tea. Within the FAB2(SAD) subfamily, FAB2.1, FAB2.2, and FAB2.4 showed a high expression in C. oleifera and C. chekiangoleosa. Genes such as FAD7 and FAD8 demonstrated relatively high expression levels in C. sinensis var. sinensis TGY. These findings indicated the differential expression of the FAD gene family between tea and oil tea. This may have contributed to the variations in oil contents among seeds of Camellia species.
Furthermore, we selected five genes: FAB2, FAD2, FAD3, FAD7, and FAD8. Their relative expression levels were quantified in the mature seeds of C. sinensis var. sinensis TGY and C. lanceoleosa using qPCR. The analysis indicated that FAB2, FAD3, FAD7, and FAD8 were significantly differentially expressed in the mature seeds of the tea and oil tea tree (Figure 6).

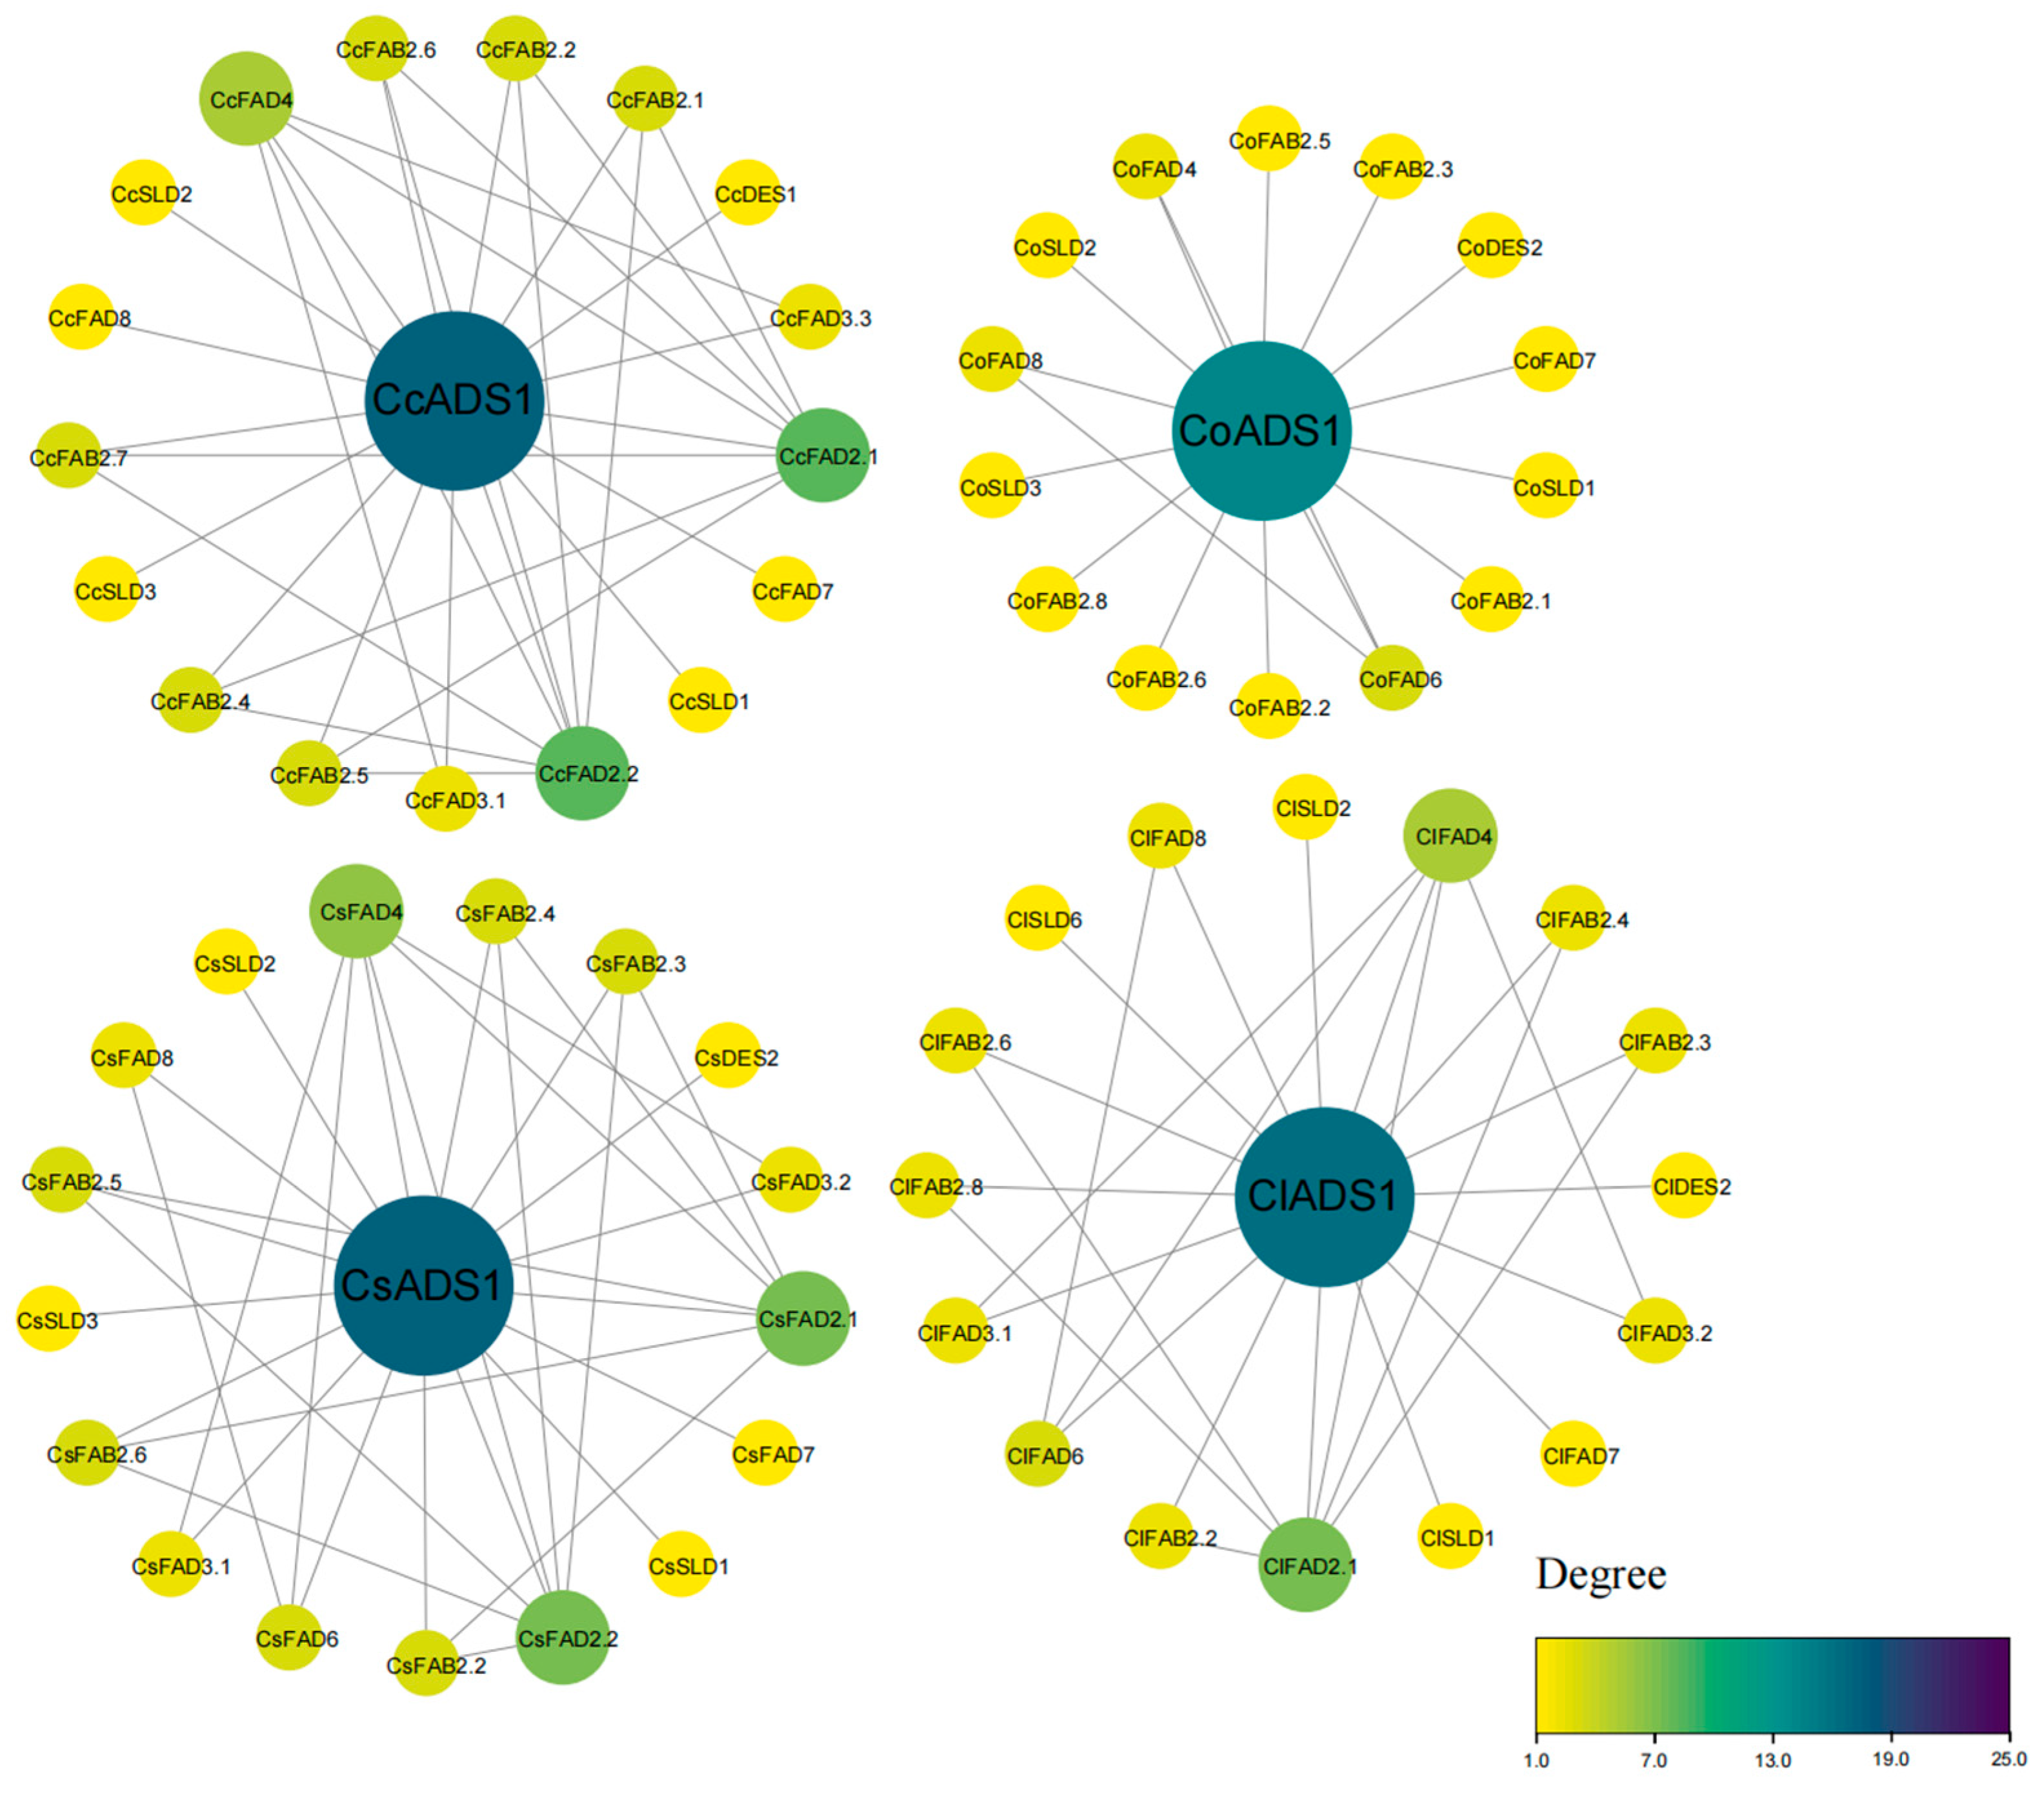
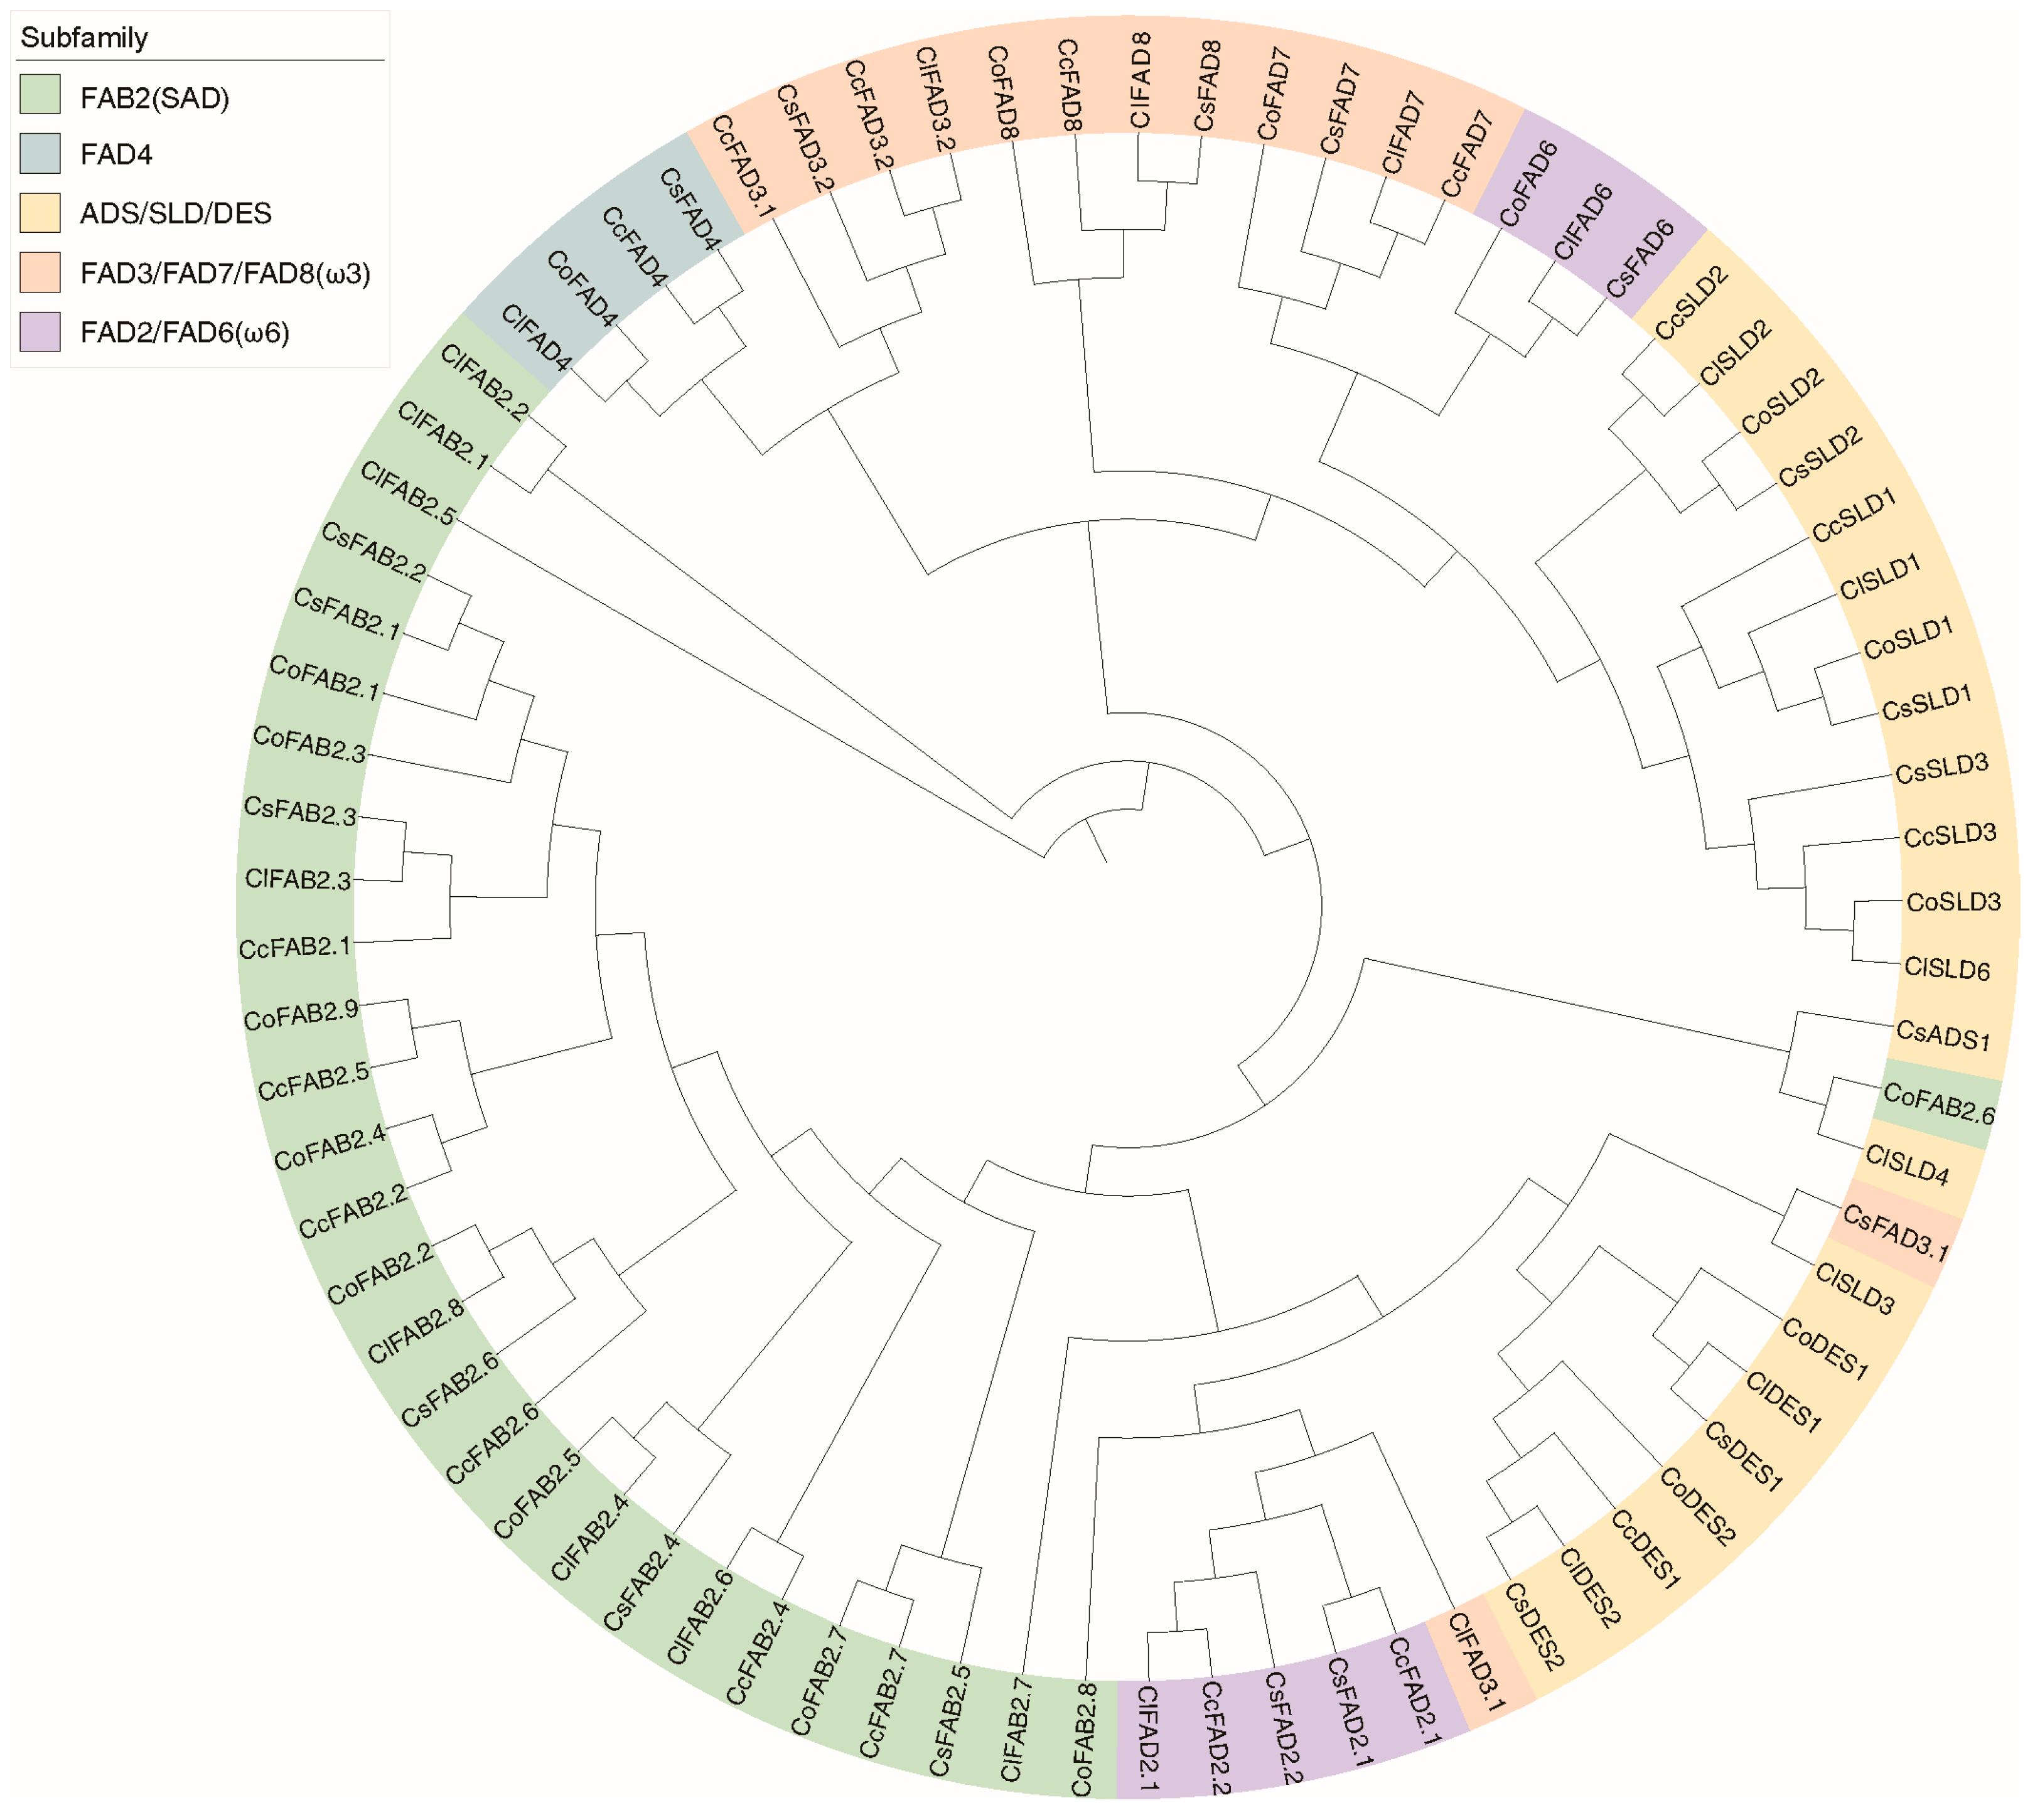
2.5. Clustering and Analysis of FAD Proteins in Tea and Oil Tea

The three-dimensional structure of FAD proteins was primarily composed of α-helices and β-sheets, and some proteins from the same subfamily exhibited similar three-dimensional structures, as exemplified by CsFAB2, ClFAB2, and CoFAB2 from the FAB2 subfamily (Figures S5 and S6). The results of the three-dimensional structure predictions suggested that proteins from the same group may share similar functions, indicating potential functional similarities among them. Additionally, we observed that in the FAD protein interaction networks of both tea and oil tea, the aminodeoxychorismate synthase (ADS) gene was identified as a hub gene, showing interactions with a majority of FAD genes (Figure 7).
We obtained high-confidence protein structures by filtering them based on an average per-residue confidence measure greater than 80, known as the predicted local distance difference test (pLDDT). Five proteins, namely, CcADS1, CcFAB2.3, ClADS1, ClSLD5, and CoADS1, were filtered out. The remaining 77 FAD proteins were used to construct a tree using the proposed method (Figure 8). The clustering analysis successfully grouped the protein structures based on their structural similarity. The generated UPGMA clustering tree provided a visual representation of the relationships between the structures, revealing distinct clusters and potential evolutionary connections. Further insights into the similarities and differences among the protein structures were gained through pairwise scores, including RMSD and TM-Score.
The differences observed in clustering results between protein structure and sequence could be attributed to the fact that while protein sequences offer insights into the linear arrangement of amino acids, protein structures capture the three-dimensional conformation and spatial arrangement of these amino acids. Protein structures are influenced by various factors, including sequence variations, domain rearrangements, and post-translational modifications [28,29,30]. Even when two proteins share similar sequences, these factors can lead to distinct structural arrangements. Such discrepancies become apparent when comparing clustering outcomes based on structural and sequence similarities. In the case of CoFAB2.6 and CsFAD3.1, their similar predicted protein structures led to them not being grouped into their original subfamilies based on sequence similarity (Figure 8).

3. Discussion

We conducted a comparative genomic analysis of tea and oil tea and found that the significantly expanded gene family in oil tea was enriched with functions related to fatty acid synthesis, consistent with previous studies [10,11,12]. After performing a sequence alignment and searching against the Pfam protein family database, we identified 82 candidate FAD genes. Among them, the number of FAD genes in C. lanceoleosa was the largest, indicating that these genes had expanded in evolution and produced many new mutations. The metabolic studies revealed that seeds of C. lanceoleosa contained a high oil content of 46.22%, with approximately 80.29% being oleic acid [12]. In contrast, C. sinensis seeds had a lower oil content ranging from 26.33% to 31.81% [31], with an oleic acid content of approximately 58% [32]. These results suggested that C. lanceoleosa may have higher activity or richer potential for fatty acid biosynthesis. The FAD gene family can be divided into five subfamilies, which is similar to the classification observed in banana and wheat [19,22]. And plants have two categories of FAD members: soluble desaturases, like 18:0-ACP desaturase (FAB2/SAD), which function early in fatty acid synthesis, and membrane-bound desaturases, primarily found in the endoplasmic reticulum and chloroplasts [33,34,35]. In C. sinensis, C. lanceoleosa, C. oleifera, and C. chekiangoleosa, certain FAB2 genes were closely located on chromosome 5, forming gene clusters. The chromosome localization analysis suggested a higher level of conservation among members of the same subfamily in oil tea and tea. We found that FAD proteins within the same subfamily shared similarities in terms of the type, number, and distribution of conserved motifs. Similar results have been identified in rice, wheat, and banana, indicating that the FAD gene family was conserved [19,20,22]. The difference in conserved motifs among different subfamilies suggested that specific conserved motifs play an important role in plant growth and development.
Our investigation into the protein–protein interaction network of the FAD gene family indicated that ADS genes likely hold crucial regulatory roles within tea plants and oil tea plants, influencing the function of the FAD gene family. Previous research indicated that rice and banana lack ADS members, and ADS emerged after the divergence of monocotyledonous and dicotyledonous plants [19]. This discovery suggested that ADS genes may have distinct evolutionary histories and biological functions across various plant taxa. The functional enrichments in the network included unsaturated fatty acid biosynthesis, the cellular response to cold, and fatty acid biosynthesis as biological processes, along with stearoyl–acyl carrier protein desaturase and acyl–acyl carrier protein desaturase as molecular functions. We identified conserved domains, including FA_desaturase, lipid_DES, cyt-b5, and others. Protein domains are crucial structures that define a protein’s identity and indicate its function [36]. Further, we conducted protein structure predictions for the FAD gene family. When considering their structural similarities, these proteins were assigned to different clusters. This could be attributed to the fact that despite having similar sequences, these proteins may have undergone structural changes that resulted in distinct spatial arrangements. Therefore, it is essential to consider both sequence and structural information to gain a comprehensive understanding of protein relationships and evolutionary connections. Previous studies have shown that a structural cluster analysis is more robust than sequence clustering in grouping functionally similar proteins [37]. By incorporating both aspects in the analysis, we could obtain a more comprehensive and accurate depiction of protein clustering and phylogenetic relationships. In existing studies, a novel model has been proposed that integrates protein structure and sequence data, aiming to improve the accuracy of protein function prediction while also enhancing the model’s applicability across different proteins [38]. This study provided a reference for future experiments to verify whether a structural cluster analysis could effectively group proteins with the same function into the same evolutionary branch, potentially using known functional or structurally characterized FAD proteins.

4. Materials and Methods

4.1. Genome Evolution and Expansion Analyses

OrthoVenn3 [39] (https://orthovenn3.bioinfotoolkits.net/home) was used for the comparative genomics analysis, accessed on 23 September 2023. A phylogenetic tree was constructed on the basis of 391 single-copy gene families from C. oleifera, C. chekiangoleosa, C. lanceoleosa, A. thaliana, O sativa, C. sinensis, V. vinifera, and A. chinensis. The expansion and contraction of the gene clusters was analyzed with cafe5 [40]. Species divergence times were determined based on information from the Timetree (http://www.timetree.org/, accessed on 23 September 2023).

4.2. Identification and Bioinformatic Analysis of FAD Gene Family

The protein sequences for C. oleifera var. “Nanyongensis” (CON) can be conveniently accessed on GitHub at the following URL: https://github.com/Hengfu-Yin/CON_genome_data, accessed on 19 July 2023. For C. sinensis and C. chekiangoleosa, the respective protein sequences are accessible via the Genome Warehouse (GWH) database under the accession numbers GWHASIV00000000 and GWHBGBN00000000. The protein sequences of O. sativa and A. thaliana were downloaded from the Phytozome database (https://phytozome-next.jgi.doe.gov/, accessed on 19 July 2023).
To identify and characterize members of the FAD gene family in oil tea and tea, we utilized a combination of bioinformatics tools. The hidden Markov model (HMM) files corresponding to the FA_desaturase (PF00487), FA_desaturase 2 (PF03405), and TMEM189 (PF10520) domains downloaded from Pfam protein family database (http://pfam.xfam.org/) were searched against the protein data with e-value ≤ 1 × 10⁻⁵ as the criterion. After removing the redundant sequences, the putative FAD protein sequences were submitted to the NCBI Conserved Domains Database (https://www.ncbi.nlm.nih.gov/cdd/) and SMART database (http://smart.embl.de/), accessed on 28 September 2023.
We constructed phylogenetic trees utilizing RAxML (v1.2.0) [41] with the JTT+FC model based on protein sequences from the FAD gene family and performed a bootstrap analysis with 1000 replicates. The MEME (https://meme-suite.org/meme/tools/meme) was utilized with a motif search quantity parameter set to 20 for the purpose of identifying conserved structural domains within the FAD gene family, accessed on 15 January 2024. A visualization of the conserved motifs in FADs was performed using the TBtools (v2.080) [42] Gene structures were analyzed using the Gene Structure Display Server (GSDS, http://gsds.gao-lab.org/), accessd on 15 January 2024. ExPASy Protparam (https://web.expasy.org/protparam/) was employed to analyze the physicochemical properties of the identified proteins, accessd on 20 January 2024. Additionally, WOLF PSORT (https://wolfpsort.hgcip) was utilized to predict the subcellular localization of the FAD family members, accessd on 20 January 2024. Upstream sequences of the FAD-coding sequences (2 kb) were extracted from genome using TBtools [42] and subjected to a cis-acting elements prediction analysis using PlantCARE [27] (http://bioinformatics.psb.ugent.be/webtools/plantcare/html/, accessd on 20 January 2024). To better illustrate the enrichment of motifs in the promoters of FAD genes, motifs with a total count of less than 10 across all genes were removed.

4.3. Chromosomal Location and Duplication Events of FAD Genes

We performed a sequence alignment of all FAD protein sequences using the local BlastP program with an e-value threshold of 1 × 10⁻¹⁰ and considering the top 5 alignments. The resulting BlastP outputs, combined with genomic annotation files, were then used as the input for generating collinearity and tandem files through MCScanX [43]. The collinearity analysis was meticulously conducted and visualized using MCScanX (https://github.com/wyp1125/MCScanx) and TBtools (v2.080) [42,43]. We explored the interrelationship between oil tea and tea using JCVI (v1.3.5) (https://github.com/tanghaibao/jcvi) and visualized the collinearity between the four species.

4.4. Comparative Expression Analysis of the FAD Genes in Seeds of Tea and Oil Tea

The samples we utilized for our transcriptome analysis were taken from mature seeds. Seed materials from C. lanceoleosa, C. oleifera, and C. sinensis var. sinensis TGY were collected and stored at −80 °C for the subsequent analysis. The Hieff NGS® MaxUpTM II Dual-mode mRNA Library Prep Kit for Illumina® (Yeasen, Shanghai, China) was employed to prepare mRNA libraries for sequencing on Illumina platforms. After the library preparation and pooling of different samples, they underwent Illumina sequencing. All experiments were biologically replicated three times. The quality assessment and filtering of original sequencing data were performed using Fastp (v0.23.2) software [44]. The sequenced reads were aligned to the reference genome of C. lanceoleosa using Hisat2 [45]. The gene expression quantification of the aligned reads was conducted using StringTie [46]. Expression heatmaps were generated using the R package TOmicsVis [47] to visualize and analyze gene expression patterns.

4.5. Quantitative RT-PCR (qRT-PCR) in Seeds of Tea and Oil Tea

A RNAprep Pure Plant Plus Kit was used to extract RNA from samples. cDNA was synthesized with an M-MLV 4 First-Strand cDNA Synthesis Kit and qRT-PCR was conducted using Green qPCR MasterMix. Relative transcript abundance was calculated using the comparative 2−ΔΔCT method. EF1α was selected as the internal control for qRT-PCR and the primers utilized in the study are detailed in supplementary Table S1.

4.6. Protein Clustering and Analyzing

For protein structure prediction and visualization, we relied on the FastAF2 tool (https://cloud.zelixir.com/fastaf2/#/fast-af2, accessed on 21 November 2023). We specifically focused on obtaining high-confidence protein structures by filtering them with an average per-residue confidence metric called predicted local distance difference test (pLDDT) greater than 80. We utilized the TMscoring algorithm to assess the structural similarity between pairs of protein structures. The TM-score provided a quantitative measure of similarity, while RMSD quantified the deviation between corresponding atoms. For each protein structure pair, we calculated both TM-score and RMSD values. By assigning weights to TM-score and normalized RMSD, we derived a combined score that accurately represented the overall structural similarity.
To cluster the protein structures, we constructed a similarity matrix based on the combined scores. The Unweighted Pair Group Method with Arithmetic Mean (UPGMA) algorithm was then applied to the similarity matrix, generating a hierarchical clustering tree. This clustering tree offered an intuitive representation of the relationships between the protein structures. To visualize the clustering tree, we used the iTOL (https://itol.embl.de/) platform. In addition, the FAD protein–protein interaction network was analyzed using the STRING database (https://cn.string-db.org/) to identify hub genes. After establishing the protein–protein interaction (PPI) relationship, a network diagram was created using Cytoscape [48] (v3.10.1) software. Hub genes were identified within the network based on degree centrality.

Supplementary Materials

The following supporting information can be downloaded at: https://www.mdpi.com/article/10.3390/plants13111444/s1, Figure S1: Orthologous cluster analysis of eight plant species, including C. oleifera, C. chekiangoleosa, C. lanceoleosa, A. thaliana, O. sativa, C. sinensis, V. vinifera, and A. chinensis. Figure S2: Gene structure diagram illustrating the features of FAD genes. Coding sequences (CDS) are represented in green, while untranslated regions (UTR) are depicted in yellow. Figure S3: Distribution of cis-acting elements in the promoters of FAB2(SAD) subfamily from tea and oil tea. Figure S4: Comprehensive synteny analysis of C. sinensis (Cs), C. oleifera (Co), C. chekiangoleosa (Cc), and C. lanceoleosa (Cl). Figure S5: Predicted three-dimensional structures of FAD proteins, except the FAB2(SAD) proteins from tea and oil tea. Figure S6: Predicted three-dimensional structures of FAB2(SAD) proteins from tea and oil tea. Table S1: Details of primers used in this study. Table S2: Characteristics of FAD gene family in tea and oil tea.

Author Contributions

Z.H. and X.Z. conceived the study; Z.Y., D.M., Y.W., H.D., X.L. and T.Z. collected data; Z.H. and Z.Y. wrote the manuscript; and all authors read, edited, and approved the manuscript. All authors have read and agreed to the published version of the manuscript.

Funding

This work was supported by the Forestry Science and Technology Innovation Program of Hunan Province (no. XLK202101-2), Science and Technology Innovation Platform, and the Talent Program of Hunan Province (no. 2023RC3164).

Data Availability Statement

The protein sequences for C. oleifera were stored in a GitHub repository, which is publicly accessible at https://github.com/Hengfu-Yin/CON_genome_data, accessed on 19 July 2023. Protein sequences for C. sinensis and C. chekiangoleosa were deposited in the Genome Warehouse (GWH) at the National Genomics Data Center, Beijing Institute of Genomics (Chinese Academy of Sciences), and can be accessed with the accession numbers GWHASIV00000000 and GWHBGBN00000000, respectively. Reference protein sequences for O. sativa and A. thaliana were downloaded from the Phytozome database (available via https://phytozome-next.jgi.doe.gov/), accessed on 19 July 2023. The transcriptome data of C. chekiangoleosa seeds can be accessed from the Sequence Read Archive (SRA) using the accession number PRJNA753883.

Acknowledgments

The authors would like to thank the staff of the anonymous reviewers and editors for their constructive comments.

Conflicts of Interest

The authors declare no conflict of interest.

References

  1. Vijayan, K.; Zhang, W.; Tsou, C. Molecular Taxonomy of Camellia (Theaceae) Inferred from nrITS Sequences. Am. J. Bot. 2009, 96, 1348–1360. [Google Scholar] [CrossRef]
  2. Chen, L.; Zhou, Z.; Yang, Y. Genetic improvement and breeding of tea plant (Camellia sinensis) in China: From individual selection to hybridization and molecular breeding. Euphytica 2007, 154, 239–248. [Google Scholar] [CrossRef]
  3. Luan, F.; Zeng, J.; Yang, Y.; He, X.; Wang, B.; Gao, Y.; Zeng, N. Recent advances in Camellia oleifera Abel: A review of nutritional constituents, biofunctional properties, and potential industrial applications. J. Funct. Foods 2020, 275, 557–568. [Google Scholar] [CrossRef]
  4. Wang, Z.; Jiang, C.; Wen, Q.; Wang, N.; Tao, Y.; Xu, L. Deep sequencing of the Camellia chekiangoleosa transcriptome revealed candidate genes for anthocyanin biosynthesis. Gene 2014, 538, 1–7. [Google Scholar] [CrossRef]
  5. Tai, Y.; Wei, C.; Yang, H.; Zhang, L.; Chen, Q.; Deng, W.; Wei, S.; Zhang, J.; Fang, C.; Ho, C.; et al. Transcriptomic and phytochemical analysis of the biosynthesis of characteristic constituents in tea (Camellia sinensis) compared with oil tea (Camellia oleifera). BMC Plant Biol. 2015, 15, 190. [Google Scholar] [CrossRef]
  6. Chen, S.; Wang, P.; Kong, W.; Chai, K.; Zhang, S.; Yu, J.; Wang, Y.; Jiang, M.; Lei, W.; Chen, X.; et al. Gene mining and genomics-assisted breeding empowered by the pangenome of tea plant Camellia sinensis. Nat. Plants 2023, 9, 1986–1999. [Google Scholar] [CrossRef] [PubMed]
  7. Unver, T.; Wu, Z.; Sterck, L.; Turktas, M.; Lohaus, R.; Li, Z.; Yang, M.; He, L.; Deng, T.; Escalante, F.J.; et al. Genome of wild olive and the evolution of oil biosynthesis. Proc. Natl. Acad. Sci. USA 2017, 114, E9413–E9422. [Google Scholar] [CrossRef]
  8. Schmutz, J.; Cannon, S.B.; Schlueter, J.; Ma, J.; Mitros, T.; Nelson, W.; Hyten, D.L.; Song, Q.; Thelen, J.J.; Cheng, J.; et al. Genome sequence of the palaeopolyploid soybean. Nature 2010, 463, 178–183. [Google Scholar] [CrossRef]
  9. Janila, P.; Pandey, M.K.; Shasidhar, Y.; Variath, M.T.; Sriswathi, M.; Khera, P.; Manohar, S.S.; Nagesh, P.; Vishwakarma, M.K.; Mishra, G.P.; et al. Molecular breeding for introgression of fatty acid desaturase mutant alleles (ahFAD2A and ahFAD2B) enhances oil quality in high and low oil containing peanut genotypes. Plant Sci. 2016, 242, 203–213. [Google Scholar] [CrossRef] [PubMed]
  10. Lin, P.; Wang, K.; Wang, Y.; Hu, Z.; Yan, C.; Huang, H.; Ma, X.; Cao, Y.; Long, W.; Liu, W.; et al. The genome of oil-Camellia and population genomics analysis provide insights into seed oil domestication. Genome Biol. 2022, 23, 14. [Google Scholar] [CrossRef]
  11. Shen, T.-F.; Huang, B.; Xu, M.; Zhou, P.-Y.; Ni, Z.-X.; Gong, C.; Wen, Q.; Cao, F.-L.; Xu, L.-A. The reference genome of Camellia chekiangoleosa provides insights into Camellia evolution and tea oil biosynthesis. Hortic. Res. 2022, 9, uhab083. [Google Scholar] [CrossRef]
  12. Gong, W.; Xiao, S.; Wang, L.; Liao, Z.; Chang, Y.; Mo, W.; Hu, G.; Li, W.; Zhao, G.; Zhu, H.; et al. Chromosome-level genome of Camellia lanceoleosa provides a valuable resource for understanding genome evolution and self-incompatibility. Plant J. 2022, 110, 881–898. [Google Scholar] [CrossRef]
  13. Saini, R.; Kumar, S. Genome-wide identification, characterization and in-silico profiling of genes encoding FAD (fatty acid desaturase) proteins in chickpea (Cicer arietinum, L.). Plant Gene 2019, 18, 100180. [Google Scholar] [CrossRef]
  14. Heppard, E.P.; Kinney, A.J.; Stecca, K.L.; Miao, G.H. Developmental and growth temperature regulation of two different microsomal omega-6 desaturase genes in soybeans. Plant Physiol. 1996, 110, 311–319. [Google Scholar] [CrossRef]
  15. Jung, S.; Swift, D.; Sengoku, E.; Patel, M.; Teulé, F.; Powell, G.; Moore, K.; Abbott, A. The high oleate trait in the cultivated peanut [Arachis hypogaea, L.]. I. Isolation and characterization of two genes encoding microsomal oleoyl-PC desaturases. Mol. Gen. Genet. 2000, 263, 796–805. [Google Scholar] [CrossRef]
  16. Dyer, J.M.; Chapital, D.C.; Kuan, J.-C.W.; Mullen, R.T.; Turner, C.; McKeon, T.A.; Pepperman, A.B. Molecular Analysis of a Bifunctional Fatty Acid Conjugase/Desaturase from Tung. Implications for the Evolution of Plant Fatty Acid Diversity. Plant Physiol. 2002, 130, 2027–2038. [Google Scholar] [CrossRef]
  17. Zhang, B.; Xia, P.; Yu, H.; Li, W.; Chai, W.; Liang, Z. Based on the whole genome clarified the evolution and expression process of fatty acid desaturase genes in three soybeans. Int. J. Biol. Macromol. 2021, 182, 1966–1980. [Google Scholar] [CrossRef]
  18. Maeda, H.; Sage, T.L.; Isaac, G.; Welti, R.; DellaPenna, D. Tocopherols Modulate Extraplastidic Polyunsaturated Fatty Acid Metabolism in Arabidopsis at Low Temperature. Plant Cell 2008, 20, 452–470. [Google Scholar] [CrossRef]
  19. Cheng, C.; Liu, F.; Sun, X.; Wang, B.; Liu, J.; Ni, X.; Hu, C.; Deng, G.; Tong, Z.; Zhang, Y.; et al. Genome-wide identification of FAD gene family and their contributions to the temperature stresses and mutualistic and parasitic fungi colonization responses in banana. Int. J. Biol. Macromol. 2022, 204, 661–676. [Google Scholar] [CrossRef]
  20. Chen, C.; Yang, J.; Tong, H.; Li, T.; Wang, L.; Chen, H. Genome-wide analysis of fatty acid desaturase genes in rice (Oryza sativa, L.). Sci. Rep. 2019, 9, 19445. [Google Scholar]
  21. Xue, Y.; Chen, B.; Wang, R.; Win, A.N.; Li, J.; Chai, Y. Genome-Wide Survey and Characterization of Fatty Acid Desaturase Gene Family in Brassica napus and Its Parental Species. Appl. Biochem. Biotechnol. 2018, 184, 582–598. [Google Scholar] [CrossRef]
  22. Hajiahmadi, Z.; Abedi, A.; Wei, H.; Sun, W.; Ruan, H.; Zhuge, Q.; Movahedi, A. Identification, evolution, expression, and docking studies of fatty acid desaturase genes in wheat (Triticum aestivum, L.). BMC Genom. 2020, 21, 778. [Google Scholar] [CrossRef]
  23. Ohlrogge, J.; Browse, J. Lipid biosynthesis. Plant Cell 1995, 7, 957–970. [Google Scholar]
  24. Dar, A.A.; Choudhury, A.R.; Kancharla, P.K.; Arumugam, N. The FAD2 Gene in Plants: Occurrence, Regulation, and Role. Front. Plant Sci. 2017, 8, 1789. [Google Scholar] [CrossRef]
  25. Li, K.R.; Qi, L.L.; Zhao, S.D. A study of the physical and chemical properties of the seed oil and its fatty acid compositions of 27 species of Camellia. J. Cent.-S. For. Coll. 1984, 02, 101–109. [Google Scholar]
  26. Wang, Y.Y.; Song, X.H.; Li, C.R. Fatty acids analysis of seeds oil from eight kinds of Camellia plants. China Oils Fats 2007, 09, 78–79. [Google Scholar]
  27. Lescot, M.; Déhais, P.; Thijs, G.; Marchal, K.; Moreau, Y.; Van de Peer, Y.; Rouzé, P.; Rombauts, S. PlantCARE, a database of plant cis-acting regulatory elements and a portal to tools for in silico analysis of promoter sequences. Nucleic Acids Res. 2002, 30, 325–327. [Google Scholar] [CrossRef]
  28. Marks, D.S.; Hopf, T.A.; Sander, C. Protein structure prediction from sequence variation. Nat. Biotechnol. 2012, 30, 1072–1080. [Google Scholar] [CrossRef]
  29. Moore, A.D.; Björklund, Å.K.; Ekman, D.; Bornberg-Bauer, E.; Elofsson, A. Arrangements in the modular evolution of proteins. Trends Biochem. Sci. 2008, 33, 444–451. [Google Scholar] [CrossRef]
  30. Mittal, S.; Saluja, D. Protein Post-translational Modifications: Role in Protein Structure, Function and Stability. In Proteostasis and Chaperone Surveillance; Singh, L.R., Dar, T.A., Ahmad, P., Eds.; Springer: New Delhi, India, 2015; pp. 25–37. [Google Scholar]
  31. Wang, X.; Zeng, Q.; del Mar Contreras, M.; Wang, L. Profiling and quantification of phenolic compounds in Camellia seed oils: Natural tea polyphenols in vegetable oil. Food Res. Int. 2017, 102, 184–194. [Google Scholar] [CrossRef]
  32. Zeng, W.; Endo, Y. Lipid Characteristics of Camellia Seed Oil. J. Oleo Sci. 2019, 68, 649–658. [Google Scholar] [CrossRef]
  33. Wallis, J.G.; Browse, J. Mutants of Arabidopsis reveal many roles for membrane lipids. Prog. Lipid Res. 2002, 41, 254–278. [Google Scholar] [CrossRef]
  34. Chi, X.; Yang, Q.; Lu, Y.; Wang, J.; Zhang, Q.; Pan, L.; Chen, M.; He, Y.; Yu, S. Genome-Wide Analysis of Fatty Acid Desaturases in Soybean (Glycine max). Plant Mol. Biol. Report. 2011, 29, 769–783. [Google Scholar] [CrossRef]
  35. Chi, X.; Yang, Q.; Pan, L.; Chen, M.; He, Y.; Yang, Z.; Yu, S. Isolation and characterization of fatty acid desaturase genes from peanut (Arachis hypogaea, L.). Plant Cell Rep. 2011, 30, 1393–1404. [Google Scholar] [CrossRef]
  36. Itoh M, Nacher JC, Kuma K-i, Goto S, Kanehisa M: Evolutionary history and functional implications of protein domains and their combinations in eukaryotes. Genome Biol. 2007, 8, R121.
  37. Jiaying, H.; Qiupeng, L.; Hongyuan, F.; Zixin, H.; Hu, X.; Yunjia, L.; Kunli, Q.; Peng, H.; Qiang, G.; Boshu, L.; et al. Discovery of deaminase functions by structure-based protein clustering. Cell 2023, 186, 3182–3195. [Google Scholar]
  38. Jiao, P.; Wang, B.; Wang, X.; Liu, B.; Wang, Y.; Li, J. Struct2GO: Protein function prediction based on graph pooling algorithm and AlphaFold2 structure information. Bioinformatics 2023, 39, btad637. [Google Scholar] [CrossRef]
  39. Sun, J.; Lu, F.; Luo, Y.; Bie, L.; Xu, L.; Wang, Y. OrthoVenn3: An integrated platform for exploring and visualizing orthologous data across genomes. Nucleic Acids Res. 2023, 51, W397–W403. [Google Scholar] [CrossRef]
  40. Mendes, F.K.; Vanderpool, D.; Fulton, B.; Hahn, M.W. CAFE 5 models variation in evolutionary rates among gene families. Bioinformatics 2020, 36, 5516–5518. [Google Scholar] [CrossRef]
  41. Kozlov, A.M.; Darriba, D.; Flouri, T.; Morel, B.; Stamatakis, A. RAxML-NG: A fast, scalable and user-friendly tool for maximum likelihood phylogenetic inference. Bioinformatics 2019, 35, 4453–4455. [Google Scholar] [CrossRef]
  42. Chen, C.; Chen, H.; Zhang, Y.; Thomas, H.R.; Frank, M.H.; He, Y.; Xia, R. TBtools: An Integrative Toolkit Developed for Interactive Analyses of Big Biological Data. Mol. Plant 2020, 13, 1194–1202. [Google Scholar] [CrossRef]
  43. Wang, Y.; Tang, H.; DeBarry, J.D.; Tan, X.; Li, J.; Wang, X.; Lee, T.-H.; Jin, H.; Marler, B.; Guo, H.; et al. MCScanX: A toolkit for detection and evolutionary analysis of gene synteny and collinearity. Nucleic Acids Res. 2012, 40, e49. [Google Scholar] [CrossRef]
  44. Chen, S. Ultrafast one-pass FASTQ data preprocessing, quality control, and deduplication using fastp. iMeta 2023, 2, e107. [Google Scholar] [CrossRef]
  45. Kim, D.; Paggi, J.M.; Park, C.; Bennett, C.; Salzberg, S.L. Graph-based genome alignment and genotyping with HISAT2 and HISAT-genotype. Nat. Biotechnol. 2019, 37, 907–915. [Google Scholar] [CrossRef]
  46. Pertea, M.; Kim, D.; Pertea, G.M.; Leek, J.T.; Salzberg, S.L. Transcript-level expression analysis of RNA-seq experiments with HISAT, StringTie and Ballgown. Nat. Protoc. 2016, 11, 1650–1667. [Google Scholar] [CrossRef]
  47. Miao, B.; Dong, W.; Han, Z.; Luo, X.; Ke, C.; You, W. TOmicsVis: An all-in-one transcriptomic analysis and visualization R package with Shinyapp interface. iMeta 2023, 2, e137. [Google Scholar] [CrossRef]
  48. Shannon, P.; Markiel, A.; Ozier, O.; Baliga, N.S.; Wang, J.T.; Ramage, D.; Amin, N.; Schwikowski, B.; Ideker, T. Cytoscape: A software environment for integrated models of biomolecular interaction networks. Genome Res. 2003, 13, 2498–2504. [Google Scholar] [CrossRef]
Figure 1. (a) Phylogenetic analysis using orthovenn3 with the orthofinder algorithm and the JTT+CAT model. The phylogenetic tree outlines the evolutionary timeline of the species. Species divergence times were determined based on information from the Timetree website. (b) Phylogenetic tree depicting the evolutionary relationships among FAD proteins from tea and oil tea (C. oleifera, CoFADs; C. chekiangoleosa, CcFADs; C. lanceoleosa, ClFADs; C. sinensis, CsFADs; A. thaliana, AtFADs; and O. sativa, OsFADs). The tree was constructed using the raxml-ng algorithm, with a total of 1000 bootstrap replications to ensure robustness. Different colors represent distinct subfamilies within the FAD protein family.
Plants 13 01444 g001
Figure 2. Conservation motif analysis of FAD proteins in tea and oil tea with a set motif search quantity of 10. (a) Conserved motifs of FAB2(SAD) subfamily proteins. (b) Conserved motifs of FAD proteins, except the FAB2(SAD) subfamily members.
Plants 13 01444 g002
Figure 3. Distribution of cis-acting elements in the promoters of FAD gene family, excluding the FAB2(SAD) subfamily members from tea and oil tea.
Plants 13 01444 g003
Figure 4. Chromosomal location and collinearity analysis of FAD family genes from C. sinensis (a), C. oleifera (b), C. chekiangoleosa (c) and C. lanceoleosa (d). Gene IDs are highlighted in red. Chromosomes are represented by dark blue boxes, and segmental duplication genes are connected with green lines.
Plants 13 01444 g004
Figure 5. Expression heatmap of FAD gene family in tea and oil tea seeds. Among them, the abbreviation “Cl” was used for C. lanceoleosa, the abbreviation “Ck” was used for C. chekiangoleosa, the abbreviation “Co” was used for C. oleifera, and the abbreviation “Cs” was used for C. sinensis var. sinensis TGY.
Plants 13 01444 g005
Figure 6. The expression profile of the five representative FAD genes using qRT-PCR. Error bars indicate SD (three biological repeats for each sample).
Plants 13 01444 g006
Figure 7. The protein–protein interaction network of the FAD gene family in C. sinensis (Cs), C. oleifera (Co), C. chekiangoleosa (Cc), and C. lanceoleosa (Cl).
Plants 13 01444 g007
Figure 8. The UPGMA algorithm was used to cluster the FAD proteins based on their protein structure, and the resulting tree was labeled with different colors representing different subfamilies.
Plants 13 01444 g008
Disclaimer/Publisher’s Note: The statements, opinions and data contained in all publications are solely those of the individual author(s) and contributor(s) and not of MDPI and/or the editor(s). MDPI and/or the editor(s) disclaim responsibility for any injury to people or property resulting from any ideas, methods, instructions or products referred to in the content.

