1. Introduction
The yield of plants is directly dependent on the productivity of the interaction between soil, plants, and microorganisms. Through microorganisms, plants not only fulfill their nutrient requirements (nitrogen, phosphorus, potassium, etc.) but also gain protection from phytopathogens. This effect is achieved through various mechanisms, including: (a) the increased mobilization of insoluble nutrients, subsequently enhancing assimilation by plants [
1], (b) the production of plant growth hormones like auxins [
2], cytokinins [
3], gibberellins [
4], and (c) antagonism against phytopathogenic microorganisms by producing siderophores [
5]. Consequently, microbial preparations can significantly reduce the need for mineral fertilizers, thereby enhancing their efficiency of use. The amalgamation of mineral and targeted bacterial preparations represents a new generation of agricultural technology.
It has been reported that inoculation with combined preparations of microorganisms is more effective than inoculation with a single microorganism in stimulating plant growth by providing a more balanced diet for various crops [
6,
7]. Zhang Yi et al. demonstrated that the co-inoculation of phosphate-solubilizing bacteria (PSB) and phosphate-accumulating bacteria led to higher levels of microbial biomass phosphorus and polyphosphate [
8]. The synergistic effect of
Bradyrhizobium japonicum USDA110 and
Pseudomonas putida NUU8 for soybeans in arid field conditions exhibited a significant increase in root length by 56%, shoot length by 33%, dry root mass by 47%, dry shoot mass by 48%, and the number of nodules by 17% compared to the control [
9]. The synergistic effect of microorganisms is observed even if each of them individually exhibits different properties. For example, Wang showed the effect of combined treatment of PSB (
Bacillus megaterium and
Pseudomonas fluorescens) and N2-fixing bacteria (
Azotobacter chroococcum and
Azospirillum brasilence) on the availability of nitrogen and phosphorus within the first 60 days after the addition of bacteria [
10]. In addition, the beneficial effect of PSB on the survival of
Azotobacter in the rhizosphere was observed [
11]. Belimov et al., using the 15N isotope dilution method, showed that combined inoculation significantly increased the accumulation of nitrogen fertilizers in plants. Consequently, N2 fixation is not the main mechanism affecting plant growth reactions, and the effect of joint inoculation on their nitrogen nutrition can be explained by an increase in the extraction of nitrogen fertilizers. It is possible that the effect of bacterial mixtures on the mineral nutrition of plants is due to growth-stimulating substances secreted by bacteria [
12]. Thus, microorganisms play an important role in agriculture, promoting the circulation of nutrients in plants and reducing the need for chemical fertilizers, although many questions remain unanswered.
Do the same bacteria have the same effect on different plants? Do microorganisms exhibit properties predicted by laboratory tests in an open field? To address these questions, an experiment was conducted with 20 consortia composed of phosphate-immobilizing and nitrogen-fixing bacteria. The experiment involved three plants belonging to the main agricultural areas of plant cultivation in Western Siberia: cereals—wheat, cereals—buckwheat, and green biomass—corn.
2. Results
2.1. Yield of Buckwheat, Wheat, and Corn
In the initial weeks of growth, buckwheat plants were approximately the same height in all plots, but after 6 weeks, plants from plots C (23.4%), F (24.6%) and G (30.9%) showed a noticeable increase in height versus the control, with a statistical significance level of
p < 0.05 (
Figure 1,
Supplementary Table S1).
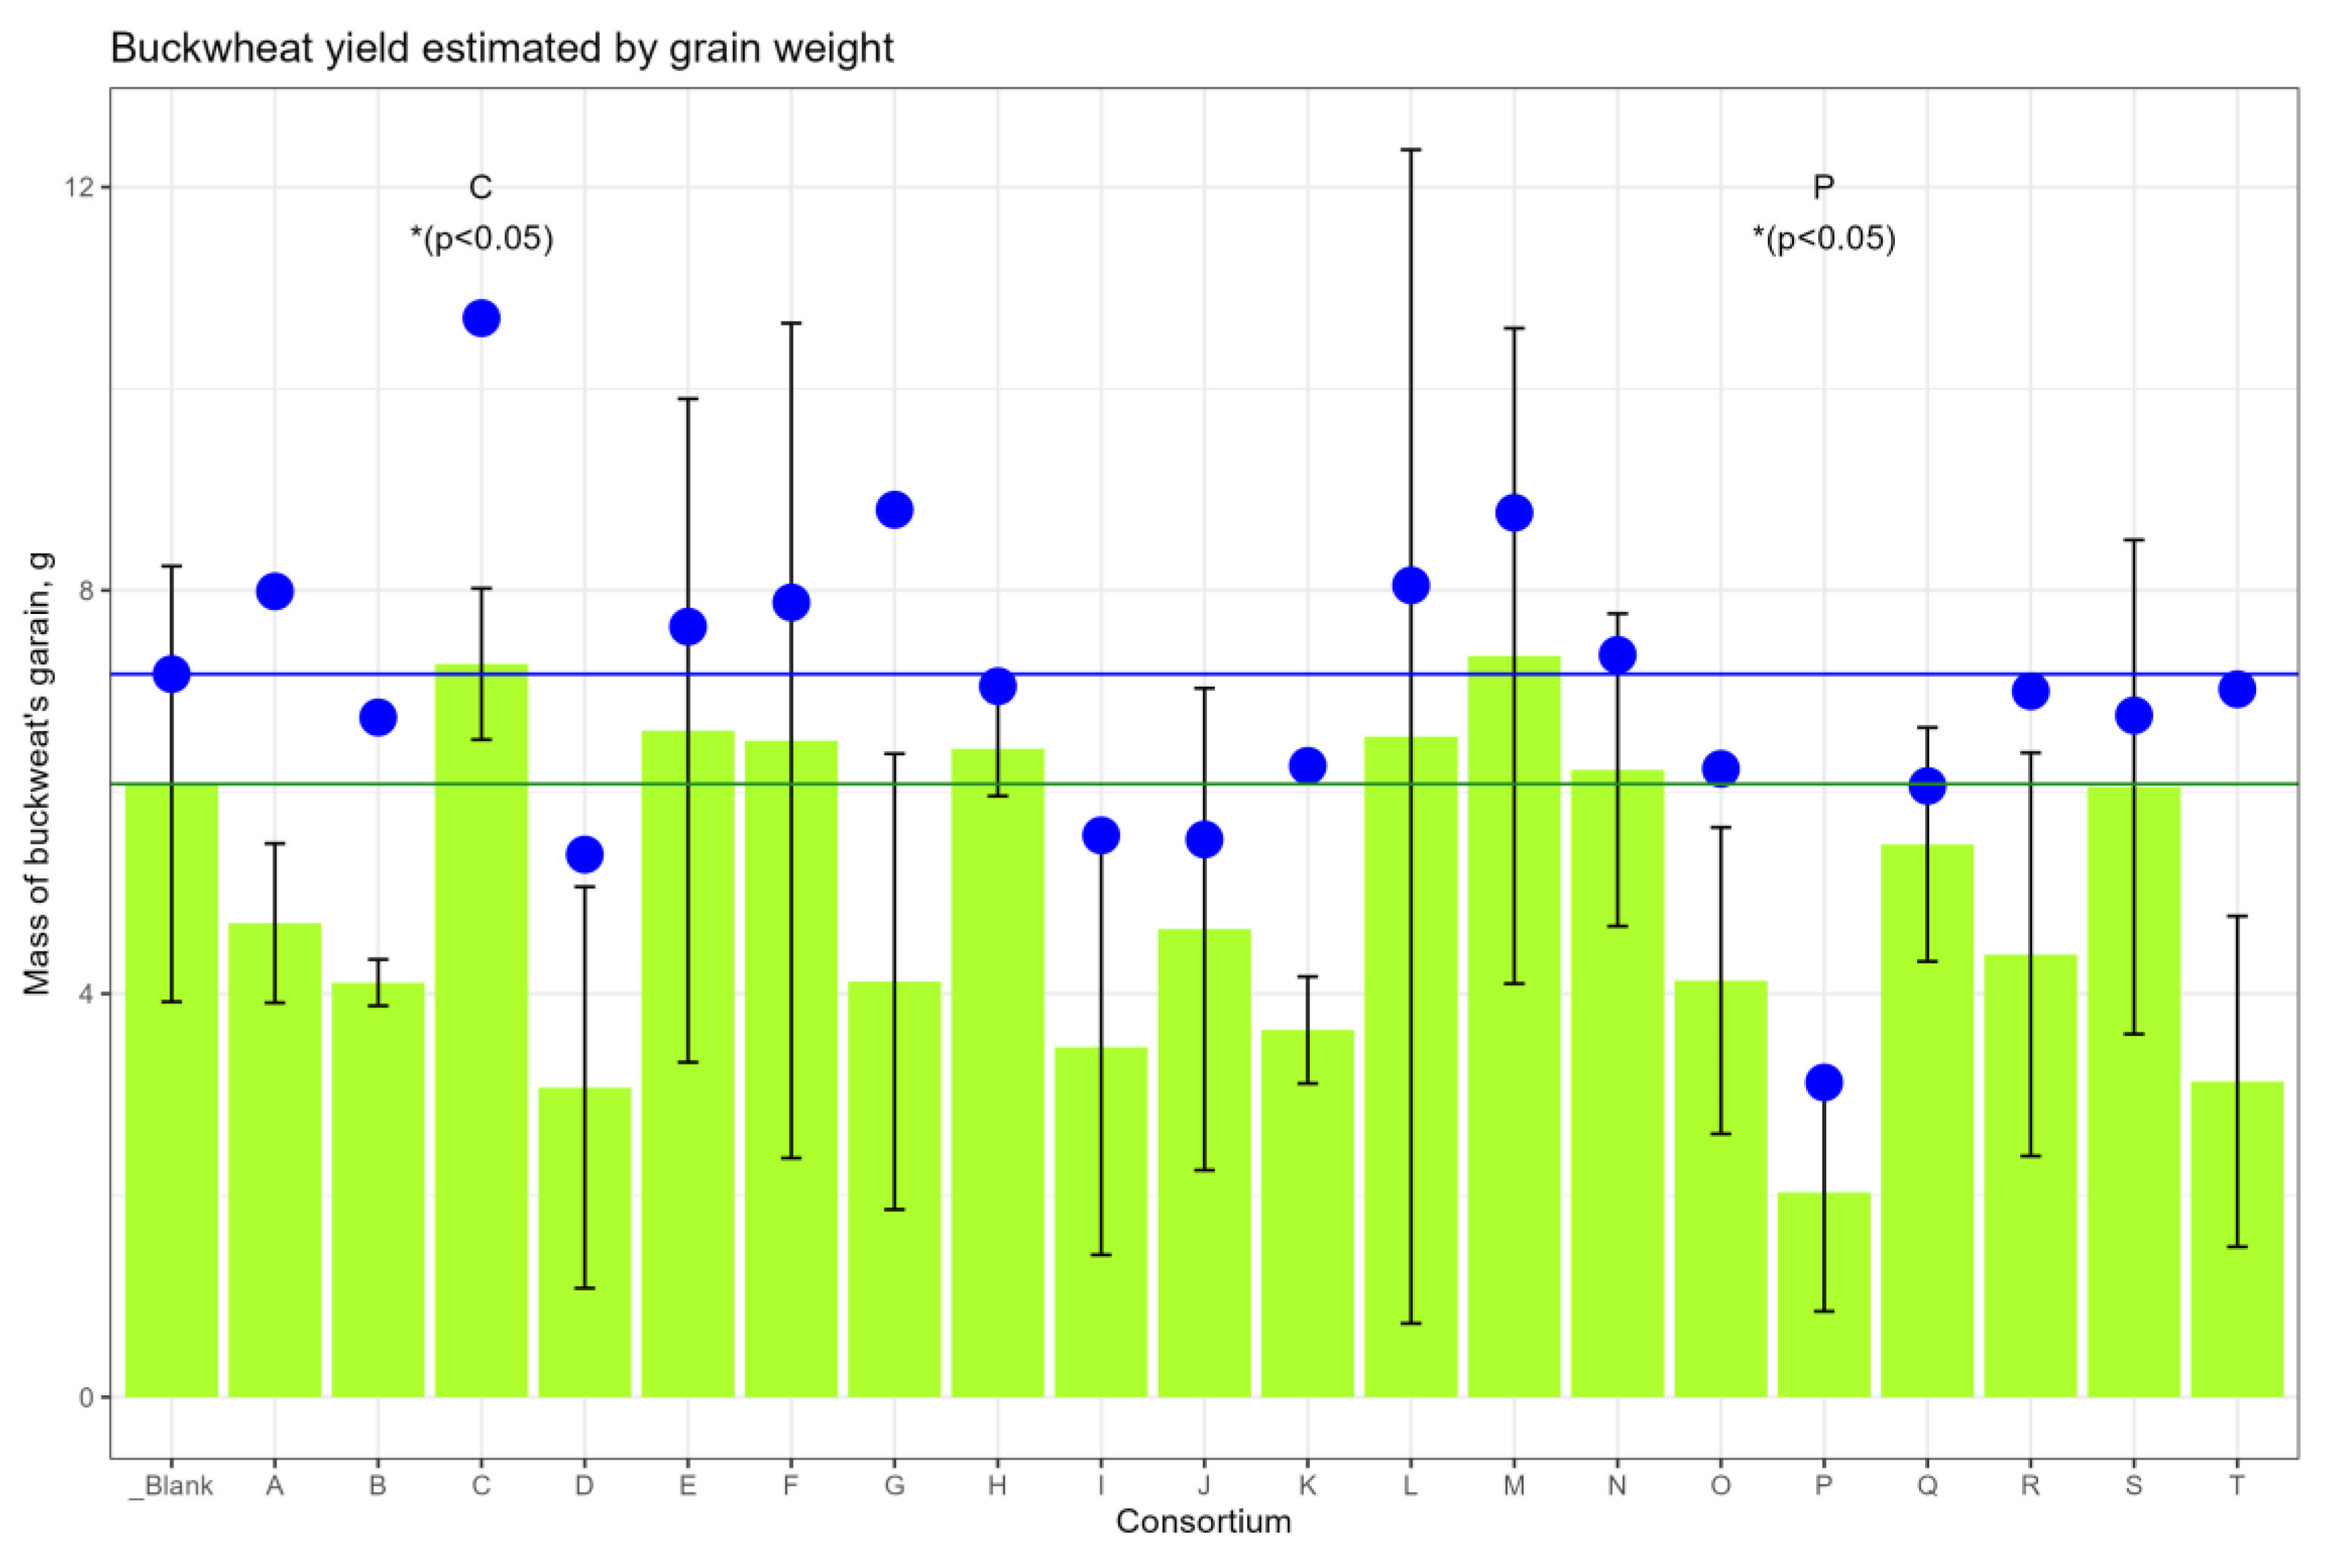
The average amount of ripe grain harvested from the ears, compared with the control site, was higher in the sites corresponding to consortia C, E, F, H, L, M and N, and less in the site with consortium P (
Figure 2); however, the differences did not reach the level of statistical significance. Taking into account the fallen grain, the yield change reached the level of statistical significance (
p < 0.05) for consortia C (+49.2%) and for consortium P (−56.5%) (
Supplementary Table S2).
The consortium’s influence on the weight of dry straw and dry roots was also revealed (
Figure 3). An increase in the mass of dry straw for Consortia B, C, and G was observed, but the threshold of statistical significance was not reached. The weight of dry roots was dramatically strong for consortium C (+152%,
p < 0.01) versus control plants.
Thus, based on agronomic measurements, it was found that buckwheat plants grown from seeds inoculated with Consortium C consistently outperformed control plants in terms of their indicators: the growth rate, the mass of the vegetative part, and the mass of the grain.
There was no difference between the height of wheat plants in different consortia compared to the control after either 4 weeks or 6 weeks (
Supplementary Table S3 and Figure S1). Despite the fact that the stems of plants from the consortium at the site were statistically significantly longer than those of the control, after 3 months (
Supplementary Figure S2), the influence of consortia on the length of the wheat ear, as well as on the ratio of the length of the stem to the length of the ear, was not evident (
Supplementary Table S4). Also, no effect was found on such yield characteristics as the weight of the ear and the weight of grain without a floor (
Supplementary Figure S3).
To assess the effect of the inoculation of corn seeds in bacterial consortia, plant height was measured after 4 and 6 weeks, and the weight of wet and dry ears and the weight of dry roots were measured after 3 months. However, none of these indicators were statistically significantly different compared to the control plot (
Supplementary Table S4, Supplementary Figures S4 and S5).
2.2. Soil Nutrient Status
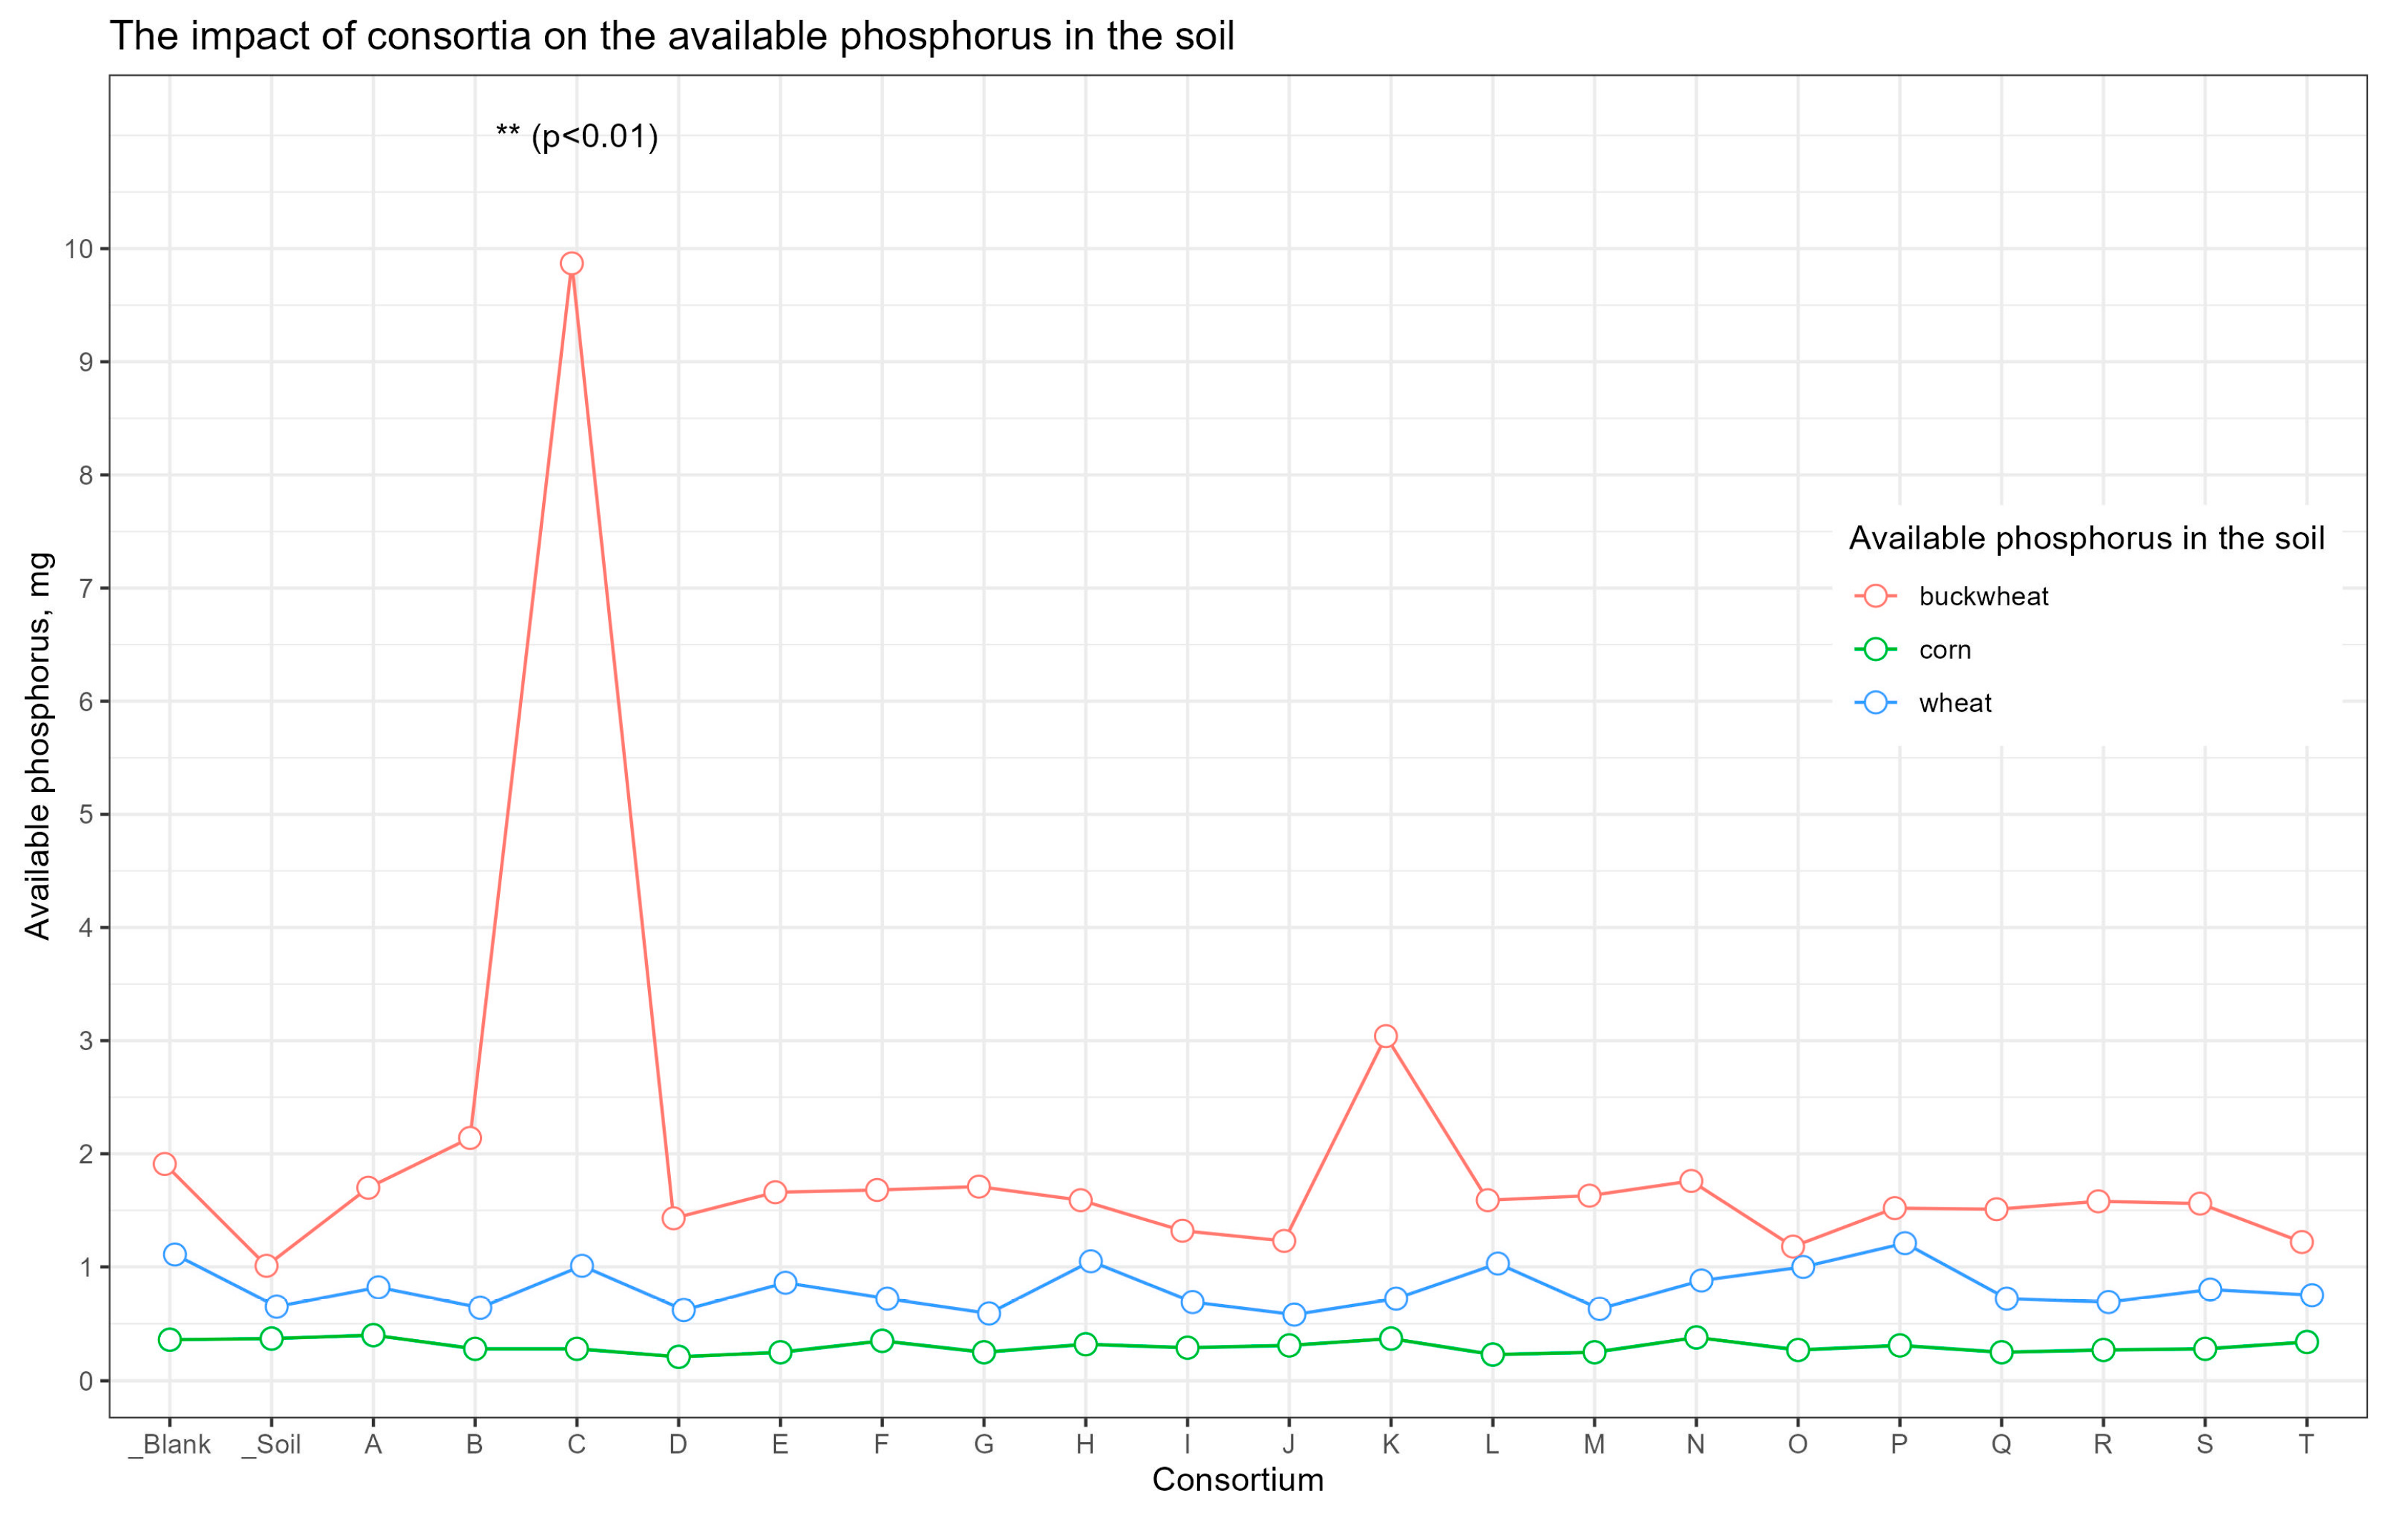
The analysis of soil nutrients indicated that the content of the available forms of nitrogen, potassium, and carbon (organic, inorganic, and total) was approximately consistent across all samples (
Supplementary Table S5). For the soil sample from the plot with buckwheat inoculated in Consortium C, the amount of available phosphorus was significant compared to the other samples (
p < 0.01) (
Figure 4).
2.3. Effect of Different Consortium on Soil Microbial Community and Diversity
The dependence of the number of identified taxa on the number of sequences was estimated by constructing rarefaction curves (
Supplementary Figure S6). The analysis showed a complete determination of the taxonomic composition, even with 700 sequences in all soil samples, as the curves reached a plateau. The sequencing depth proved adequate to assess alpha diversity.
Estimates of the alpha diversity (Observed, Chao1, ACE, Shannon) of microbial communities of soil samples were calculated depending on the type of consortium with which seeds were inoculated with before planting (
Supplementary Table S6). Box and whisker diagrams were constructed for comparison (
Supplementary Figure S7).
A pairwise comparison of the alpha-diversity indices (observed and Shannon) by the Wilcoxon test did not show a significant difference between soil samples from seeds inoculated with different consortia.
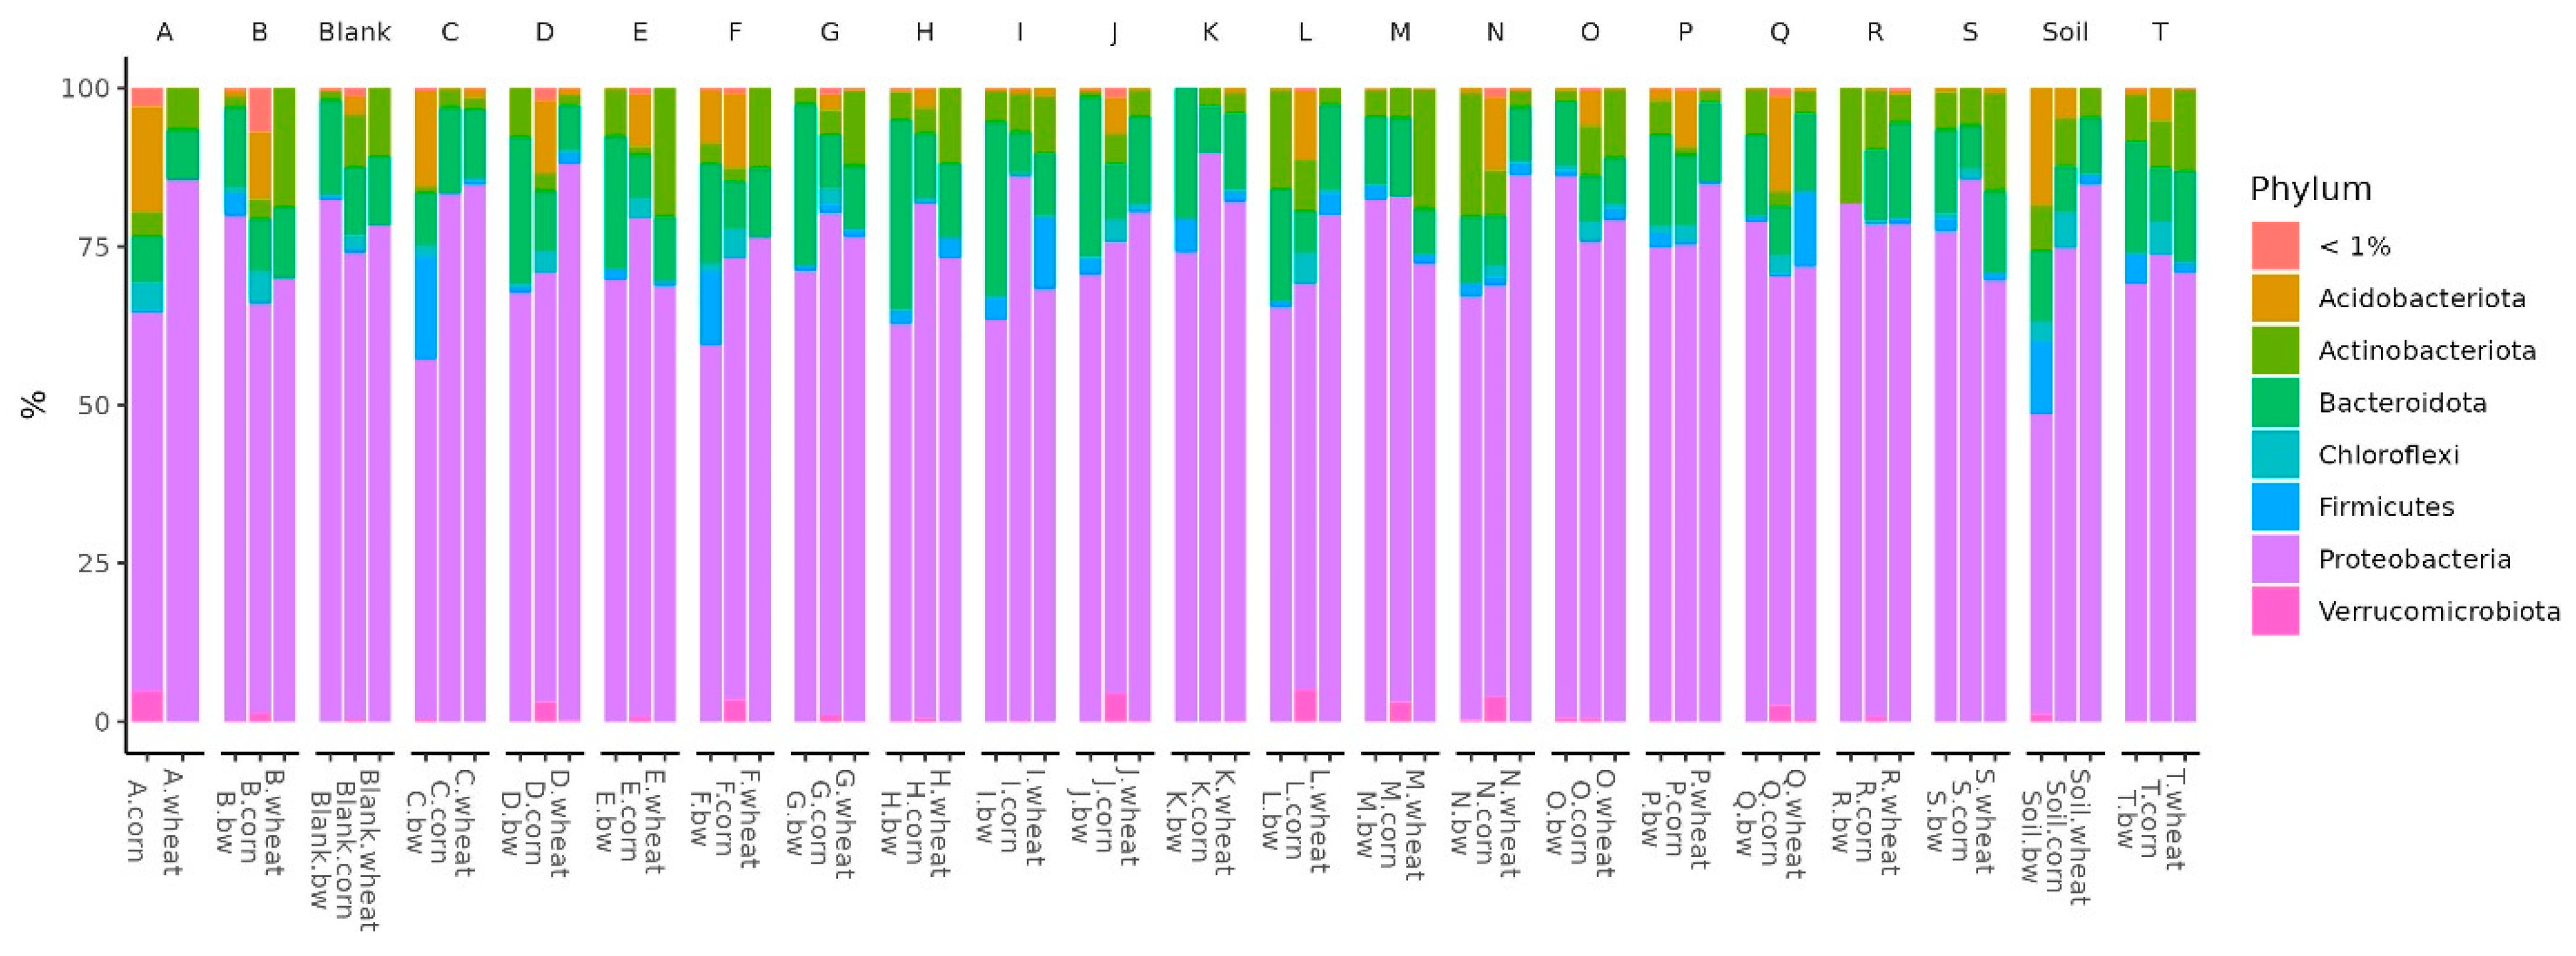
In all the studied soil samples, the dominant bacterial phyla were Proteobacteria, Firmicutes, Bacteroidota, Actinobacteroidota, and Acidobactoroidota. It is noteworthy that the proportion of Firmicutes increased in the three soil samples. All these samples belonged to plots with buckwheat, two had plants whose seeds were inoculated by Consortia C and F, and the third was a control plot of soil on which plants were not grown (
Figure 5).
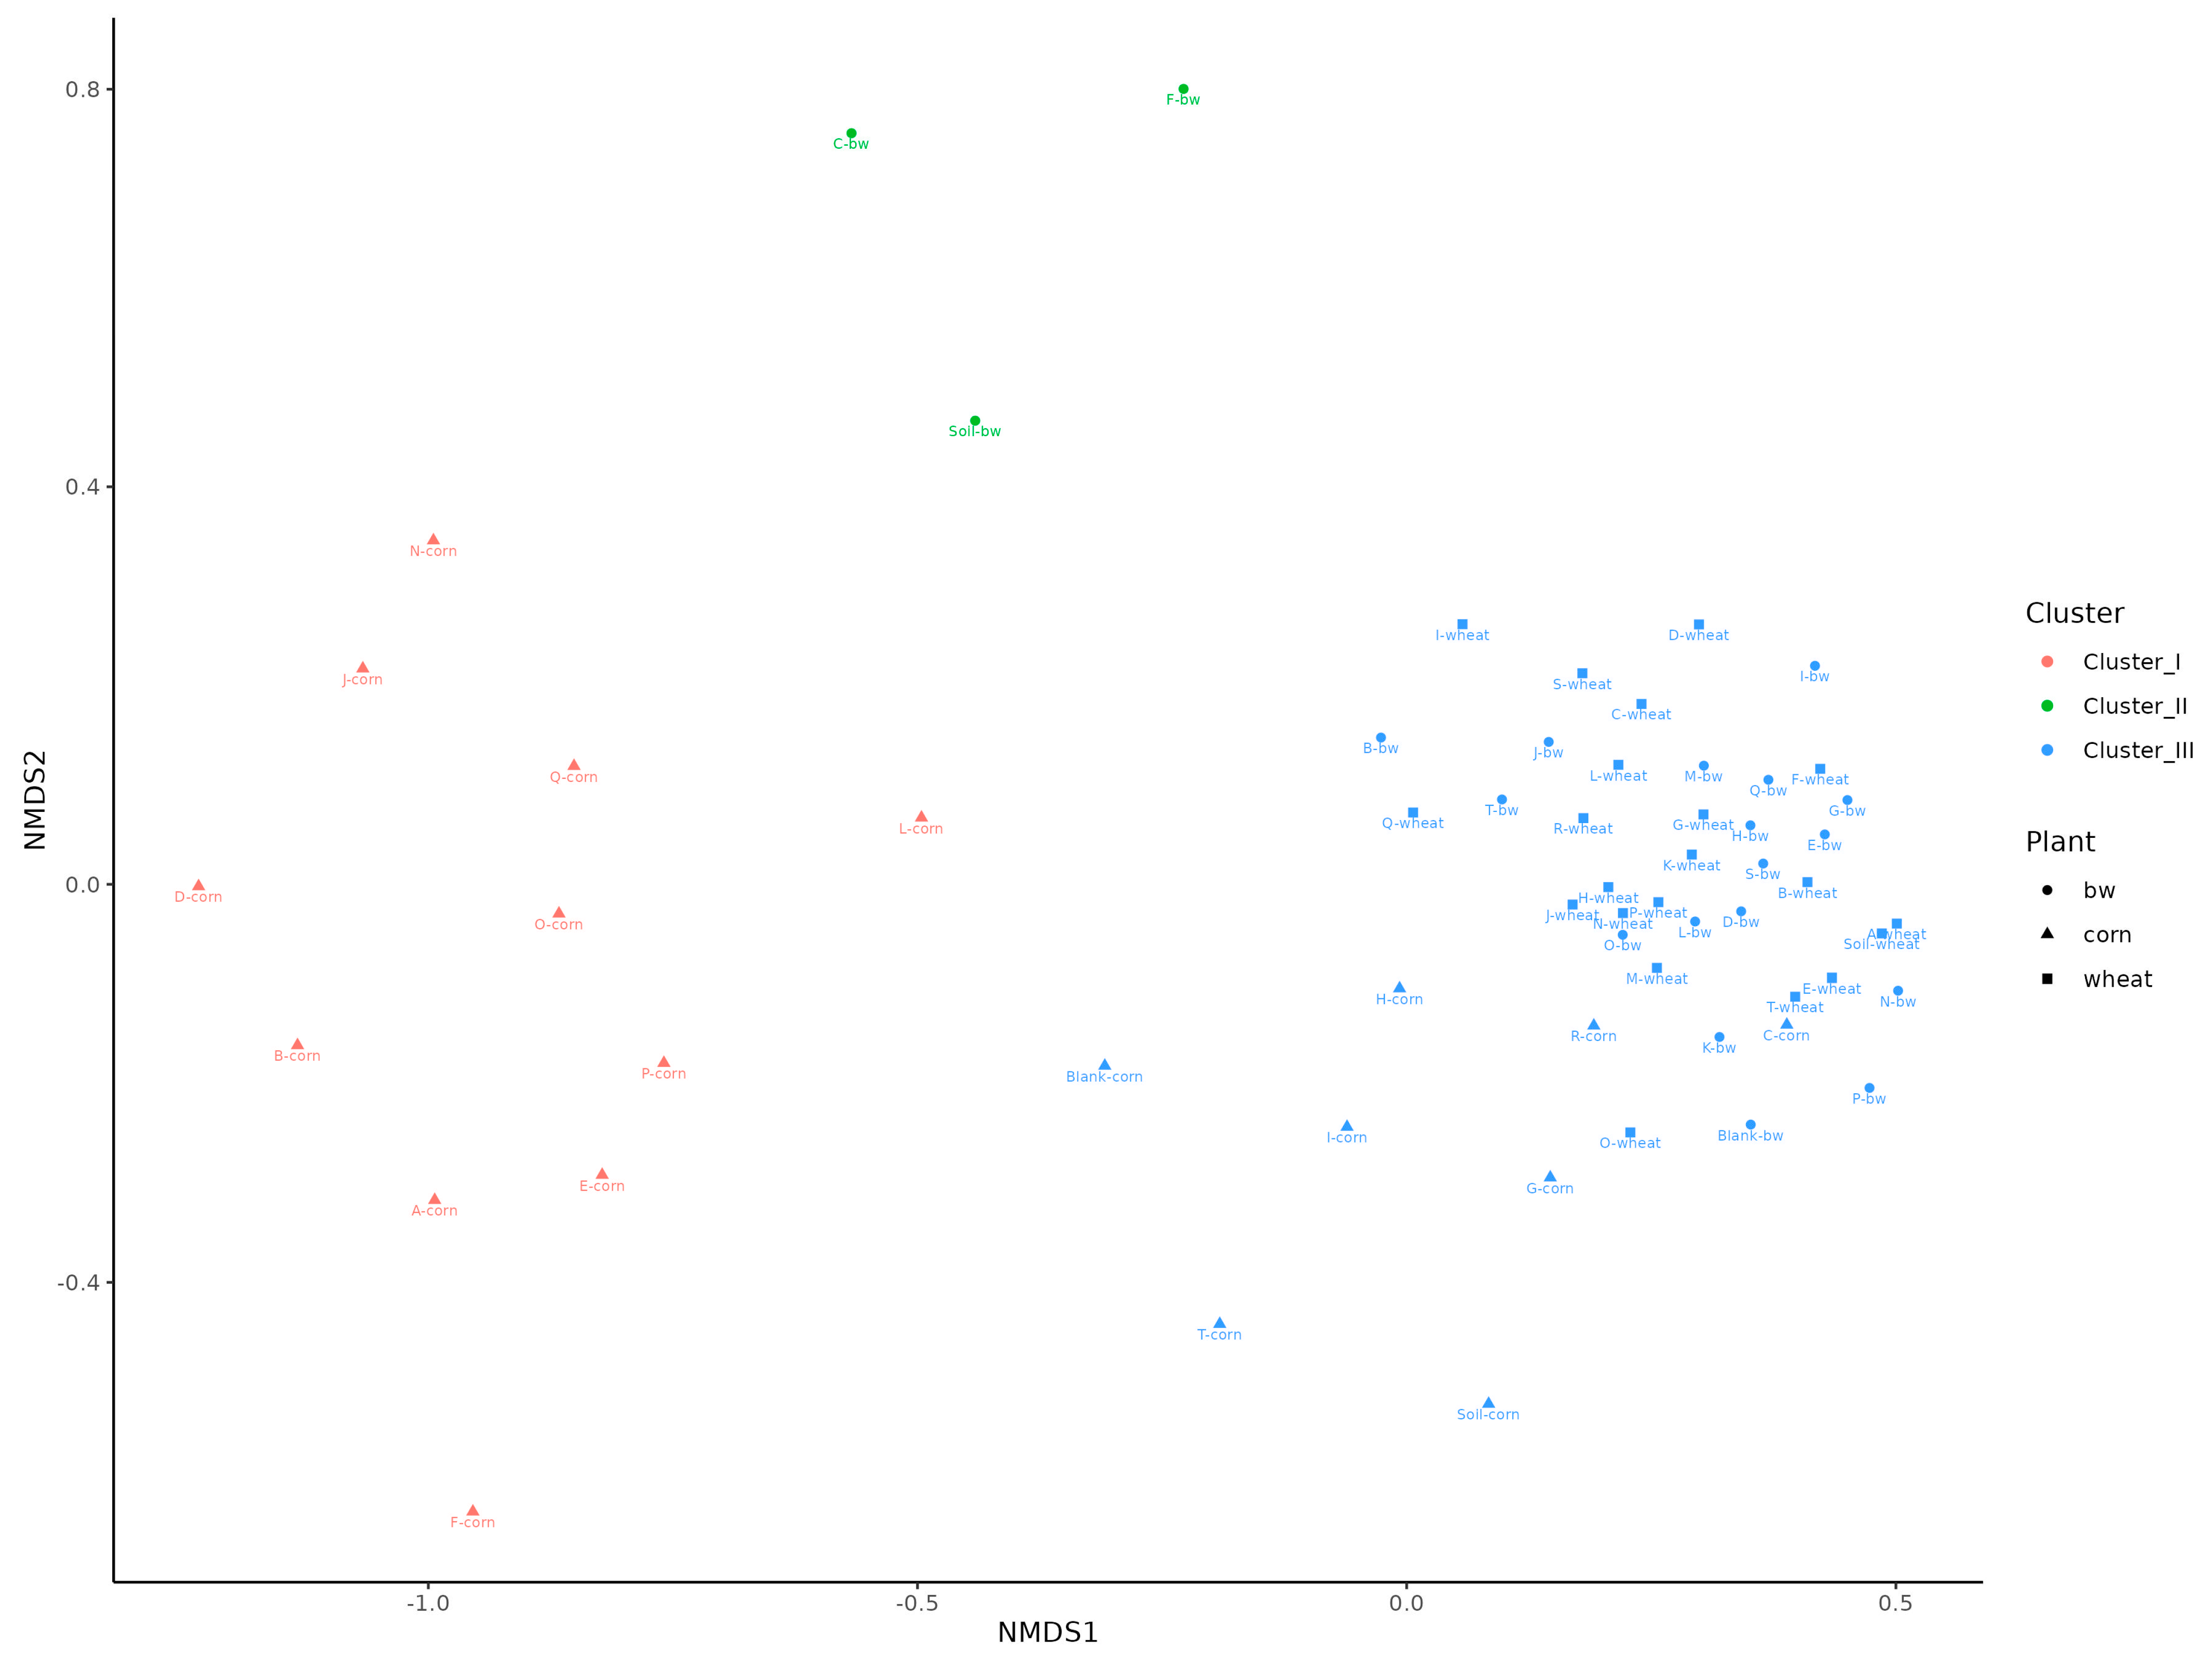
A beta diversity analysis using non-metric multidimensional scaling (NMDS) showed that the samples were clearly divided into three clusters. The first cluster predominantly included samples from corn plots, the second from the C, F and Soil from buckwheat plots, and the third the remaining samples (
Figure 6).
To assess the differences in the representation of different bacteria between the clusters defined by the analysis, several additional relative abundance histograms were built (
Figure 7a–d).
Histograms show the difference in the representation of bacteria between clusters at different levels of classification: phylum, class, order, and family. At the phylum level in the samples of Cluster 2, the amount of proteobacteria was significantly reduced, while firmicutes and acidobacteriota were increased. At the class level in Cluster 2, the content of bacilli was increased, and gammaproteobacteria was reduced. At the level of orders in class 2, bacillales was elevated, and at the level of the family bacillaceae was increased.
To estimate the differential abundance of taxa between the groups, a differential abundance analysis was carried out. Cluster 2, containing a sample of C.bw, and the union of Clusters 1 and 3 were initially taken as comparison groups (
Figure 8). In the heat map, the red square marks OTUs, the representation of which is significantly higher in this group compared to the rest. The samples of Cluster II 4 OTUs are more abundant:
Unclassified OBL17,
Unclassified Bacillus,
Unclassified Blastocatellaceae, and
Unclassified Uncultured.
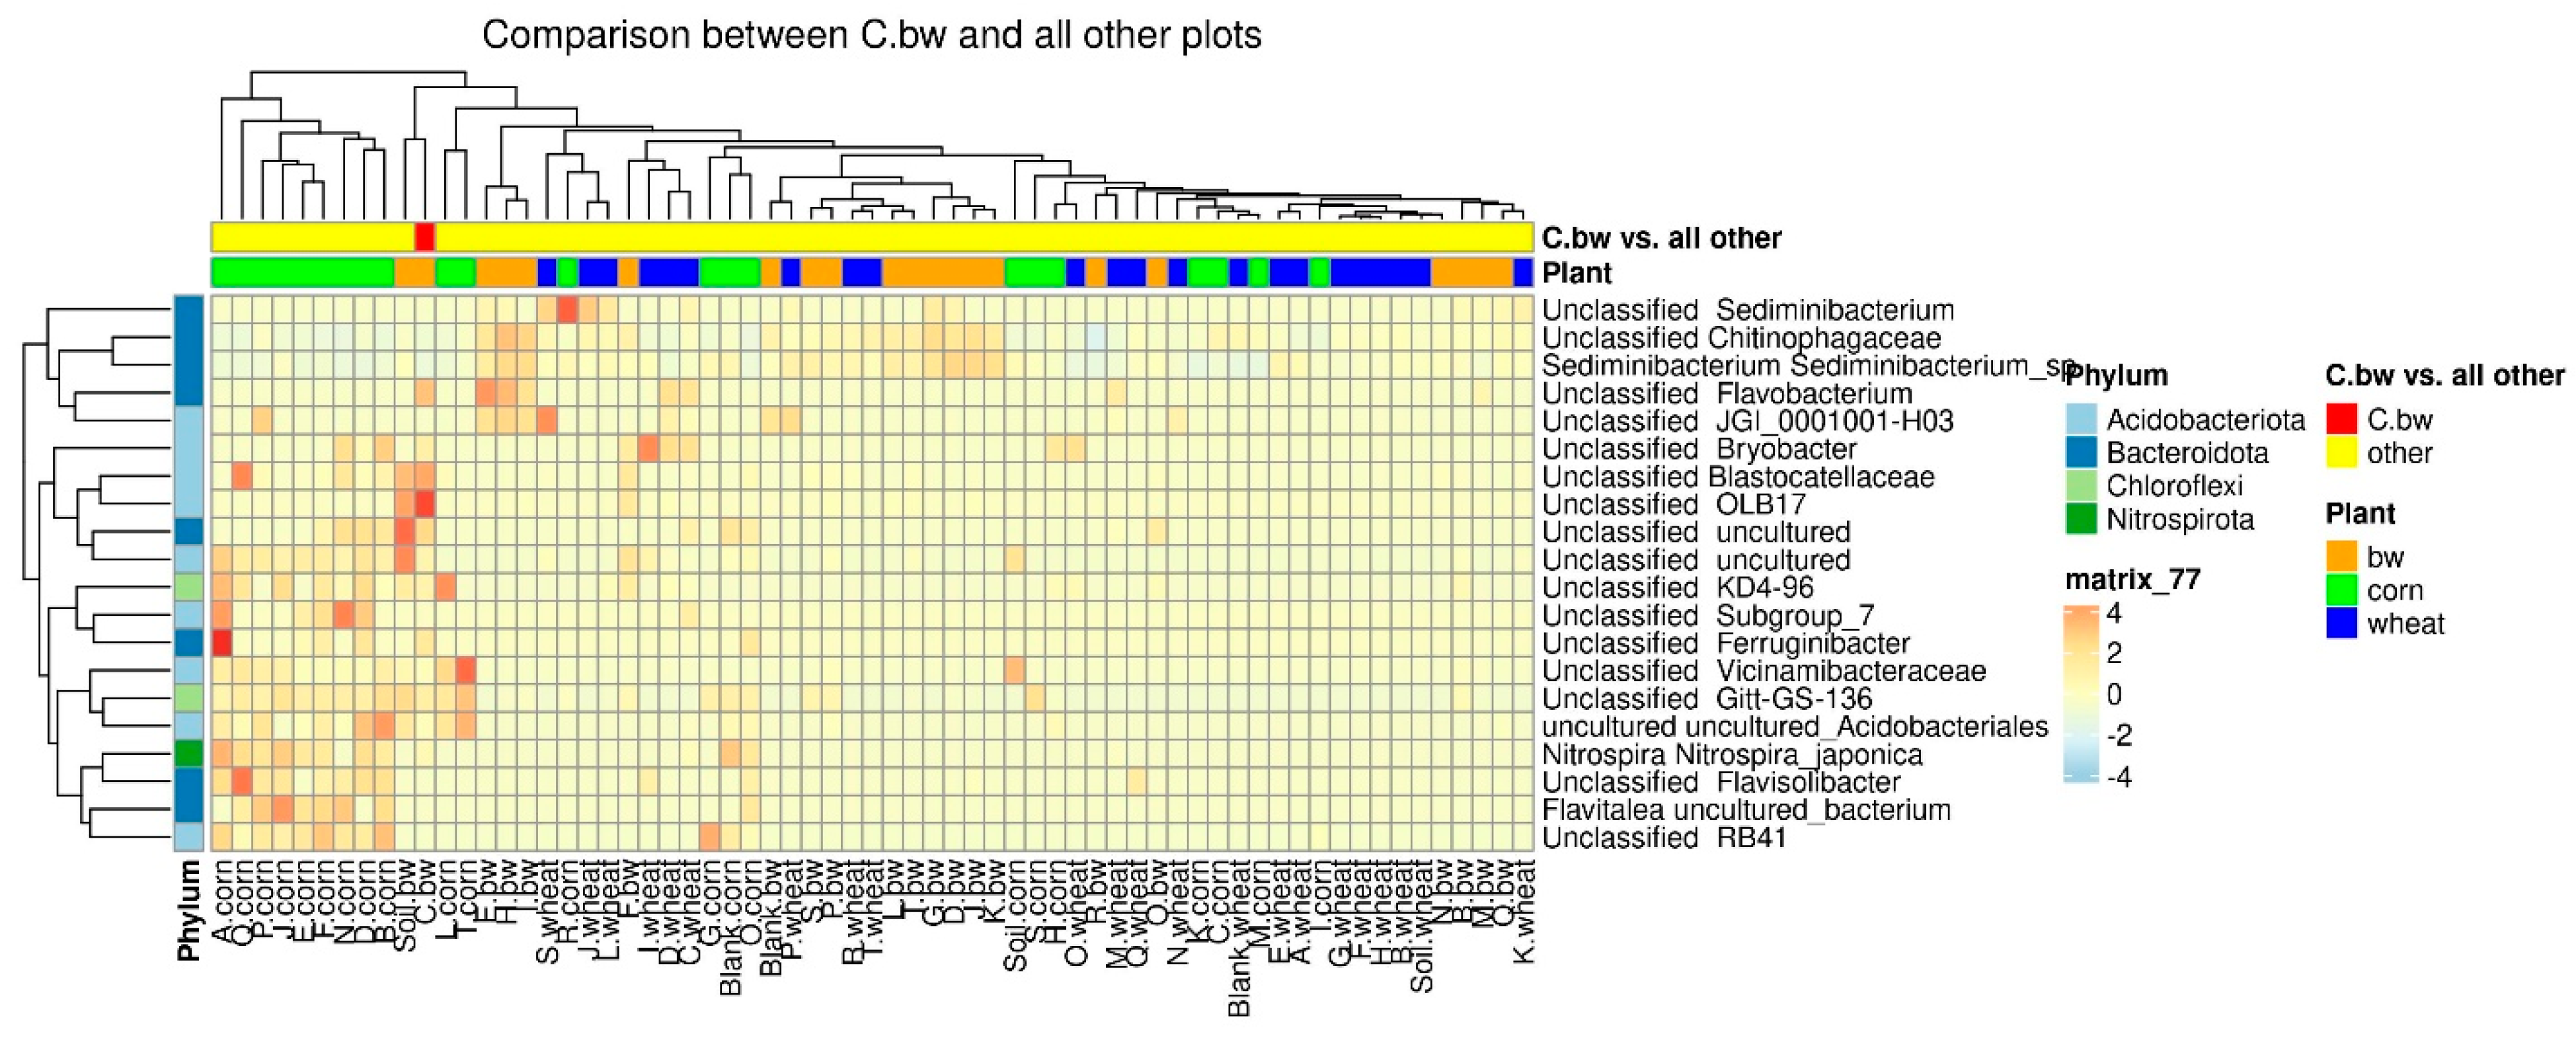
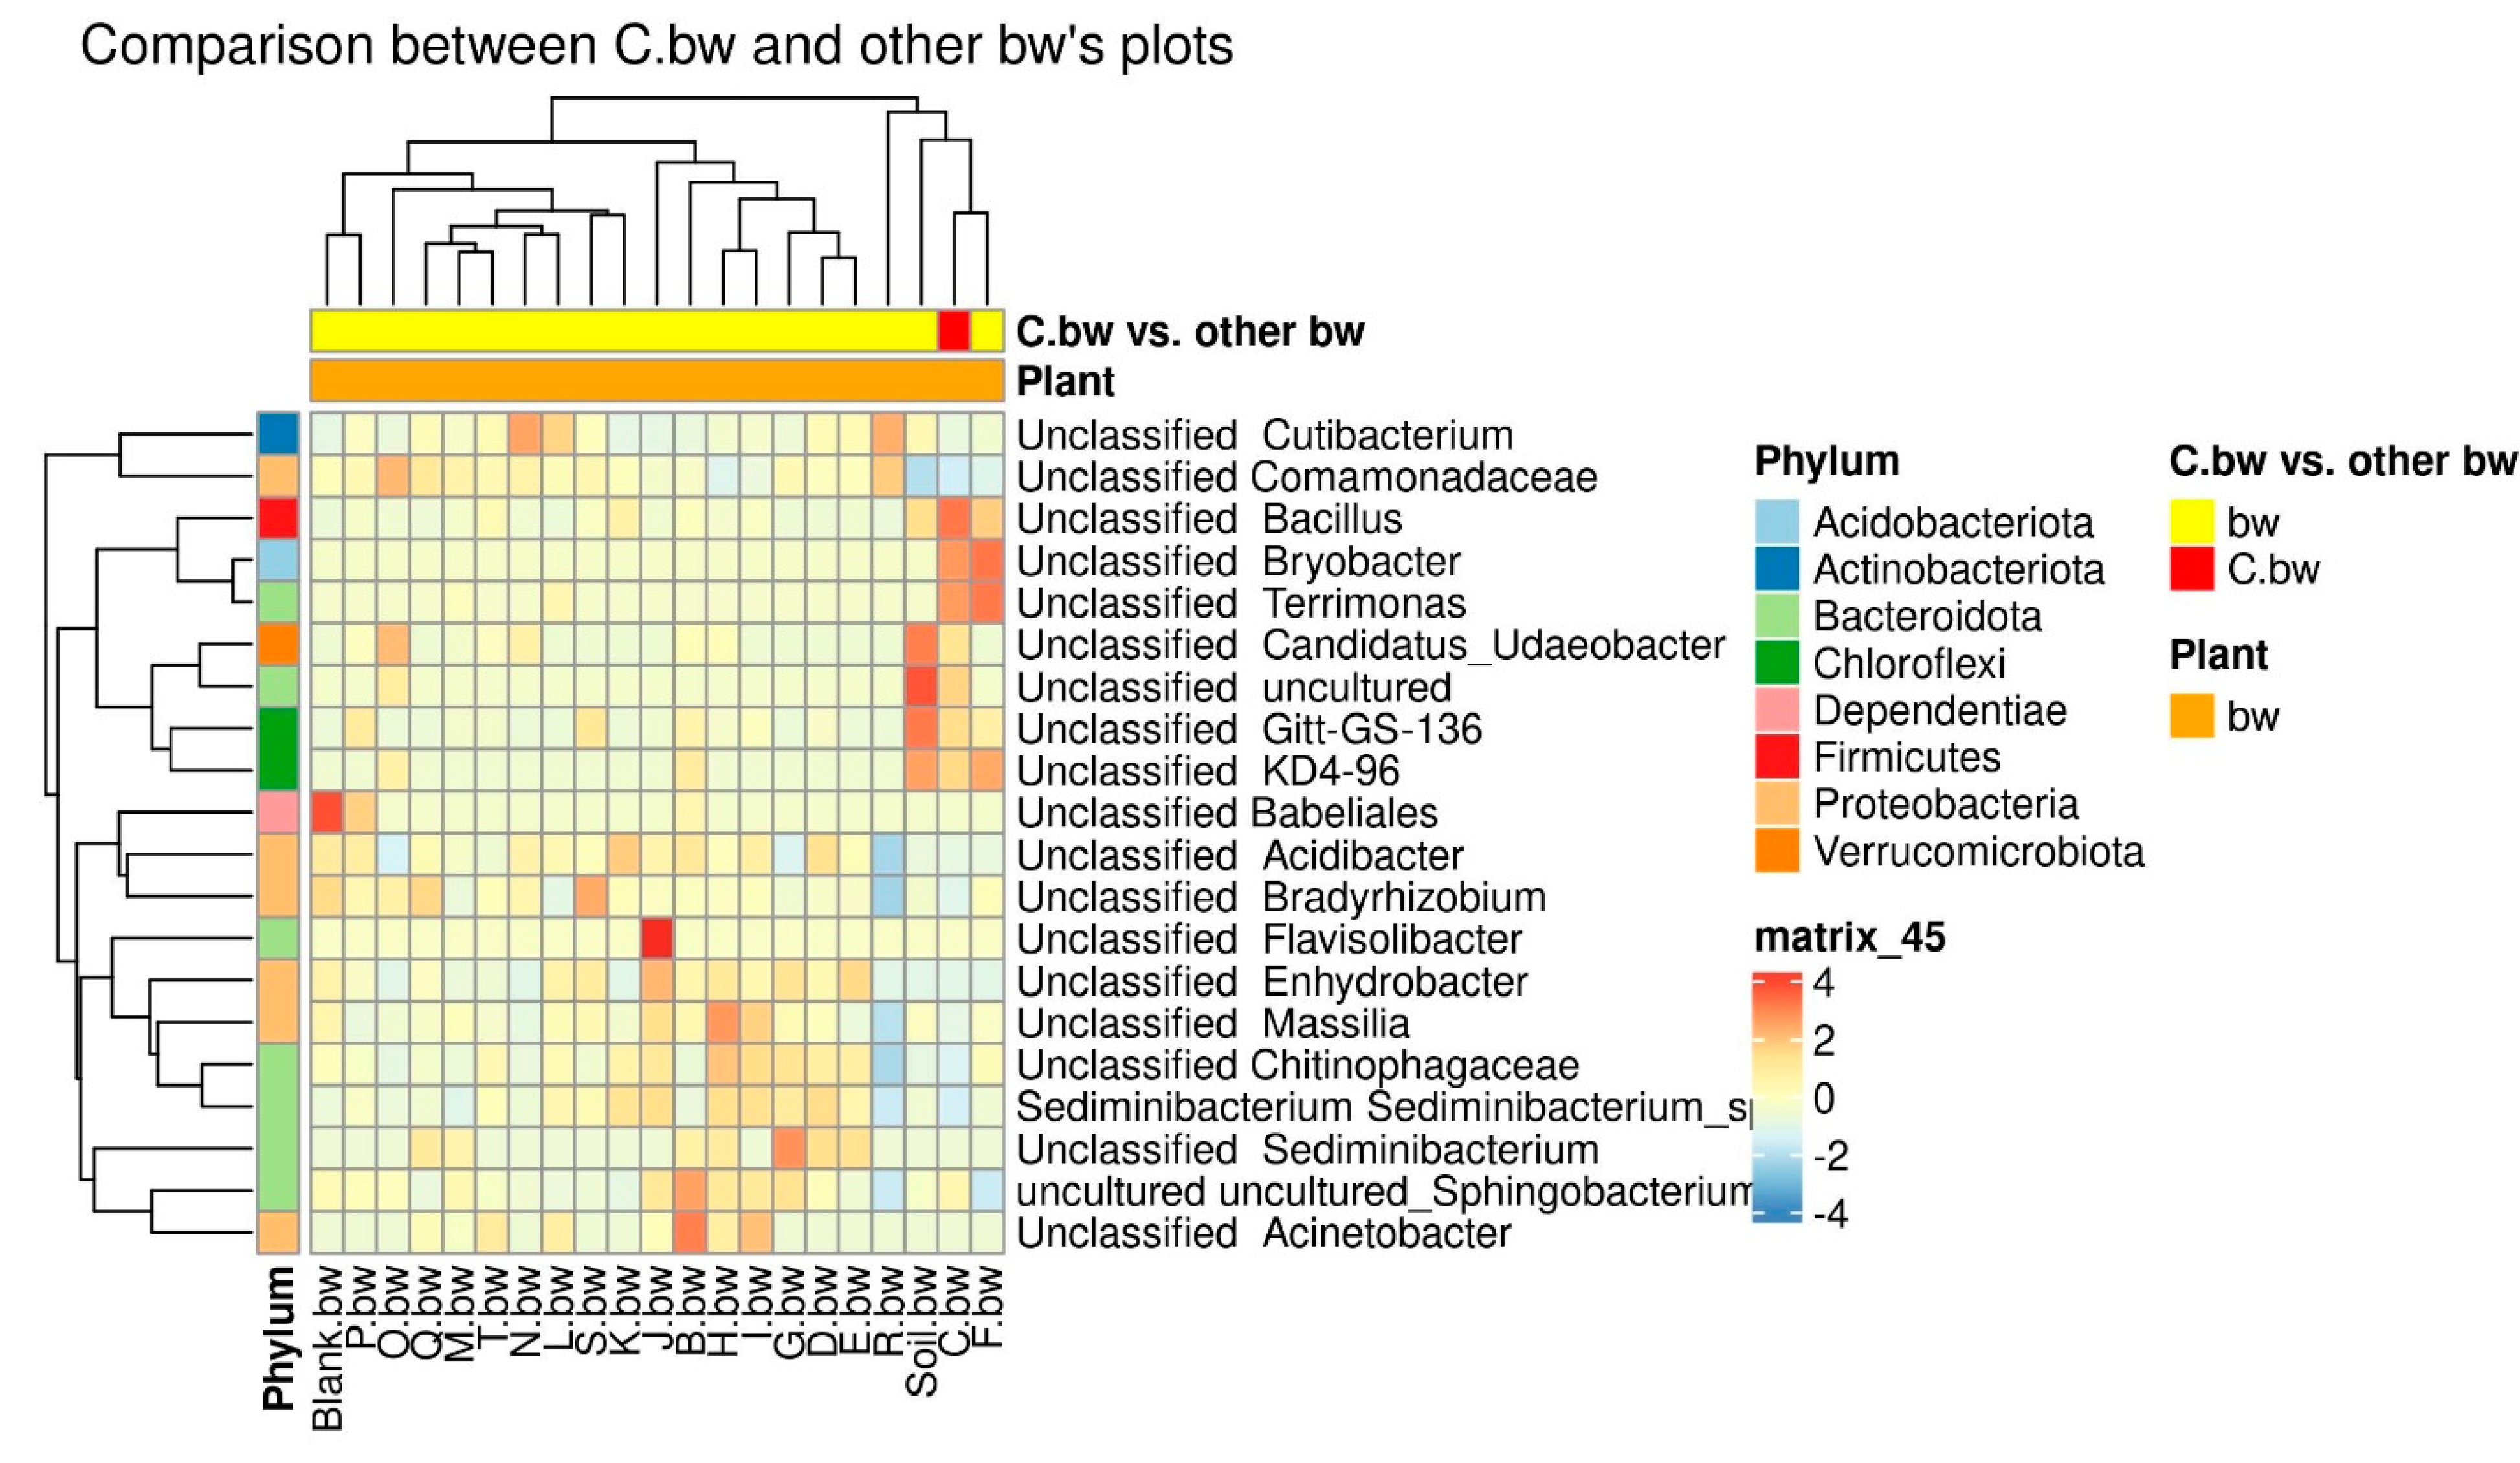
Due to the fact that the plants and the composition of the soil from the C.bw plot showed the highest agrotechnical indicators in this experiment, two comparisons were carried out: C.bw against all other samples (
Figure 9) and C.bw against all samples from plots with buckwheat (
Figure 10).
The results of the comparison confirmed the previously identified Unclassified OBL17 and Unclassified Bacillus.
The plot C.bw was distinguished from all other plots (except for F.bw) with buckwheat by Unclassified Bacillus (Firmicutes), Unclassified Bryobacter (Acidobacteriota), Unclassified Terrimonas (Bacteroidota). Also, the content of Unclassified Candidatus_Udaeobacter, Unclassified Gitt-GS-136, Unclassified KD4-96, and Unclassified uncultured was increased. It is noteworthy that an increase in the content of KD4-96 was detected for all three samples included in Cluster II (C.bw, F.bw, and Soil.bw).
Since Cluster 2 contained only samples from plots allocated for buckwheat, the available soil nutrients and carbon content were only separately compared between buckwheat plots, in order to neutralize the influence of different crops on soil nutrients (
Figure 11). With the exception of the increased content of available phosphorus in plot C.bw (
p < 0.01), the content of other nutrients did not statistically significantly differ between plots.
Finally, Venn diagrams were constructed in order to assess whether there were unique bacterial taxa in Cluster II or in the soil of the plot from C.bw (
Figure 12).
According to Venn diagrams, Cluster 2 had two unique OTUs. Both OTUs are defined at the family level, moreover, both belong to the same family: domain Bacteria, phylum Acidobacteriota, class Blastocatellia, order Blastocatellales, family Blastocatellaceae. Both OTUs are not unique to C.bw; they were identified in two samples: C.bw and Soil.bw. Since the Soil.bw sample represents the soil microbiome before the experiment, it can be argued that these OTUs were likely present initially and were only preserved in plot C.bw. Other taxa, which exhibited increased content in the soil sample of the C.bw plot, were likely present in the soil before planting. However, under the influence of external factors, these taxa gained a selective advantage in reproduction.
3. Discussion
The inoculation of seeds from important agricultural crops (wheat, buckwheat, corn) with bacterial consortia, followed by cultivation in the open field, improved the agrotechnical indicators for buckwheat treated by Consortium C. While for other variants of the culture–consortium interaction, the agrotechnical indicators either did not differ from the control or exhibited variations in just one indicator, for the combination “Consortium C—buckwheat” there was a systemic positive improvement in all growth and yield indicators.
Consortium C was based on the Rothia endophytica GMG9 strain, which demonstrated a high phosphate-immobilizing ability (248.3 µg/mL) in a laboratory experiment [
13]. An active nitrogen fixator, the strain Azotobacter chroococcum GMG39 [
13], was also added to Consortium C. Interestingly, another Consortium H, created on the basis of the Rothia endophytica GMG9 strain, but with the addition of a strain with high siderophore production and antifungicidal activity (Enterobacter amnigenus GMG288 [
13]), did not demonstrate an increase in available phosphates in the soil. Also, Consortia B, D, and E, which contained Azotobacter chroococcum GMG39 in combination with other phosphate-immobilizing bacteria, did not show any effect on the availability of phosphates in the soil and buckwheat yield. Thus, it can be assumed that, in Consortium C, one can observe a synergistic effect of the strains Rothia endophytica GMG9 and Azotobacter chroococcum GMG39. The synergistic effects of the use of nitrogen-fixing and phosphate-immobilizing bacteria strains have already been demonstrated, on both the macronutrient contents in plants and their availability in the soil [
6,
7]. In most cases, phosphate mobilizers improve nitrogen fixation by increasing the availability of phosphates for the operation of nitrogenases or the development of the root system [
14]. At the same time, it is worth noting that this synergistic effect was present only when growing buckwheat and did not manifest itself in any way when growing wheat or when growing corn. This can be explained by the fact that plants have a strong influence on the composition of microbial communities in the soil through the release of root exudates and decomposition of litter and roots. The relationship between plant species and microbial communities in rhizospheric soil is strict and is the result of co-evolution [
15]. Initially, the species Rothia endophytica was described as isolated from superficially sterilized roots of Dysophylla stellata (Lour.)—a plant of the family of Lamiaceae, used as a medicinal substance in China [
16]. Perhaps this bacterium can only interact with the roots of some plant species, one can see the effect of the successful symbiosis of bacteria and plants. Unfortunately, plant root samples were not preserved in the work, and this issue requires further research.
Analyzing microbial diversity in the soils of experimental samples three months after inoculation, no strains that formed consortia were found. There are examples of both the long-term presence of inoculants in the rhizosphere of plants [
17] and their temporary effect for up to three days [
18]. This suggests that when seeds are inoculated, the main effects are as follows: (1) the initial effect of bacteria embedded in the seed peel on the seedling; (2) modification of the habitat and subsequent changes in the composition of the soil microbiome. Hypothesis 1 does not explain the serious change in soil composition that occurred three months after sowing seeds treated by the consortium, so it is assumed that hypothesis 2 is the most likely.
The formation of a soil microbial community is a complex process that is determined by many factors, including the physico-chemical characteristics of the soil, vegetation, and random events, which leads to the formation of a stable community where all functional niches are occupied [
19]. In this regard, an increase in alpha diversity is often associated with better soil productivity, since a variety of microorganisms provide nutrition and protect the plant from stress in different conditions [
20]. However, it was shown that a decrease in the alpha diversity of the soil before the inoculation of Azospirillum brasilense reduced interspecific microbial competition and triggered the processes of the recolonization of plants by bacteria associated with PGPB effects [
21]. The species richness of the soil microbial community (alpha diversity) was similar for all studied samples. That is, the effect of the introduction of consortia did not lead to an increase in the wealth of the microbial community in our case. However, it is more important to assess the ratio of different phylogenetic groups of microorganisms [
22]. Beta-diversity analysis revealed that the microbial diversity of three soil samples (C.bw, F.bw and Soil.bw) differed significantly from all others and these samples were allocated to a separate cluster by NMDS in Cluster II. At the phylum level, the number of Acidobacteriota and Firmicutes in samples from Cluster II was increased. This is consistent with the visualization of the results comparing the union of Clusters I and III with Cluster II on the heatmap. Cluster II samples contain an increased amount of OTUs: Unclassified OBL17 (Acidobacteriota), Unclassified Blastocatellaceae (Acidobacteriota) and Unclassified uncultured (Acidobacteriota) and Unclassified Bacillus (Firmicutes). Moreover, according to the Venn diagram, Cluster II has two unique OTUs, both of which belong to the phylum Acidobacteriota, class Blastocatellia, order Blastocatellales, and family Blastocatellaceae.
Due to the difficulties of cultivation and laboratory maintenance, many classes of Acidobacteriota contain a limited number of well-characterized representatives. Due to approaches to the identification of bacteria that exclude cultivation, new classes of Acidobacteriota, called subdivisions (SDs), have been identified. Unclassified OBL17 (Acidobacteriota) [
23] and Unclassified Blastocatellaceae (Acidobacteriota) [
24], which distinguish Cluster II from the union of Clusters I and III in this study, belong to the SD4 subtype. Lauber et al. revealed a clear correlation of the representation of Acidobacteria depending on the pH of the soil [
25]. Hartman et al. observed a strong increase in the abundance of Acidobacteria with a lower pH. Their results reveal shifts in the composition of whole bacterial communities and the abundance of specific taxonomic groups with environmental gradients that may reflect changes in biogeochemical cycling [
26]. Despite there being no published data on soil acidity for Unclassified OLB17 (Acidobacteriota) and Unclassified Blastocatellaceae (Acidobacteriota), the fact that a very high value of available phosphorus was recorded for soil sample C.bw indirectly indicates that the pH of this sample was acidic.
It is noteworthy that the sample F.bw also fell into Cluster II, but the plants from this plot did not show such high agrotechnical indicators, and the soil did not have a high content of available phosphorus. C.bw and Soil.bw, as opposed to F.bw, included unique OTUs belonging to the Blastocatellaceae family. These bacteria are known as oligotrophic [
27], demonstrate tolerance to a wide pH and temperature range [
28], and can participate in soil bioremediation [
29].
It is possible that this genus of bacteria, present in the original soil, is suppressed when planting cultivated plants, since they were not found in any other samples. At the same time, the introduction of consortium C into buckwheat preserved the conditions for the favorable existence of the family Blastocatellaceae. Perhaps this factor is the acidic pH of the soil, since, in laboratory studies, the Rothia endophytica GMG9 strain demonstrated a high ability to immobilize phosphates, which, in turn, is often due to acid production. Unfortunately, the family Blastocatellaceae is mainly represented by uncultivated bacteria, and it is difficult to delineate their functions in the soil. Based on the available data, it can be assumed that representatives of this family can participate in the elimination of some substances from the soil that inhibit plant growth or the accompanying beneficial microflora. Considering this scenario, the bacteria introduced through inoculation might have a more enduring effect in such an environment.
It is interesting to note that the soil microbiome following the introduction of consortium C aligned with a soil sample taken from a plot where no crops were grown. This suggests that the addition of Consortium C potentially conserved the original microbial community of the soil. At the same time, the buckwheat harvest was higher than that in all other plots. It can be assumed that the planted plant secretes some substances into the soil that modify the microbial community, adjusting it to the needs of the plant, but suppressing the growth of some important bacteria that help enrich the soil with nutrients. In the case of consortium C, the introduced bacteria either neutralized this action or “protected” the family Blastocatellaceae bacteria from it, which allowed them (or some other bacteria) to survive and have a further beneficial effect on the plant. This may also explain the specific manifestation of consortium C’s effect on buckwheat, since different plants most likely possess their own array of such metabolites.
Therefore, this study showed that, under the conditions of natural gray forest soils, the introduction of a consortia of bacteria beneficial to plants did not have a significant effect on the growth and yield of wheat, corn, and buckwheat, with the exception of consortium C for buckwheat. The only successful result (consortium C for buckwheat) showed that, when selecting microorganisms for the creation of microbial fertilizers, it is important to take into account not only the characteristics of the soil but also the characteristics of the plant, which can affect the survival of beneficial bacteria in the rhizosphere. It was also shown that such a favorable result was associated with a significant increase in the availability of phosphates in the soil, which can be attributed both to the direct action of a consortium of phosphate-immobilizing and nitrogen-fixing bacteria and to the acidification of the medium due to an increase in phylum Acidobacteriota bacteria in the soil. An analysis of the soil microbiota after the introduction of consortia showed that the addition of consortium C during buckwheat cultivation led to the preservation of the original soil microbiome. This preservation might be the cause of the high yield in this plot, suggesting that this could be another mechanism by which beneficial bacteria contribute to plant growth.
4. Materials and Methods
4.1. Designing Bacterial Consortia
Twenty consortia of 2–3 bacteria were used for the study (
Table 1). For ease of citation, these 20 consortia are coded with letters of the Latin alphabet from A to T. All consortia included microorganisms from the collection (Center of Applied Microbiology of the Institute of Chemical Biology and Fundamental Medicine (ICBFM), Novosibirsk, Russia) that showed the best results in tests of phosphate solubilization or the ability to grow in a nitrogen-free environment and ammonia production. Seven consortia were based on
Pseudomonas koreensis GMG11 strain with high phosphate-immobilizing capacity (294.8 µg/mL); six of them also included various strains with a high ability to grow on a nitrogen-free medium (A, D, M, P, S, T); and one strain had a high production of auxin (Q). Another 6 consortia (K, B, I, L, O, R) were based on the
Rahnella aceris GMG294 strain with a high phosphate-immobilizing ability (214.0 µg/mL), to which different strains with a high ability to grow on a nitrogen-free medium were also added. Also, four consortia were based on Pseudomonas strains that demonstrated high siderophore production values (F, G, E, N) with the addition of either phosphate-immobilizing (F, G) or nitrogen-fixing (E, N) bacteria. All the consortia described above are composed of bacteria belonging to the Pseudomonadota phylum; three more consortia were composed based on strains from another phylum—Actinomycetota (C,H,J). Consortia C and H were based on
Rothia endophytica GMG9 with a high phosphate-immobilizing ability (248.3 µg/mL), with the addition of nitrogen-fixing bacterium
Azotobacter chroococcum GMG39 (C) or a strain with high antifungicidal activity
Enterobacter amnigenus GMG288 (H). Consortium J was based on the nitrogen-fixing strain of
Rhodococcus erythropolis GMG21 with the addition of the phosphate-immobilizing strain
Pseudomonas koreensis GMG11. When composing combinations, preliminary experiments were carried out on the antagonistic activity of strains so that growth suppression did not occur.
As comparison samples, we added two more plots for each crop: Blank and Soil. Crops were grown on the Blank plot, the seeds of which were inoculated with sterile water instead of a bacterial consortium before planting. This was a control for the effect of inoculation by the consortium. No crops were planted on the Soil plot, which was a control for the soil’s condition before planting cultivated plants.
4.2. Description of the Field Experiment
The effect of bacterial inoculation on plant growth was studied on three significant crops: corn, buckwheat, and wheat. All the selected seeds were surface-sterilized by 1% NaOCl for 90 s and two consecutive rinses in sterile distilled water, followed by air-drying under laminar air flow. Bacterial cultures were grown in 50 mL falcon tubes filled with 10 mL LB broth and were kept on shaker at 200 rpm for 48 h and diluted to adjust 108 cfu/mL bacterial solutions with sterile distilled water. Seeds were coated with culture by immersion in a suspension of bacteria for 120 min. This experiment was carried out in three replications and the results were compared with control seeds treated with water instead of a bacterial isolate. Five seeds were placed in each plot at a depth of 2–3 cm. The experiment lasted 90 days, until the grain matured. The experiment was set up in a randomized design, with three biological replications.
The soils on which small-scale field experiments were carried out belong to the type of gray forest soils. Within the Novosibirsk region, gray forest soils are found in the forest-steppe zone, the taiga subzone and, much less often, in the southern taiga subzone. In the right-bank part of the Siberian district (the Salair drained plain, the foothills of the Salair ridge), gray forest soils occupy about 1250 thousand hectares in such administrative districts as Novosibirsk, Maslyaninsky and Iskitimsky, which is more than 50% of all land. In the left-bank part, gray forest soils are much less common and occupy about 50 thousand hectares, mainly in the northern part of the Priobsky plateau and in places north of the Barabinsk and south of the Privasyugan lowland plains (Kolyvan, Mikhailovsky, Severny, Kyshtovsky administrative districts). The total area of gray forest soils in the region is about 1.3 million hectares (7.8% of all land). Gray forest soils are formed on elevated landforms with an abundence of surface runoff and relatively deep groundwater levels. Natural vegetation is mainly represented by small-leaved birch and birch–aspen forests and meadow steppes.
4.3. Determination of Chemical Parameters of the Soil
Soil samples were analyzed for the content of available phosphorus (AP), exchangeable potassium (Ex-K), available nitrogen (AN-NO
3, AN-NH
4), soil organic (SOC) and soil inorganic carbon (SIC) with different protocols [
30]:
(1) Soil organic carbon—0.1–0.2 g soil, reaction with 0.4 N K2Cr2O7 in mixture with H2SO4;
(2) Available phosphorus—20 g soil extracted by 0.03 N K2SO4, 5 min reaction time;
(3) Exchangeable potassium—5 g soil < 1.0 mm, extracted by 50 mL of CH3COONH4, pH = 7, 1 h reaction time.
The labile forms of macronutrients (AN-NO
3, AN-NH
4) were determined by the conservative methods described by Maynard and coauthors [
31]. In brief, the quantity of nitrate was determined potentiometrically after the extraction of 2 g of the dry cadaver material by 20 mL of 0.03M K
2SO
4. Ammonium content was determined colorimetrically after extraction of 2.5 g of the cadaver material by 50 mL of the 2N KCl. Each treatment was replicated three times.
The content of soil organic (SOC) and soil inorganic carbon (SIC) were determined by stepwise loss on ignition method using 2–4 g soil aliquots [
32].
4.4. Determination of the Yield of Buckwheat, Wheat and Corn
To assess the yield of crops grown as part of the experiment, the following parameters were recorded: plant height, mass of dry straw, mass of grain from the plot, mass of dry roots. The height of the plants was measured after 2, 4 and 6 weeks. The mass of dry roots, the mass of straw and the mass of grain were measured three months after harvest. For grain, the average weight from three plots was estimated (mean and SD), as well as the average amount of grain per plot, taking into account fallen grain calculated as the sum of the weight of grain from three plots and fallen grain divided by three.
4.5. Soil DNA Extraction and NGS-Sequencing
4.5.1. DNA Extraction
Total DNA from 0.5g soil was extracted using MagBeads FastDNATM Kit for Soil (MP Biomedicals, Irvine, CA, USA), as recommended by the manufacturer. DNA quantity was estimated by Qubit 4.0 (Invitrogen/Life Technologies, Carlsbad, CA, USA).
4.5.2. Sequencing of 16S rRNA Gene Libraries
The purified DNA isolates were amplified with primers previously developed by us, Artik-FF (5′- GTGACTGGAGTTCAGACGTGTGCTCTTCCGATCTCTACGGGAGGCAGCAG-3′) and (Artik-FR 5′-ACTCTTTCCCTACACGACGCTCTTCCGATCTGGACTACCGGGGTATCT-3′), targeting variable regions V3–V4 of bacterial and archaeal 16S rRNA genes. PCR was carried out in a 25 μL reaction mixture containing 1 unit of Q5 Hot Start High-Fidelity DNA Polymerase and Q5 Reaction Buffer (New England Biolabs, Ipswich, MA, USA), 10 pM of each primer, 2 ng of DNA matrix and 2 nM of each dNTP and fluorescent dye SYBR Green. Amplification was performed in a CFX96 (Bio-Rad, Hercules, CA, USA) under the following conditions: initial denaturation for 3 min at 96 °C, then 40 cycles consisting of denaturation at 95 °C for 10 s, followed by the annealing of primers at 55 °C for 30 s and subsequent elongation at 72 °C for 30 s The final elongation was carried out at 72 °C for 5 min. Visualization of PCR products was carried out by gel electrophoresis in agarose gels in the presence of ethidium bromide. PCR products were purified according to the recommended Illumina technique using AM Pure XP (Beckman Coulter Life Sciences, Indianapolis, IN, USA). DNA concentration in solutions was determined using a desktop fluorimeter Qubit 4.0 (Invitrogen/Life Technologies USA). To achieve this, we used the Qubit dsDNA HS Assay Kit according to the protocol. Enrichment was carried out using PCR. A set of oligonucleotides Multiplex Oligos for Illumina Dual Index Primer Set 1 (New England Biolabs, USA) was used as primers. PCR was carried out in a 25 μL reaction mixture containing 1 units Q5 Hot Start High-Fidelity DNA Polymerase and Q5 Reaction Buffer (New England Biolabs, USA), 10 pM of each primer, DNA matrix and 2 nM of each dNTP and fluorescent dye SYBR Green. Amplification was performed in an CFX96 (Bio-Rad, USA) under the following conditions: initial denaturation for 30 s at 98 °C, then 12 cycles consisting of denaturation at 98 °C for 10 s, followed by the annealing of primers and elongation at 65 °C for 75 s. The final elongation was carried out at 65 °C for 5 min. Then, PCR products were purified according to the recommended Illumina technique using AM Pure XP (Beckman Coulter Life Sciences, USA). To create a single pool of all libraries, we calculated how much of each library should be taken to obtain the same amount of DNA in nanograms. Calculations were made based on the concentrations of DNA in the enriched libraries measured using the Qubit 4.0 desktop fluorimeter. To quantify amplicon libraries, the Real-Time PCR method was used with the addition of a TaqMan probe with a ROX dye label (Syntol, Moscow, Russia) and oligonucleotides complementary to the end-sequences of libraries. As a quantitative standard, PhiX-control was used, diluted 10, 100, 1000 and 10,000 times. The concentration of the library pool was determined by the location of the fluorescence signal accumulation curve relative to the control samples. The 16S rRNA gene amplicons were sequenced in paired-end mode (2 × 301) with the Illumina MiSeq v3 (600 cycles) kit (Illumina, San Diego, CA, USA) on a MiSeq at Sirius University of Science and Technology (Sirius, Russia).
4.6. Statistical Analysis
The yield of plants is expressed in terms of the mean and SD. Visualization was achieved using function ggplot () in R.
Analysis of 16S ribosomal RNA gene sequences was performed using QIIME 2 v.2023.7 (
https://docs.qiime2.org/2023.9/install/, (accessed on 23 August 2023)) [
33]. Sequence quality control, merging of paired-end reads and chimera filtering were carried out with Deblur plugin [
34]. Operational Taxonomic Units (OTUs) were clustered by applying VSEARCH plugin [
35] with cluster-features-closed-reference using dbSilva 138 SSURef NR99 [
36] with 97% identity. The taxonomy assignment was performed using global search alignment (feature-classifier classify-sklearn). Since, according to the recommendations, the accuracy of the taxonomic classification of 16S rRNA gene sequences increases when the naive Bayesian classifier is trained only on that area of the target sequences, which was sequenced, as a classifier, we used our own trained naïve Bayesian classifier, obtained using the SILVA database reference sequences, which were limited to the primer sequences used for sequencing, as described i nthe following (
https://docs.qiime2.org/2023.9/tutorials/feature-classifier/, (accessed on 23 August 2023)). To generate a rooted phylogenetic tree, the align-to-tree-mafft-fasttree pipeline from the q2-phylogeny pluginwas used. The resolution curves were constructed using the diversity alpha-rarefaction plugin.
The description and visualization of alpha and beta diversity was performed using the following packages in R: phyloseq [
37], DESeq2 [
38], ComplexHeatmap [
39].


 ,
, 


