Abstract
The sexual species of the Dilatata complex (Paspalum dasypleurum, P. flavescens, P. plurinerve, P. vacarianum, and P. urvillei) are closely related phylogenetically and show allopatric distributions, except P. urvillei. These species show microhabitat similarities and differences in germination traits. We integrated species distribution models (SDMs) and seed germination assays to determine whether germination divergences explain their biogeographic pattern. We trained SDMs in South America using species’ presence–absence data and environmental variables. Additionally, populations sampled from highly favourable areas in the SDMs of these species were grown together, and their seeds germinated at different temperatures and dormancy-breaking conditions. Differences among species in seed dormancy and germination niche breadth were tested, and linear regressions between seed dormancy and climatic variables were explored. SDMs correctly classified both the observed presences and absences. Spatial factors and anthropogenic activities were the main factors explaining these distributions. Both SDMs and germination analyses confirmed that the niche of P. urvillei was broader than the other species which showed restricted distributions, narrower germination niches, and high correlations between seed dormancy and precipitation regimes. Both approaches provided evidence about the generalist-specialist status of each species. Divergences in seed dormancy between the specialist species could explain these allopatric distributions.
1. Introduction
The grasslands of midlatitude lowland regions of South America show an unusually high biodiversity. In particular, the grassland in the southeastern part of South America is one of the largest and most diverse in the world [1]. In these regions, recently diverged species, populations, and entities forming species complexes have been described in several taxa. This high intraspecific variability has been attributed to repeated past range fluctuations and fragmentation into multiple climatic refugia [2,3,4,5,6]. However, biodiversity in such regions may be threatened due to land-use changes, mainly due to the intensification of agriculture and forestry in the few last decades [1,7] and the absence of adequate conservation policies [8].
The genus Paspalum (Poaceae) is a highly diverse taxon in the South American grasslands [9]. Within Paspalum, the Dilatata species complex is an allopolyploid group of warm-season grasses composed of several apomictic taxa, such as the pentaploid Paspalum dilatatum Poir., which has been extensively studied as a forage crop [10,11]. This group also contains five sexual species: P. dasypleurum Kunze ex. Desv., P. flavescens (Roseng., Arrill. and Izag.) Speranza and G. H. Rua, P. plurinerve Quarin, Valls and V. C. Rosso, P. vacarianum Valls and V. C. Rosso, and P. urvillei Steud. [12]. The apomictic species of the Dilatata group encompass rather indefinite groupings of interspecific hybrids [13]. However, despite their close phylogenetic relationship, the five sexual species included in this group can be considered very well delimited and recently diverged independent evolutionary units [14,15]. These sexual species are highly autogamous [16] and, although hybrids can be obtained artificially, mostly no gene flow has been observed in nature among them [17].
The geographical location of the sexual Dilatata species has been recently reported, however, its distribution has not been biogeographically analysed. Four of the five species (P. dasypleurum, P. flavescens, P. plurinerve, and P. vacarianum) show a restricted and mutually exclusive geographical distribution, however, P. urvillei shows a wider continuous distribution co-occurring in its native range with the last three species mentioned above [12,18]. The reported distributions suggest that P. urvillei has a generalist habitat behaviour, which translates into its ability to occupy diverse environments and larger areas at the ecological scale. In contrast, the other four species are closely associated with more specific regions and are probably more specialist [19]. Despite this, all the sexual Dilatata species occupy similar microhabitats with high light and soil water availability and are frequently found on roadsides and disturbed ranges [12,16,20].
The distribution of a plant species is determined by historical and environmental factors and its interaction with other species. Species distribution models (SDMs) have been extensively used as an approach to understanding the potential distribution of a species and to test biogeographical, ecological, and evolutionary hypotheses [21,22,23,24,25,26]. SDMs help identify drivers that determine the favourable regions for a species and the habitat characteristics that define their ecological niche breadth [24,27,28]. A broadly used SDM method consists of correlative models that use logistic regressions to link species’ presence-absence data with environmental and geographic data. [29,30]. Among these SDM methods, the favourability function is suitable for SDM comparisons between species with different prevalences in the same study area through fuzzy logic tools [31,32,33,34].
Crucial ecological processes that determine geographic distribution at the scale of environments or habitats, such as progeny dispersion, physiological responses to environmental stresses and biotic interactions, are not easy to incorporate explicitly into the SDMs [35,36]. However, integrating relevant plant functional traits as a species performance currency could be informative for understanding the mechanistic basis of the adaptation associated with the described distributions [37,38]. Functional traits are measurable individual-level features that interact with environmental and ecological factors [39]. Ecological hypotheses have been tested mainly with functional vegetative traits, frequently overlooking regeneration traits [40]. In spite of this, vegetative and regeneration traits may show contrasting relationships with environmental factors [41,42].
The regeneration niche concept states that plant species occur in habitats where seed germination and seedling establishment are possible [43,44,45]. Seed germination under a range of conditions, mainly different temperatures, has been used to test the regeneration niche hypothesis [46,47,48,49,50]. Seed germination responses are controlled by seed dormancy, a quantitative and adaptable mechanism that inhibits germination until specific environmental requirements are met. It can be estimated by evaluating germination in various temperatures and dormancy-breaking factors [51,52]. The ability to germinate in a wider temperature range often reflects reduced dormancy and a broader germination niche, which may be associated with a generalist habitat behaviour [53,54,55]. Seed dormancy mechanisms and germination responses to temperature are often highly conserved phylogenetically [56,57,58]. However, divergence in these traits among similar species is usual even across fine-scale environmental variations, giving adaptive germination responses driven by both genetic selection and phenotypic plasticity influenced by maternal effects [59,60,61].
The sexual species of the Dilatata complex share several functional vegetative traits with the very widespread and better studied P. dilatatum. They are perennial warm-season C4 grasses with very high leaf frost tolerance [62,63,64,65] and minor differences in growth habits [12,66]. Except for P. dasypleurum, no major differences in development or vegetative persistence have been reported for these species in their reciprocal locations when transplanted. Despite this, divergences can be relevant among regeneration traits. Paspalum flavescens has been shown to exhibit a stronger seed dormancy than P. plurinerve, which occurs further north [67,68]. However, information on germination for the rest of the sexual Dilatata species is scarce [69]. In general, seed germination in the species of the Dilatata complex occurs in relatively high temperatures. Germination can be improved by seed dormancy-breaking factors such as cold stratification, nitrate addition and alternating temperatures [67,70,71]. Each of these germination responses can be linked to ecological and habitat preferences. For example, the germination proportion achieved after cold stratification reflects the extent of the cold requirement during winter to germinate in spring [72]. Also, the response to nitrate is a seed gap-detection mechanism and can be related to the preference for disturbed places [51,73].
In this work, we integrated species’ distribution modelling with the study of a regeneration trait to understand the geographical range occupied by the sexual Dilatata species, and to explain the current biogeographical pattern of this group. First, we applied favourability models based on presence-absence data and a wide range of predictive variables (spatial, topographic, climatic, land use, and anthropogenic activities) to determine the favourable area of each species and identify key drivers determining their distributions. To determine whether environmental favourability is related to germination traits, we sampled genotypes (inbred lines) of the five species from locations with a high likelihood of being located in the respective favourable areas. We grew them in a common garden experiment and produced seeds to study germination under a range of alternating temperatures, nitrate addition, and stratification treatments for two years. Seed dormancy and germination niche breadth were estimated based on the germination results. We evaluated the differences in seed dormancy among the species and performed regressions between germination and environmental variables for each population. The ecological and biogeographical insights brought by each approach were discussed.
2. Results
2.1. Explanatory Variables and Favourable Areas for Sexual Dilatata Species
The favourability results were congruent with the territories occupied by the observed presences for each species (Figure 1). The spatial variable (Ysp) was relevant across the models of the five species, and it was the most important predictor for the distribution of P. flavescens and P. plurinerve (Table 1). Meanwhile, the urban cover was the most relevant predictor for P. dasypleurum and P. urvillei, and the minimum temperatures in the coldest month (Bio6) for P. vacarianum. For all the species analysed, at least one relevant model variable was related to human activities (Table 1). All the explanatory variables of each model do not show multicollinearity (variance inflation factor < 2). All the sites where the genotypes used for the germination experiments were sampled appeared in hexagons classified as of maximum favourability (F ≥ 0.8), except for the northernmost point for P. urvillei (red triangles in Figure 1). The area under the receiving operating characteristic curve (AUC) was higher than 0.9 for all the models, which is interpreted as outstanding discrimination ability (see Table A2). Moreover, the values obtained for the classification parameters (sensitivity, specificity, correct classification rate and true skill statistic) were always greater than 0.9 in all models except for P. urvillei (Table A2).
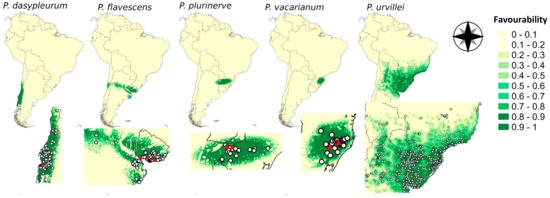
Figure 1.
Favourability models for each of the five sexual species of the Dilatata group based on predictor variables from different factors: spatial configuration, topography, climatic, hydrology, global land cover, and human activities (see Table A1). The zoom of each favourability model (bottom maps) shows the species occurrences (white circles) and the occurrence of genotypes used for germination assays (red triangles).

Table 1.
Explanatory variables, and factors they belong to, for each of the five sexual species of the Dilatata group in the SDMs obtained. Wald parameter values (according to Wald’s test) for predictor variables included in each favourability model indicate the relative importance of each variable. Bold numbers highlight the four most significant predictor variables of each SDM. Signs in brackets show the positive or negative relationship between favourability and the variable. Abbreviations and sources of each predictor variable are noted in Table A1.
2.2. Germination Treatments
The harvested seeds were used to perform two experiments to analyse the germination behaviour of these species. Sufficient seeds were collected for all genotypes. Particularly, the number of seeds harvested for P. urvillei genotypes was two- to sixfold than that of the other species in all harvest times. Experiment one was set to assess germination after stratification treatments. Experiment two, on the other hand, was designed to assess germination in a range of alternating temperatures with and without the addition of nitrate to determine the thermal amplitude of germination in the presence or not of a dormancy-breaking substance. The final germination proportion (FGP) showed significant differences among treatment levels and species in both germination experiments (Table 2). However, the uncertainty of germination (UG) and germination timing variables (mean germination section for experiment one and mean germination time for experiment two) showed inconsistent differences among species through treatments or no differences at all (see Table A4). Cold stratification resulted in a higher FGP than nonstratified seeds (p < 0.05), except for P. dasypleurum, which reached germination proportions lower than 10% in all treatment levels in experiment one. Warm stratification showed lower FGP than cold stratification for P. flavescens, P. plurinerve, and P. vacarianum, though not for P. urvillei (Table 2a). For experiment two, germination without nitrate was almost nil in colder temperatures (10/20 °C) and very low at 15/25 °C, except for P. urvillei and P. plurinerve, which achieved 75% and 21%, respectively. The addition of nitrate allowed a higher FGP in almost all temperatures and species (Table 2b). Germination with nitrate was close to 100% at high temperatures (20/30 and 25/35 °C) for all the species (except P. dasypleurum) and at 15/25 °C for P. urvillei and P. plurinerve (Table 2b). Combining high temperatures with nitrate also retrieved higher germination synchronicity (lower UG, Table A4).
Table 2.
Adjusted means for final germination proportion (FGP) for each level of treatment and species within each germination experiment. (a) Experiment one (stratification treatments), (b) Experiment two (alternating temperatures and nitrate addition).
The ranking from higher to lower FGP in almost all treatment levels for both experiments was P. urvillei, P. plurinerve, P. vacarianum, P. flavescens, and P. dasypleurum. This ranking was observed for germination ability (GA) and germination evenness (GE), two indexes used to estimate both seed dormancy level and germination niche breadth (Figure 2). The variance of GA and GE was higher among species than among genotypes within species or among harvest times (Table A5). The distribution of the variability in the extent, timing, and synchronicity of germination among genotypes and harvest times is depicted in the results of the PCA (Figure A2a). The first principal component (PC1) explained 32.2% of germination variability, and the five species showed a clear gradient along it. PC1 was positively correlated with FGP for seeds with warm stratification and without stratification (Figure A2b), which are restricting conditions for germination in the studied species. Also, PC1 is negatively correlated with UG at 20/30 and 25/35 °C with nitrate (Figure A2b), conditions that tend to increase synchronicity (lower UG). Therefore, the PC1 summarized several germination attributes, and its score is inversely related to seed dormancy.
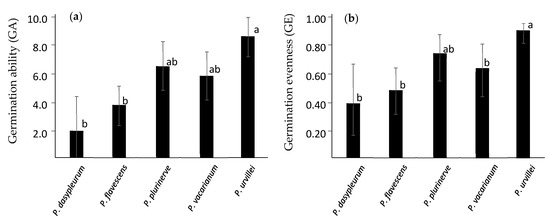
Figure 2.
(a) Mean germination ability (GA) and (b) mean germination evenness (GE) for each species. These variables were generated to estimate both seed dormancy and germination niche breadth. GE data were logit transformed before analysis. Vertical lines indicate a 95% confidence interval. Different letters mean significant differences among species within each germination variable.
2.3. Relationships between Germination and Environmental Variables
Despite minor intraspecific differences, all genotypes of P. urvillei at all harvest times attained higher FGP, lower UG, and lower germination timing than the other species under most conditions assayed, which is reflected in higher PC1 scores (Figure A2). These results suggest a low seed dormancy for all P. urvillei genotypes, meaning that germination in this species is less environmentally constrained regardless of the large distances and differences in climatic features among their occurrence sites (Figure 1). This idea was further supported when the PLSR including P. urvillei genotypes explained a low proportion of the variability of both response (<62%) and predictor (<82%) variables for all the germination variables (Table 3a). Also, linear regressions between germination and environmental variables (those which achieved a VIP > 1 in PLSR) were significant (p < 0.05), however, they showed low adjustment (R2 < 0.5) when all species were considered (Table A6).
Table 3.
Optimization results of partial least square regressions (PLSR) were performed for each response (germination) variable. (a) Optimization including P. urvillei genotypes. (b) Optimization without P. urvillei genotypes. Root mean squared error on prediction (RMSEP) for the selected number of components and percentage of predictor (environmental variables) and response (germination variables) explained by PLSRs are shown. The predictor variables with importance in projection higher than one (VIP > 1) were listed for each PLSR optimization. Abbreviations and sources of each predictor variable are noted in Table A1.
On the other hand, PLSR without P. urvillei explained a higher proportion of the variability of response (>94%) and predictor (>87%) variables (Table 3b). The set of environmental variables with VIP > 1 was almost the same for the three germination variables, all of which were climatic variables. Precipitation in the driest or warmest periods (Bio14, Bio17, and Bio18, see Table A1) showed an orthogonal relationship with the mean temperature in the colder quarter (Bio11) and annual potential evapotranspiration (ETP-An) (Figure A3). The correlation between the values of Bio14 and Bio17 was high (r = 0.999), and both were correlated with Bio18 (r = 0.90).
Significant linear regressions were obtained for all germination variables using the climatic variables with VIP > 1 after PLSR without P. urvillei genotypes (Table A6). All regressions achieved the highest adjustments when precipitations in the drier quarter (Bio17) were used as the predictor variable (Figure 3), and similar results were obtained using precipitation in the drier month (Bio14) or the warmest quarter (Bio18) (Table A6). Regressions using temperature-based variables, such as Bio11 or ETP-An, yielded significant, but lower, adjustments (R2 < 0.7) (Table A6). Despite the high adjustment in regressions achieved by Bio17, this variable was not different between the locations where samples of P. vacarianum and P. plurinerve were collected, however, differences in the temperature in the coldest quarter (Bio11) were found (Figure 3). These two species did not show significant differences in GA or GE (Figure 2), though they showed consistent differences in germination at 15/25 °C even with nitrate, where P. vacarianum showed lower FGP than P. plurinerve (Table 2b).
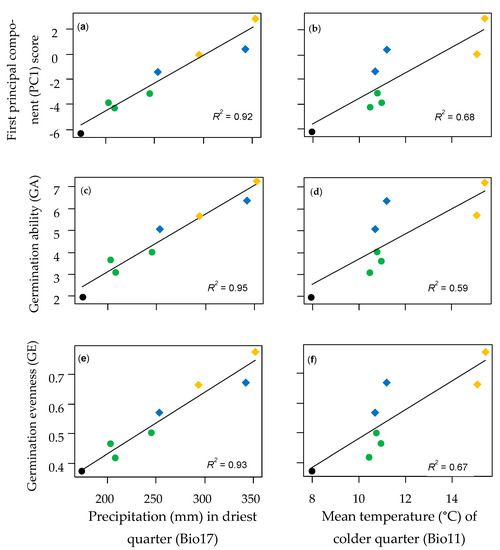
Figure 3.
Linear regressions with precipitation in the driest quarter (a,c,e) and with the mean temperature of the colder quarter (b,d,f) for three germination variables: First principal component (PC1) score from PCA (a,b), germination ability (GA) (c,d), and germination evenness (GE) (e,f). Colours identify the species: black = P. dasypleurum, green = P. flavescens, blue = P. vacarianum, and orange = P. plurinerve. Genotypes of P. urvillei were not included. Southernmost distributed species are represented with circles and northernmost species with diamonds. Mean values for each genotype of the four species were used. The determination coefficient (R2) for each regression is reported.
3. Discussion
3.1. Explanatory Variables of Distribution Models and Congruence with Germination Responses
The distribution models of each species yielded a high favourability area which is highly coincident with the observed distribution range of each species. Some species had topographic or climatic variables as significant predictors for their models (slope for P. dasypleurum, mean temperature of colder months (Bio6) for P. vacarianum), which are representative factors of the environment in their respective sites. However, spatial and human activity variables were the most relevant distribution model predictors for all of the species. The relevance of spatial variables in the distribution of plant species is not related to germination traits, though it is often associated with low seed dispersal, which is another important regeneration trait [21,74]. The studied species exhibit autochorus dispersal mechanisms, similar to other grasses such as Panicum maximum L. [75]. Seeds fall near the mother plants by gravity, which does not enhance dispersal. Species with lower dispersal tend to show seed dormancy, which can be seen as a tradeoff between spatial and temporal dispersion [76].
On the other hand, the importance of human activities on distribution suggests that ruderal environments may be particularly suitable for these species. The preference of these species for disturbed environments, including those caused by anthropogenic factors, has been previously noted [12,16,77]. Soil disturbance may improve the germination of some species by increasing the levels of dormancy-breaking factors such as light, alternating temperatures or nitrate [51]. It has been shown that disturbances such as flooding and grazing lead to increased seedling emergence of P. dilatatum [20]. Coincidently, in the germination experiments, we obtained a positive response to nitrate addition for all the Dilatata species evaluated, and almost 100% of the seeds germinated with high synchronicity (except for P. dasypleurum) when nitrate addition and high alternating temperatures were combined. Nitrate in the soil is considered an environmental cue for the absence of vegetation or soil disturbance. The nitrate levels in the soil are greater in vegetation gaps than under undisturbed vegetation due to the nitrate uptake of established plants [73]. Also, soil disturbances induce an increase in nitrification [78]. The increase in seed germination with nitrate may be related to a preference for disturbed soils [51,79]. Thus, this opportunistic germination response to nitrate is congruent with the importance of human activities highlighted as one of the main explanatory predictors of the distribution of these species.
3.2. Habitat Generalist and Specialist Behaviours and Germination Niche Breadth
Collection data and favourability models clearly differentiate between the broader geographical area covered by P. urvillei and the rather restricted and allopatric areas shown by the other four sexual Dilatata species. The large geographical area with high favourability modelled for P. urvillei encompasses diverse environments, suggesting a habitat generalist behaviour [19]. Also, SDM evaluation parameters were lower for P. urvillei than for the other species (see Table A2), which is characteristic of generalist behaviour [27,28]. For such species, some functional traits are expected to show a broader niche breadth to occupy several sites along an environmental gradient [80]. The wider germination niche showed by P. urvillei (i.e.: high germination proportion in almost all conditions assayed and higher PC1 scores, GA and GE) may indeed be the functional trait that explains its generalist behaviour [54]. In addition, the seed production of P. urvillei was higher than that of the other sexual Dilatata species. Its large seed production, combined with a broader germination niche, may explain why P. urvillei has been widely reported outside its native range as a weed for summer crops and roadsides in subtropical regions [81,82,83].
The favourability values of the other sexual Dilatata species (P. dasypleurum, P. flavescens, P. plurinerve, and P. vacarianum) were high in more restricted areas associated with a given environment, which suggests a more habitat specialist-like behaviour. In such cases, functional traits often show a smaller niche breadth and more prominent local adaptation features [84]. The four specialist species showed a narrower germination niche than P. urvillei. Moreover, although the intraspecific variability should be further regarded, a cline in germination responses was apparent through these species. The southernmost species (P. dasypleurum and P. flavescens) showed a higher seed dormancy than the northernmost species (P. plurinerve and P. vacarianum), which means higher cold stratification and nitrate requirements to release seed dormancy, and more restrictions to germinate in lower temperatures. A positive association between seed dormancy and latitude is often reported for transitional regions such as wet subtropical and temperate climates [85]. However, this relationship cannot be generalized [86]. In higher latitudes, the odds of adverse events such as frost or soil–water deficit are higher, even in spring, which is a good moment for warm-season grasses to germinate and establish. For these species, a higher seed dormancy allows a longer spreading in the germination time of the seed population, distributing the seedling death risk in a highly fluctuating environment [87].
3.3. Correlation between Germination Traits and Environmental Gradient
Precipitation during the driest or warmest part of the year (represented by Bio14, Bio17, and Bio18 variables) showed a high positive correlation with seed dormancy and germination niche breadth indexes (PC1 scores, GA, and GE, see Figure 3 and Table A6) when all genotypes of the specialist sexual Dilatata species were considered. This relationship suggests that precipitation, when seedling emergence and growth occurs (late spring and summer), may be a strong environmental filter driving local adaptation of seed dormancy and germination traits for these species. Due to the seedling morphology of panicoid grasses, adequate soil water availability near the soil surface is particularly important during seedling emergence [88,89]. A decreasing precipitation gradient often implies increasing seed dormancy across populations or species [46,90], however, there are some situations where the inverse seed dormancy–precipitation association was reported [91,92].
The distribution models for the two northernmost specialist species (P. vacarianum and P. plurinerve) yielded very close areas, even showing an overlapping area where both species got high favourability. Still, the central zone of each distribution area was different (Figure 1). Paspalum vacarianum occurs in the Brazilian Planalto (1000 m.a.s.l.), a region with a similar precipitation regime but with colder winters than in the distribution area of P. plurinerve. Although the seed dormancy and germination niche breadth indexes analysed were similar between these species, the germination in mildly cold temperatures (15/25 °C) was strongly inhibited for P. vacarianum, though not for P. plurinerve (Table 2). Species from higher altitudes and lower annual minimum temperatures tend to require higher minimum temperatures to germinate [48]. The inhibition of the germination of P. vacarianum in colder temperatures may suggest a local adaptation of seed germination to the climate of the Brazilian Planalto that differentiates it from P. plurinerve.
4. Materials and Methods
4.1. Distribution Data
This study includes the five sexual species of the Dilatata group: Paspalum dasypleurum, P. flavescens, P. plurinerve, P. vacarianum, and P. urvillei. Their occurrences were obtained from the literature and the examination of herbarium specimens deposited in BAA, BLA, CEN, CORD, CONC, CNPO, CTES, ICN, LIL, LP, MNES, MVFA, MVM, and SI (acronyms for Thiers [93]). The coordinates were taken from the labels; when there were none, they were georeferenced to the location specified in the label using Google Earth. In addition, for P. dasypleurum and P. urvillei, the Global Biodiversity Information Facility (GBIF, accessed in July 2020) was consulted, considering only the native area of each species [94,95,96,97]. Additionally, for these two species, all the herbarium specimens of BAA and CORD were seen and analysed and herbarium specimens from the other institutions were visualized in order to confirm species and location. For P. flavescens, P. plurinerve, and P. vacarianum, all specimens available in all herbaria were used [12]. Most of them were georeferenced using their field labels.
4.2. Species Distribution, Environmental Variables, and Favourability Function
The analyses were carried out considering South America as the study area. The area was divided into 181,221 hexagons (6 km of apothem) (see Figure A1). We chose hexagons since they look more appropriate in connectivity studies, giving a better correspondence between the measured and Euclidian distances than rectangular grids [98]. From the distribution data, we obtained the presence and absence of each hexagon. Hexagons with at least one record were marked as a presence for the species, and the others with no record were marked as absences. We considered a total of 50 explanatory variables related to different environmental factors (spatial, topography, climatic, hydrology, global land cover, and human activities, see the list and sources in Table A1). The average value of each explanatory variable was obtained for each hexagon of the study grid. All these tasks were done using tools from QGIS v3.14 [99]. The spatial factor (Ysp) was built using a polynomial trend-surface analysis that includes quadratic, cubic, and interaction effects of latitude (La) and longitude (Lo) (Lo, Lo2, Lo3, La, La2, La3, LaLo, La2Lo, and LaLo2). This spatial descriptor detects geographic trends that are not evident with other environmental variables [21,100,101,102,103,104].
Based on the presence-absence data and environmental dataset, we optimized SDMs for each species according to the favourability function as the modelling algorithm [31]. Favourability values (F) can be obtained as follows;
where F is the environmental favourability, P is the probability of occurrence obtained from the multivariate logistic regression, n1 and n0 are the numbers of presences, and absences, respectively.
To obtain F, we used the ‘fuzzySim’ package [105] implemented in R [106]. The multGLM function was used, which allows the analytical procedures to be carried out sequentially in several steps. To minimize the effect of multicollinearity among the variables, two filters were applied to perform a preliminary variable selection from the initial set of 50 explanatory variables to use uncorrelated variables without problems of false discoveries. First, we controlled for a type I error using the false discovery rate (FDR) according to Benjamini and Hochberg [107] with the FDR function. Second, we calculated Pearson correlations among the variables using a threshold value of 0.8 with the corSelect function for the variables that passed the FDR filter. Using the variables that overcame both filters, models were constructed with the step function which performs a backward and forward step-by-step variable selection according to the Akaike information criterion (AIC) [108]. Finally, we used the multTrim function to remove nonsignificant variables. A Wald test was carried out using the ‘survey’ package [109] to determine the relative importance of each variable in all the models. In addition, we checked that all the explanatory variables selected for each model had a variance inflation factor lower than ten (VIF < 10), which is the threshold to indicate the absence of multicollinearity following Montgomery and Peck [110]. Finally, we used the ‘modEvA’ package [111] to evaluate the performance of the final models. To assess the prediction accuracy of the models, we calculated the following classification parameters: sensitivity, specificity, correct classification rate (CCR), and the true skill statistic (TSS) [112,113]. On the other hand, we estimated the AUC as the discrimination parameter [114].
4.3. Seed Production and Harvest
Based on the selfing breeding system of these species, the seed of each plant was considered a single inbred line. Eleven lines (genotypes) from the five sexual species of the Dilatata group were used to produce seeds (one genotype of P. dasypleurum, three of P. flavescens, and P. urvillei, and two of P. plurinerve and P. vacarianum, see Figure 1 and Table A3). Eight plants of each genotype were installed 1 m apart from one another in a common garden experiment in Montevideo, Uruguay (34°511 S, 56°120 W). Seeds (spikelets with caryopses) of the eight plants of each genotype were bulk harvested by hand threshing for two weeks at each harvest time: in December 2017 and 2018 (summer), and March 2018 and 2019 (fall). The harvested seeds were kept in paper envelopes and stored in a dry place at room temperature for one week. Then, they were put in airtight bags with silica gel at 6 °C to retain primary seed dormancy until used in germination experiments [115,116]. We evaluated the germination of seeds with primary dormancy to reduce environmental postharvest effects on germination phenotypes and to compare genotypes and harvest times in a more reliable way.
4.4. Germination Experiments
For each harvest time, two completely randomized germination experiments were carried out. In each experiment, three replicates of thirty to fifty seeds for each genotype and treatment were placed in Petri dishes on filter paper moistened with 5 mL of distilled water or a nitrate solution (0.2% w/v KNO3). The Petri dishes were wrapped in film to avoid loss of humidity. A seed was considered germinated when a 1 mm or further radicle growth was visible. Nongerminated seeds were tested with the tetrazolium test following Maeda et al. [117] to determine the number of viable seeds in each Petri dish after the germination assay had elapsed.
Experiment one was set to assess germination after stratification treatments in order to quantify differences among genotypes in thermal requirements to break seed dormancy. Three treatments were conducted. (1) Seeds with cold stratification (7 d in 9 °C average), (2) with warm stratification (7 d in 20 °C) and nonstratified seeds. The Petri dishes with seeds moistened with distilled water were placed in a refrigerator for cold stratification, and in a controlled temperature chamber for warm stratification. The dishes were wrapped with dark nylon to avoid light during the stratification period. After stratification, the dishes were subjected to two consecutive incubation periods: (1) in germination chambers at constant 30 °C for four days, and (2) in germination chambers with alternating temperatures (20/30 °C, 12 h dark/ 12 h light) for seven additional days. The dishes with nonstratified seeds were subjected to the same germination conditions. Germination counts were done on the 2nd, 3rd and 4th days during the incubation period in steady temperature, and on the 2nd, 4th and 7th days during the period in alternating temperatures.
Experiment two was set to assess germination in a range of alternating temperatures with and without nitrate to determine the thermal amplitude of germination in the presence or not of a dormancy-breaking substance. Four alternating temperature regimes (10/20, 15/25, 20/30 and 25/35 °C, 12 h dark/12 h light) and two germination solutions (distilled water and 0.2% nitrate solution) were factorialised. Four germination chambers were used simultaneously, each with one alternating temperature regime. The time to finalize the germination assay was different for each alternating temperature regime to allow similar thermal time accumulation (28 d for 10/20 °C, 21 d for 15/25 °C, 17 d for 20/30 °C and 14 d for 25/35 °C). The germination counts were done at intervals of two to three days until germination assay time elapsed.
4.5. Germination Variables
For each replicate, the final germination proportion (FGP), germination timing variables, and the uncertainty of germination (UG) of both experiments were estimated. The FGP was calculated as the number of germinated seeds divided by the number of viable seeds (germinated + positive in the tetrazolium test). The mean germination time (MGT) was estimated for experiment two as;
where gi is the number of germinated seeds in count i and ti is the time in days to count i since the beginning of the experiment. For experiment one, we defined a germination section as the time interval between counts, and we estimated the mean germination section (MGS) using a modified Timson Index (Tmod) [118];
where gi is the number of germinated seeds in count i, k is the total number of germination counts (k = 6), and h = i−1. The MGS brings an idea of mean germination time when the incubation of germination includes condition changes. The UG measured the spreading of germination which was used to infer the synchronicity of germination. It was estimated following Marques et al. [54] as;
where gi is the number of germinated seeds in count i, k is the total number of germination counts.
Using the mean FGP obtained at each treatment level of both experiments, we estimated variables that can account for the overall germination performance of each genotype and harvest time. The germination ability (GA) was calculated as the summation of all FGP obtained through the treatment levels of both experiments (maximum GA = 11). The germination evenness (GE) across treatments was calculated using a modified Levin’s index, following Finch et al. [53], as;
where R is the total number of treatment levels (j) of both experiments (R = 3 and R = 8 for experiments one and two, respectively. Total R = 11) and pj is the proportion of germinated seeds of level j in a base of all germinated seeds (pj = FGPj/GA). Both GA and GE can be used as germination niche breadth and seed dormancy estimators.
4.6. Germination Data Analysis
Variance analysis for the germination variables was conducted using mixed-effect models to find significant differences among species and treatments. The analysis was performed with the lmer function from the ‘lme4’ package [119]. Harvest time and genotype-by-species interaction were assumed as random effects. Species and germination treatments were the fixed effects. The FGP and GE data were logit transformed before the analysis to meet normal distribution. For GA and GE, the treatment effect was omitted from the models. Adjusted means for all fixed effects were calculated, and pairwise comparisons among factor levels were made with Tukey’s test (α = 0.05).
A principal component analysis (PCA) was carried out to study germination data dispersion using the FGP, MGT (or MGS), and UG obtained in each treatment level of both experiments as quantitative variables for each genotype and harvest time. Species and genotypes were considered categorical supplementary variables. The germination variables have different scales, so the data were normalized. The PCA was performed with the PCA function of the ‘FactoMineR’ package [120].
To assess the relative importance of within and among species variance, the variance partitioning was estimated for the germination variables by mixed effect models with harvest time, species, and genotype-by-species as random effects. The significance of random effects was assessed by the likelihood ratio test.
4.7. Regressions between Germination and Environmental Variables
Partial least square regressions (PLSR) were conducted to find relationships between germination and environment variables. We used the mean values of germination variables of each genotype (responses) and the mean values of each climatic and topographic variable inside the hexagon where each genotype is located (predictors). The PLSR was carried out with the plsr function of the ‘pls’ package [121]. The leave-one-out cross-validation process was used to retain an adequate number of components for each PLSR. For each germination variable, two PLSR were conducted. All variables were used as predictors in the first one, and the variables with importance in projection higher than one (VIP > 1) in the first PLSR were used in the second. The VIP of each variable was estimated with VIP function of ‘plsVarSel’ package [122]. Then, linear regressions were tested for each germination variable using the environmental variables with VIP > 1 after the last PLSR as the predictor.
5. Conclusions
We analysed and compared distribution models and regeneration traits in one phylogenetically well-understood group of closely-related species from a region where biogeographical studies are scarce. Each methodological approach brought different and complementary insights. While the SDMs yielded the favourable area of each species, highlighting the main drivers of the distributions, the differences among species in germination traits provided a likely physiological explanation for the geographical pattern of each species and the whole group. The divergence in seed dormancy observed among P. flavescens, P. plurinerve, and P. vacarianum may be a key factor in explaining why these more closely-related species retain restricted and allopatric distributions. This divergence gives each of these species a competitive advantage in the regeneration niche in their location over the other specialist sexual Dilatata species.
Author Contributions
Conceptualization, N.G. and P.R.S.; methodology, N.G., D.R. and J.C.G.; software, N.G., D.R. and J.C.G.; validation, N.G., D.R., V.R., J.C.G. and P.R.S.; formal analysis, N.G. and J.C.G.; investigation, N.G., D.R., V.R. and J.C.G.; resources, N.G., D.R., V.R. and J.C.G.; data curation, N.G., D.R., V.R. and J.C.G.; writing—original draft preparation, N.G.; writing—review and editing, N.G., D.R., V.R., J.C.G. and P.R.S.; visualization, N.G., D.R. and J.C.G.; supervision, J.C.G. and P.R.S.; project administration, N.G. and P.R.S.; funding acquisition, P.R.S. All authors have read and agreed to the published version of the manuscript.
Funding
This research was funded by Comisión Sectorial de Investigación Científica, Uruguay (CSIC-Grupos I+D 2014, project code: 8725).
Data Availability Statement
The data presented in this study are openly available in Zenodo. DOI: 10.5281/zenodo.7472847.
Acknowledgments
We thank the curators and staff of BAA, BLA, CEN, CNPO, CTES, ICN, LE, LIL, LP, MNES, MVFA, MVM, P, and SI for making their plant collections and/or HD photographs available. We appreciate the help of Yolanda Fernández, Matías Antuoni, Sofía Acosta Nabune and Guillermo Rodríguez in common garden experiment installation, seed harvest and germination assays. We thank the Programa de Desarrollo de las Ciencias Básicas (PEDECIBA) and the Sistema Nacional de Investigadores (SNI) of the Agencia Nacional de Investigación e Innovación (ANII), Uruguay.
Conflicts of Interest
The authors declare no conflict of interest.
Appendix A
Table A1.
List of environmental and geographical variables, and factors belong to, used for SDM modelling.
Table A1.
List of environmental and geographical variables, and factors belong to, used for SDM modelling.
| Factor | Variable | Variable Description | Factor | Variable | Variable Description |
|---|---|---|---|---|---|
| Spatial | Ysp | Spatial logit (linear polynomial combination of Latitude (°S) and Longitude (°W) from the spatial logistic regression) (1) | Climatic | Bio10 | Mean annual temperatures in the warmest quarter (3) |
| Topography | Alt | Average altitude (m) (2) | Bio11 | Mean annual temperatures of the coldest quarter (°C) (3) | |
| Slope | Calculated from altitude (°) | Bio12 | Annual precipitation (mm) (3) | ||
| Ori-NS | Orientation; degrees of exposure North-South (calculated from slope) | Bio13 | Precipitation of the wettest month (mm) (3) | ||
| Ori-EW | Orientation; degrees of exposure East-West (calculated from slope) | Bio14 | Precipitation in the driest month (mm) (3) | ||
| Rough | Roughness (m) (calculated from altitude) | Bio15 | Seasonal precipitation (mm) (3) | ||
| TRI | Terrain Ruggedness Index (calculated from altitude) | Bio16 | Precipitation in the wettest quarter (mm) (3) | ||
| TPI | Topographic Position Index (calculated from altitude) | Bio17 | Precipitation in dry quarter (3) | ||
| Climatic | Bio1 | Average annual temperature (°C) (3) | Bio18 | Precipitation in the warmest quarter (3) | |
| Bio2 | Mean diurnal range temperatures (°C) (3) | Bio19 | Precipitation in coldest quarter (3) | ||
| Bio3 | Isothermality (Bio2/Bio17 × 100) (°C) (3) | ETP-Seas | Monthly variability in potential evapotranspiration (4) | ||
| Bio4 | Seasonal temperatures (°C) (3) | ETP-An | Annual potential evapotranspiration (4) | ||
| Bio5 | Maximum temperatures in the warmest month (°C) (3) | ClimMoist | Climatic Moisture Index (4) | ||
| Bio6 | Minimum temperatures in the coldest month (°C) (3) | GDD0 | Sum of mean monthly temperature for months with mean temperature greater than 0 °C multiplied by number of days (4) | ||
| Bio7 | Annual temperature range (Bio5-Bio6) (3) | GDD5 | Sum of mean monthly temperature for months with mean temperature greater than 5 °C multiplied by number of days (4) | ||
| Bio8 | Mean annual temperatures of the wettest quarter (3) | Hydrology | SumRiver | Summation of Rivers (km) (5) | |
| Bio9 | Mean annual temperatures in the dry quarter (3) | SumBigRiv | Summation of Big Rivers (km) (6) | ||
| Hydrology | DistRiver | Minimum distance to Rivers (km) (5) | Global Land Cover | Snow | Snow (%) (7) |
| DistBigRiv | Minimum distance to Big Rivers (km) (6) | Bare | Bare (%) (7) | ||
| Global Land Cover | Crops | Crops (%) (7) | WaterPerm | Water permanent (%) (7) | |
| Grass | Grass (%) (7) | WaterSeas | Water seasonality (%) (7) | ||
| Moss | Moss (%) (7) | Human activities | PopDen | Population density (8) | |
| Shrub | Shrub (%) (7) | DistRoad | Distance to roads (km) (8) | ||
| Tree | Tree (%) (7) | DistUrban | Distance to the main urban centers (km) (8) | ||
| Urban | Urban (%) (7) | SumRoads | Length of roads (m) (8) |
(1) Spatial variables, latitude and longitude, were generated from the QGIS program according to the vector geometry tools: (a) with “centroids of polygons”, the centroid of each cell was calculated, and (b) with “Export/Add columns of geometry”, the values of length and latitude expressed in the 1984 World Geodetic System (WGS84) were allocated to each centroid, www.qgis.org (accessed on 15 April 2020). (2) Global multi-resolution terrain elevation data 2010 (GMTED2010) [123]. (3) Data from: Climatologies at high resolution for the earth’s land surface areas [124]. (4) Environmental Raster for Ecological Modelling, https://envirem.github.io/#varTable (accessed on 20 April 2020). (5) HydroShed. Hydrological data and maps based on SHuttle Elevation Derivatives at multiple Scales [125]. (6) Natural Earth Data [126]. (7) Land Cover 100m: Collection 3: epoch 2015: Globe (Version V3.0.1) [127]. (8) Gridded Population of the World (GPW), v11. Socioeconomic Data and Applications Center (SEDAC) [128].

Figure A1.
Global study area context. (a) South America in the global context. (b) An amplified map showing the resolution of the grid composed of hexagons of approximately 6 km of apothem.
Table A2.
Assessments of favourability models for the five species of Paspalum, according to discrimination and classification parameters. Abbreviations: AUC, area under the ROC (receiving operating characteristic) curve; CCR, correct classification rate; TSS, true skill statistic.
Table A2.
Assessments of favourability models for the five species of Paspalum, according to discrimination and classification parameters. Abbreviations: AUC, area under the ROC (receiving operating characteristic) curve; CCR, correct classification rate; TSS, true skill statistic.
| Evaluation Parameters | Favourability Models | ||||
|---|---|---|---|---|---|
| P. dasypleurum | P. flavescens | P. plurinerve | P. vacarianum | P. urvillei | |
| Discrimination | |||||
| AUC 1 | 0.997 | 0.998 | 0.998 | 0.999 | 0.954 |
| Classification | |||||
| Sensitivity | 0.975 | 0.977 | 1 | 1 | 0.93 |
| Specificity | 0.983 | 0.975 | 0.985 | 0.992 | 0.851 |
| CCR | 0.983 | 0.975 | 0.985 | 0.992 | 0.851 |
| TSS | 0.957 | 0.952 | 0.985 | 0.992 | 0.779 |
1: AUC > 0.9 is considered an outstanding discrimination capacity, according to Hosmer and Lemeshow [129].
Table A3.
Accessions, origin site description and location for each genotype used for germination assays.
Table A3.
Accessions, origin site description and location for each genotype used for germination assays.
| Species | Genotype | Accession | Origin Site Description | Latitude | Longitude |
|---|---|---|---|---|---|
| P. dasypleurum | D331 | 331 (Fagro) | Close to Valdivia, Los Rios, Chile | 39°49′15″ S | 73°12′14″ W |
| P. flavescens | F1S | 7218 (Fagro) | Close to Solís (Route 10 km 0.200), Maldonado, Uruguay | 34°47′34″ S | 55°23′3″ W |
| P. flavescens | F68 | 7434 (Fagro) | Close to Riachuelo (Route 1 to the coast), Colonia, Uruguay | 34°26′17″ S | 57°42′25″ W |
| P. flavescens | F79 | 7470 (Fagro) | Close to Villa Rodríguez (Route 11 km 65.500), San José, Uruguay | 34°23′28″ S | 56°32′56″ W |
| P. plurinerve | P1 | 7207 (Fagro) | Close to Gob. Valentín Virasoro, Corrientes, Argentina | 28°2′29″ S | 56°1′33″ W |
| P. plurinerve | P340 | 340 (Fagro) | Close to Garruchos, Santo Tomé, Corrientes, Argentina | 28°10′32″ S | 55°38′29″ W |
| P. vacarianum | V5 | PI 404372 (USDA) | Close to Agricultural Experiment Station, Vacaria, Rio Grande do Sul, Brazil | 28°30′60″ S | 50°54′29″ W |
| P. vacarianum | V7 | PI 508689 (USDA) | Along road to Lages, 27 km NW of Sao Joaquim, Santa Catarina, Brazil | 28°3′51″ S | 50°4′19″ W |
| P. urvillei | U21 | PI 509017 (USDA) | 32 km N of Villa Montes, Tarija, Bolivia | 21°14′52″ S | 63°27′33″ W |
| P. urvillei | U290 | 8617 (Fagro) | Close to El Lago (Route 5 km 279), Tacuarembó, Uruguay. | 32°20′35″ S | 56°15′2″ W |
| P. urvillei | U1S | 7199 (Fagro) | Close to Solís (Route 10 km 0.200), Maldonado, Uruguay | 34°47′34″ S | 55°23′3″ W |
Table A4.
Adjusted means for mean germination time (MGT), mean germination section (MGS) and uncertainty of germination (UG) for each level of treatment and species within each experiment. (a) Experiment one, stratification treatments: seed without stratification (CRTL), cold stratification (CS), and warm stratification (WS). (b) Experiment two, alternating temperatures and nitrate addition. Results from 10/20 °C from Experiment two were omitted because several species showed nil germination.
| (a) Variable | Treatment | P. dasypleurum | P. flavescens | P. plurinerve | P. vacarianum | P. urvillei | ||||||||||
|---|---|---|---|---|---|---|---|---|---|---|---|---|---|---|---|---|
| MGS | CTRL | 4.1 | a | A | 4.0 | a | A | 4.0 | a | A | 4.1 | a | A | 3.7 | a | A |
| CS | 1.3 | b | A | 0.8 | b | A | 0.9 | b | A | 1.6 | b | A | 0.6 | b | A | |
| WS | 1.8 | b | A | 0.8 | b | A | 1.3 | b | A | 1.3 | b | A | 0.4 | b | A | |
| UG | CTRL | 0.14 | a | A | 0.43 | b | A | 0.85 | a | A | 1.06 | b | A | 0.77 | ab | A |
| CS | 0.70 | a | A | 1.33 | a | A | 1.19 | a | A | 1.93 | a | A | 1.00 | a | A | |
| WS | 0.39 | a | A | 0.73 | b | A | 1.22 | a | A | 1.39 | b | A | 0.57 | b | A | |
| (b) Variable | Treatment | P. dasypleurum | P. flavescens | P. plurinerve | P. vacarianum | P. urvillei | ||||||||||
| MGT | 15/25 °C water | 11.8 | a | AB | 11.1 | a | B | 16.0 | a | A | 12.2 | a | AB | 9.3 | a | B |
| 20/30 °C water | 12.2 | a | A | 6.3 | b | B | 7.0 | b | AB | 7.9 | ab | AB | 7.2 | a | AB | |
| 25/35 °C water | 8.2 | a | A | 6.8 | b | A | 7.2 | b | A | 7.5 | b | A | 7.0 | a | A | |
| 15/25 °C nitrate | 8.1 | a | AB | 12.8 | a | A | 10.9 | a | AB | 14.0 | a | A | 6.8 | a | B | |
| 20/30 °C nitrate | 11.6 | a | A | 6.6 | b | AB | 5.2 | b | B | 6.7 | b | AB | 5.0 | a | B | |
| 25/35 °C nitrate | 10.4 | a | A | 5.9 | b | A | 5.1 | b | A | 5.9 | b | A | 5.0 | a | A | |
| UG | 15/25 °C water | 0.82 | a | AB | 0.30 | b | B | 1.56 | a | A | 0.71 | b | B | 1.76 | a | A |
| 20/30 °C water | 1.20 | a | A | 1.30 | a | A | 1.74 | a | A | 1.59 | a | A | 1.80 | a | A | |
| 25/35 °C water | 1.07 | a | A | 1.48 | a | A | 1.86 | a | A | 1.70 | a | A | 1.72 | a | A | |
| 15/25 °C nitrate | 0.26 | b | B | 0.84 | a | B | 1.96 | a | A | 1.29 | a | AB | 1.12 | a | B | |
| 20/30 °C nitrate | 1.52 | a | A | 1.27 | a | A | 0.74 | b | AB | 1.11 | a | AB | 0.55 | b | B | |
| 25/35 °C nitrate | 1.60 | a | A | 1.11 | a | AB | 0.77 | b | AB | 1.07 | a | AB | 0.65 | ab | B | |
(a) Lowercase letters indicate differences among stratification treatments within each species. Uppercase letters indicate differences among species within each stratification treatment (p < 0.05). (b) Lowercase letters indicate differences among temperature regimes within each species and nitrate addition combination. Uppercase letters indicate differences among species within each temperature regime and nitrate addition combination. Bold numbers indicate differences between distilled water and nitrate addition within each temperature regime and species combinations (p < 0.05).

Figure A2.
Principal component analysis using germination results (FGP, MGT or MGS and UG) of each treatment level of both germination experiments. (a) Each point is a genotype-by-harvest time score. Different colours identified species (see label). Also, the species mean score (squares) and the 95% confidence ellipses are shown. (b) Germination variables biplot, where the germination variables with cos2 > 0.4 are shown. Labels for germination variables are constructed with the name of the variable (FGP = final germination proportion, MGT = mean germination time, and UG = uncertainty of germination) followed by the treatment level in brackets. For experiment one, CTRL = seeds without stratification, CS = with cold stratification, WS = with warm stratification. For experiment two, the alternating temperature regime is represented with the higher temperature of the cycle (20, 25, 30 and 35), and N or W identifies germination with nitrate solution or distilled water, respectively.
Table A5.
Variance partitioning within and among species and among harvest times for first principal component (PC1) scores from PCA (see Figure A2), germination ability (GA), and germination evenness (GE). Paspalum dasypleurum was excluded from the analysis because of the absence of a genotype replica for this species.
| Germination Variable | Variance Partitioning (% Total Variance Sum) | ||||||
|---|---|---|---|---|---|---|---|
| Genotype/Species | Species | Harvest Time | Residual | ||||
| PC1 scores from PCA | 16.4 | *** | 76.1 | * | 0.2 | 7.3 | |
| Germination ability (GA) | 16.1 | *** | 74.5 | * | 1.0 | 8.4 | |
| Germination evenness (GE) | 16.9 | *** | 71.5 | * | 2.8 | 8.8 | |
Asterisks denote that a factor is significant within each variable (p value = *** < 0.001; * < 0.05).

Figure A3.
Biplots of PLSR for three germination variables showing the association between genotypes (normal font) and climatic variables graphically (in italics). Genotypes of P. urvillei were not included in this PLSR optimization: (a) First principal component (PC1) scores from PCA, (b) germination ability (GA), and (c) germination evenness (GE). Colors identify the species: black = P. dasypleurum (D331), green = P. flavescens (F1S, F68, F79), blue = P. vacarianum (V5, V7), and orange = P. plurinerve (P1, P340). Southernmost distributed species are represented with circles and northernmost species with diamonds. Predictor (climatic) variables in a bold letter had importance in projections higher than one (VIP > 1). The references of climatic variables are in Table A1.
Table A6.
Linear regression adjustment (R2) between each germination variable (PC1, GA and GE) as response and environmental variables with importance in projection higher than one (VIP > 1) after optimizing PLSR as predictors. Results when P. urvillei genotypes are included (left) and when P. urvillei genotypes are not included (right) are shown. High adjustments (R2 ≥ 0.80) were highlighted with bold letters.
| Germination Variable (y) | With P. urvillei Genotypes | Without P. urvillei Genotypes | ||
|---|---|---|---|---|
| Environmental Variable (x) | R2 | Environmental Variable (x) | R2 | |
| First principal component (PC1) scores | Bio1 * | 0.38 | Bio2 * | 0.55 |
| Bio2 ns | 0.26 | Bio11 ** | 0.69 | |
| Bio5 * | 0.34 | Bio14 *** | 0.87 | |
| Bio11 * | 0.37 | Bio17 *** | 0.88 | |
| ETP_An ** | 0.50 | Bio18 ** | 0.83 | |
| ClimMoistu * | 0.31 | ETP_An ** | 0.68 | |
| GDD0 * | 0.40 | |||
| OriNS * | 0.32 | |||
| Germination ability (GA) | Bio1 * | 0.38 | Bio11 * | 0.59 |
| Bio2 ns | 0.26 | Bio14 *** | 0.94 | |
| Bio11 * | 0.36 | Bio17 *** | 0.95 | |
| ETP_An * | 0.49 | Bio18 ** | 0.80 | |
| GDD0 * | 0.39 | ETP_An * | 0.58 | |
| OriNS * | 0.34 | |||
| Germination evenness (GE) | Bio1 * | 0.34 | Bio2 ** | 0.59 |
| Bio2 ns | 0.25 | Bio11 *** | 0.67 | |
| Bio11 * | 0.33 | Bio14 *** | 0.93 | |
| ETP_An * | 0.46 | Bio17 *** | 0.93 | |
| GDD0 * | 0.35 | Bio18 ** | 0.74 | |
| ETP_An ** | 0.67 | |||
Asterisks near variable names denote regression significance (p value = *** < 0.001; ** < 0.01; * < 0.05), “ns” means that the linear regression was not significant.
References
- Oyarzabal, M.; Andrade, B.; Pillar, V.D.; Paruelo, J. Temperate Subhumid Grasslands of Southern South America. In Encyclopedia of the World’s Biomes; Goldstein, M.I., DellaSala, D.A., Eds.; Section 6; Elsevier Inc.: Amsterdam, The Netherlands, 2020; Volume 3, pp. 577–593. ISBN 9780128160978. [Google Scholar]
- Speranza, P.R.; Seijo, J.G.; Grela, I.A.; Solís Neffa, V.G. Chloroplast DNA Variation in the Turnera sidoides L. Complex (Turneraceae): Biogeographical Implications. J. Biogeogr. 2007, 34, 427–436. [Google Scholar] [CrossRef]
- Turchetto, C.; Fagundes, N.J.R.; Segatto, A.L.A.; Kuhlemeier, C.; Solís Neffa, V.G.; Speranza, P.R.; Bonatto, S.L.; Freitas, L.B. Diversification in the South American Pampas: The Genetic and Morphological Variation of the Widespread Petunia axillaris Complex (Solanaceae). Mol. Ecol. 2014, 23, 374–389. [Google Scholar] [CrossRef]
- Turchetto-Zolet, A.C.; Salgueiro, F.; Turchetto, C.; Cruz, F.; Veto, N.M.; Barros, M.J.F.; Segatto, A.L.A.; Freitas, L.B.; Margis, R. Phylogeography and Ecological Niche Modelling in Eugenia uniflora (Myrtaceae) Suggest Distinct Vegetational Responses to Climate Change between the Southern and the Northern Atlantic Forest. Bot. J. Linn. Soc. 2016, 182, 670–688. [Google Scholar] [CrossRef]
- Vaio, M.; Gardner, A.; Speranza, P.R.; Emshwiller, E.; Guerra, M. Phylogenetic and Cytogenetic Relationships among Species of Oxalis Section Articulatae (Oxalidaceae). Plant Syst. Evol. 2016, 302, 1253–1265. [Google Scholar] [CrossRef]
- Moreno, E.M.S.; De Freitas, L.B.; Speranza, P.R.; Solís Neffa, V.G. Impact of Pleistocene Geoclimatic Events on the Genetic Structure in Mid-Latitude South American Plants: Insights from the Phylogeography of Turnera sidoides Complex (Passifloraceae, Turneroideae). Bot. J. Linn. Soc. 2018, 188, 377–390. [Google Scholar] [CrossRef]
- Baeza, S.; Paruelo, J.M. Spatial and Temporal Variation of Human Appropriation of Net Primary Production in the Rio de La Plata Grasslands. ISPRS J. Photogramm. Remote Sens. 2018, 145, 238–249. [Google Scholar] [CrossRef]
- Overbeck, G.E.; Müller, S.C.; Fidelis, A.; Pfadenhauer, J.; Pillar, V.D.; Blanco, C.C.; Boldrini, I.I.; Both, R.; Forneck, E.D. Brazil’s Neglected Biome: The South Brazilian Campos. Perspect. Plant Ecol. Evol. Syst. 2007, 9, 101–116. [Google Scholar] [CrossRef]
- Zuloaga, F.O.; Morrone, O. Revisión de las Especies de Paspalum Para América del Sur Austral (Argentina, Bolivia, Sur Del Brasil, Chile, Paraguay, y Uruguay); Missouri Botanical Garden: Saint Louis, MO, USA, 2005; Volume 102, p. 297. [Google Scholar]
- Percival, N.S.; Couchman, J.N. Evaluation of Paspalum (Paspalum dilatatum Poir.) Selections. I. Variation among Populations. New Zeal. J. Agric. Res. 1979, 7, 59–64. [Google Scholar]
- Venuto, B.C.; Burson, B.L.; Hussey, M.A.; Redfearn, D.D.; Wyatt, W.E.; Brown, L.P. Forage Yield, Nutritive Value, and Grazing Tolerance of Dallisgrass Biotypes. Crop. Sci. 2003, 43, 295–301. [Google Scholar] [CrossRef]
- Rosso, V.C.; Valls, J.F.M.; Quarin, C.L.; Speranza, P.R.; Rua, G.H. New Entities of Paspalum and a Synopsis of the Group Dilatata. Syst. Bot. 2022, 47, 125–139. [Google Scholar] [CrossRef]
- Speranza, P.R. The Challenges of the Exploration of Genetic Resources in Apomictic Plants: Lessons from Paspalum dilatatum. Agrociencia 2005, 9, 73–76. [Google Scholar]
- Vaio, M.; Mazzella, C.; Guerra, M.; Speranza, P.R. Effects of the Diploidisation Process upon the 5S and 35S RDNA Sequences in the Allopolyploid Species of the Dilatata Group of Paspalum (Poaceae, Paniceae). Aust. J. Bot. 2019, 67, 521–530. [Google Scholar] [CrossRef]
- Speranza, P.R.; Malosetti, M. Nuclear and Cytoplasmic Microsatellite Markers for the Species of the Dilatata Group of Paspalum (Poaceae). Plant Genet. Resour. 2007, 5, 14–26. [Google Scholar] [CrossRef]
- Sandro, P.; Gutiérrez, L.; Speranza, P.R. Distribution of Genetic and Phenotypic Diversity in the Autogamous Perennial Paspalum dilatatum subsp. flavescens Roseng., Arrill. & Izag. (Poaceae). Genet. Resour. Crop. Evol. 2019, 66, 1205–1216. [Google Scholar] [CrossRef]
- Speranza, P.R. Evolutionary Patterns in the Dilatata Group (Paspalum, Poaceae). Plant Syst. Evol. 2009, 282, 43–56. [Google Scholar] [CrossRef]
- Sawasato, J.T.; Dall’Agnol, M.; da Conceição, D.P.; Tafernaberri, V.J.; Klafke, G.B. Genetic Diversity among Accesses of Paspalum urvillei Steudel Estimated by Microssatelites and RAPD Markers. Rev. Bras. Zootec. 2008, 37, 1366–1374. [Google Scholar] [CrossRef]
- Futuyma, D.; Moreno, G. The Evolution of Ecological Specialization. Annu. Rev. Ecol. Syst. 1988, 19, 207–233. [Google Scholar] [CrossRef]
- Cornaglia, P.S.; Schrauf, G.E.; Deregibus, V.A. Flooding and Grazing Promote Germination and Seedling Establishment in the Perennial Grass Paspalum dilatatum . Austral Ecol. 2009, 34, 343–350. [Google Scholar] [CrossRef]
- Legendre, P. Spatial Autocorrelation: Trouble or New Paradigm? Ecology 1993, 74, 1659–1673. [Google Scholar] [CrossRef]
- Guisan, A.; Zimmermann, N.E. Predictive Habitat Distribution Models in Ecology. Ecol. Modell. 2000, 135, 147–186. [Google Scholar] [CrossRef]
- Real, R.; Barbosa, A.M.; Porras, D.; Kin, M.S.; Márquez, A.L.; Guerrero, J.C.; Palomo, L.J.; Justo, E.R.; Vargas, J.M. Relative Importance of Environment, Human Activity and Spatial Situation in Determining the Distribution of Terrestrial Mammal Diversity in Argentina. J. Biogeogr. 2003, 30, 939–947. [Google Scholar] [CrossRef]
- Soberon, J.; Peterson, A.T. Interpretation of Models of Fundamental Ecological Niches and Species’ Distributional Areas. Biodivers. Inform. 2005, 2, 1–10. [Google Scholar] [CrossRef]
- Nakazato, T.; Warren, D.L.; Moyle, L.C. Ecological and Geographic Modes of Species Divergence in Wild Tomatoes. Am. J. Bot. 2010, 97, 680–693. [Google Scholar] [CrossRef]
- Fyllas, N.M.; Koufaki, T.; Sazeides, C.I.; Spyroglou, G.; Theodorou, K. Potential Impacts of Climate Change on the Habitat Suitability of the Dominant Tree Species in Greece. Plants 2022, 11, 1616. [Google Scholar] [CrossRef]
- Hernandez, P.A.; Graham, C.H.; Master, L.L.; Albert, D.L. The Effect of Sample Size and Species Characteristics on Performance of Different Species Distribution Modeling Methods. Ecography 2006, 29, 773–785. [Google Scholar] [CrossRef]
- Evangelista, P.H.; Kumar, S.; Stohlgren, T.J.; Jarnevich, C.S.; Crall, A.W.; Norman, J.B.; Barnett, D.T. Modelling Invasion for a Habitat Generalist and a Specialist Plant Species. Divers. Distrib. 2008, 14, 808–817. [Google Scholar] [CrossRef]
- Guisan, A.; Thuiller, W. Predicting Species Distribution: Offering More than Simple Habitat Models. Ecol. Lett. 2005, 8, 993–1009. [Google Scholar] [CrossRef]
- Sillero, N.; Arenas-Castro, S.; Enriquez-Urzelai, U.; Vale, C.G.; Sousa-Guedes, D.; Martínez-Freiría, F.; Real, R.; Barbosa, A.M. Want to Model a Species Niche? A Step-by-Step Guideline on Correlative Ecological Niche Modelling. Ecol. Modell. 2021, 456, 109671. [Google Scholar] [CrossRef]
- Real, R.; Barbosa, A.M.; Vargas, J.M. Obtaining Environmental Favourability Functions from Logistic Regression. Environ. Ecol. Stat. 2006, 13, 237–245. [Google Scholar] [CrossRef]
- Acevedo, P.; Real, R. Favourability: Concept, Distinctive Characteristics and Potential Usefulness. Naturwissenschaften 2012, 99, 515–522. [Google Scholar] [CrossRef]
- Romo, H.; García-Barros, E.; Márquez, A.L.; Moreno, J.C.; Real, R. Effects of Climate Change on the Distribution of Ecologically Interacting Species: Butterflies and Their Main Food Plants in Spain. Ecography 2014, 37, 1063–1072. [Google Scholar] [CrossRef]
- Romero, D.; Sosa, B.; Brazeiro, A.; Achkar, M.; Guerrero, J.C. Factors Involved in the Biogeography of the Honey Locust Tree (Gleditsia triacanthos) Invasion at Regional Scale: An Integrative Approach. Plant Ecol. 2021, 222, 705–722. [Google Scholar] [CrossRef]
- Kearney, M.; Simpson, S.J.; Raubenheimer, D.; Helmuth, B. Modelling the Ecological Niche from Functional Traits. Philos. Trans. R. Soc. B Biol. Sci. 2010, 365, 3469–3483. [Google Scholar] [CrossRef] [PubMed]
- Pearson, R.G.; Dawson, T.P. Predicting the Impacts of Climate Change on the Distribution of Species: Are Bioclimate Envelope Models Useful? Glob. Ecol. Biogeogr. 2003, 12, 361–371. [Google Scholar] [CrossRef]
- Kearney, M.; Porter, W. Mechanistic Niche Modelling: Combining Physiological and Spatial Data to Predict Species’ Ranges. Ecol. Lett. 2009, 12, 334–350. [Google Scholar] [CrossRef]
- Violle, C.; Jiang, L. Towards a Trait-Based Quantification of Species Niche. J. Plant Ecol. 2009, 2, 87–93. [Google Scholar] [CrossRef]
- Violle, C.; Navas, M.-L.; Vile, D.; Kazakou, E.; Fortunel, C.; Hummel, I.; Garnier, E. Let the Concept of Trait Be Functional! Oikos 2007, 116, 882–892. [Google Scholar] [CrossRef]
- Larson, J.E.; Funk, J.L. Regeneration: An Overlooked Aspect of Trait-Based Plant Community Assembly Models. J. Ecol. 2016, 104, 1284–1298. [Google Scholar] [CrossRef]
- Hoyle, G.L.; Steadman, K.J.; Good, R.B.; McIntosh, E.J.; Galea, L.M.E.; Nicotra, A.B. Seed Germination Strategies: An Evolutionary Trajectory Independent of Vegetative Functional Traits. Front. Plant Sci. 2015, 6, 731. [Google Scholar] [CrossRef]
- Saatkamp, A.; Cochrane, A.; Commander, L.; Guja, L.K.; Jimenez-Alfaro, B.; Larson, J.; Nicotra, A.; Poschlod, P.; Silveira, F.A.O.; Cross, A.T.; et al. A Research Agenda for Seed-trait Functional Ecology. New Phytol. 2019, 221, 1764–1775. [Google Scholar] [CrossRef]
- Grubb, P.J. The Maintenance of Species-Richness in Plant Communities: The Importance of the Regeneration Niche. Biol. Rev. 1977, 52, 107–145. [Google Scholar] [CrossRef]
- Guerra-Coss, F.A.; Badano, E.I.; Cedillo-Rodríguez, I.E.; Ramírez-Albores, J.E.; Flores, J.; Barragán-Torres, F.; Flores-Cano, J.A. Modelling and Validation of the Spatial Distribution of Suitable Habitats for the Recruitment of Invasive Plants on Climate Change Scenarios: An Approach from the Regeneration Niche. Sci. Total Environ. 2021, 777, 146007. [Google Scholar] [CrossRef]
- Bykova, O.; Chuine, I.; Morin, X.; Higgins, S.I. Temperature Dependence of the Reproduction Niche and Its Relevance for Plant Species Distributions. J. Biogeogr. 2012, 39, 2191–2200. [Google Scholar] [CrossRef]
- Wagmann, K.; Hautekèete, N.-C.; Piquot, Y.; Meunier, C.; Schmitt, S.E.; Van Dijk, H. Seed Dormancy Distribution: Explanatory Ecological Factors. Ann. Bot. 2012, 110, 1205–1219. [Google Scholar] [CrossRef]
- Sales, N.M.; Pérez-García, F.; Silveira, F.A.O. Consistent Variation in Seed Germination across an Environmental Gradient in a Neotropical Savanna. South African J. Bot. 2013, 87, 129–133. [Google Scholar] [CrossRef]
- Rosbakh, S.; Poschlod, P. Initial Temperature of Seed Germination as Related to Species Occurrence along a Temperature Gradient. Funct. Ecol. 2015, 29, 5–14. [Google Scholar] [CrossRef]
- Ranieri, B.D.; Pezzini, F.F.; Garcia, Q.S.; Chautems, A.; França, M.G.C. Testing the Regeneration Niche Hypothesis with Gesneriaceae (Tribe Sinningiae) in Brazil: Implications for the Conservation of Rare Species. Austral Ecol. 2012, 37, 125–133. [Google Scholar] [CrossRef]
- Jiménez-Alfaro, B.; Silveira, F.A.O.; Fidelis, A.; Poschlod, P.; Commander, L.E. Seed Germination Traits Can Contribute Better to Plant Community Ecology. J. Veg. Sci. 2016, 27, 637–645. [Google Scholar] [CrossRef]
- Benech-Arnold, R.L.; Sánchez, R.A.; Forcella, F.; Kruk, B.C.; Ghersa, C.M. Environmental Control of Dormancy in Weed Seed Banks in Soil. F. Crop. Res. 2000, 67, 105–122. [Google Scholar] [CrossRef]
- Baskin, C.C.; Thompson, K.; Baskin, J.M. Mistakes in Germination Ecology and How to Avoid Them. Seed Sci. Res. 2006, 16, 165–168. [Google Scholar] [CrossRef]
- Finch, J.; Walck, J.L.; Hidayati, S.N.; Kramer, A.T.; Lason, V.; Havens, K. Germination Niche Breadth Varies Inconsistently among Three Asclepias Congeners along a Latitudinal Gradient. Plant Biol. 2019, 21, 425–438. [Google Scholar] [CrossRef] [PubMed]
- Marques, A.R.; Atman, A.P.F.; Silveira, F.A.O.; de Lemos-Filho, J.P. Are Seed Germination and Ecological Breadth Associated? Testing the Regeneration Niche Hypothesis with Bromeliads in a Heterogeneous Neotropical Montane Vegetation. Plant Ecol. 2014, 215, 517–529. [Google Scholar] [CrossRef]
- Fernández-Pascual, E.; Pérez-Arcoiza, A.; Prieto, J.A.; Díaz, T.E. Environmental Filtering Drives the Shape and Breadth of the Seed Germination Niche in Coastal Plant Communities. Ann. Bot. 2017, 119, 1169–1177. [Google Scholar] [CrossRef] [PubMed]
- Willis, C.G.; Baskin, C.C.; Baskin, J.M.; Auld, J.R.; Venable, D.L.; Cavender-Bares, J.; Donohue, K.; Rubio de Casas, R. The Evolution of Seed Dormancy: Environmental Cues, Evolutionary Hubs, and Diversification of the Seed Plants. New Phytol. 2014, 203, 300–309. [Google Scholar] [CrossRef] [PubMed]
- Dayrell, R.L.C.; Garcia, Q.S.; Negreiros, D.; Baskin, C.C.; Baskin, J.M.; Silveira, F.A.O. Phylogeny Strongly Drives Seed Dormancy and Quality in a Climatically Buffered Hotspot for Plant Endemism. Ann. Bot. 2016, 119, 267–277. [Google Scholar] [CrossRef]
- Arène, F.; Affre, L.; Doxa, A.; Saatkamp, A. Temperature but Not Moisture Response of Germination Shows Phylogenetic Constraints While Both Interact with Seed Mass and Lifespan. Seed Sci. Res. 2017, 27, 110–120. [Google Scholar] [CrossRef]
- Donohue, K.; Rubio de Casas, R.; Burghardt, L.; Kovach, K.; Willis, C.G. Germination, Postgermination Adaptation, and Species Ecological Ranges. Annu. Rev. Ecol. Evol. Syst. 2010, 41, 293–319. [Google Scholar] [CrossRef]
- Arana, M.V.; Gonzalez-Polo, M.; Martinez-Meier, A.; Gallo, L.A.; Benech-Arnold, R.L.; Sánchez, R.A.; Batlla, D. Seed Dormancy Responses to Temperature Relate to Nothofagus Species Distribution and Determine Temporal Patterns of Germination across Altitudes in Patagonia. New Phytol. 2016, 209, 507–520. [Google Scholar] [CrossRef]
- Fernández-Pascual, E.; Jiménez-Alfaro, B.; Caujapé-Castells, J.; Jaén-Molina, R.; Díaz, T.E. A Local Dormancy Cline Is Related to the Seed Maturation Environment, Population Genetic Composition and Climate. Ann. Bot. 2013, 112, 937–945. [Google Scholar] [CrossRef]
- Campbell, B.D.; Mitchell, N.D.; Field, T.R.O. Climate Profiles of Temperate C3 and Subtropical C4 Species in New Zealand Pastures. New Zeal. J. Agric. Res. 1999, 42, 223–233. [Google Scholar] [CrossRef]
- Mollard, F.P.O.; Striker, G.G.; Ploschuk, E.L.; Insausti, P. Subtle Topographical Differences along a Floodplain Promote Different Plant Strategies among Paspalum dilatatum Subspecies and Populations. Austral Ecol. 2010, 35, 189–196. [Google Scholar] [CrossRef]
- Cruz, P.; Lezana, L.; Durante, M.; Jaurena, M.; Figari, M.; Bittencourt, L.; Theau, J.-P.; Massa, E.; Viegas, J.; Ferreira de Quadros, F.L. A Functional Classification of 63 Common Poaceae in the “Campos” Grasslands of South America. Ecol. Austral 2019, 29, 239–248. [Google Scholar] [CrossRef]
- Ferreira, J.L.; Gwinner, R.; Ferreira, L.M.; Ferronato, J.; Leite, L.G.; Ferreira, K.G.G.; Silva, J.C.R.L.; dos Santos, L.P.; Silva, A.W.T. Understanding the Extent of Phenotypic Variability in Accessions of Paspalum urvillei Steud. From the USDA NPGS. Iheringia. Ser. Bot. 2020, 75, e2020006. [Google Scholar] [CrossRef]
- Rua, G.H.; Gróttola, M.C. Growth Form Models within the Genus Paspalum L. (Poaceae, Paniceae). Flora 1997, 192, 65–80. [Google Scholar] [CrossRef]
- Glison, N.; Viega, L.; Cornaglia, P.; Gutiérrez, L.; Speranza, P.R. Variability in Germination Behaviour of Paspalum dilatatum Poir. Seeds Is Genotype Dependent. Grass Forage Sci. 2015, 70, 144–153. [Google Scholar] [CrossRef]
- Glison, N.; Viega, L.; Speranza, P.R. Differential Incidence of the Lemma on Seed Germination among Different Paspalum dilatatum Genotypes. J. Seed Sci. 2017, 39, 133–141. [Google Scholar] [CrossRef]
- Souza-Chies, T.; Cavalli-Molina, S. Variability in Seed Production and Germination in Paspalum-Dilatata Group (Gramineae). Rev. Bras. Biol. 1995, 55, 127–139. [Google Scholar]
- Johnston, M.; Miller, J. Investigations into Techniques for the Germination of Paspalum dilatatum . Proc. Int. Seed Test. Assoc. 1964, 29, 145–148. [Google Scholar]
- Schrauf, G.E.; Cornaglia, P.S.; Deregibus, V.A.; Ríssola, M.G. Improvement in Germination Behaviour of Paspalum dilatatum Poir. Seeds under Different Pre-conditioning Treatments. New Zeal. J. Agric. Res. 1995, 38, 501–509. [Google Scholar] [CrossRef]
- Batlla, D.; Benech-Arnold, R.L. Predicting Changes in Dormancy Level in Natural Seed Soil Banks. Plant Mol. Biol. 2010, 73, 3–13. [Google Scholar] [CrossRef]
- Pons, T.L. Breaking of Seed Dormancy by Nitrate as a Gap Detection Mechanism. Ann. Bot. 1989, 63, 139–143. [Google Scholar] [CrossRef]
- Dirnböck, T.; Dullinger, S. Habitat Distribution Models, Spatial Autocorrelation, Functional Traits and Dispersal Capacity of Alpine Plant Species. J. Veg. Sci. 2004, 15, 77–84. [Google Scholar] [CrossRef]
- Ernst, W.H.O.; Veenendaal, E.M.; Kebakile, M.M. Possibilities for Dispersal in Annual and Perennial Grasses in a Savanna in Botswana. Vegetatio 1992, 102, 1–11. [Google Scholar] [CrossRef]
- Chen, S.; Poschlod, P.; Antonelli, A.; Liu, U.; Dickie, J.B. Trade-off between Seed Dispersal in Space and Time. Ecol. Lett. 2020, 23, 1635–1642. [Google Scholar] [CrossRef] [PubMed]
- Valls, J.F.M.; Boldrini, I.; Longhi-Wagner, H.M.; Miotto, S.T.S. O Patrimônio Florístico Dos Campos: Potencialidades de Uso e a Conservação de Seus Recursos Genéticos. In Campos Sulinos—Conservação e uso sustentável da biodiversidade; Pillar, V.P., Müller, S.C., Castilhos, Z.M.S., Jacques, A.V.A., Eds.; MMA: Brasilia, Brazil, 2009; pp. 141–156. [Google Scholar]
- Fenner, M.; Thompson, K. The Ecology of Seeds; CABI: Cambridge, UK, 2005; p. 432. ISBN 9780851994321. [Google Scholar]
- Duermeyer, L.; Khodapanahi, E.; Yan, D.; Krapp, A.; Rothstein, S.J.; Nambara, E. Regulation of Seed Dormancy and Germination by Nitrate. Seed Sci. Res. 2018, 28, 150–157. [Google Scholar] [CrossRef]
- Steyn, C.; Greve, M.; Robertson, M.P.; Kalwij, J.M.; le Roux, P.C. Alien Plant Species That Invade High Elevations Are Generalists: Support for the Directional Ecological Filtering Hypothesis. J. Veg. Sci. 2017, 28, 337–346. [Google Scholar] [CrossRef]
- Randall, R.P. A Global Compendium of Weeds, 2nd ed.; Department of Agriculture and Food Western Australia: Perth, Australia, 2012; p. 905. ISBN 9780646578781. [Google Scholar]
- Jeffries, M.D.; Gannon, T.W.; Yelverton, F.H. Herbicide Inputs and Mowing Affect Vaseygrass (Paspalum urvillei) Control. Weed Technol. 2017, 31, 120–129. [Google Scholar] [CrossRef]
- Brändle, M.; Stadler, J.; Klotz, S.; Brandl, R. Distributional Range Size of Weedy Plant Species Is Correlated to Germination Patterns. Ecology 2003, 84, 136–144. [Google Scholar] [CrossRef]
- Denelle, P.; Violle, C.; Munoz, F. DivGrass Consortium Generalist Plants Are More Competitive and More Functionally Similar to Each Other than Specialist Plants: Insights from Network Analyses. J. Biogeogr. 2020, 47, 1922–1933. [Google Scholar] [CrossRef]
- Debieu, M.; Tang, C.; Stich, B.; Sikosek, T.; Effgen, S.; Josephs, E.; Schmitt, J.; Nordborg, M.; Koornneef, M.; de Meaux, J. Co-Variation between Seed Dormancy, Growth Rate and Flowering Time Changes with Latitude in Arabidopsis thaliana . PLoS ONE 2013, 8, e61075. [Google Scholar] [CrossRef]
- Cochrane, A.; Yates, C.J.; Hoyle, G.L.; Nicotra, A.B. Will Among-Population Variation in Seed Traits Improve the Chance of Species Persistence under Climate Change? Glob. Ecol. Biogeogr. 2015, 24, 12–24. [Google Scholar] [CrossRef]
- Simons, A.M.; Johnston, M.O. Environmental and Genetic Sources of Diversification in the Timing of Seed Germination: Implications for the Evolution of Bet Hedging. Evolution 2006, 60, 2280–2292. [Google Scholar] [CrossRef] [PubMed]
- Masters, R.A.; Mislevy, P.; Moser, L.E.; Rivas-Pantoja, F. Stand Establishment. In Warm-season (C4) grasses; Moser, L.E., Burson, B.L., Sollenberger, L.E., Eds.; American Society of Agronomy: Madison, WI, USA, 2004; pp. 145–177. [Google Scholar]
- Glison, N.; Batlla, D.; González Barrios, P.; Viega, L.; Saldanha, S.; Musacchio, E.M.; Rush, P.; Speranza, P.R. Modelling Seedling Emergence in Paspalum Species Using Environmental Data from Field Experiments. Grass Forage Sci. 2021, 76, 363–377. [Google Scholar] [CrossRef]
- Jurado, E.; Flores, J. Is Seed Dormancy under Environmental Control or Bound to Plant Traits? J. Veg. Sci. 2005, 16, 559–564. [Google Scholar] [CrossRef]
- Ludewig, K.; Zelle, B.; Eckstein, R.L.; Mosner, E.; Otte, A.; Donath, T.W. Differential Effects of Reduced Water Potential on the Germination of Floodplain Grassland Species Indicative of Wet and Dry Habitats. Seed Sci. Res. 2014, 24, 49–61. [Google Scholar] [CrossRef]
- Fang, X.W.; Zhang, J.J.; Xu, D.H.; Pang, J.; Gao, T.P.; Zhang, C.H.; Li, F.M.; Turner, N.C. Seed Germination of Caragana Species from Different Regions Is Strongly Driven by Environmental Cues and Not Phylogenetic Signals. Sci. Rep. 2017, 7, 1–11. [Google Scholar] [CrossRef]
- Thiers, B. Index Herbariorum: A Global Directory of Public Herbaria and Associated Staff. Available online: http://sweetgum.nybg.org/ih/ (accessed on 2 March 2020).
- Acevedo de Vargas, R. Contribución al Conocimiento del Género Paspalum en Chile. Boletín Del Mus. Nac. Hist. Nat. 1944, 21, 121–134. [Google Scholar]
- Nicora, E.G. Gramineae. In Flora Patagónica; Correa, M.N., Ed.; Colección Científica del Instituto Nacional de Tecnología Agropecuaria: Buenos Aires, Argentina, 1978; Volume 3. [Google Scholar]
- Burson, B.L. Cytogenetics of Paspalum urvillei ✕ P. intermedium and P. dilatatum ✕ P. paniculatum Hybrids. Crop. Sci. 1979, 19, 534–538. [Google Scholar] [CrossRef]
- Burson, B.L. Cytology and Reproductive Behavior of Hybrids between Paspalum urvillei and Two Hexaploid P. dilatatum Biotypes. Genome 1992, 35, 1002–1006. [Google Scholar] [CrossRef]
- Birch, C.P.D.; Oom, S.P.; Beecham, J.A. Rectangular and Hexagonal Grids Used for Observation, Experiment and Simulation in Ecology. Ecol. Modell. 2007, 206, 347–359. [Google Scholar] [CrossRef]
- QGIS Development Team. QGIS Geographic Information System. Available online: https://qgis.org/es/site/ (accessed on 10 March 2020).
- Legendre, P.; Legendre, L.F.J. Numerical Ecology, 2nd ed.; Elsevier Science: Amsterdam, The Netherlands, 1998; p. 853. [Google Scholar]
- Barbosa, A.M.; Real, R.; Vargas, J.M. Use of Coarse-Resolution Models of Species’ Distributions to Guide Local Conservation Inferences. Conserv. Biol. 2010, 24, 1378–1387. [Google Scholar] [CrossRef] [PubMed]
- Coelho, L.; Romero, D.; Queirolo, D.; Guerrero, J.C. Understanding Factors Affecting the Distribution of the Maned Wolf (Chrysocyon brachyurus) in South America: Spatial Dynamics and Environmental Drivers. Mamm. Biol. 2018, 92, 54–61. [Google Scholar] [CrossRef]
- Romero, D.; Olivero, J.; Real, R.; Guerrero, J.C. Applying Fuzzy Logic to Assess the Biogeographical Risk of Dengue in South America. Parasit. Vectors 2019, 12, 428. [Google Scholar] [CrossRef] [PubMed]
- Chamorro, D.; Real, R.; Muñoz, A.-R. Fuzzy Sets Allow Gaging the Extent and Rate of Species Range Shift Due to Climate Change. Sci. Rep. 2020, 10, 16272. [Google Scholar] [CrossRef] [PubMed]
- Barbosa, A.M. FuzzySim: Applying Fuzzy Logic to Binary Similarity Indices in Ecology. Methods Ecol. Evol. 2015, 6, 853–858. [Google Scholar] [CrossRef]
- R Core Team. R: A Language and Environment for Statistical Computing. R Foundation for Statistical Computing, Vienna, Austria. Available online: https://www.r-project.org/ (accessed on 2 June 2020).
- Benjamini, Y.; Hochberg, Y. Controlling the False Discovery Rate: A Practical and Powerful Approach to Multiple Testing. J. R. Stat. Soc. Ser. B 1995, 57, 289–300. [Google Scholar] [CrossRef]
- Burnham, K.P.; Anderson, D.R. Model Selection and Multimodel Inference. A Practical Information-Theoretic Approach, 2nd ed.; Springer: New York, NY, USA, 2002; p. 488. ISBN 978-0-387-95364-9. [Google Scholar]
- Lumley, T. Analysis of Complex Survey Samples. J. Stat. Softw. 2004, 9, 1–19. [Google Scholar] [CrossRef]
- Montgomery, D.C.; Peck, E.A. Introduction to Linear Regression Analysis, 2nd ed.; Wiley-Interscience: New York, NY, USA, 1992; p. 544. ISBN 978-0471533870. [Google Scholar]
- Barbosa, M.A.; Real, R.; Muñoz, A.-R.; Brown, J.A. New Measures for Assessing Model Equilibrium and Prediction Mismatch in Species Distribution Models. Divers. Distrib. 2013, 19, 1333–1338. [Google Scholar] [CrossRef]
- Allouche, O.; Tsoar, A.; Kadmon, R. Assessing the Accuracy of Species Distribution Models: Prevalence, Kappa and the True Skill Statistic (TSS). J. Appl. Ecol. 2006, 43, 1223–1232. [Google Scholar] [CrossRef]
- Liu, C.; White, M.; Newell, G. Measuring and Comparing the Accuracy of Species Distribution Models with Presence-Absence Data. Ecography 2011, 34, 232–243. [Google Scholar] [CrossRef]
- Fielding, A.H.; Bell, J.F. A Review of Methods for the Assessment of Prediction Errors in Conservation Presence/Absence Models. Environ. Conserv. 1997, 24, 38–49. [Google Scholar] [CrossRef]
- Hopkinson, J.M.; English, B.H. Influence of Storage Conditions on Survival and Sowing Value of Seed of Tropical Pasture Grasses. 1. Longevity. Trop. Grasslands 2005, 39, 129–139. [Google Scholar]
- Hilhorst, H.W.M. A Critical Update on Seed Dormancy. I. Primary Dormancy. Seed Sci. Res. 1995, 5, 61–73. [Google Scholar] [CrossRef]
- Maeda, J.; Pereira, M.; Medina, P. Seed Dormancy and Storage of Paspalum notatum Flugge. Rev. Bras. Sementes 1997, 19, 164–170. [Google Scholar]
- Goodchild, N.A.; Walker, M.G. A Method of Measuring Seed Germination in Physiological Studies. Ann. Bot. 1971, 35, 615–621. [Google Scholar] [CrossRef]
- Bates, D.; Mächler, M.; Bolker, B.; Walker, S. Fitting Linear Mixed-Effects Models Using lme4. J. Stat. Softw. 2015, 67, 1–48. [Google Scholar] [CrossRef]
- Lê, S.; Josse, J.; Husson, F. FactoMineR: An R Package for Multivariate Analysis. J. Stat. Softw. 2008, 25, 1–18. [Google Scholar] [CrossRef]
- Mevik, B.-H.; Wehrens, R.; Liland, K.H. Pls: Partial Least Squares and Principal Component Regression. R package version 2.7-3. Available online: https://CRAN.R-project.org/package=pls (accessed on 20 June 2020).
- Mehmood, T.; Liland, K.H.; Snipen, L.; Sæbø, S. A Review of Variable Selection Methods in Partial Least Squares Regression. Chemom. Intell. Lab. Syst. 2012, 118, 62–69. [Google Scholar] [CrossRef]
- Danielson, J.J.; Gesch, D.B. Global Multi-Resolution Terrain Elevation Data 2010 (GMTED2010): U.S. Geological Survey Open-File Report 2011-1073. Available online: https://www.usgs.gov/core-science-systems/eros/coastal-changes-and-impacts/gmted2010?qt-science_support_page_related_con=0#qt-science_support_page_related_con (accessed on 10 March 2020).
- Karger, D.N.; Conrad, O.; Böhner, J.; Kawohl, T.; Kreft, H.; Soria-Auza, R.W.; Zimmermann, N.E.; Linder, H.P.; Kessler, M. Data from: Climatologies at High Resolution for the Earth’s Land Surface Areas. Available online: https://datadryad.org/stash/dataset/doi:10.5061/dryad.kd1d4 (accessed on 10 March 2020). [CrossRef]
- United States Geological Survey HydroShed. Hydrological Data and Maps Based on SHuttle Elevation Derivatives at Multiple Scales. Available online: https://www.hydrosheds.org/page/hydrorivers (accessed on 20 April 2020).
- Natural Earth Data. North American Cartographic Information Society. Available online: https://www.naturalearthdata.com/downloads/ (accessed on 1 April 2020).
- Buchhorn, M.; Smets, B.; Bertels, L.; Lesiv, M.; Tsendbazar, N.-E.; Masiliunas, D.; Linlin, L.; Herold, M.; Fritz, S. Data Set of: Copernicus Global Land Service: Land Cover 100m: Collection 3: Epoch 2015: Globe (Version V3.0.1). Available online: https://zenodo.org/record/3939038#.ZAG22XZByUk (accessed on 15 April 2020).
- Gridded Population of the World (GPW), V11. Socioeconomic Data and Applications Center (SEDAC). A Data Center in NASA’s Earth Observing System Data and Information System (EOSDIS). Available online: https://sedac.ciesin.columbia.edu/data/set/gpw-v4-data-quality-indicators-rev11/data-download#close (accessed on 25 March 2020).
- Hosmer, D.W.; Lemeshow, S. Applied Logistic Regression, 2nd ed.; John Wiley & Sons, Inc.: Hoboken, NJ, USA, 2000; p. 392. ISBN 9780471722144. [Google Scholar]
Disclaimer/Publisher’s Note: The statements, opinions and data contained in all publications are solely those of the individual author(s) and contributor(s) and not of MDPI and/or the editor(s). MDPI and/or the editor(s) disclaim responsibility for any injury to people or property resulting from any ideas, methods, instructions or products referred to in the content. |
© 2023 by the authors. Licensee MDPI, Basel, Switzerland. This article is an open access article distributed under the terms and conditions of the Creative Commons Attribution (CC BY) license (https://creativecommons.org/licenses/by/4.0/).