Article

Cytogeography of Naturalized Solidago canadensis Populations in Europe

Weed Research Laboratory, College of Life Sciences, Nanjing Agricultural University, Nanjing 210095, China
*
Author to whom correspondence should be addressed.
Plants 2023, 12(5), 1113; https://doi.org/10.3390/plants12051113
Submission received: 17 January 2023 / Revised: 25 February 2023 / Accepted: 27 February 2023 / Published: 1 March 2023
(This article belongs to the Special Issue Plant Invasion Ecology)

Abstract

:
Autopolyploidization has driven the successful invasion of Solidago canadensis in East Asia. However, it was believed that only diploid S. canadensis invaded Europe, whereas polyploids never did. Here, molecular identification, ploidy level, and morphological traits of ten S. canadensis populations collected in Europe were compared with previously identified S. canadensis populations from other continents and S. altissima populations. Furthermore, the ploidy-driven geographical differentiation pattern of S. canadensis in different continents was investigated. All ten European populations were identified as S. canadensis with five diploid and five hexaploid populations. Significant differences in morphological traits existed among diploids and polyploids (tetraploids and hexaploids), rather than between polyploids from different introduced ranges and between S. altissima and polyploidy S. canadensis. The invasive hexaploids and diploids had few differences in latitudinal distributions in Europe, which was similar to the native range but different from a distinct climate-niche differentiation in Asia. This may be attributed to the bigger difference in climate between Asia and Europe and North America. The morphological and molecular evidences proved the invasion of polyploid S. canadensis in Europe and suggest that S. altissima may be merged into a complex of S. canadensis species. Our study may be concluded that geographical and ecological niche differentiation of an invasive plant driven by ploidy depends on the degree of difference in the environmental factors between the introduced and native range, which provides new insight into the invasive mechanism.

1. Introduction

Solidago canadensis L. is an invasive plant native to North America and is now widely distributed in Asia, Europe, and Australia [1,2]. It is a polyploid complex (S. canadensis L. complex) composed of multiple ploidy subspecies or variants, with three main ploidy levels in its native and introduced range: diploid (2n = 18), tetraploid (2n = 36), and hexaploid (2n = 54) [3,4,5,6], all of which are harmful weeds [6,7,8]. The hybridization, variable chromosome number, and morphological characters of genus Solidago make its classification extremely complex, and distinguishing them can be based on only a few quantitative traits [3,9]. Among them, the taxonomic status of S. altissima and S. canadensis has been controversial, with some arguing that the two should be one species, and S. altissima should be considered as a variety of S. canadensis [10,11,12], and some suggesting that S. altissima is a separate species by morphological analysis [9,13]. Most European populations of both species are described as S. altissima [1,12], but macro-morphological analysis suggests that S. canadensis is a common species in Europe [13,14]. The main differences between the two are the length and arrangement of epidermal hairs on stems and leaves, the shape and margins of leaves, and micromorphological features of the leaf epidermis and the rhizome system [15], but such distinguishing traits are sometimes inaccurate in complex environments. In Europe, S. canadensis can hybridize with native S. virgaurea L., giving the hybrid S. ×niederederi Khek [16], which can be identified by molecular tools [17]. The development and application of molecular markers can help elucidate intraspecific or interspecific evolutionary relationships, taxonomy, and rates of genomic change [18], but there are no systematic molecular markers for S. canadensis and its complex species [6,19].
Polyploidy is a key factor in the rapid adaptive evolution of invasive plants [20,21,22,23,24]. Polyploids are likely to compete with diploids when they emerge, but they often drive ecological niche shifts to prevent this competition [25,26]. An increasing number of research suggests that autopolyploidization facilitates plants to expand their distribution and invade new environments by generating new traits [20,22]. Polyploid plants typically have higher biomass, larger rhizome systems, larger flowers, and more seeds [22]. For example, the introduced tetraploid of Solidago gigantea Aiton was taller and produces more rhizomes than the native diploids [8]. A study on Centaurea stoebe L. showed that the fruiting rate of tetraploid plants was significantly higher than that of diploids, with the highest fruiting rate in the introduced tetraploids [27]. The high genetic variability of polyploid plants improves their ability to adapt to new environments, making them more likely to become invasive plants [28,29]. Some autopolyploids have greater environmental tolerance, such as cold tolerance [30], heat tolerance [31], salt tolerance [32], and drought tolerance [30]. Studies have shown that the invasive ability of plants depends on the ploidy level and tolerance to environmental factors, with polyploids and species with enhanced tolerance to high temperature and rainfall having a higher invasive ability [33].
Several invasive plants will grow in areas with a similar climate to their native range after invasion, i.e., ecological niche conservatism [34]. However, many invasive plants change their climatic niche after the invasion [34,35], and multiple factors, including human activities and climate change, may facilitate plant adaptation to new climatic conditions, leading to a shift in the climatic niche between the native and introduced range [36]. The increase in genome size caused by polyploidization has important significance for the ecological niche spread of invasive plants [37,38]. For example, Centaurea maculosa Lam. has ploidy-driven geographical divergence in its native Europe, but mainly tetraploid populations have been introduced into North America and its ecological niche has changed compared to the native tetraploids [26,39,40]. There is also a clear geographical differentiation of S. gigantea in its native range, but only tetraploid populations are found in the introduced range of Europe and Asia [8,41,42]. These studies generally compared ecological niche differentiation only between the native and part of the introduced range, and because there were no diploid populations in the introduced range, it was not possible to compare whether ploidy-driven patterns of geographical differentiation remained consistent between the native and introduced range.
Cheng et al. [6] identified 152 populations of S. canadensis of different geographical origins worldwide by ribosomal ITS and trnH-psbA intergenic spacer, and determined the ploidy level of each population. Results showed that diploid, tetraploid, and hexaploid populations were present in both North America and Asia, but only diploids in Europe. Polyploidy has contributed to the invasion and geographical differentiation of S. canadensis in East Asia [6]. Polyploid populations have stronger antioxidant systems that help them scavenge reactive oxygen species at high temperatures, resulting in greater heat tolerance and facilitating their expansion into subtropical regions [6]. There are differences in morphological traits among different ploidy populations, and polyploids usually are taller, have more biomass and rhizomes, and can produce larger amounts of seeds [6,43,44]. Polyploids have stronger adaptive and competitive capacities than diploids [43,45], and are likely to expand into wider adaptive environments and regions under global climate change. However, the existence of polyploid S. canadensis in Europe is unclear. S. canadensis and S. altissima expanded rapidly after their introduction to Europe in the 17th–18th century, mainly distributed in Central and Eastern Europe, with a trend of southward expansion [1,46,47,48]. It can be found along roadsides in many countries in Europe [49]. Previously, only diploid populations were found in both species in Europe [5,6,12,16,47,50,51]. Verloove et al. found hexaploid S. altissima in Belgium and suggested that all previously reported diploid populations were S. canadensis [13,52]. However, given the uncertainty of the distinction between S. altissima and S. canadensis, this population may be also a polyploid population of S. canadensis.
Hence, molecular marker and ploidy determination were performed on ten new populations in Europe to determine whether these populations are S. canadensis, as well as their ploidy level. Molecular identification results and morphological traits of S. canadensis populations and populations previously identified as S. altissima by phenotypic characteristics were compared to clarify the relationship between them. The morphological differences of different geo-cytotype populations were compared. In addition, we investigated the niche differentiation of different ploidy populations in Europe, and compared the pattern with those in North America and Asia, to further improve its geographical distribution pattern in the Northern Hemisphere and invasion mechanism.

2. Results

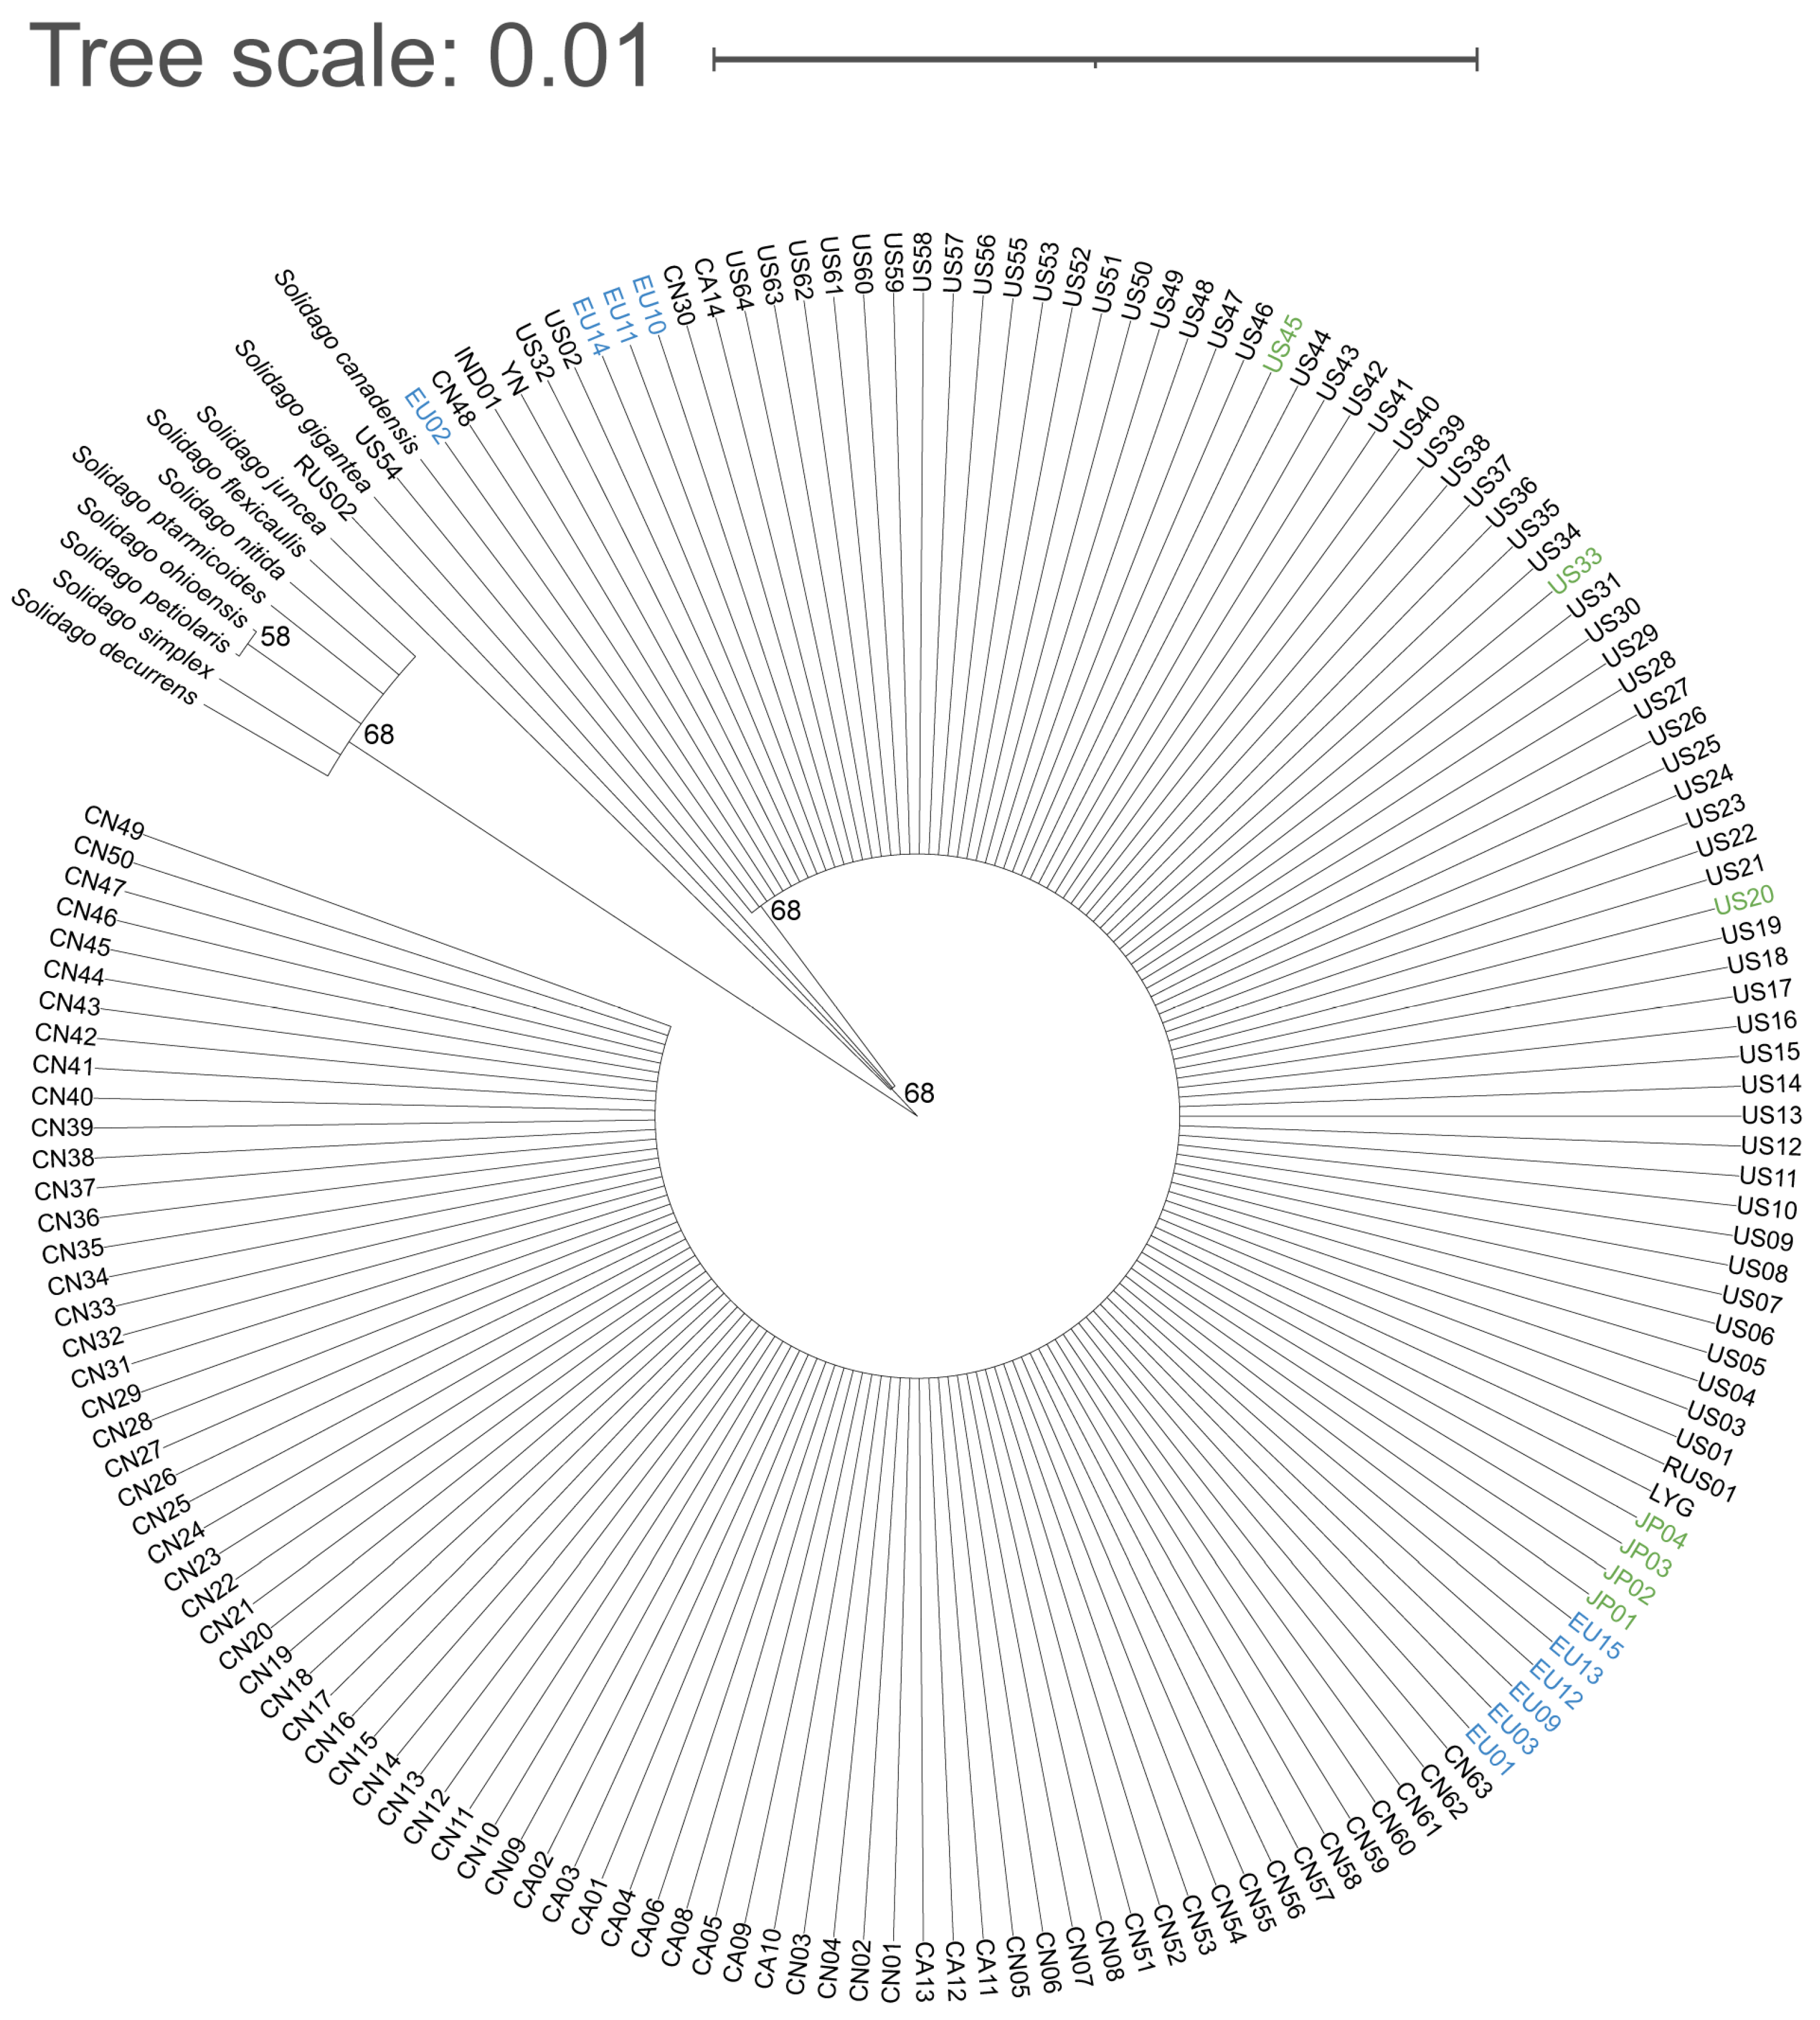
2.1. Molecular Markers and Phylogenetic Analysis

The results of molecular markers showed that all ten populations from Europe were S. canadensis, and the ribosomal ITS sequences of EU10, EU11, and EU14 had one base mutation each compared to the sequence from GenBank, while the sequences of the other seven populations were completely consistent with S. canadensis (Table 1); the trnH-psbA intergenic spacer of EU02 had one base mutation, while the sequences of the other nine populations were completely consistent with S. canadensis in GenBank (Table 2).
The ribosomal ITS and trnH-psbA intergenic spacer of the populations phenotypically identified as S. altissima were > 99% similar to S. canadensis (Table S3). Therefore, we preliminarily consider that S. canadensis and S. altissima are one species by molecular level. The ribosomal ITS and trnH-psbA intergenic spacer of 159 populations were spliced to construct a phylogenetic tree, and all populations except RUS02 were clustered together with the sequences of S. canadensis from GenBank and separated from other closely related species (Figure 1). The S. canadensis populations from Europe, other S. canadensis populations, and S. altissima populations were clustered together in the phylogenetic tree (Figure 1).

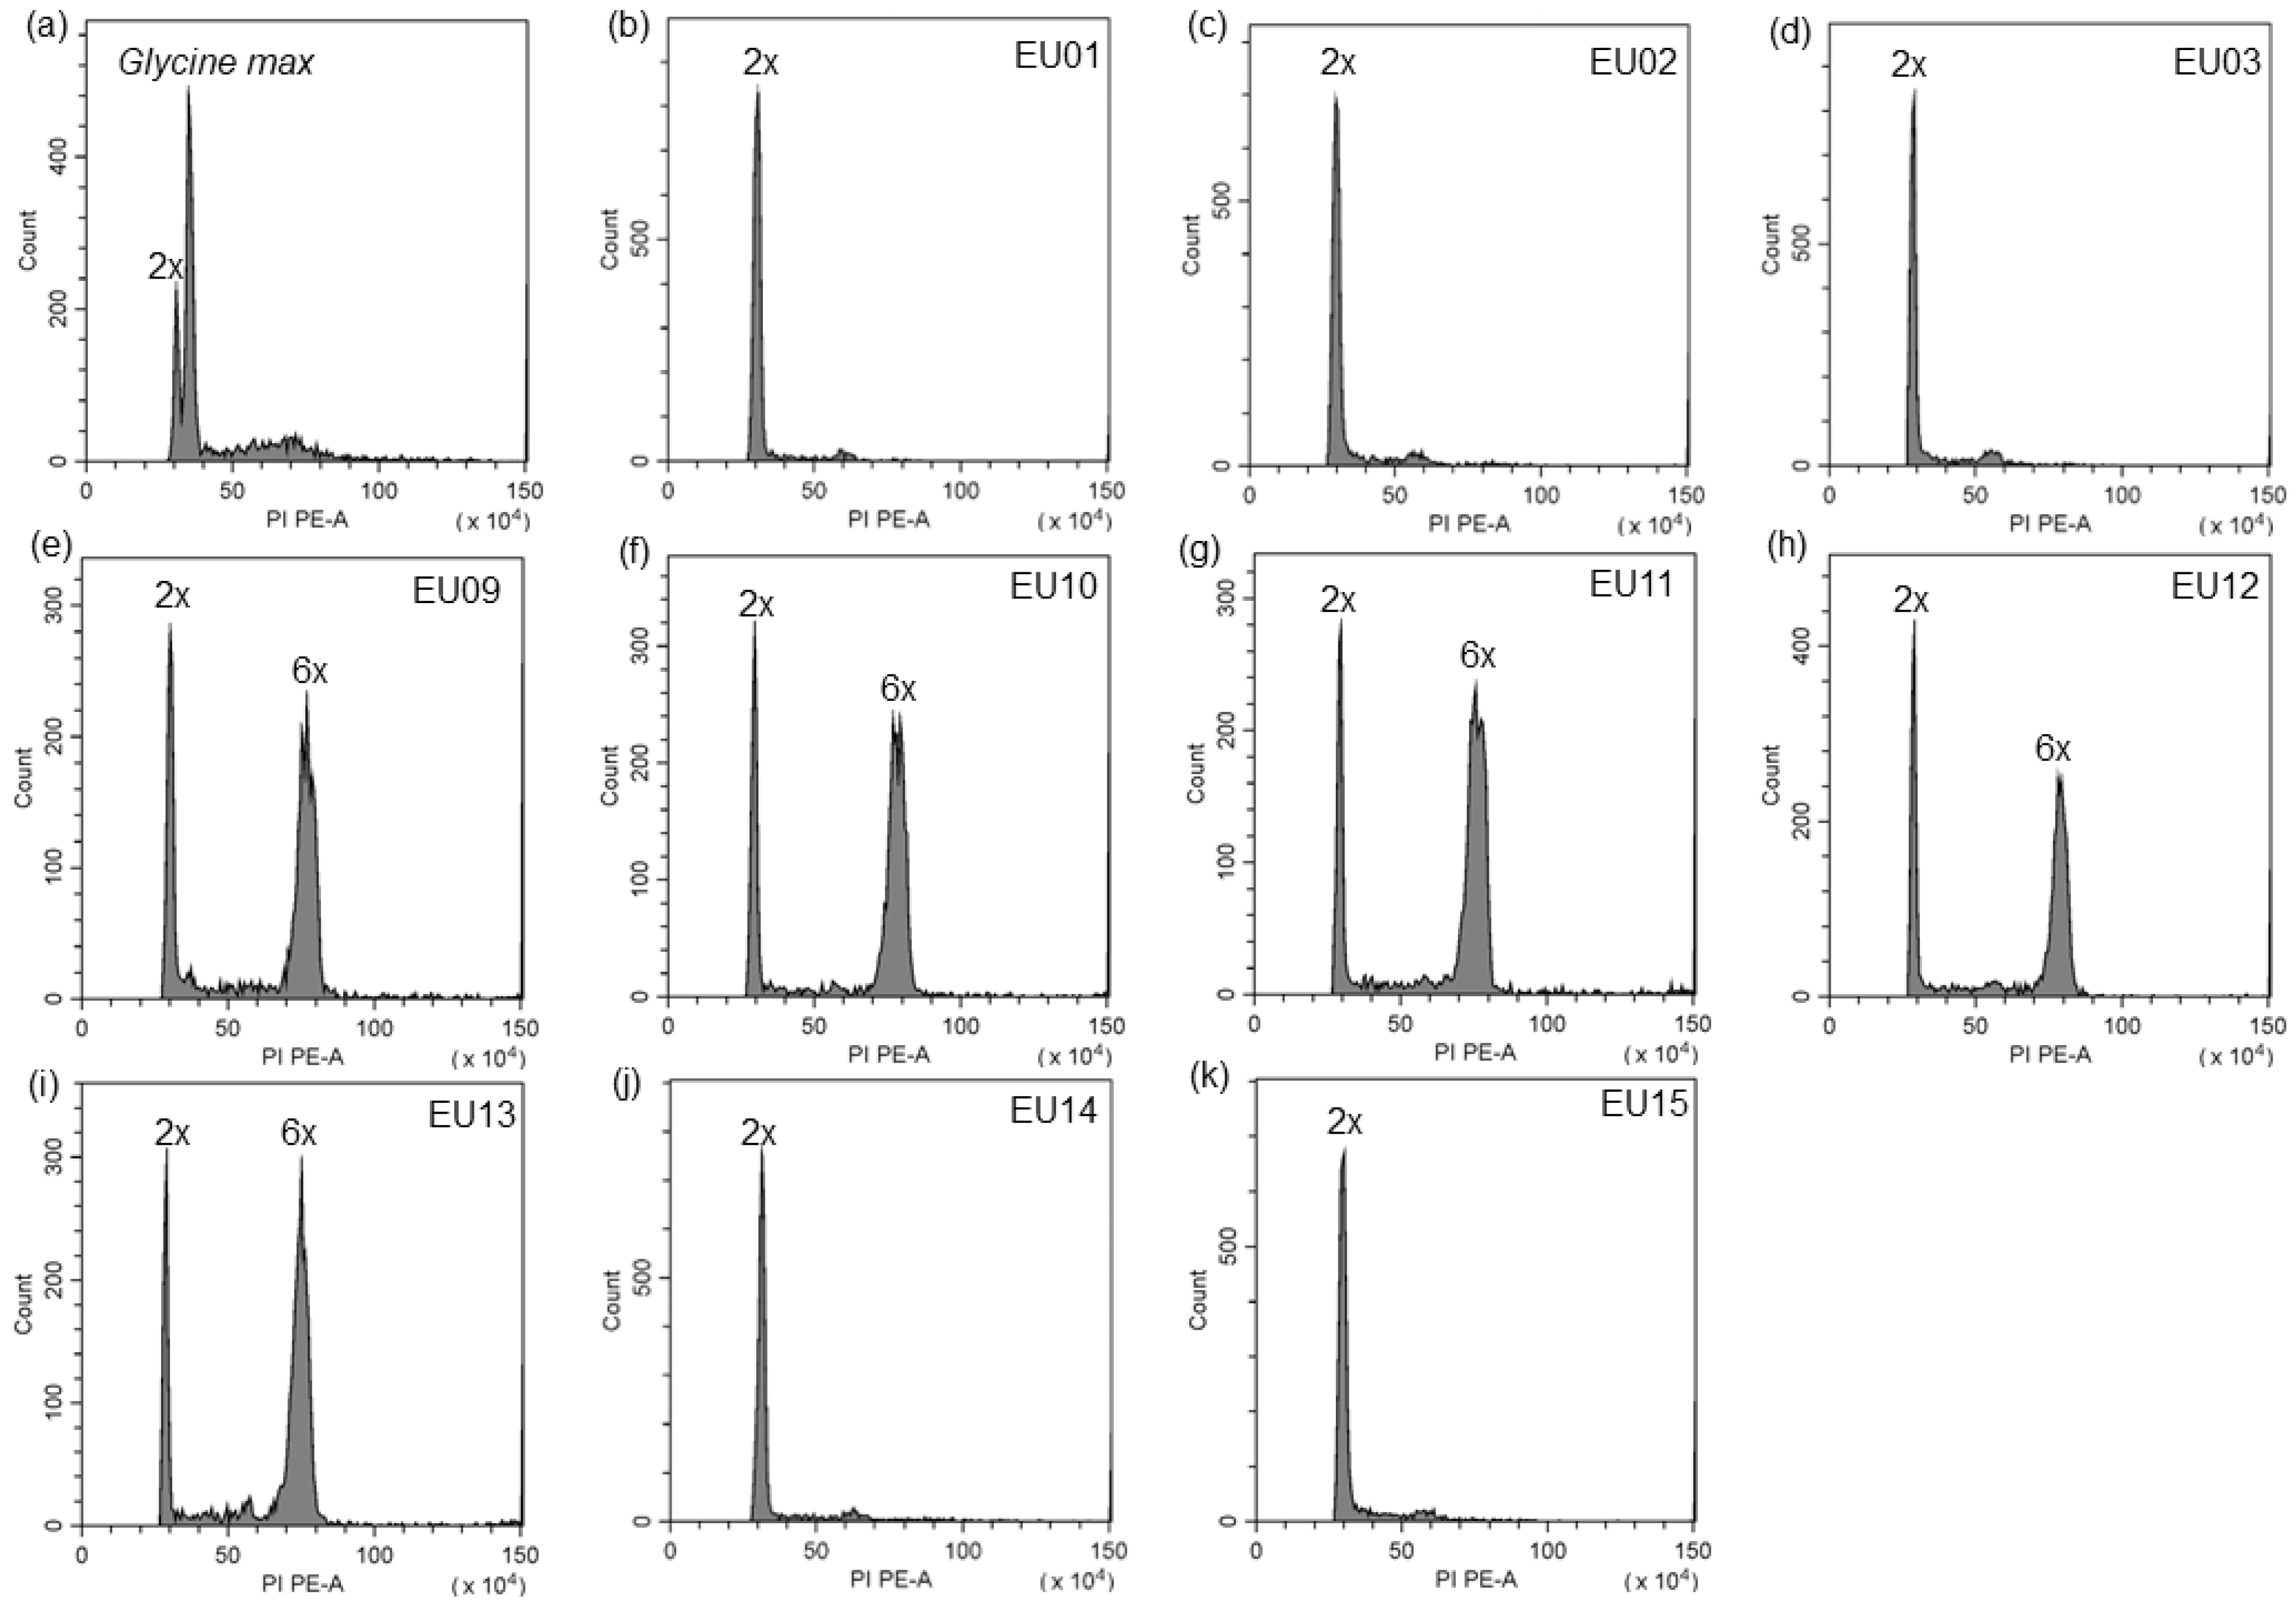
2.2. Ploidy Level of S. canadensis Populations in Europe

The peak positions of five populations in Europe were 2.6 to 2.7 times that of the internal reference diploid population, all of which should be considered as hexaploidy [6,13,53]; five overlapped with the peak of the diploid population, which were diploid (Figure 2b–k; Table S4). Based on the results of molecular markers and ploidy determination, we concluded that these populations in Europe consisted of five diploid populations and five hexaploid populations of S. canadensis.

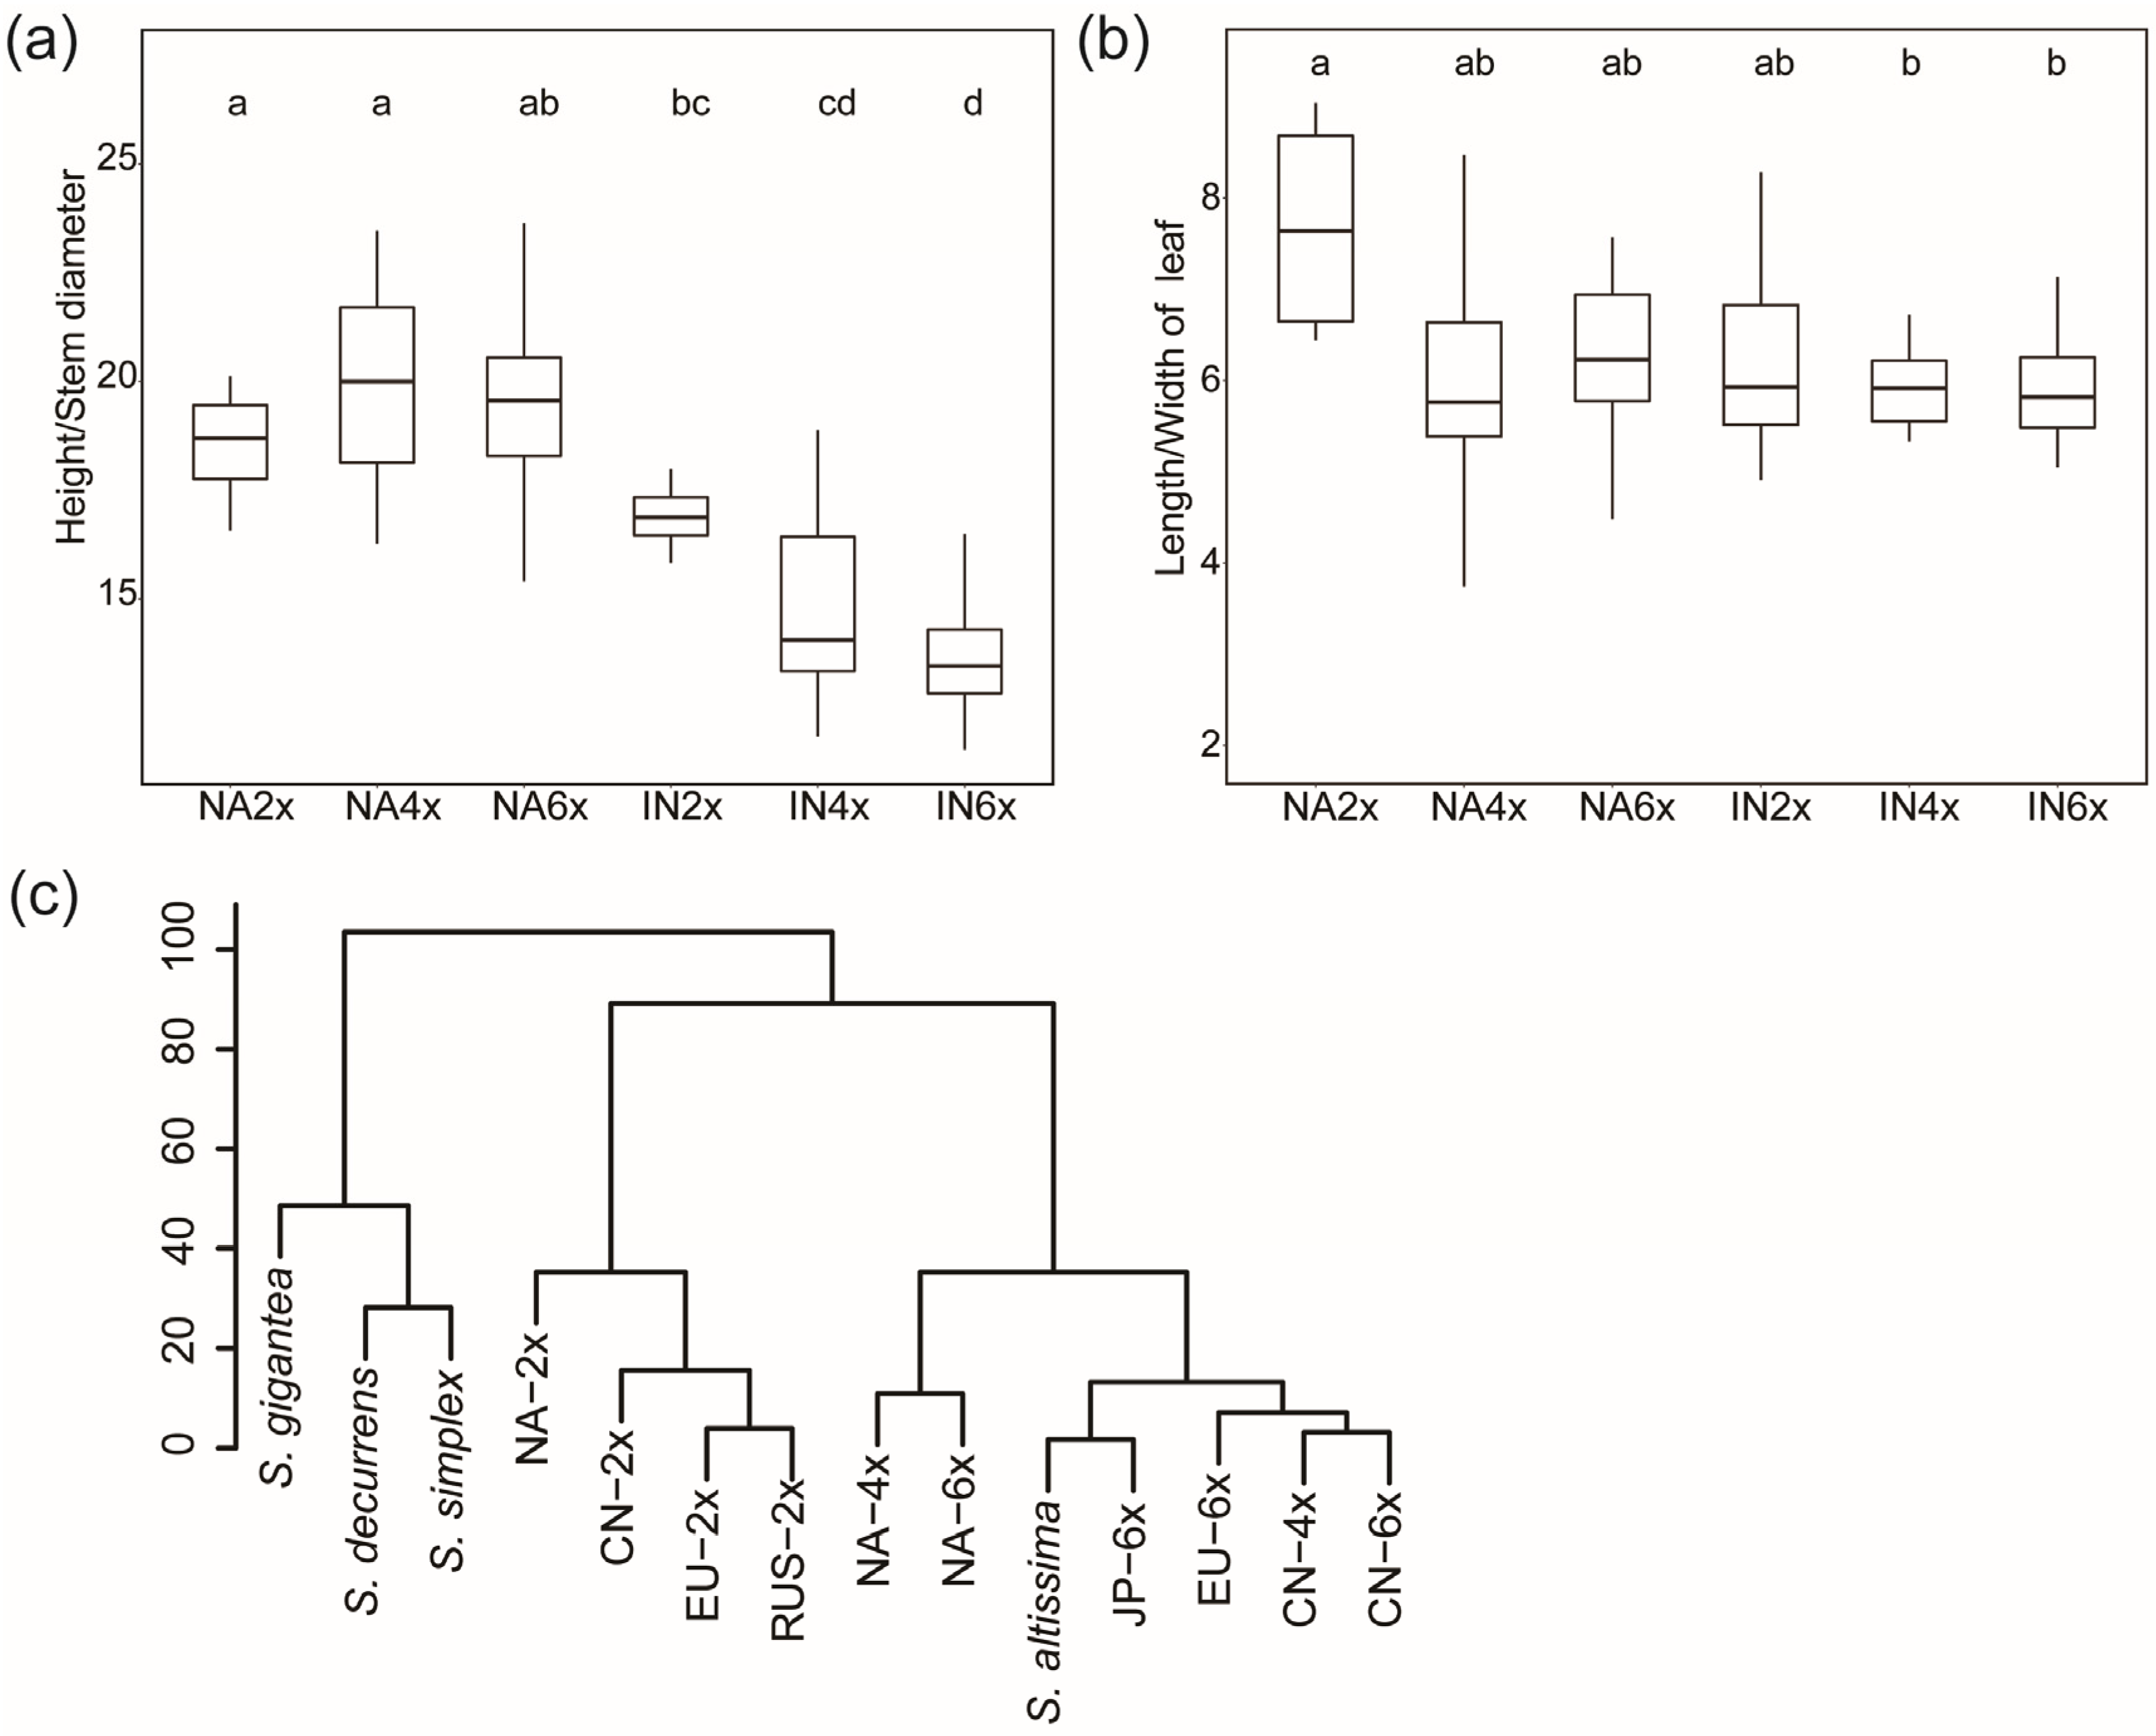
2.3. Comparison of the Morphological Traits of Different Geo-Cytotype Populations

The plant height, stem diameter, leaf length, and leaf width of the introduced populations were significantly higher than those of the same ploidy of native populations (p < 0.05), and the polyploids were significantly higher than the diploids (p < 0.05; Table 3; Figures S1–S6). The number of epidermal hairs of native populations was significantly higher than that of the introduced populations of the same ploidy (p < 0.05), but there was no significant difference between different ploidy in both the native and introduced range. The number of ray florets and disc florets did not differ significantly between different geo-cytotypes, but the length of the ray floret and height of involucre were significantly higher in the polyploids than in the diploids (p < 0.05; Table 3). A comparison of the aspect ratio of leaves and the ratio of plant height to stem diameter at the adult stage showed that the leaves were narrower in the native populations than those of the same ploidy of introduced populations, and narrower in the diploids than polyploids (p < 0.05; Figure 3a,b). The ratio of plant height to stem diameter was greater in the native populations than those of the same ploidy in the introduced range (p < 0.05), and the diploids were significantly greater than the polyploids (p < 0.05; Figure 3a,b and Figures S1–S6). This suggests that the differences in morphological characters of different S. canadensis populations are mainly caused by both cytotype and geographical factors.
The polyploid populations from different introduced regions were not significantly different for each trait, but were significantly different from the native polyploids (p < 0.05; Table 3). Based on the cluster analysis of 11 phenotypic traits, the North American polyploid population, the Asian polyploid population, the European hexaploid population, and S. altissima were clustered together as one group, where the introduced and native polyploid populations divided into two branches. The Chinese cultivated species “huangyinghua”, the European diploid populations, the Russian diploid population, and the native diploid populations clustered together. The S. canadensis populations were separated with the closely related species S. gigantea, S. simplex, and S. decurrens (Figure 3c). It showed that there were no significant differences in a biological trait between the polyploids of S. canadensis and S. altissima, and the cluster analysis also indicated that the polyploids of S. canadensis and S. altissima clustered together (Table 3; Figure 3). These results further suggest that S. canadensis and S. altissima belong to the same species.

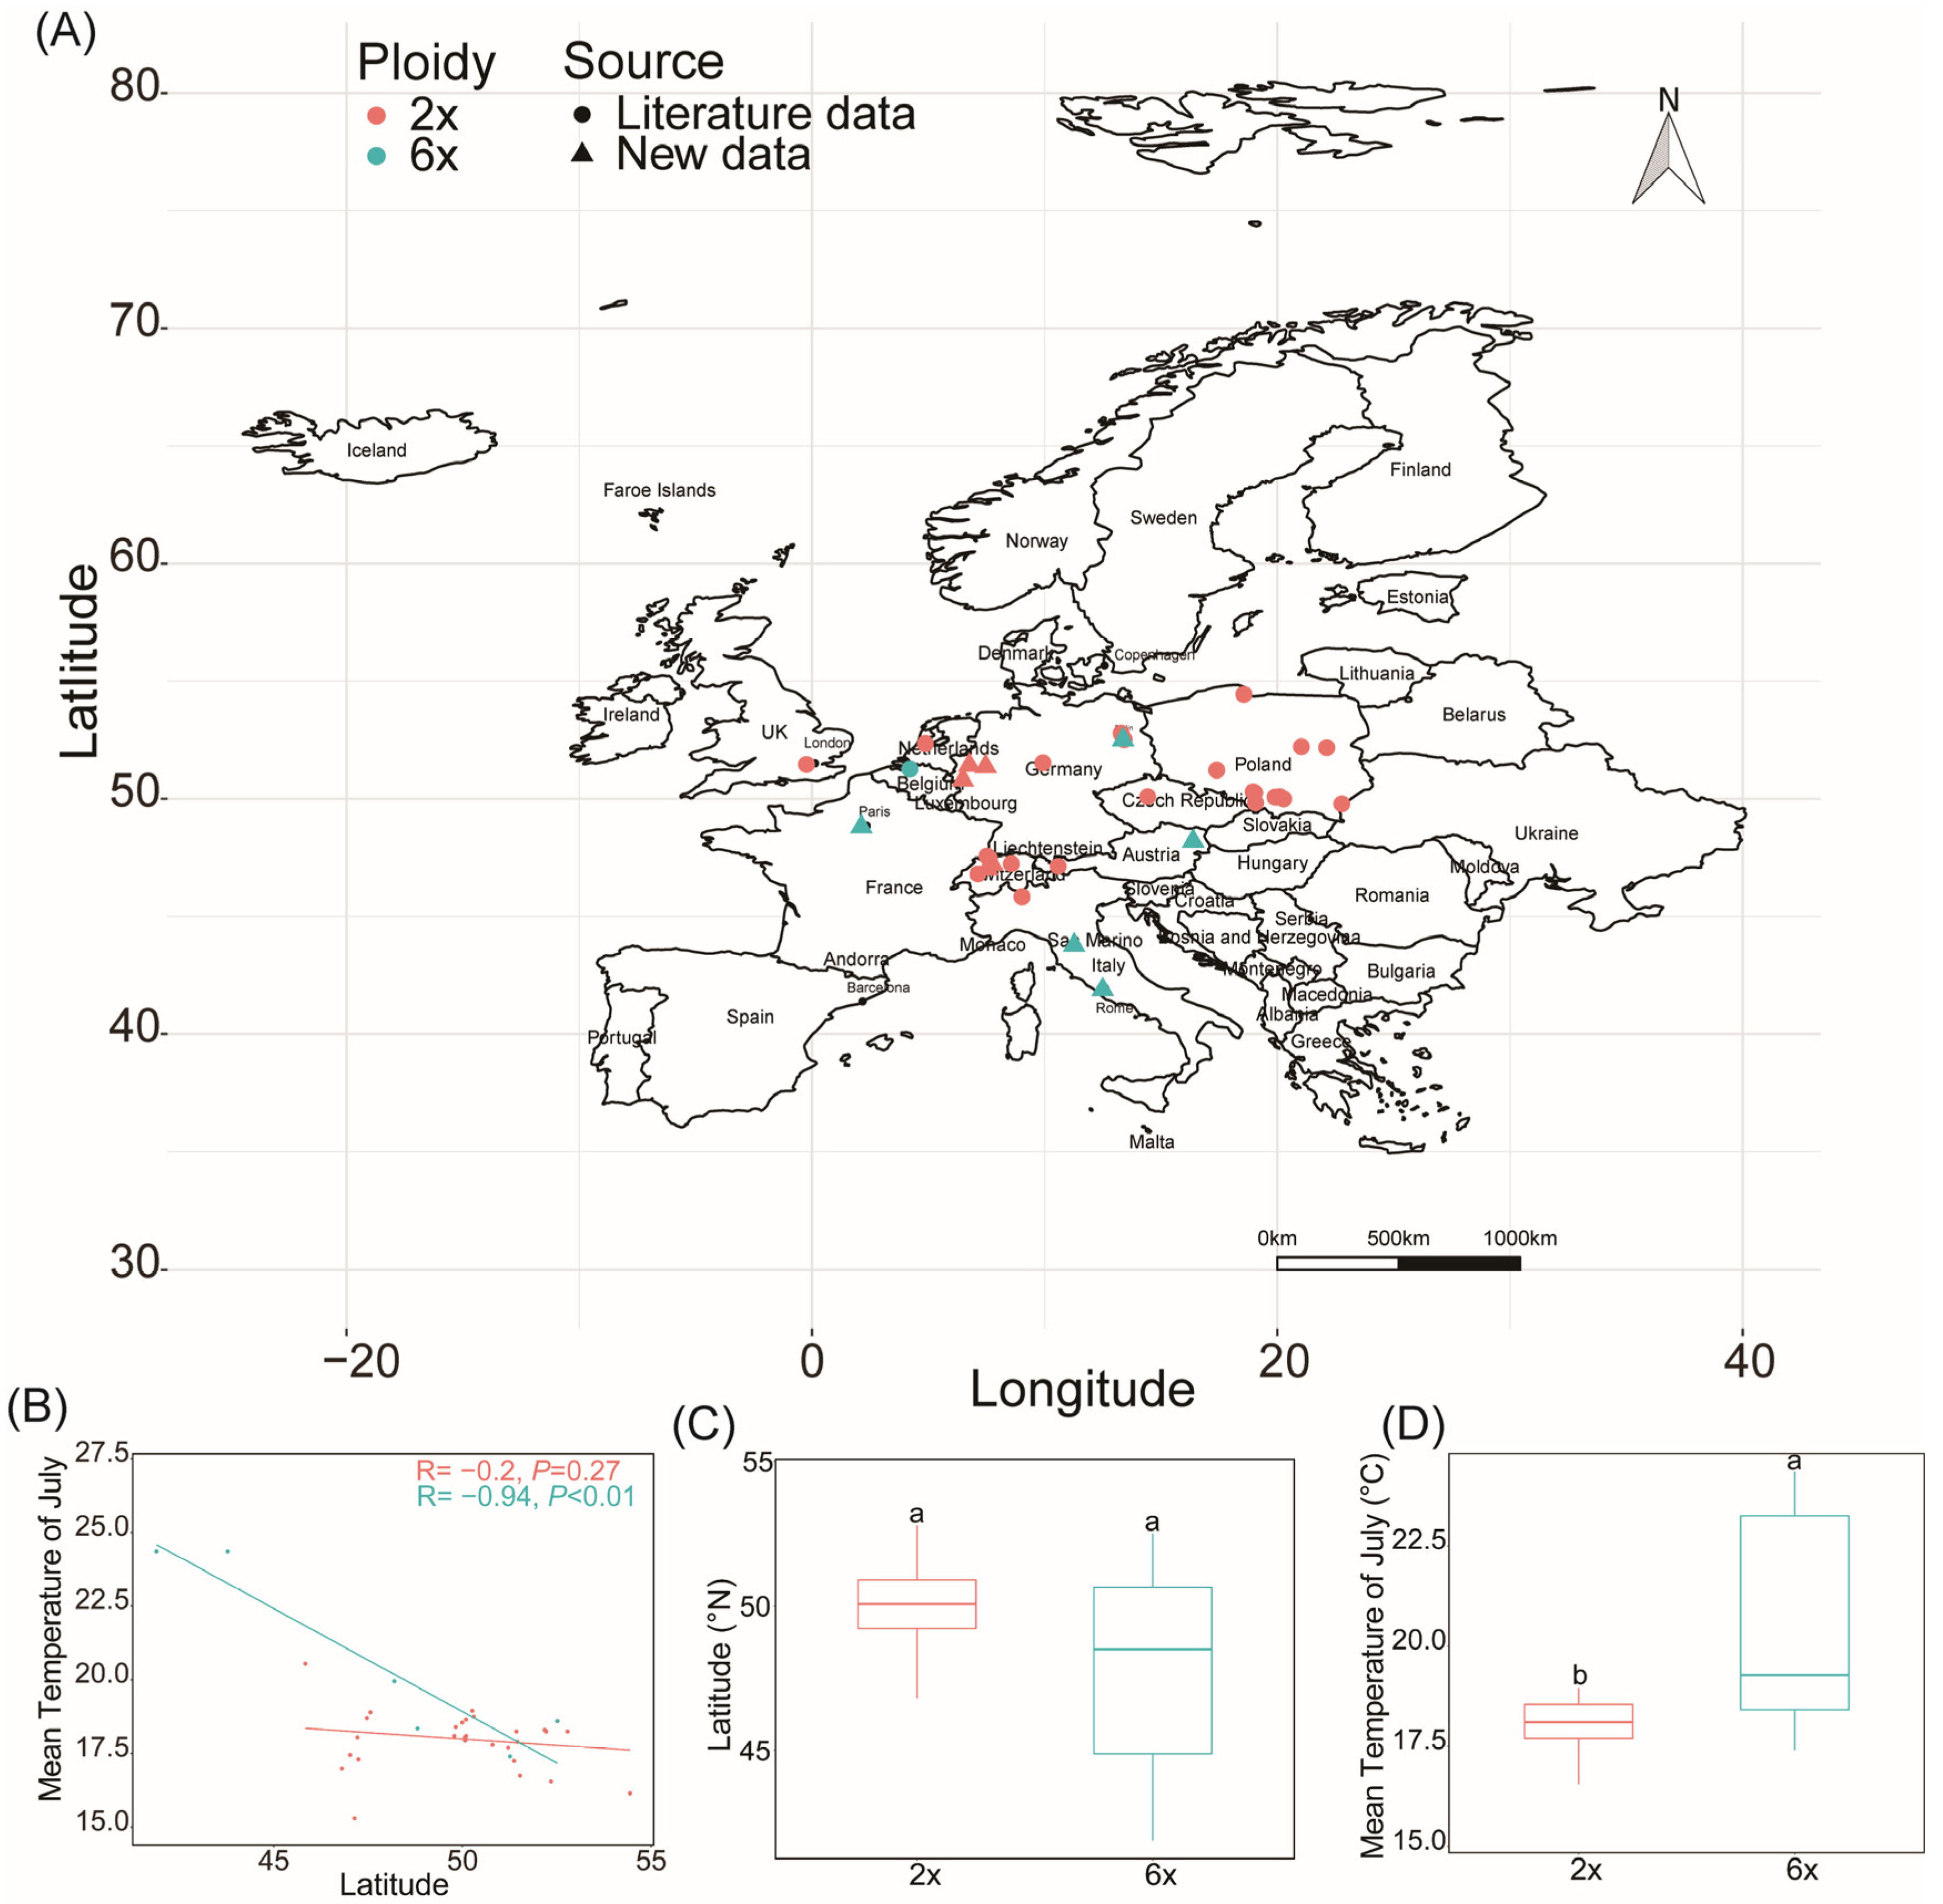
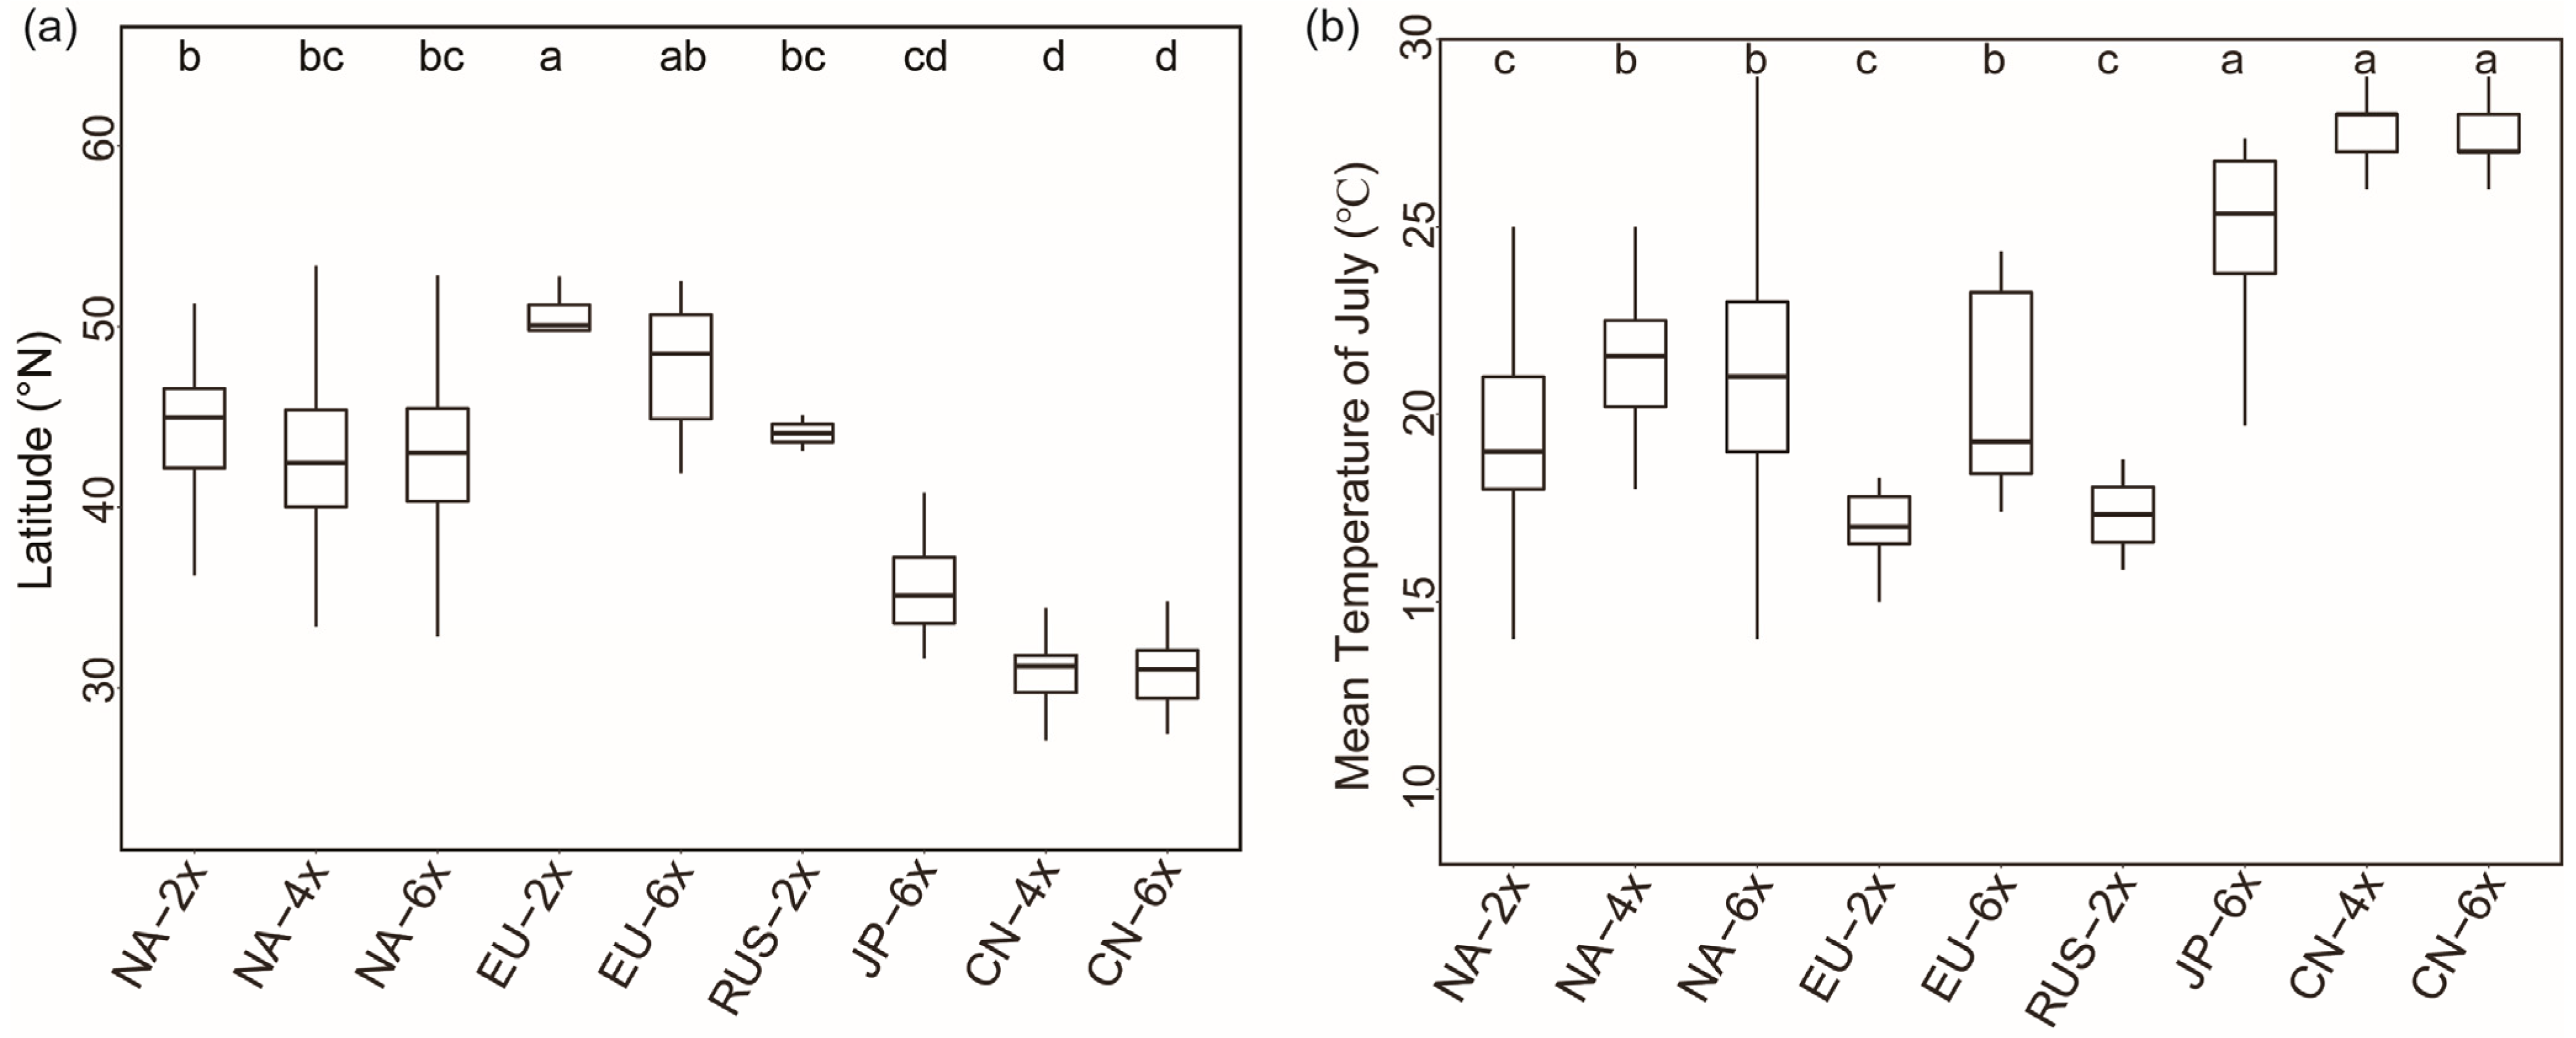
2.4. Geographical Distribution in Europe and Global Differentiation of Ecological Niches of Different Ploidy Populations

We have previously demonstrated that S. altissima and S. canadensis are one species by molecular markers and comparison of morphological traits (Figure 1; Table S3), and therefore integrated S. altissima in the literature into S. canadensis species for analysis. The results showed that the diploid population in Europe was mainly distributed in central Europe, while the hexaploid was relatively widely distributed, with a relatively wide range of latitudes and temperatures (Figure 4A,B). The latitudes of the two ploidy populations did not differ in general, but the mean July temperatures of the distribution areas differed, ranging from 15 to 21 °C for diploids and 17 to 25 °C for hexaploids (Figure 4B,C).
No significant geographical differentiation was observed between diploid and polyploid populations in Europe, as in North America, while a highly significant geographical differentiation was found between the diploid and polyploid populations in Asia, with polyploids distributed at lower latitudes (Figure S7 and Figure 5a). However, the mean July temperature was significantly higher in the polyploid distribution than in the diploid, both in the native and different introduced ranges (Figure 5b).

3. Discussion

3.1. The Relationship of S. canadensis and S. altissima

Verloove et al. [13] found hexaploid S. altissima in Europe and identified it as different from S. canadensis mainly based on morphological comparison and ploidy determination. The study used diploid S. canadensis as a reference, whereas our study showed that morphological differentiation between diploids and polyploids of S. canadensis was obvious, and together with the absence of molecular marker identification, the results of this study are difficult to confirm. Semple and Uesugi [55] compared S. altissima, S. canadensis, S. chilensis, and S. gigantea for phenotypic comparison, where the phenotypic characters of S. altissima and S. canadensis were partially overlapping, but the study also did not distinguish ploidy levels. It has been shown that S. altissima and S. canadensis do not differ in functional traits, biomass production and allocation, and ploidy levels [47,56,57]. S. canadensis and S. altissima were also not significantly different in their ecological distribution in Europe [15]. The main difference between S. canadensis and S. altissima is the length and arrangement of the epidermal hairs of the stems and leaves [15]. However, the present study (Table 3; Figure 3) and several previous studies have shown that the differences in phenotypic traits among different populations were influenced by ploidy and environment [43,44]. These findings, in combination with the results of this study, suggest that these phenotypic differences between S. altissima and S. canadensis result from polyploidy and the evolution of adaptation to the environment.
Furthermore, the ribosomal ITS and trnH-psbA intergenic spacer sequence similarity between S. canadensis and S. altissima was greater than 99%, and the DNA content of hexaploid S. canadensis was the same as that of hexaploid S. altissima found in Europe (Figure 1) [13]. The DNA content of the diploid S. canadensis found by Szymura et al. [47] was also not significantly different from that of the diploid S. altissima. Morphological comparisons showed that the differences in morphological characters between polyploid S. canadensis and S. altissima were not significant (Table 3; Figure 3). In summary, we concluded that S. canadensis and S. altissima should be considered as one complex species (S. canadensis L. complex) from the comparison of molecular identification, morphological characters, and DNA content.

3.2. Ploidy and Environment Determine the Morphological Diversity of S. canadensis

The growth and morphological traits of plants are important indicators for the efficient utilization of resources and tools to indicate the competitive ability of plants [58]. The general effect of polyploidy is an increase in plant size; polyploids typically have taller, more robust plants that produce higher biomass, larger rhizome systems, and larger flowers and seeds [59,60,61,62]. For example, introduced tetraploids of S. gigantea were taller than the native diploids [8]. Introduced polyploids of Fallopia have been successfully invaded due to taller plants, higher biomass, and larger rhizomes [59]. Our results showed that plant height, stem diameter, leaf length, and leaf width were significantly higher in polyploids of S. canadensis than in diploids in different regions (Table 3). Epidermal hairs can resist biotic and abiotic stresses in the environment [63]. S. canadensis has a variety of natural enemies in its native range, but lacks natural enemies in the introduced range [11,64], so the native S. canadensis may resist insects and other enemies by having more epidermal hairs. The polyploid S. canadensis had a larger flower head than the diploids due to polyploidization (Table 3). The flowers of tetraploids and triploids of Leptospermum scoparium JR and G. Forst were significantly larger in diameter than diploids [65], and the flowers of Escallonia rubra tetraploids were also larger than diploids [66]. The greater flower heads help to attract pollinators, increase the probability of cross-pollination, ensure sufficient seed production, and improve the adaptability of S. canadensis [67]. Differences in phenotypes of S. canadensis between geo-cytotypes were observed, with the native polyploid being taller and having a more robust stem than the diploids, while the introduced polyploids had taller and stronger stems than the native polyploids (Figure 3), suggesting that S. canadensis has enhanced growth capacity through pre- and post-adaptation, resulting in greater invasive ability.
Polyploids can promote biological invasion by accelerating the differentiation of morphological traits through pre- and post-adaptive evolution [22]. Invasive plants usually have characteristics such as high phenotypic plasticity, high reproductive capacity, and suitability for dispersal [68]. The change in phenotypic expression of a genotype in response to environmental factors is known as “phenotypic plasticity” [69,70]. In Europe, S. canadensis has a relatively wide niche with regard to soil properties, which can be related to both local adaptation and phenotypic plasticity [56,71]. Studies have proved that plasticity in S. canadensis plays a central role in shade adaptation [72] and salt tolerance [73], but these studies did not compare phenotypes of different ploidy populations. Our study and Cheng et al. [6] proved that the polyploids had a higher phenotypic plasticity than diploids. Studies on S. gigantea have shown that only tetraploids have successfully invaded Europe, that native tetraploids produce more branches and rhizomes than diploids, and that population size, density, and total plant biomass were greater in introduced populations than in native populations [8,74]. A study of Mimulus guttatus DC. showed that there were no significant differences in phenology, floral traits, sexual, and nutritional reproduction between the North American (native range), Scottish, and New Zealand populations (introduced range), but the introduced populations had twice as many flower-bearing upright side branches as those of native populations, due to the fact that different introduced populations have evolved by adaptation and enhanced reproduction [75]. The morphological characteristics of polyploid populations of S. canadensis in different introduced ranges did not differ significantly from each other, but they differed from the native populations, especially diploid populations (Table 3), indicating that polyploids underwent rapid adaptive evolution after the invasion in different regions, adapted to the local ecological environment, and finally invaded successfully.

3.3. Polyploid S. canadensis Has Been Successfully Invaded and Widely Distributed in Europe

Studies have investigated the cytogeography patterns of S. canadensis in its native range in North America, and Asia where it is invasive, and diploids, tetraploids and hexaploids were found [6,76]. However, few studies have investigated the distribution of ploidy levels in S. canadensis in Europe, and previous studies have suggested that only diploid is present in Europe [5,6,16,47,50]. In general, diploids are less abundant in the invasive range than polyploids and are present in areas where climatic conditions are similar to those of native populations [77]. For example, there are diploids, tetraploids, and hexaploids of S. gigantea in the native range, but only tetraploids have invaded Europe [41]. Studies on C. maculosa have also shown that the proportion of polyploids is much higher in North America, where it is more invasive than in its native range in Europe [40]. Previous studies have shown that only polyploids of S. canadensis have successfully invaded in Asia [6], and five hexaploid populations and five diploid populations were found in Europe in our study (Figure 1), suggesting that polyploids may also have been widely distributed in Europe.
The polyploid populations of S. canadensis in Asia have changed their isothermal niche by adapting to summer heat stress and are distributed at a lower latitude compared to diploids [6]. Distributions of S. canadensis were limited climatically in Central Europe, and were also correlated with proxies of human pressure [78]. The latitudinal difference between diploid and hexaploid populations found in Europe was not significant, but hexaploids have a wider latitudinal range of distribution (Figure 3). Heat tolerance is usually a key factor for the successful invasion of invasive plants, and greater heat tolerance of polyploids could help them expand their invasion range [33]. The mean July temperature in the distribution areas of hexaploids was significantly higher than that of diploids (Figure 3d), suggesting that hexaploids in Europe have also evolved adaptively and are better adapted to temperature changes. Currently, S. canadensis is widely distributed in central Europe [47,52,57], and some studies also predict that S. canadensis will invade further south in Europe [46], which may be related to the greater adaptability and heat tolerance of polyploids [6]. Certainly, the number of populations we studied is not large enough, so future attention should be paid more to the ploidy distribution of S. canadensis in Europe and its invasion in the south.

3.4. Ploidy-Driven Ecological Niche Differentiation of S. canadensis in the Northern Hemisphere Depends on Environmental Factors

Solidago canadensis is widely distributed in North America, including the temperate continental climate zone in the northeast and the subtropical humid climate zone in the southeast [6]. The geographical distribution and ecological niches of diploids and polyploids have diverged significantly after the invasion, which is mainly due to the deviation of the climatic ecological niches of polyploids. Diploids are still distributed in regions with similar climates to their native regions, such as Europe and the Russian Far East. Polyploids have invaded China and Europe, mainly distributed in the subtropical monsoon climate zone in China, and in the Europe range with a climate similar to that of North America (Figure 5). This is mainly due to the weak adaptation of diploids, while polyploids are more environmentally adapted and can successfully invade a wide range of climatic regions [79].
Whether invasive plants show ecological niche differentiation after the invasion is influenced by several factors [80,81]. Polyploidy can facilitate the adaptive evolution of plants, which is important for the spread of plant invasions [23,82]. There is no generalized pattern of niche differentiation during the establishment and evolution of polyploids, and different lineages of the same polyploid plant may coexist with different patterns of climatic niche evolution (niche conservatism, contraction or expansion) [37]. Whether polyploids develop niche differentiation depends on the history of the species: e.g., age of the polyploid, multiple origins, or the number of ploidy levels, among others [83]. In addition, the climate is the main factor driving the distribution of plant species [84], which has an important impact on the ecological adaptability of different cytotypes [85]. S. canadensis invaded East Asia and Europe at about the same time, but the geographical differentiation patterns of different ploidy populations after the invasion were different. The climate of the distribution area of S. canadensis polyploids in China was different from that in North America and Europe, and the mean July temperature was significantly higher than that of the polyploid population in North America and Europe (Figure 5). Polyploids in East Asia have evolved through adaptation to enhance heat tolerance to expand into subtropical regions, while diploids are unable to adapt to high temperatures and can only be distributed in mid-latitudes, thereby promoting geographical differentiation of ploidy [6]. As the climate was similar to that of the native range, there was also no clear ploidy-driven geographical differentiation in Europe. In summary, we suggest that it is mainly climatic factors that lead to the adaptive evolution of polyploids of S. canadensis in different introduced ranges, hence to different patterns of ecological niche differentiation. Our study indicated that the ploidy-driven adaptive evolution of invasive plants depends on the degree of difference between the environmental factors of the introduced range and the native range.
Even though there was no difference in latitude between the distribution of different ploidy populations in North America and Europe, the mean July temperature of polyploids was still higher than that of diploids (Figure 5), indicating that there is a difference in the required optimum ecological niches of different ploidy populations, and temperature is an important factor influencing the geographical distribution of S. canadensis. Under the environmental conditions of global warming, the future distribution of S. canadensis is likely to further expand from the temperate zone to pantropical regions driven by polyploidization.

4. Materials and Methods

4.1. Experimental Materials

The ten populations collected from Europe (Table S1) were performed for ploidy determination and molecular identification. Molecular identification results were used to compare and construct phylogenetic trees together with 142 S. canadensis populations from other regions and seven populations identified as S. altissima by phenotypic characteristics as previously described by Cheng et al. [6].
Biological characteristics were measured for ten populations from Europe and 93 other different ploidy populations of S. canadensis collected from the native regions (US and Canada) and introduced regions (China, Russia), and 8 populations identified as S. altissima, and one population each of S. gigantea, S. simplex, and S. decurrens (Table S1). The detailed descriptions of material collection and identification had been presented by Cheng et al. [6].
The ‘NA2x’, ‘NA4x’, ‘NA6x’, ‘IN2x’, ‘IN4x’, and ‘IN6x’ were used to represent the native diploid, native tetraploid, native hexaploid, introduced diploid, introduced tetraploid, and introduced hexaploidy of S. canadensis, respectively.

4.2. DNA Extraction and Molecular Identification

To confirm the correct identification of the ten populations, we sequenced the ribosomal ITS (608 bp) and trnH-psbA intergenic spacer (213 bp) of three individuals from each population. To this end, the total DNA from the dried leaves was extracted using a Plant Genomic DNA kit (DP305, Tiangen Biotech Co., Ltd., Beijing, China). A pair of primers (upstream: 5′-CGTAACAAGGTTTCCGTAG-3′, downstream: 5′-TTATTGATATGCTT AAACTCAGCGGG-3′) were used to amplify ITS rDNA gene and another pair of primers (upstream: 5′-CCGCCCCTCTACTATTATCTA-3′, downstream: 5′-TCTAGACTTAGCAGCTATTG-3′) were used to amplify psbA-trnH intergenic spacer. Polymerase chain reaction (PCR) was carried out in 50 μL containing 2 μL of 10 μmol/L primers, 10 × buffer 5 μL, 25 mM Mg2+ 4 μL, 2.5 mmol/L dNTPs 4 μL, 50 ng/μL DNA templates 1 μL, and 5U Taq DNA polymerase 0.5 μL. The PCR cycle was 95 °C for 4 min followed by 30 cycles of 95 °C for 30 s, 52 °C for 60 s, 72 °C for 60 s, and a final extension step at 72 °C for 7 min. PCR products were separated on 1% agarose gels and stained with ethidium bromide. The PCR products were purified and sequenced.

4.3. Construct Phylogenetic Tree

The ribosomal ITS and chloroplast psbA-trnH were sequenced and edited using the BioEdit v 7.0.5.3 software. As the reference for alignment, we extracted the data for S. canadensis (ITS, HQ142590.1; psbA-trnH, KX214929.1) from GenBank and aligned them with the ITS and psbA-trnH sequences of our samples using the Clustal X 1.83 software. The ITS1, 5.8S, and ITS2 gene boundaries and psbA-trnH were determined from ITS and psbA-trnH sequences of the Solidago genus in GenBank. To further verify the species identity of our samples, we conducted a BLAST search in the database of the National Center for Biotechnology Information (NCBI) to determine the species with the most similar identities. The ribosomal ITS and chloroplast psbA-trnH of S. decurrens, S. gigantea, S. flexicaulis, S. juncea, S. petiolaris, S. sempervirens, S. shortii, S. fistulosa, and S. simplex were downloaded from the GenBank. The ribosomal ITS and chloroplast psbA-trnH were spliced by SequenceMatrix 1.78. In addition, we built phylogenetic trees for all 152 S. canadensis populations, 7 S. altissima populations, and closely related species with the ITS-psbA-trnH sequences, using the MEGA 4.1 Beta 3 software based on the maximum likelihood (ML) analyses, using a GTR substitution model as determined. We assessed branch support with 1000 bootstrap replicates.

4.4. Determination of Ploidy Level

We grew up plants from each seed family in the greenhouse. Fresh leaf material was held in self-sealing plastic bags containing silica and transported to the laboratory for ploidy level determination. We applied a modified flow cytometry method by Galbraith et al. [86] for the determination of ploidy level. Briefly, 0.5 g fresh leaf tissue was chopped up with a razor blade in 2 mL of ice-cold Galbraith buffer (PH 7.0, 45 mM MgCl2, 30 mM sodium citrate, 20 mM 4-morpholinepropane sulfonate, 0.5% w/v polyvinylpyrrolidone, and Triton X-100 1 mg/mL) in a vitreous Petri dish held on a chilled brick. The resultant fine slurry was filtered through a 50 μm microfilter into 2 mL polystyrene tubes and incubated at 4 °C for 5 min. The final filtrate was treated with 10 μL/mL of RNase A for 10 min at 4 °C. Then, 200 μL/mL of propidium iodide (PI) staining solution was added and incubated at 4 °C for 30 min in darkness. The fluorescence strength of PI-DNA conjugates was measured by flow cytometry (BD FACS, Becton Dickinson, Franklin Lakes, NJ, USA) using a 488 nm laser and 590/40 emission filter [87]. The fluorescence can be converted to chromosome number using standard population with known ploidy [6,76]. Therefore the native diploid population (CA09, 2n = 18) which chromosome number has been assessed using mitotic root-tip squashes [6], was used as an internal reference to measure the ploidy of ten populations. The ratio of DNA content of different ploidy was determined previously by the determination of ploidy level of a large number of populations [6]. Glycine max Merr. ‘Polanka is used as an internal reference to measure the DNA content of diploids [54]. Flow-cytometry data acquisition and analysis was done with the software FloMax version 2.0 (Quantum Analysis, Münster, Germany). Only histograms with CVs smaller than 5% and with a minimum peak height of 50 particles were accepted. Other histograms were discarded and corresponding samples were designated no signal [88].

4.5. Measurement of Morphological Traits

Populations of S. canadensis, S. altissima, S. gigantea, S. simplex, and S. decurrens (Table S1) were planted in a common garden in Pailou Teaching and Research Station of Nanjing Agricultural University (32°02′ N, 118°37′ E), Nanjing, China. This region is characterized as being a subtropical monsoon climate, with an average annual rainfall of 1090 mm and the mean annual temperature is 15 °C (lowest in Feb at 2.7 °C and highest in July at 28.1 °C). They were watered, weeded, and sprayed with pesticides regularly. After plant establishment, three individuals of each population were selected, and three replicates of each individual were used to measure the 7 vegetative traits: height, stem, leaf length, leaf width, number of epidermal hairs of the main vein (per 2 mm length), number of epidermal hairs of the lateral vein (per 2 mm length), and number of epidermal hairs of the netted venation (per 4 mm2) (Table 3). One leaf from each plant was randomly removed from the upper, middle, and lower parts of the plant to measure the leaf length and width and epidermal hair-related traits. In the observation of leaf epidermal hairs, the apical part of the leaf, the middle part of the leaf, and the base of the leaf were measured as replicates.
During the flowering period, 56 populations of S. canadensis were selected, and populations of other species remain unchanged. Three individuals of each population were selected, and three replicates of each individual were used to measure the 4 floral traits: length of the ray floret, height of the involucre, number of ray florets, and number of disc florets (Table 3).
Morphological traits of populations of different sources, ploidy, and species were compared, and each morphological index was standardized by the maximum method for cluster analysis. Although a diploid population was previously found in Russia [6], it was investigated as an individual population due to its proximity to Asia and distance from other European populations.

4.6. Geographical Differentiation Analysis of Different Ploidy Populations

The geographical differentiation of different ploidy populations in Europe and other regions was analyzed by combining with our previous research [6] and literature records about S. canadensis and S. altissima (Table S2; Figure S7). Climatic factors of all occurrences were extracted from worldclim (https://www.worldclim.org/ (accessed on 1 December 2021)) for the analysis of differences in climatic factors between the distribution ranges of different ploidy populations. In addition, the ecological niche differentiation pattern of different ploidy populations in Europe, North America, and Asia (the Russian population merged into Asia) are compared by comparing latitude and mean July temperatures of their distribution sites.

4.7. Data Analysis

The average and square deviation of morphological traits and climate factors for different geo-cytotypes of S. canadensis in different regions were calculated, and the significance of the differences (p < 0.05) between geo-cytotypes in different regions was analyzed using one-way ANOVA with Least Significant Difference (LSD). All data are expressed as the mean ± standard error (Mean ± SE). Statistical analyses and plotting were implemented in R v4.1.2 [89].

5. Conclusions

Our study provides morphological and molecular evidence that the hexaploidy of S. canadensis has successfully invaded in Europe and S. altissima and S. canadensis should be considered as one complex species. There were significant differences in morphological traits among different geo-cytotypes. Polyploidy has evolved adaptively in different introduced ranges, enhancing the competitive ability of S. canadensis to achieve its successful invasion. Ploidy-driven ecological niche differentiation of S. canadensis in the northern hemisphere depends on environmental factors, with no significant differentiation in North America and Europe, and significant differentiation in Asia, suggesting that the ploidy-driven adaptive evolution in the introduced range depends on the degree of difference from the environmental factors of the native range. Compared with the diploid, the polyploid of S. canadensis has a higher mean July temperature in its distribution area and is more adaptable to temperature changes. The distribution area of S. canadensis will gradually expand globally in the future, and the changes in the distribution area of the polyploids should be paid attention to in time.

Supplementary Materials

The following supporting information can be downloaded at: https://www.mdpi.com/article/10.3390/plants12051113/s1, Table S1: Population used for morphological traits; Table S2: List of distinct localities of S. canadensis and S. altissima with previously published ploidy level determination; Table S3: Test of ITS and psbA-trnH intergenic spacer sequences of Solidago altissima blasted in NCBI database; Table S4: Flow cytometric ploidy analysis of Europe populations; Figure S1: Morphology of S. canadensis (2x) fromm Canada; Figure S2: Morphology of S. canadensis (6x) from USA; Figure S3: Morphology of S. canadensis (2x) from Russia; Figure S4: Morphology of S. canadensis (6x) from China; Figure S5: Morphology of S. canadensis (2x) from Europe; Figure S6: Morphology of S. canadensis (6x) from Europe; Figure S7: Cytogeography of S. canadensis at the Northern Hemisphere.

Author Contributions

Z.T.: methodology, data curation, formal analysis, investigation and writing original draft; J.C., J.X., J.Z. and X.Y.: methodology, investigation, data curation; D.F.: data curation, review and editing; Z.Z., Y.Z. and Z.M.: resources; S.Q.: conceptualization, funding acquisition, project administration, supervision, writing, review, and editing. All authors have read and agreed to the published version of the manuscript.

Funding

This manuscript and this research were funded by The National Natural Science Foundation of China (31870526, 3140110504, 31572066) and The Natural Science Foundation of Jiangsu Province (SBK2018042511).

Data Availability Statement

Data are available from the Dryad Digital Repository: https://datadryad.org/stash/share/i47u-h452Q7JDll8EAb4WkAtiA3WXLeAOdg3_XSl5J4 (accessed on 12 November 2022).

Acknowledgments

We would like to express our gratitude to Kandhasamy Sowndhararajan for revising this manuscript.

Conflicts of Interest

The authors declare no conflict of interest.

References

  1. Weber, E. The dynamics of plant invasions: A case study of three exotic goldenrod species (Solidago L.) in Europe. J. Biogeogr. 1998, 25, 147–154. [Google Scholar] [CrossRef]
  2. Szymura, M.; Szymura, T.H. Interactions between alien goldenrods (Solidago and Euthamia species) and comparison with native species in Central Europe. Flora-Morphol. Distrib. Funct. Ecol. Plants 2016, 218, 51–61. [Google Scholar] [CrossRef]
  3. Melville, M.R.; Morton, J.K. A biosystematic study of the Solidago canadensis (Compositae) complex. I. The Ontario populations. Can. J. Bot. 1982, 60, 976–997. [Google Scholar] [CrossRef]
  4. Semple, J.C.; Ringius, G.S.; Leeder, C.; Morton, G. Chromosome numbers of goldenrods, Euthamia and Solidago (Compositae: Astereae). II. Additional counts with comments on cytogeography. Brittonia 1984, 36, 280–292. [Google Scholar] [CrossRef]
  5. Van Kleunen, M.; Schmid, B. No evidence for an evolutionary increased competitive ability in an invasive plant. Ecology 2003, 84, 2816–2823. [Google Scholar] [CrossRef] [Green Version]
  6. Cheng, J.; Li, J.; Zhang, Z.; Lu, H.; Chen, G.; Yao, B.; Dong, Y.; Ma, L.; Yuan, X.; Xu, J. Autopolyploidy-driven range expansion of a temperate-originated plant to pan-tropic under global change. Ecol. Monogr. 2020, 91, e01445. [Google Scholar] [CrossRef]
  7. Voser-Huber, M.L. Studien an Eingebürgerten Arten der Gattung solidago L.: Probleme mit S. gigantea, S. canadensis und S. graminifolia in Naturschutzgebieten des Schweizerischen Mittellandes; Lubrecht & Cramer Limited: Port Jervis, NY, USA, 1983. [Google Scholar]
  8. Schlaepfer, D.R.; Edwards, P.J.; Billeter, R. Why only tetraploid Solidago gigantea (Asteraceae) became invasive: A common garden comparison of ploidy levels. Oecologia 2010, 163, 661–673. [Google Scholar] [CrossRef] [Green Version]
  9. Semple, J.C.; Rahman, H.; Bzovsky, S.; Sorour, M.K.; Kornobis, K.; Laphitz, R.L.; Tong, L. A multivariate morphometric study of the Solidago altissima complex and S. canadensis (Asteraceae: Astereae). Phytoneuron 2015, 10, 1–31. [Google Scholar]
  10. Croat, T. Solidago canadensis complex of the Great Plains. Brittonia 1972, 24, 317–326. [Google Scholar] [CrossRef]
  11. Dong, M.; Lu, J.Z.; Zhang, W.J.; Chen, J.K.; Li, B. Canada goldenrod (Solidago canadensis): An invasive alien weed rapidly spreading in China. J. Syst. Evol. 2006, 44, 72. [Google Scholar] [CrossRef]
  12. Weber, E. Biological flora of central Europe: Solidago altissima L. Flora 2000, 195, 123–134. [Google Scholar] [CrossRef]
  13. Verloove, F.; Zonneveld, B.J.; Semple, J.C. First evidence for the presence of invasive Solidago altissima (Asteraceae) in Europe. Willdenowia 2017, 47, 69–75. [Google Scholar] [CrossRef] [Green Version]
  14. Kato-Noguchi, H.; Kato, M. Allelopathy and Allelochemicals of Solidago canadensis L. and S. altissima L. for Their Naturalization. Plants 2022, 11, 3235. [Google Scholar] [CrossRef] [PubMed]
  15. Szymura, M.; Szymura, T.H. Historical contingency and spatial processes rather than ecological niche differentiation explain the distribution of invasive goldenrods (Solidago and Euthamia). Plant Ecol. 2016, 217, 565–582. [Google Scholar] [CrossRef] [Green Version]
  16. Musiał, K.; Pagitz, K.; Gudžinskas, Z.; Łazarski, G.; Pliszko, A. Chromosome numbers in hybrids between invasive and native Solidago (Asteraceae) species in Europe. Phytotaxa 2020, 471, 267–275. [Google Scholar] [CrossRef]
  17. Pliszko, A.; Zalewska-Gałosz, J. Molecular evidence for hybridization between invasive Solidago canadensis and native S. virgaurea. Biol. Invasions 2016, 18, 3103–3108. [Google Scholar] [CrossRef] [Green Version]
  18. Hayward, A.C.; Tollenaere, R.; Dalton-Morgan, J.; Batley, J. Molecular marker applications in plants. Plant Genotyping 2015, 1245, 13–27. [Google Scholar]
  19. Guo, X.; Ren, M.; Ding, J. Do the introductions by botanical gardens facilitate the invasion of Solidago canadensis (Asterceae) in China? Weed Res. 2016, 56, 442–451. [Google Scholar] [CrossRef]
  20. Prentis, P.J.; Wilson, J.R.; Dormontt, E.E.; Richardson, D.M.; Lowe, A.J. Adaptive evolution in invasive species. Trends Plant Sci. 2008, 13, 288–294. [Google Scholar] [CrossRef]
  21. Tsutsui, N.D.; Suarez, A.V.; Holway, D.A.; Case, T.J. Reduced genetic variation and the success of an invasive species. Proc. Natl. Acad. Sci. USA 2000, 97, 5948–5953. [Google Scholar] [CrossRef] [Green Version]
  22. Te Beest, M.; Le Roux, J.J.; Richardson, D.M.; Brysting, A.K.; Suda, J.; Kubešová, M.; Pyšek, P. The more the better? The role of polyploidy in facilitating plant invasions. Ann. Bot. 2012, 109, 19–45. [Google Scholar] [CrossRef] [PubMed] [Green Version]
  23. Pandit, M.K.; White, S.M.; Pocock, M.J. The contrasting effects of genome size, chromosome number and ploidy level on plant invasiveness: A global analysis. New Phytol. 2014, 203, 697–703. [Google Scholar] [CrossRef] [PubMed] [Green Version]
  24. Suda, J.; Meyerson, L.A.; Leitch, I.J.; Pyšek, P. The hidden side of plant invasions: The role of genome size. New Phytol. 2015, 205, 994–1007. [Google Scholar] [CrossRef] [PubMed]
  25. Husband, B.C.; Baldwin, S.J.; Suda, J. The incidence of polyploidy in natural plant populations: Major patterns and evolutionary processes. In Plant Genome Diversity Volume 2; Springer: Vienna, Austria, 2013; pp. 255–276. [Google Scholar]
  26. Glennon, K.; Ritchie, M.; Segraves, K. Evidence for shared broad-scale climatic niches of diploid and polyploid plants. Ecol. Lett. 2014, 17, 574–582. [Google Scholar] [CrossRef] [PubMed]
  27. Broz, A.K.; Manter, D.K.; Bowman, G.; Müller-Schärer, H.; Vivanco, J.M. Plant origin and ploidy influence gene expression and life cycle characteristics in an invasive weed. BMC Plant Biol. 2009, 9, 33. [Google Scholar] [CrossRef] [Green Version]
  28. Hamilton, J.A.; Miller, J.M. Adaptive introgression as a resource for management and genetic conservation in a changing climate. Conserv. Biol. 2016, 30, 33–41. [Google Scholar] [CrossRef]
  29. Pfennig, K.S.; Kelly, A.L.; Pierce, A.A. Hybridization as a facilitator of species range expansion. Proc. R. Soc. B Biol. Sci. 2016, 283, 20161329. [Google Scholar] [CrossRef] [Green Version]
  30. Liu, S.; Chen, S.; Chen, Y.; Guan, Z.; Yin, D.; Chen, F. In vitro induced tetraploid of Dendranthema nankingense (Nakai) Tzvel. shows an improved level of abiotic stress tolerance. Sci. Hortic. 2011, 127, 411–419. [Google Scholar] [CrossRef]
  31. Soliman, W.S.; Fujimori, M.; Tase, K.; Sugiyama, S.-i. Heat tolerance and suppression of oxidative stress: Comparative analysis of 25 cultivars of the C3 grass Lolium perenne. Environ. Exp. Bot. 2012, 78, 10–17. [Google Scholar] [CrossRef]
  32. Tu, Y.; Jiang, A.; Gan, L.; Hossain, M.; Zhang, J.; Peng, B.; Xiong, Y.; Song, Z.; Cai, D.; Xu, W. Genome duplication improves rice root resistance to salt stress. Rice 2014, 7, 15. [Google Scholar] [CrossRef] [Green Version]
  33. Moura, R.F.; Queiroga, D.; Vilela, E.; Moraes, A.P. Polyploidy and high environmental tolerance increase the invasive success of plants. J. Plant Res. 2021, 134, 105–114. [Google Scholar] [CrossRef] [PubMed]
  34. Wang, C.J.; Wan, J.Z.; Qu, H.; Zhang, Z.X. Climatic niche shift of aquatic plant invaders between native and invasive ranges: A test using 10 species across different biomes on a global scale. Knowl. Manag. Aquat. Ecosyst. 2017, 418, 27. [Google Scholar] [CrossRef] [Green Version]
  35. Atwater, D.Z.; Ervine, C.; Barney, J.N. Climatic niche shifts are common in introduced plants. Nat. Ecol. Evol. 2018, 2, 34–43. [Google Scholar] [CrossRef] [PubMed] [Green Version]
  36. Ni, M.; Deane, D.C.; Li, S.; Wu, Y.; Sui, X.; Xu, H.; Chu, C.; He, F.; Fang, S. Invasion success and impacts depend on different characteristics in non-native plants. Divers. Distrib. 2021, 27, 1194–1207. [Google Scholar] [CrossRef]
  37. Padilla-García, N.; Šrámková, G.; Záveská, E.; Šlenker, M.; Clo, J.; Zeisek, V.; Lučanová, M.; Rurane, I.; Kolář, F.; Marhold, K. Niche differentiation following whole-genome duplication? The importance of considering the intricate evolutionary history of polyploids when assessing climatic niche evolution. bioRxiv 2022. [Google Scholar] [CrossRef]
  38. Parisod, C.; Holderegger, R.; Brochmann, C. Evolutionary consequences of autopolyploidy. New Phytol. 2010, 186, 5–17. [Google Scholar] [CrossRef]
  39. Španiel, S.; Marhold, K.; Hodálová, I.; Lihová, J. Diploid and tetraploid cytotypes of Centaurea stoebe (Asteraceae) in Central Europe: Morphological differentiation and cytotype distribution patterns. Folia Geobot. 2008, 43, 131–158. [Google Scholar] [CrossRef]
  40. Treier, U.A.; Broennimann, O.; Normand, S.; Guisan, A.; Schaffner, U.; Steinger, T.; Müller-Schärer, H. Shift in cytotype frequency and niche space in the invasive plant Centaurea maculosa. Ecology 2009, 90, 1366–1377. [Google Scholar] [CrossRef] [Green Version]
  41. Schlaepfer, D.R.; Edwards, P.J.; Semple, J.C.; Billeter, R. Cytogeography of Solidago gigantea (Asteraceae) and its invasive ploidy level. J. Biogeogr. 2008, 35, 2119–2127. [Google Scholar] [CrossRef]
  42. Schlaepfer, D.R.; Edwards, P.J.; Widmer, A.; Billeter, R. Phylogeography of native ploidy levels and invasive tetraploids of Solidago gigantea. Mol. Ecol. 2008, 17, 5245–5256. [Google Scholar] [CrossRef]
  43. Cheng, J.; Yang, X.; Xue, L.; Yao, B.; Lu, H.; Tian, Z.; Li, J.; Zhou, X.; Zhang, Y.; Zia Ul Haq, M. Polyploidization contributes to evolution of competitive ability: A long term common garden study on the invasive Solidago canadensis in China. Oikos 2020, 129, 700–713. [Google Scholar] [CrossRef]
  44. Xu, J.; Xue, L.; Qiang, S. Comparison on morphological characteristics of different cellular types of Solidago canadensis from native and introduced ranges at seedling stage. J. Plant Resour. Environ. 2018, 27, 44–51. [Google Scholar]
  45. Yang, X.; Cheng, J.; Yao, B.; Lu, H.; Zhang, Y.; Xu, J.; Song, X.; Sowndhararajan, K.; Qiang, S. Polyploidy-promoted phenolic metabolism confers the increased competitive ability of Solidago canadensis. Oikos 2021, 130, 1014–1025. [Google Scholar] [CrossRef]
  46. Weber, E. Current and potential ranges of three exotic goldenrods (Solidago) in Europe. Conserv. Biol. 2001, 15, 122–128. [Google Scholar] [CrossRef]
  47. Szymura, M.; Szymura, T.H.; Kreitschitz, A. Morphological and cytological diversity of goldenrods (Solidago L. and Euthamia Nutt.) from south-western Poland. Biodivers. Res. Conserv. 2015, 38, 41–49. [Google Scholar] [CrossRef] [Green Version]
  48. Weber, E.; Schmid, B. Das neophytenproblem. Diss. Bot. 1993, 196, 209–227. [Google Scholar]
  49. Follak, S.; Eberius, M.; Essl, F.; Fürdös, A.; Sedlacek, N.; Trognitz, F. Invasive alien plants along roadsides in Europe. EPPO Bull. 2018, 48, 256–265. [Google Scholar] [CrossRef]
  50. Abhilasha, D.; Quintana, N.; Vivanco, J.; Joshi, J. Do allelopathic compounds in invasive Solidago canadensis s.l. restrain the native European flora? J. Ecol. 2008, 96, 993–1001. [Google Scholar] [CrossRef]
  51. Weber, E. Morphological variation of the introduced perennial Solidago canadensis L. sensu lato (Asteraceae) in Europe. Bot. J. Linn. Soc. 1997, 123, 197–210. [Google Scholar] [CrossRef]
  52. Eckert, S.; Herden, J.; Stift, M.; Joshi, J.; van Kleunen, M. Manipulation of cytosine methylation does not remove latitudinal clines in two invasive goldenrod species in Central Europe. Mol. Ecol. 2021, 30, 222–236. [Google Scholar] [CrossRef]
  53. Suda, J.; Krahulcová, A.; Trávníek, P.; Krahulec, F. Ploidy level versus DNA ploidy level: An appeal for consistent terminology. Taxon 2006, 55, 447–450. [Google Scholar] [CrossRef]
  54. Doležel, J.; Greilhuber, J.; Suda, J. Estimation of nuclear DNA content in plants using flow cytometry. Nat. Protoc. 2007, 2, 2233–2244. [Google Scholar] [CrossRef] [PubMed]
  55. Semple, J.C.; Uesugi, A. Solidago altissima var. pluricephala (Asteraceae: Astereae) in Australia, Tonga, and Hawaii. Phytoneuron 2017, 40, 1–16. [Google Scholar]
  56. Szymura, M.; Szymura, T.H. Soil preferences and morphological diversity of goldenrods (Solidago L.) from south-western Poland. Acta Soc. Bot. Pol. 2013, 82, 107–115. [Google Scholar] [CrossRef] [Green Version]
  57. Szymura, M.; Szymura, T.H. Growth, phenology, and biomass allocation of alien Solidago species in central Europe. Plant Species Biol. 2015, 30, 245–256. [Google Scholar] [CrossRef]
  58. Navas, M.-L.; Moreau-Richard, J. Can traits predict the competitive response of herbaceous Mediterranean species? Acta Oecologica 2005, 27, 107–114. [Google Scholar] [CrossRef]
  59. Schnitzler, A.; Muller, S. Ecology and biogeography of highly invasive plants in Europe: Giant knotweeds from Japan (Fallopia japonica and F. sachalinensis). Rev. d’Ecologie 1998, 53, 3–38. [Google Scholar]
  60. Sattler, M.C.; Carvalho, C.R.; Clarindo, W.R. The polyploidy and its key role in plant breeding. Planta 2016, 243, 281–296. [Google Scholar] [CrossRef]
  61. Thébault, A.; Gillet, F.; Müller-Schärer, H.; Buttler, A. Polyploidy and invasion success: Trait trade-offs in native and introduced cytotypes of two Asteraceae species. Plant Ecol. 2011, 212, 315–325. [Google Scholar] [CrossRef] [Green Version]
  62. Vichiato, M.R.d.M.; Vichiato, M.; Pasqual, M.; Rodrigues, F.A.; Castro, D.M.D. Morphological effects of induced polyploidy in Dendrobium nobile Lindl.(Orchidaceae). Crop Breed. Appl. Biotechnol. 2014, 14, 154–159. [Google Scholar] [CrossRef]
  63. Hülskamp, M. Plant trichomes: A model for cell differentiation. Nat. Rev. Mol. Cell Biol. 2004, 5, 471–480. [Google Scholar] [CrossRef] [PubMed]
  64. Hartnett, D.C.; Abrahamson, W.G. The effects of stem gall insects on life history patterns in Solidago canadensis. Ecology 1979, 60, 910–917. [Google Scholar] [CrossRef]
  65. Bicknell, R.; Boase, M.; Morgan, E. Developing polyploid genotypes of Leptospermum scoparium. N. Z. J. Crop Hortic. Sci. 2019, 47, 273–281. [Google Scholar] [CrossRef]
  66. Denaeghel, H.E.; Van Laere, K.; Leus, L.; Lootens, P.; Van Huylenbroeck, J.; Van Labeke, M.-C. The variable effect of polyploidization on the phenotype in Escallonia. Front. Plant Sci. 2018, 9, 354. [Google Scholar] [CrossRef] [PubMed] [Green Version]
  67. Kameyama, Y.; Kudo, G. Flowering phenology influences seed production and outcrossing rate in populations of an alpine snowbed shrub, Phyllodoce aleutica: Effects of pollinators and self-incompatibility. Ann. Bot. 2009, 103, 1385–1394. [Google Scholar] [CrossRef] [PubMed] [Green Version]
  68. Sax, D.F.; Brown, J.H. The paradox of invasion. Glob. Ecol. Biogeogr. 2000, 9, 363–371. [Google Scholar] [CrossRef]
  69. Bradshaw, A.D. Evolutionary significance of phenotypic plasticity in plants. Adv. Genet. 1965, 13, 115–155. [Google Scholar]
  70. Schlichting, C.D. The evolution of phenotypic plasticity in plants. Annu. Rev. Ecol. Syst. 1986, 17, 667–693. [Google Scholar] [CrossRef]
  71. Szymura, M.; Szymura, T.H.; Rajsz, A.; Świerszcz, S. Is phenotypic plasticity an explanation for the invasiveness of goldenrods (Solidago and Euthamia) in Europe? Plant Species Biol. 2019, 34, 73–84. [Google Scholar] [CrossRef]
  72. Du, L.; Liu, H.; Yan, M.; Li, J.; Li, J. Individual plasticity of the shade response of the invasive Solidago canadensis in China. PLoS ONE 2017, 12, e0170049. [Google Scholar] [CrossRef] [Green Version]
  73. Li, J.; Liu, H.; Yan, M.; Du, L. No evidence for local adaptation to salt stress in the existing populations of invasive Solidago canadensis in China. PLoS ONE 2017, 12, e0175252. [Google Scholar] [CrossRef] [PubMed] [Green Version]
  74. Jakobs, G.; Weber, E.; Edwards, P.J. Introduced plants of the invasive Solidago gigantea (Asteraceae) are larger and grow denser than conspecifics in the native range. Divers. Distrib. 2004, 10, 11–19. [Google Scholar] [CrossRef]
  75. van Kleunen, M.; Fischer, M. Adaptive rather than non-adaptive evolution of Mimulus guttatus in its invasive range. Basic Appl. Ecol. 2008, 9, 213–223. [Google Scholar] [CrossRef] [Green Version]
  76. Halverson, K.; Heard, S.B.; Nason, J.D.; Stireman III, J.O. Origins, distribution, and local co-occurrence of polyploid cytotypes in Solidago altissima (Asteraceae). Am. J. Bot. 2008, 95, 50–58. [Google Scholar] [CrossRef] [PubMed] [Green Version]
  77. Broennimann, O.; Treier, U.A.; Müller-Schärer, H.; Thuiller, W.; Peterson, A.; Guisan, A. Evidence of climatic niche shift during biological invasion. Ecol. Lett. 2007, 10, 701–709. [Google Scholar] [CrossRef] [PubMed] [Green Version]
  78. Perera, P.C.D.; Szymura, T.H.; Zając, A.; Chmolowska, D.; Szymura, M. Drivers of Solidago species invasion in Central Europe—Case study in the landscape of the Carpathian Mountains and their foreground. Ecol. Evol. 2021, 11, 12429–12444. [Google Scholar] [CrossRef] [PubMed]
  79. Cheng, J. Study on the Mechanism of Successful Invasion of Solidago canadensis Driven by Polyploidization. Ph.D. Thesis, Nanjing Agricultural University, Nanjing, China, 2020. [Google Scholar]
  80. Montagnani, C.; Casazza, G.; Gentili, R.; Caronni, S.; Citterio, S. Kudzu in Europe: Niche conservatism for a highly invasive plant. Biol. Invasions 2022, 24, 1017–1032. [Google Scholar] [CrossRef]
  81. Petitpierre, B.; Kueffer, C.; Broennimann, O.; Randin, C.; Daehler, C.; Guisan, A. Climatic niche shifts are rare among terrestrial plant invaders. Science 2012, 335, 1344–1348. [Google Scholar] [CrossRef] [Green Version]
  82. Pandit, M.K.; Pocock, M.J.; Kunin, W.E. Ploidy influences rarity and invasiveness in plants. J. Ecol. 2011, 99, 1108–1115. [Google Scholar] [CrossRef]
  83. Duchoslav, M.; Jandová, M.; Kobrlová, L.; Šafářová, L.; Brus, J.; Vojtěchová, K. Intricate distribution patterns of six cytotypes of Allium oleraceum at a continental scale: Niche expansion and innovation followed by niche contraction with increasing ploidy level. Front. Plant Sci. 2020, 11, 591137. [Google Scholar] [CrossRef]
  84. Wilfried, T. Biodiversity: Climate change and the ecologist. Nature 2007, 448, 7153. [Google Scholar]
  85. Wan, J.Z.; Chen, L.X.; Gao, S.; Song, Y.B.; Tang, S.L.; Yu, F.H.; Li, J.M.; Dong, M. Ecological niche shift between diploid and tetraploid plants of Fragaria (Rosaceae) in China. S. Afr. J. Bot. 2019, 121, 68–75. [Google Scholar] [CrossRef]
  86. Galbraith, D.W.; Harkins, K.R.; Maddox, J.M.; Ayres, N.M.; Sharma, D.P.; Firoozabady, E. Rapid flow cytometric analysis of the cell cycle in intact plant tissues. Science 1983, 220, 1049–1051. [Google Scholar] [CrossRef] [PubMed]
  87. Arumuganathan, K.; Earle, E. Estimation of nuclear DNA content of plants by flow cytometry. Plant Mol. Biol. Report. 1991, 9, 229–241. [Google Scholar] [CrossRef]
  88. Suda, J.; Trávníček, P. Reliable DNA ploidy determination in dehydrated tissues of vascular plants by DAPI flow cytometry—New prospects for plant research. Cytom. Part A 2006, 69, 273–280. [Google Scholar] [CrossRef]
  89. R Core Team. R: A Language and Environment for Statistical Computing, version 3.6.0; R Foundation for Statistical Computing: Vienna, Austria, 2019. [Google Scholar]
Figure 1. Phylogenetic tree of all S. canadensis populations based on ribosomal ITS and trnH-psbA intergenic spacer sequences. Blue represents Europe populations; green represents populations identified previously as S. altissima.
Plants 12 01113 g001
Figure 2. Flow cytometric ploidy analysis of populations in Europe. (a) Glycine max Merr. ‘Polanka of which DNA content is 2.5 pg [54], was used as an internal reference, therefore DNA content of the diploid population (CA09) is 2.15 pg. (bk) The relative nuclear DNA content of each population, native diploid population (CA09) used as the internal reference.
Plants 12 01113 g002
Figure 3. A comparison of morphological traits of different geo-cytotype populations. (a) The ratio of length to width, (b) ratio of height to stem diameter, (c) cluster analysis based on 11 phenotypic traits. CN represents the population of China, EU represents the population of Europe, JP represents the population of Japan, NA represents the population of North America, and RUS represents the population of Russia; S. altissima includes populations of North America and Japan. Different lowercase letters indicate significance.
Plants 12 01113 g003
Figure 4. Distribution of different cytotypes of S. canadensis in Europe. (A) Distribution of different ploidy populations in Europe, (B) geographical differentiation of different ploidy populations, (C) comparison of latitudes, and (D) mean temperatures of July of different ploidy populations. Different lowercase letters indicate significance.
Plants 12 01113 g004
Figure 5. Comparison of latitude (a) and mean temperature of July (b) of different geo-cytotypes of S. canadensis in different regions. Note: CN represents the population of China, EU represents the population of Europe, JP represents the population of Japan, NA represents the population of North America, and RUS represents the population of Russia. Different lowercase letters indicate significance.
Plants 12 01113 g005
Table 1. Test of ITS sequences of Solidago canadensis blasted in NCBI database.
Population CodesAccession Number from GenbankSpeciesQuery CoverHomology Comparison to S. canadensisVariable Sites
EU01HQ142590.1Solidago canadensis100%100%
EU02HQ142590.1Solidago canadensis100%100%
EU03HQ142590.1Solidago canadensis100%100%
EU09MT610958.1Solidago canadensis100%100%
EU10MT610958.1Solidago canadensis100%99.85%492 (A→G)
EU11 MT610958.1Solidago canadensis100%99.85%433 (T→C)
EU12MT610958.1Solidago canadensis100%100%
EU13MT610958.1Solidago canadensis100%100%
EU14MT610958.1Solidago canadensis100%99.85%499 (C→T)
EU15MT610958.1Solidago canadensis100%100%
Table 2. Test of psbA-trnH intergenic spacer sequences of Solidago canadensis blasted in NCBI database.
Population CodesAccession Number from GenbankSpeciesQuery CoverHomology Comparison to S. canadensisVariable Sites
EU01KX214929.1Solidago canadensis100%100%
EU02KX214929.1Solidago canadensis100%99.53%12 (C→-)
EU03KX214929.1Solidago canadensis100%100%
EU09KX214780.1Solidago canadensis100%100%
EU10KX214780.1Solidago canadensis100%100%
EU11KX214780.1Solidago canadensis100%100%
EU12KX214780.1Solidago canadensis100%100%
EU13KX214780.1Solidago canadensis100%100%
EU14KX214780.1Solidago canadensis100%100%
EU15KX214780.1Solidago canadensis100%100%
Table 3. A comparison of morphological traits of different geo-cytotype populations in different regions and closely related species.
GroupHeight/cmStem
Diameter/mm
Leaf Length/cmLeaf Width/cmNumber of
Epidermal Hairs on the Main Vein per 2 mm
Number of
Epidermal Hairs on the Lateral Vein per 2 mm
Number of
Epidermal Hairs on the Netted
Venation per 4 mm2
Length of the Ray
Floret/mm
Height of
Involucre/
mm
Number of Ray FloretsNumber of Disc Florets
NA-2x62.5 ± 2.89 c3.39 ± 0.25 d8.98 ± 1.61 g1.17 ± 0.37 c61.95 ± 10.79 a31.22 ± 5.33 ab53.71 ± 8.67 a6.07 ± 0.82 bcd3.84 ± 0.51 ef10.5 ± 2.68 b3.6 ± 1.28 cd
NA-4x128.78 ± 34.86 b6.45 ± 1.58 cd13.12 ± 2.53 de2.16 ± 0.46 b58.5 ± 10.72 a29.39 ± 4.9 b50.9 ± 11.52 a6.03 ± 1.27 bcd4.72 ± 0.52 b12.87 ± 3.3 a4.96 ± 1.87 b
NA-6x137.99 ± 30.06 ab7.3 ± 1.92 cd13.78 ± 2.67 cd2.2 ± 0.57 ab60.2 ± 12.03 a32.34 ± 6.98 a50.55 ± 12.5 a5.9 ± 0.93 cd3.97 ± 0.45 def8.57 ± 1.74 cd3.53 ± 1.34 cd
RUS-2x62.4 ± 1.95 c4.07 ± 0.25 cd12.11 ± 1.4 ef2.01 ± 0.28 bc53.82 ± 6.76 ab23.22 ± 3.38 c31.48 ± 3.85 bc5.61 ± 0.6 de4.17 ± 0.28 cd9.71 ± 2.25 bc3.92 ± 1.06 c
EU-2x64.46 ± 2.64 c3.88 ± 0.46 d11.21 ± 1.39 f2.07 ± 0.42 b55.67 ± 4.9 ab22.29 ± 2.87 cd33.41 ± 2.82 b5.25 ± 0.36 e3.57 ± 0.47 f10.96 ± 1.65 b3.48 ± 0.59 cd
EU-6x141.22 ± 14.63 ab10.72 ± 1.29 ab15.48 ± 1.94 b2.82 ± 0.56 a53.75 ± 3.68 ab20.63 ± 2.32 cd31.31 ± 5.08 bc5.83 ± 0.34 cde4.13 ± 0.31 cde10.84 ± 0.8 b3.24 ± 0.52 cd
JP-6x139.16 ± 5.92 ab10.18 ± 0.55 b14.9 ± 2.19 bcd2.62 ± 0.72 ab50.42 ± 12.91 b22.61 ± 3.95 cd19.55 ± 6.81 cd5.38 ± 0.68 de3.97 ± 0.61 def9.89 ± 1.47 bc3.45 ± 0.86 cd
CN-2x66.54 ± 4.27 c3.88 ± 0.6 d7.28 ± 1.28 h1 ± 0.15 c42.8 ± 4.24 b21.47 ± 4.48 cd26.19 ± 4.01 bcd4.82 ± 0.42 e3.32 ± 0.31 f9 ± 1.05 bcd4.4 ± 0.84 bc
CN-4x145.66 ± 21.41 a10.05 ± 2.39 b15.39 ± 2.23 b2.71 ± 1.1 a52.1 ± 15.26 b21.55 ± 7.44 cd26.21 ± 16.43 bcd6.44 ± 0.65 b4.32 ± 0.62 c10.18 ± 1.84 bc3.32 ± 1.1 cd
CN-6x143.11 ± 19.5 ab10.2 ± 2.01 b15.88 ± 2.01 b2.68 ± 0.47 a50.44 ± 13.24 b22.07 ± 6.57 cd26.4 ± 12.18 bcd6.08 ± 0.81 bc4.29 ± 0.49 c9.83 ± 1.35 bc3.2 ± 0.87 d
S. altissima137.82 ± 7.03 ab10.45 ± 0.84 ab14.91 ± 2.44 bc2.62 ± 0.64 ab50.8 ± 10.43 b22.04 ± 4.8 cd19.04 ± 5.89 cd5.08 ± 0.67 de3.74 ± 0.64 ef9.65 ± 1.24 bc3.59 ± 0.74 cd
S. decurrens106.67 ± 4.51 cb7.57 ± 0.5 bcd8.71 ± 0.76 gh2.02 ± 0.11 bc0.73 ± 0.12 d1.39 ± 0.65 e1.83 ± 0.47 e12.38 ± 0.76 a6.86 ± 0.65 a5.85 ± 0.31 d13.7 ± 2.19 a
S. gigantea144.11 ± 11.92 ab12.51 ± 0.8 a21.74 ± 2.94 a2.87 ± 0.33 a19.65 ± 2.22 c14.02 ± 2.86 de12.36 ± 1.15 d5.31 ± 0.6 e3.7 ± 0.36 ef10.2 ± 1.18 bc6.01 ± 1.02 b
S. simplex112.33 ± 5.51 bc8.57 ± 0.7 bc7.06 ± 2.04 h1.99 ± 0.37 bc16.73 ± 4.1 c10.33 ± 2.12 de16.67 ± 7.79 cd4.59 ± 0.3 e4.01 ± 0.12 ef9.18 ± 0.95 bcd2.68 ± 0.38 d
CN represents the population of China, EU represents the population of Europe, JP represents the population of Japan, NA represents the population of North America, and RUS represents the population of Russia; S. altissima includes populations of North America and Japan. Different lowercase letters indicate significance.
Disclaimer/Publisher’s Note: The statements, opinions and data contained in all publications are solely those of the individual author(s) and contributor(s) and not of MDPI and/or the editor(s). MDPI and/or the editor(s) disclaim responsibility for any injury to people or property resulting from any ideas, methods, instructions or products referred to in the content.

