Abstract
Bacillus subtilis was applied in peat-based soilless cultivation systems containing a mixed substrate (peat:vermiculite:perlite = 2:1:1, v/v/v) and irrigated by one-strength or four-strength Hoagland’s nutrient solution to explore whether it can alleviate inhibition by higher-nutrient solutions (four-strength) and bring benefits to improvements of quality. The results showed that higher-nutrient solutions improved the flavor quality of cucumber fruit; especially, the contents of (E,Z)-2,6-nonadienal and (E)-2-Nonenal were effectively increased, which are the special flavor substances of cucumber. B. subtilis K424 effectively improved growth performance, photosynthetic capacity, vitamin C content, soluble sugars, soluble protein, and total pectin in cucumber under higher nutrition solution conditions. Compared with the higher solution treatment, the bacterial diversity significantly increased, whereas the presence of fungi had no significant difference following the B. subtilis K424 application. Moreover, B. subtilis K424 reduced the relative abundance of Actinomadura and promoted that of the Rhodanobacter, Bacillus, Pseudomonas, Devosiaceae, and Blastobotrys genera. Redundancy analysis showed that Bacillus, Rhodanobacter, and Blastobotrys were positively correlated with the substrate enzyme of sucrase, catalase, and urease. This study provides insight that B. subtilis K424 mitigated the deleterious effects of high levels of nutrition solution on cucumber growth and quality by improving the substrate enzyme, regulating the microbial community structure, and enhancing the photosynthetic capacity.
1. Introduction
Soilless cultivation, the most efficient and intensive plant production method, is recognized globally in the horticulture industry nowadays [1]. Compared with traditional soil culture, soilless culture has higher yields, efficiency, and quality. The substrate-based soilless culture technology is widely used in China, with the organic substrate containing certain nutrients as the carrier, the cultivation production cost being reduced, and the farming operation being simplified. The advantages are not limited by region, which can greatly expand the agricultural production space, expand the application of noncultivated land, and avoid continuous cropping obstacles in protected cultivation. However, the application of a soilless culture system is closely related to the management of nutrient solutions [2].
Increasing nutrient solution concentration in soilless culture can improve plant quality, but higher salinity in nutrition solutions declined the osmotic ability of environment water and resulted in reduce water uptake by plants, which is beneficial to the accumulation of soluble solids. The saline-nutrient solution applied in hydroponics is a suitable system for sea fennel growth, which gives a slightly salty but high-quality product [3]. The total soluble solid and lycopene concentration of tomato fruits increased with increasing electrical conductivity levels [4]. In addition, salinity led to an imbalance in the nutritional occurrence of oxidative stress and finally decreased plant productivity. Recently, there has been interest in the application of microorganisms in vegetable soilless culture, which could be beneficial to induce plant resistance to biotic and abiotic stress factors and to increase plant growth and yield [5].
Many commercial microbial agents are mainly based on plant growth-promoting rhizobacteria (PGPR), such as Bacillus or Pseudomonas, which have been used in different countries [6]. The primary mechanisms probably involve the synthesis of various hormones [7,8], increasing the availability of plant nutrients in the rhizosphere [9], and inducing systemic resistance in host plants [10,11]. In addition, they help improve the quality of the soil, such as its physicochemical properties and enzyme activities, which help the growth of rhizosphere microbial communities [12]. The composition of the rhizosphere microbial community is an important factor determining plant health [13], which is also very important for maintaining the healthy and stable microenvironment of plant rhizospheres and successfully relieving various stresses [14].
It is generally believed that higher concentrations of nutrient solutions can improve the impact on the quality of fruit, but it will cause an inhibition of growth. In this study, B. subtilis K424 was applied in peat-based soilless cultivation systems which contained a mixed substrate and were irrigated with one-strength or four-strength Hoagland’s nutrient solution, to explore whether it can alleviate the inhibition of growth and bring benefits to the improvement of quality, and to research the potential mechanisms involved in plant tolerance with respect to the composition of microbial communities.
2. Results
2.1. Growth of Cucumber Seedlings
Higher-nutrient solutions (treatment N) seriously decreased the growth of cucumber seedlings, plant height, and stem diameter, which were significantly suppressed compared to the control. However, the B. subtilis K424 application had increased effects on the growth of cucumber seedlings under normal and higher-nutrient solutions (Figure 1). Under high nutrient stress, the plant biomass of the cucumber plants pretreated with B. subtilis K424 significantly increased after 10 days of irrigation, and the plant growth increased by 1.08–1.14 times compared with untreated plants. It showed that B. subtilis K424 application alleviated the inhibition of plant growth induced by high nutrition.
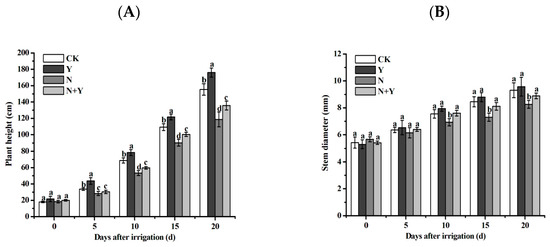
Figure 1.
Effects of different treatments on the growth indices of the cucumbers at different time points. (A) Plant height; (B) stem diameter. Different treatments: CK (control), seedlings were irrigated with a normal nutrient solution; Y, control + B. subtilis K424; N, four-strength control; N + Y, four-strength control + B. subtilis K424. Each histogram represents the mean ± SE of three independent biological experiments (n = 3). Different letters above the bars indicate statistically significant differences by Duncan’s test (p < 0.05).
2.2. Gas Exchange Parameters
Generally, compared to CK, the leaf gas exchange parameters were significantly increased by the Y treatment, whereas Pn and GS were largely decreased by the N treatment. However, the levels of Pn and Gs were enhanced in the N + Y treatment, indicating that B. subtilis K424 can effectively alleviate photosynthetic inhibition caused by high nutrition (Table 1).

Table 1.
Photosynthetic characteristics of cucumber leaves under different treatments.
2.3. Fruit Qualities in Fresh Cucumbers
To determine whether B. subtilis K424 application could effectively change the cucumbers’ qualities, we tested the moisture content, vitamin C, soluble sugar, titratable acidity, sugar/acid, soluble protein, total pectin, soluble solids, and aroma components (Table 2 and Table 3). As shown in Table 2, after the Y treatment, the content of vitamin C and soluble protein improved the most, with values 29.73% and 13.42% higher than the control treatment (CK), respectively. Furthermore, the N treatment significantly increased the content of titratable acidity but decreased the soluble sugar, sugar/acid, vitamin C, soluble protein, and total pectin compared with the N + Y treatment. The highest reduction could be seen for sugar/acid, with a decrease of 31.34%.
Table 2.
Fruit qualities of fresh cucumbers under different treatments.
Table 3.
The relative contents and aroma compounds of fresh cucumbers in different treatments.
As shown in Table 3, a total of 49 volatile components were identified and quantified in different treatments of cucumber: 26 in CK, 29 in the Y treatment, 33 in the N treatment, and 34 in the N + Y treatment. Aldehydes and hydrocarbons were the most abundant compounds in all treatments, representing 54.47–80.59% and 14.39–39.05% of the total content of the volatile components. Compared to the normal nutrient solution-irrigated treatment (CK and Y), the relative contents of (E,Z)-2,6-nonadienal and (E)-2-Nonenal were effectively increased, but there was no significant difference between the treatment of N and N + Y. These results showed that high nutrition application could improve the fruit’s aroma, whereas B. subtilis K424 application had no significant effect under high nutrition stress.
2.4. Substrate Enzyme Activities
The changes of cucumber growth media enzyme activities including urease, catalase, peroxidase, and sucrase among different treatments were shown in Table 4. Compared to CK, the treatments of Y and N significantly increased the activities of urease and catalase by 46.32–111.18% and 5.26–14.04%, respectively. In addition, compared to the N treatment, the N + Y treatment significantly enhanced the activity of sucrase, but there were no significant differences for the other enzyme activities.
Table 4.
Effects of cucumber rhizospheric growth media enzyme activities in different treatments.
2.5. Sequencing and Microbial Diversity Analysis
A total of 802,315 16S rRNA gene sequences and 780,785 fungal ITS sequences were analyzed across the 12 substrate samples, with an average of 66,860 and 65,065 sequences per substrate sample for bacteria and fungi, respectively (Table 5).
Table 5.
Retained sequences that were used for further analysis after removing the short, ambiguous, and low-quality reads of the rhizospheric samples collected from different treatments.
For all the samples, the Shannon index curves reached near plateaus, indicating that the amount of sequencing data was large enough and the information of the most microbial species had been covered in the samples (Figure 2).
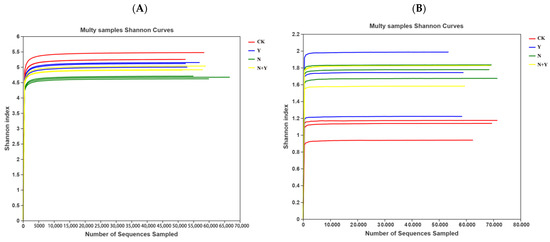
Figure 2.
Shannon index curves at 97% similarity levels of rhizospheric growth media samples collected from different treatments. Different treatments: CK (control), seedlings were irrigated with normal nutrient solution; Y, control + B. subtilis K424; N, four-strength control; N + Y, four-strength control + B. subtilis. K424 (A) bacteria; (B) fungi.
Based on 97% species similarity, a total of 2493 OTUs for bacteria and 356 OTUs for fungi were identified, with 922 and 105 OTUs overlapped for bacteria and fungi, respectively (Figure 3). Venn diagrams also showed 241, 117, 50, and 135 unique bacterial OTUs in the CK, Y, N, and N + Y treatments, respectively, whereas 24, 23, 27, and 41 unique OTUs were detected for fungi, respectively.
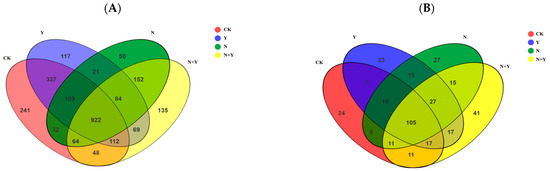
Figure 3.
Venn diagrams about unique and shared OTUs of samples collected from different treatments. Different treatments: CK (control), seedlings were irrigated with normal nutrient solution; Y, control + B. subtilis K424; N, four-strength control; N + Y, four-strength control + B. subtilis. K424 (A) bacteria; (B) fungi.
Alpha diversity analysis showed that the Chao 1 value and ACE in the N + Y-treated soil were generally not significantly different (p ≤ 0.05) than those in the N-treated sample, indicating no significant difference in microbial community richness (Table 6). However, the higher Shannon and lower Simpson indexes for bacteria showed that B. subtilis K424 increased the bacterial community diversity under high nutrition stress. For fungi, the Shannon and Simpson indexes showed no significantly different results.
Table 6.
The diversity and richness estimates for the different rhizosphere samples at 97% similarity.
2.6. Microbial Community Structure
A principal coordinate analysis (PCoA) based on the Bray–Curtis algorithm clearly revealed differences in microbial communities across the four treatments (Figure 4). The Bray–Curtis algorithm revealed that all treatments were clearly separated from each other (ANOSIM: R = 1.000, p = 0.001 for bacteria; R = 0.775, p = 0.001 for fungi). Especially, the Y and N + Y treatments were clearly separated from the other two treatments along the second principal component (PC2) for the bacterial community.
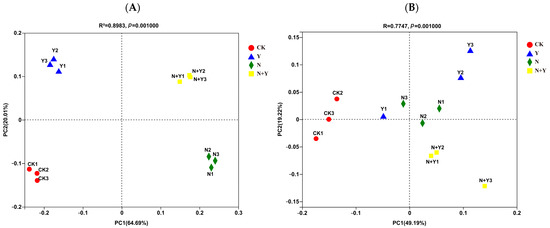
Figure 4.
Principal coordinate analysis based on the distance matrix calculated using the Bray–Curtis algorithm for samples collected from different treatments. Different treatments: CK (control), seedlings were irrigated with normal nutrient solution; Y, control + B. subtilis K424; N, four-strength control; N + Y, four-strength control + B. subtilis. K424 (A) bacteria; (B) fungi.
2.7. Effects of B. subtilis K424 Application on the Rhizospheric Microbial Community Composition
At the phylum level, 15 bacterial and 3 fungal phyla were identified in all treatments (Figure 5). Of the bacterial phyla, Proteobacteria, Actinobacteria, Bacteroidetes, Patescibacteria, and Firmicutes were more abundant in all treatments. B. subtilis K424 application (Y and N + Y treatments) more greatly enriched the relative abundances of Proteobacteria and Firmicutes compared with non-inoculation conditions (CK and N treatments). Of the fungal phyla, the Y treatment had a higher relative abundance of Ascomycota and lower levels of Basidiomycota compared with CK, whereas these showed no significant difference between the N and N + Y treatments.
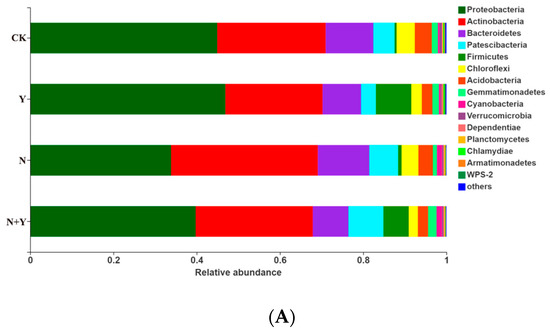
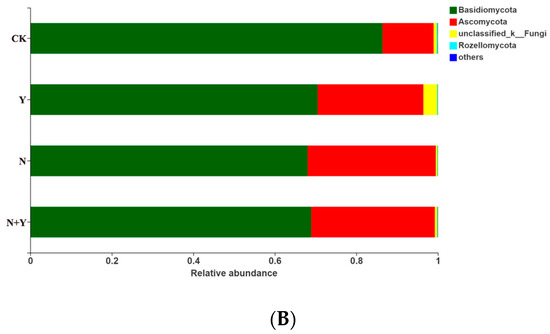
Figure 5.
The relative abundance of bacterial (A) and fungal phyla (B) in samples collected from different treatments. Different treatments: CK (control), seedlings were irrigated with normal nutrient solution; Y, control + B. subtilis K424; N, four-strength control; N + Y, four-strength control + B. subtilis K424. “Others” indicates phyla with an extremely low abundance (<0.1%).
At the genus level, the analysis of the top 15 classified genera revealed significant differences between different treatments (Figure 6A). Both the Y and N + Y treatments significantly enriched the genera Rhodanobacter, Bacillus, Pseudomonas, and Devosiaceae and depleted Actinomadura compared with the soil treated with CK and N (false discovery rate (FDR)-adjusted p < 0.05, Kruskal–Wallis H test). The relative abundance of the top 15 classified fungal genera (Figure 6B) was not sufficiently enriched in comparison with the bacterial genera. Among the top 15 classified fungal genera, only Blastobotrys was significantly more enriched in the Y and N + Y conditions compared with the sample treated with the nutrient solution treatments of CK and N (false discovery rate (FDR)-adjusted p < 0.05, Kruskal–Wallis H test).
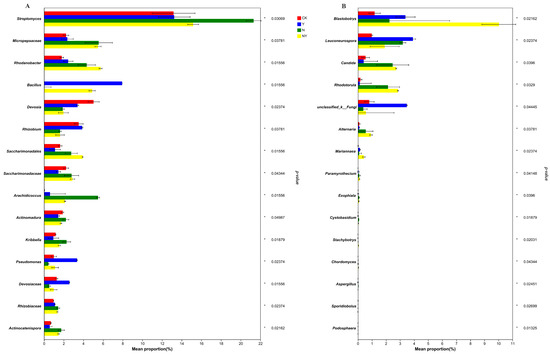
Figure 6.
The top 15 classified bacterial (A) and fungal genera (B) in samples collected from different treatments. Different treatments: CK (control), seedlings were irrigated with normal nutrient solution; Y, control + B. subtilis K424; N, four-strength control; N + Y, four-strength control + B. subtilis K424.
2.8. Correlation between Rhizospheric Microbiota and Substrate Indexes
A Mantel test based on the selected indexes of substrate and top 10 bacterial or fungal genera abundance revealed a significant correlation in the microbial communities (Bray–Curtis distance, r = 0.821, p = 0.001 for bacteria and r = 0.522, p = 0.005 for fungi). The RDA analysis showed that the first and second RDA components were able to explain 68.19% and 47.42% of the total bacterial and fungal communities, respectively (Figure 7). As shown by their close grouping and vectors, Bacillus and Rhodanobacter, which had a higher relative abundance upon Y and N + Y treatment, displayed strong associations with sucrase, catalase, and urease. While the fungal genus, the abundance of Blastobotrys was positively correlated with sucrase, catalase, and urease.
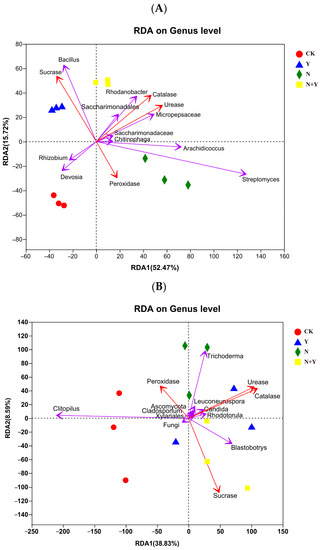
Figure 7.
Redundancy analysis (RDA) based on the OTUs of the top 10 bacterial (A) and fungal (B) genera and selected environmental variables for samples collected from different treatments. Different treatments: CK (control), seedlings were irrigated with normal nutrient solution; Y, control + B. subtilis K424; N, four-strength control; N + Y, four-strength control+ B. subtilis K424.
3. Discussion
In this study, we found that B. subtilis K424 application had a positive effect on the growth of cucumber plants, fruit quality, and photosynthesis, suggesting that B. subtilis K424 had the capacity to alleviate the toxic effects of salinity stress (higher-strength nutrition) on the plant growth and photosynthetic performance. The previous studies showed that low nutrient concentrations improved micronutrient nutrition and water use efficiency in soilless culture systems, and might be sufficient for the plant’s normal growth [15,16]. PGPR has a direct growth-promoting effect on plants, which can alleviate the damage of plants to various stresses. [17]. The fruit quality results showed that the four-strength nutrient solution increased the titratable acidity and soluble solids of the cucumber. This is in line with previous findings that titratable acidity and soluble solids will increase with salinity [18]. In addition, aldehyde compounds, particularly (E,Z)-2,6-nonadienal and (E)-2-Nonenal, have a powerful fresh cucumber odor impact [19]. Nevertheless, our results showed no significant effect on the higher-strength nutrition stress after B. subtilis K424 application. In the current study, B. subtilis K424 markedly improved the photosynthetic rate and stomatal conductance under saline stress (Table 1). Consistently, Li indicated that the maize plant photosynthesis rate and stomatal conductance under salinity stress were increased by PGPR strain [20]. Moreover, salinity can significantly reduce the gaseous exchange and total chlorophyll contents. However, the mechanism underlying the stimulation of plant photosynthesis by PGPR remains elusive [21].
Our research was carried out to explore how B. subtilis K424 application influences variations in the substrate’s enzymatic activities and rhizosphere microbiome to alleviate salinity stress. Many reports show that the plant rhizosphere can recruit many microbial components when they are attacked by biotic and abiotic stress, such as pathogens [14] and heavy metal and salt stresses [22,23]. Therefore, the application of B. subtilis K424 in our study may have an impact on the recruitment of bacteria and fungi in the cucumber rhizosphere, thereby altering various aspects of the substrate environment. Xiong et al. [24] reported that after the application of microbiological agents, the soil health was improved by the direct suppression of pathogens or via the modification of the indigenous microbial community. Compared to the N-treated sample, B. subtilis K424 application (N + Y-treated) significantly increased the Shannon index and decreased the Simpson index for bacteria, whereas those showed no significant difference for fungi (Table 6). This implied that B. subtilis K424 inoculation mainly helps to restore the rhizospheric bacterial diversity negatively affected by higher-strength nutrition. Similar to our study, soil microbial bacterial abundance or higher diversity in communities favored the ability of plants to suppress adverse environments [25,26].
Microbial diversity analysis showed that the application of B. subtilis K424 altered bacterial and fungal communities (Figure 3), consistent with previous observations that biofertilizer and PGPR inoculation generally resulted in different soil microbial community structures [14,27]. Actinobacteria was the most abundant bacterial phyla identified in the N treatment soil, in parallel with the outcome of a previous study investigating the dominant microbial phylum in saline ecosystems [28]. The phyla Proteobacteria and Firmicutes were more abundant in B. subtilis K424-applied soil, and these two phyla have evolved salt stress-tolerant genetic machinery to adapt and survive under salt-induced osmotic stresses [29,30]. Previous studies have also found higher abundances of Proteobacteria and Firmicutes in biofertilizer-treated soils [31,32]. Two fungal phyla, Ascomycota and Basidiomycota, which occupy more than 90% of the total fungal sequence, were the most dominant phyla across all samples. However, these showed no significant difference between the N and N + Y treatments. These indicated that there was a much weaker rhizosphere effect on the fungal communities than on the bacterial communities by the B. subtilis K424 application under salt stress. This is in line with our previous findings that B. subtilis K424 significantly increased the bacterial community diversity, whereas the presence of the fungi caused no changes under salt stress.
Genera abundance analysis showed that B. subtilis K424 increased the abundance of Rhodanobacter, Bacillus, Pseudomonas, Devosiaceae, and Blastobotrys in the rhizosphere samples (Figure 6). Previous studies have shown that Rhodobacter, Bacillus, and Pseudomonas promote plant growth even under adverse environmental conditions [29,33]. In addition, the Pseudomonas species and its ability to produce exopolysaccharides (EPS) enhance tolerance to salt stress [34]. Bacillus, which produces higher expressions of antioxidant enzymes, may lead to plant cell protection in stress conditions [29,35]. In our research, the enrichment of Bacillus was probably due to the addition of B. subtilis K424. However, due to the analysis technology limitation of pyrosequencing, the information about the strain can only be classified at the genera level. RDA analysis revealed a correlation between the environmental variables and the top 10 abundant genera. The Y and N + Y treatments were dominated by Bacillus, Rhodanobacter, and Blastobotrys, which were positively correlated with sucrase, catalase, and urease. This result was similar to that of Shi et al. [14], who found that the PGPR strain, NSY50, maintained an optimal environment to alleviate stress by altering soil enzyme activities, phy-chemical properties, and microbial communities. However, the mechanisms have been poorly investigated for their complex interaction between soil properties and the microbial community.
4. Materials and Methods
4.1. Pot Experiment Design
The pot experiment was carried out in Shanxi Agricultural University, China. Cucumber seeds (Cucumis sativus L. cv. Jinchun No. 2) were surface-sterilized in 70% ethanol for 30 s, followed by 20 min of shaking in a 2% sodium hypochlorite solution, washed in sterile water three times, and placed in 10cm Petri dishes covered with sterile wet filter paper for germination in the dark at 28 °C for 24 h. Germinated seeds were transferred into quartz sand and cultivated in a greenhouse with day/night temperatures of 25–30 °C/15–18 °C and relative humidity of 60–72%. At the stage of two true leaves, the plants were transferred into pots and treated with nutrient solution after 3 days.
A pot experiment was performed using a randomized complete block design with three replicates for each treatment, where each replicate had sixteen plants, and each pot (diameter, 250 mm; volume 3200 mL) had one plant contained a mixed substrate (peat: vermiculite: perlite = 2:1:1, v/v/v).
Four treatments were designed as follows: (1) CK, untreated substrate without B. subtilis K424, and the plants were irrigated with one-strength Hoagland’s nutrient solution (Ca(NO3)2·4H2O 945 mg/L, KNO3 607 mg/L, NH4H2PO4 115 mg/L, MgSO4·7H2O 493 mg/L, EDTA-NaFe 30 mg/L, H3BO3 2.86mg/L, MnSO4·4H2O 2.13 mg/L, ZnSO4·7H2O 0.22 mg/L, CuSO4·5H2O 0.08 mg/L, (NH4)6Mo7O24·4H2O 0.02mg/L), (2) Y, treated substrate with B. subtilis K424, and the plants were irrigated one-strength Hoagland’s nutrient solution, (3) N, untreated substrate without B. subtilis K424, and the plants were irrigated four-strength Hoagland’s nutrient solution, and (4) N + Y, treated substrate with B. subtilis K424, and the plants were irrigated with four-strength Hoagland’s nutrient solution. The B. subtilis K424, isolated from the greenhouse soil by our laboratory at Shanxi Agricultural University, was added to and thoroughly mixed with the substrate before planting, which contained 108 cfu/g. Each pot was supplemented with 1.5 g B. subtilis K424. The whole growth process was supplemented with an equivalent volume nutrient solution 5 times every week, and the growth period lasted for 60 days.
4.2. Assays of Growth Indices
The plant heights and stem diameters were recorded manually every 5 days after the first supplementation of the nutrient solution. Three seedlings were randomly selected from each treatment with three replications.
4.3. Determination of Leaf Photosynthetic Parameters
The gas exchange parameters of the fully expanded leaves, which were the third leaves from the base of the stem, were measured using a portable photosynthesis system (LI-6400, LI-COR Inc., Lincoln, NE, USA), with the light intensity, external CO2 concentration, leaf temperatures, and RH in the assimilation chamber maintained at 1000 µmol photons m−2 s−1, 380 ± 10 µmol mol−1, 25 °C, and 70%, respectively. The photosynthetic parameters of photosynthetic rate (Pn), stomatal conductance (Gs), intercellular CO2 concentration (Ci), and transpiration rate (Tr) were measured ten days after nutrient solution treatment.
4.4. Determination of Qualities in Fresh Cucumbers
Cucumbers reaching commercial maturity standards of about 30 cm were harvested. In the full fruit period, the cucumber fruits with consistent growth, and the same nodes were picked to determine the related quality and fruit aroma indicators.
The moisture content of the fruit was determined with direct drying in a 45 °C oven. The vitamin C content was analyzed using the method of Gül et al. [5]. The titratable acidity was determined using 0.1 mol·L−1 NaOH to neutralize all the titratable protons up to pH 8.1. The soluble protein was determined using the method of Bradford [36]. The soluble sugar was analyzed using the method of Blakeney and Mutton [37]. The total soluble solid was determined using an automatic temperature-compensated digital refractometer (Atago Pallette PR101, Atago Co., Tokyo, Japan). The total pectin was assayed by the Carbazole colorimetry method [38].
Solid phase micro-extraction and gas chromatography–mass spectrometry (GC–MS) were used to explore the aroma components of the cucumber fruits. Cucumbers without peel (exocarp tissue) were blended for 30 s using a mechanical blender just before extraction. Immediately after blending, a 10 mL sample paste was placed into a 15 mL sealed headspace vial. The samples were continuously extracted in a 40 °C water bath for 40 min. After extraction, the fiber was manually removed from the vial and immediately inserted into the GC–MS injector for analysis.
A 7890A GC system (Agilent Technologies, Santa Clara, CA, USA) combined with a 5975C MSD (Agilent Technologies) was used for GC–MS analysis. The chromatographic column was an HP-INNWAX (60 m × 0.25 mm × 0.25 µm), with high-purity helium as the gas carrier, at a flow rate of 1.0 mL/min. The injector temperature was 220 °C, and it was equipped with a splitless injector. The temperature was set initially to 40 °C (held for 2.5 min) and increased to 230 °C at 6 °C/ min (held for 7 min). The MS ion source temperature was 250 °C, and the electron energy was 70 eV. The scan range was 35–400 amu, the emission current was 100 µA, and the detection voltage was 1.4 kV.
4.5. Analysis of Substrate Enzyme Activity and DNA Extraction
The rhizosphere substrate samples were obtained from the three biological replicate pots after harvesting the fruits, and each collected sample (sieved 2 mm) was divided into two portions. One portion was air-dried for evaluating the soil enzyme activity, and the other portion was frozen at −80 °C for DNA extraction.
The substrate urease activity was analyzed using the method of Kandeler and Gerber [39]. The catalase activity was determined according the method of Xue and Huang [40]. The methods of Ge et al. [41] and Bartha and Bordeleau [42] were used to assay the sucrase and peroxidase activity, respectively.
Total DNA was extracted from 0.5 g of each fresh substrate sample using a Power soil DNA Extraction kit (MOBIO Laboratories, Carlsbad, CA, USA) following the manufacturer’s instructions. The concentration and quality of the extracted DNA were quantified with an Eppendorf Biophotometer plus (Eppendorf, Germany), and the DNA was stored at −20 °C.
4.6. PCR Amplification and Miseq Sequencing
The bacterial community composition was assessed by sequencing the V3-V4 region of the 16S rRNA using the primers 338F(5′-ACTCCTACGGGAGGCAGCAG-3′) and 806R(5′-GGACTACHVGGGTWTCTAAT-3′). The fungal ITS region was amplified using the primer sets ITS1 (5′-CTTGGTCATTTAGAGGAAGTAA-3′) and ITS2(5′-GCTGCGTTCTTCATCGATGC-3′).
The PCR reactions were performed in a 20 μL reaction mixture containing 4 μL of 5 × FastPfu Buffer, 2 μL of 2.5 mM dNTPs, 0.8 μL of each primer (5 μM), 0.4 μL of FastPfu Polymerase, 0.2 μL of BSA, and 10 ng of template DNA. The PCR reactions were conducted using the following program: initiation at 95 °C for 3 min, 30 (bacteria) or 36 (fungi) cycles of denaturation at 95 °C for 30 s, annealing at 55 °C for 30 s, and extension at 72 °C for 45 s, and a final elongation at 72 °C for 10 min. The samples were checked and extracted from a 2% agarose gel, and then further purified using a PCR purification kit (Axygen Biosciences, Union City, CA, USA). The PCR products were quantified using QuantiFluor™-ST (Promega, Madison, WI, USA) according to the manufacturer’s protocol.
High-throughput sequencing was performed on the Illumina MiSeq sequencer at Majorbio Bio-pharm Technology Co., Ltd., (Shanghai, China). Briefly, the raw sequences were processed using QIIME (version 1.9.1). The operational taxonomic units (OTUs) were clustered using UPARSE (version 7.0.1090) with a 97% similarity threshold. According to OTUs information, a series of in-depth visual analyses were performed, such as the community composition of multiple samples, multivariate analysis, and a difference significance test.
4.7. Statistical Analyses
SPSS 20.0 program (SPSS Inc., Chicago, IL, USA) was used to statistically analyze the data. The significance between the treatments was assessed by one-way analysis of variance (ANOVA) using Duncan’s test.
According to the NIST08.L MS data library, the chromatographic peaks were analyzed and identified. The relative content of volatile matter was calculated by the formula:
Relative content (%) = single constituent area/total area × 100%
The venn diagrams and Alpha-diversity (ACE, Chao1, Shannon, and Simpson index) indices were calculated according to the OTU assignment using Mothur software (version v.1.30.2. https://mothur.org/wiki/calculators/, accessed on 1 January 2023). The ACE and Chao1 indexes measured the species richness and the number of species. Shannon and Simpson indexes were used to measure species diversity, which was affected by the species richness and the community evenness in the sample community. Principal Coordinate Analysis (PCoA) was performed to evaluate beta-diversities between the four treatments. The significant differences in the community structures were examined by analysis of similarity (ANOSIM). Redundancy analysis (RDA) was conducted using Canoco version 4.5 (Biometry, Wageningen, The Netherlands).
5. Conclusions
In conclusion, the results from the present study demonstrate that the application of B. subtilis K424 alleviates higher-strength nutrition stress by changing the substrate enzyme and microbial community structure, thus increasing the beneficial microbes such as Rhodanobacter, Bacillus, and Pseudomonas. Ultimately, this produces an optimal condition to stimulate plant growth and fruit quality.
Author Contributions
Conception and design of the research, L.H. and B.L.; data acquisition, D.L.; data analysis, D.L. and L.Z.; formal analysis, L.Z.; writing—original draft, D.L. and L.Z.; writing—review and editing, W.W. and Y.M.; project administration, Y.Z. and B.L. All authors have read and agreed to the published version of the manuscript.
Funding
This research was funded by the Applied Fundamental Research Program of Shanxi Province (20210302123401), the Project of Quwo Fruit and Vegetable Research Institute of Shanxi Agricultural University (2021QWGS-1), Shanxi Province Key R&D Plan (201903D211011-03), Modern Agro-industry Technology Research System in Shanxi Province (2022-08), National Natural Science Foundation of China (31501806, 31902029).
Data Availability Statement
Data are contained within the article.
Conflicts of Interest
The authors declare no conflict of interest.
References
- Barrett, G.E.; Alexander, P.D.; Robinson, J.S.; Bragg, N.C. Achieving environmentally sustainable growing media for soilless plant cultivation systems. Sci. Hortic. 2016, 212, 220–234. [Google Scholar] [CrossRef]
- Savvas, D. Nutrient solution recycling. In Hydroponic Production of Vegetables and Ornamentals; Embryo Publications: Athens, Greece, 2002; pp. 299–343. [Google Scholar]
- Amoruso, F.; Signore, A.; Gómez, P.A.; Martínez-Ballesta, M.d.C.; Giménez, A.; Franco, J.A.; Fernández, J.A.; Egea-Gilabert, C. Effect of Saline-Nutrient Solution on Yield, Quality, and Shelf-Life of Sea Fennel (Crithmum maritimum L.) Plants. Horticulturae 2022, 8, 127. [Google Scholar] [CrossRef]
- Buck, J.; Kubota, C.; Wu, M. Effects of nutrient solution EC, plant microclimate and cultivars on fruit quality and yield of hydroponic tomatoes (Lycopersicon esculentum). In Proceedings of the VII International Symposium on Protected Cultivation in Mild Winter Climates: Production, Pest Management and Global Competition, Kissimmee, FL, USA, 23–27 March 2004; Volume 659, pp. 541–547. [Google Scholar]
- Gül, A.; Kidoglu, F.; Tüzel, Y.; Tüzel, I.H. Effects of nutrition and Bacillus amyloliquefaciens on tomato (Solanum lycopersicum L.) growing in perlite. Span. J. Agric. Res. 2008, 6, 422–429. [Google Scholar] [CrossRef]
- Kloepper, J.W.; Ryu, C.M.; Zhang, S. Induced Systemic Resistance and Promotion of Plant Growth by Bacillus spp. Phytopathology 2004, 94, 1259–1266. [Google Scholar] [CrossRef]
- Kochar, M.; Upadhyay, A.; Srivastava, S. Indole-3-acetic acid biosynthesis in the biocontrol strain Pseudomonas fluorescens Psd and plant growth regulation by hormone overexpression. Res. Microbiol. 2011, 162, 426–435. [Google Scholar] [CrossRef] [PubMed]
- Martínez-Viveros, O.; Jorquera, M.; Crowley, D.; Gajardo, G.; Mora, M. Mechanisms and practical considerations involved in plant growth promotion by rhizobacteria. J. Soil Sci. Plant Nutr. 2010, 10, 293–319. [Google Scholar] [CrossRef]
- Palacios, O.A.; Bashan, Y.; De-Bashan, L.E. Proven and potential involvement of vitamins in interactions of plants with plant growth-promoting bacteria—An overview. Biol. Fertil. Soils 2014, 50, 415–432. [Google Scholar] [CrossRef]
- Jiang, C.H.; Wu, F.; Yu, Z.Y.; Xie, P.; Guo, J.H. Study on screening and antagonistic mechanisms of Bacillus amyloliquefaciens 54 against bacterial fruit blotch (BFB) caused by Acidovorax avenae subsp. citrulli. Microbiol. Res. 2015, 170, 95–104. [Google Scholar] [CrossRef]
- Niu, D.D.; Liu, H.X.; Jiang, C.H.; Wang, Y.P.; Wang, Q.Y.; Jin, H.L.; Guo, J.H. The plant growth-promoting rhizobacterium Bacillus cereus AR156 induces systemic resistance in Arabidopsis thaliana by simultaneously activating salicylate- and jasmonate/ethylene-dependent signaling pathways. Mol. Plant Microbe Interact. 2011, 24, 533–542. [Google Scholar] [CrossRef] [PubMed]
- Ren, H.; Lv, C.; Fernández-García, V.; Huang, B.; Ding, W. Biochar and PGPR amendments influence soil enzyme activities and nutrient concentrations in a eucalyptus seedling plantation. Biomass Convers. Biorefin. 2021, 11, 1865–1874. [Google Scholar] [CrossRef]
- Palmieri, D.; Vitullo, D.; Curtis, F.D.; Lima, G. A microbial consortium in the rhizosphere as a new biocontrol approach against fusarium decline of chickpea. Plant & Soil 2017, 412, 425–439. [Google Scholar]
- Shi, L.; Du, N.; Shu, S.; Sun, J.; Li, S.; Guo, S. Paenibacillus polymyxa NSY50 suppresses Fusarium wilt in cucumbers by regulating the rhizospheric microbial community. Sci. Rep. 2017, 7, 41234. [Google Scholar] [CrossRef]
- Adams, P. Crop nutrition in hydroponics. Acta Hortic. 1993, 323, 289–306. [Google Scholar] [CrossRef]
- Morard, P.; Caumes, E.; Silvestre, J. Influence of nutritive solution concentration on the growth and mineral nutrition of tomatoes. Can. J. Plant Sci. 2004, 84, 299–304. [Google Scholar]
- Bhattacharyya, P.N.; Jha, D.K. Plant growth-promoting rhizobacteria (PGPR): Emergence in agriculture. World J. Microbiol. Biotechnol. 2012, 28, 1327–1350. [Google Scholar] [CrossRef]
- Cuartero, J.; Fernandez-Munoz, R.; Mayora, E.E.L. Tomato and salinity. Sci. Hortic. 1998, 78, 83–125. [Google Scholar] [CrossRef]
- Ligor, T.; Buszewski, B. Single-drop microextraction and gas chromatography-mass spectrometry for the determination of volatile aldehydes in fresh cucumbers. Anal. Bioanal. Chem. 2008, 391, 2283–2289. [Google Scholar] [CrossRef]
- Li, X.; Sun, P.; Zhang, Y.; Jin, C.; Guan, C. A novel PGPR strain Kocuria rhizophila Y1 enhances salt stress tolerance in maize by regulating phytohormone levels, nutrient acquisition, redox potential, ion homeostasis, photosynthetic capacity and stress-responsive genes expression. Environ. Exp. Bot. 2020, 174, 104023. [Google Scholar] [CrossRef]
- Mitter, B.; Brader, G.; Afzal, M.; Compant, S.; Sessitsch, A. Advances in Elucidating Beneficial Interactions Between Plants, Soil, and Bacteria. Adv. Agron. 2013, 121, 381–445. [Google Scholar]
- Guo, H.; Hu, Z.; Zhang, H.; Hou, Z.; Min, W. Soil Microbial Metabolic Activity and Community Structure in Drip-Irrigated Calcareous Soil as Affected by Irrigation Water Salinity. Water Air Soil Pollut. 2019, 230, 44–56. [Google Scholar] [CrossRef]
- Xiao, X.Y.; Wang, M.W.; Zhu, H.W.; Guo, Z.H.; Han, X.Q.; Zeng, P. Response of soil microbial activities and microbial community structure to vanadium stress. Ecotoxicol. Environ. Saf. 2017, 142, 200–206. [Google Scholar] [CrossRef]
- Xiong, W.; Guo, S.; Jousset, A.; Zhao, Q.; Shen, Q. Bio-fertilizer application induces soil suppressiveness against Fusarium wilt disease by reshaping the soil microbiome. Soil Biol. Biochem. 2017, 114, 238–247. [Google Scholar] [CrossRef]
- Elsas, J.D.V.; Garbeva, P.; Salles, J. Effects of agronomical measures on the microbial diversity of soils as related to the suppression of soil-borne plant pathogens. Biodegradation 2002, 13, 29–40. [Google Scholar] [CrossRef] [PubMed]
- De Boer, W.; Verheggen, P.; Klein Gunnewiek, P.J.A.; Kowalchuk, G.A.; Van Veen, J.A. Microbial community composition affects soil fungistasis. Appl. Environ. Microbiol. 2003, 69, 835–844. [Google Scholar] [CrossRef]
- Han, L.; Wang, Z.; Li, N.; Wang, Y.; Feng, J.; Zhang, X. Bacillus amyloliquefaciens B1408 suppresses Fusarium wilt in cucumber by regulating the rhizosphere microbial community. Appl. Soil Ecol. 2019, 136, 55–66. [Google Scholar] [CrossRef]
- Kadam, P.D.; Chuan, H.H. Rectocutaneous fistula with transmigration of the suture: A rare delayed complication of vault fixation with the sacrospinous ligament. Int. Urogynecol. J. 2016, 27, 155–157. [Google Scholar] [CrossRef]
- Meena, K.K.; Sorty, A.M.; Bitla, U.M.; Khushboo, C.; Priyanka, G.; Ashwani, P.; Singh, D.P.; Ratna, P.; Sahu, P.K.; Gupta, V.K. Abiotic Stress Responses and Microbe-Mediated Mitigation in Plants: The Omics Strategies. Front. Plant Sci. 2017, 8, 172–197. [Google Scholar] [CrossRef]
- Vasim, A.; Verma, M.K.; Shashank, G.; Vibha, M.; Chauhan, N.S. Metagenomic Profiling of Soil Microbes to Mine Salt Stress Tolerance Genes. Front. Microbiol. 2018, 9, 159–170. [Google Scholar]
- Shen, Z.; Ruan, Y.; Wang, B.; Zhong, S.; Su, L.; Li, R.; Shen, Q. Effect of biofertilizer for suppressing Fusarium wilt disease of banana as well as enhancing microbial and chemical properties of soil under greenhouse trial. Appl. Soil Ecol. 2015, 93, 111–119. [Google Scholar] [CrossRef]
- Shen, Z.; Ruan, Y.; Chao, X.; Zhang, J.; Li, R.; Shen, Q. Rhizosphere microbial community manipulated by 2 years of consecutive biofertilizer application associated with banana Fusarium wilt disease suppression. Biol. Fertil. Soils 2015, 51, 553–562. [Google Scholar] [CrossRef]
- Duque, A.D.B.; Samad, A.; Nybroe, O.; Antonielli, L.; Compant, S. Interaction between endophytic Proteobacteria strains and Serendipita indica enhances biocontrol activity against fungal pathogens. Plant Soil 2020, 451, 277–305. [Google Scholar] [CrossRef]
- Sen, S.; Chandrasekhar, C. Effect of PGPR on growth promotion of rice (Oryza sativa L.) under salt stress. Asian J. Plant Sci. Res. 2014, 4, 62–67. [Google Scholar]
- Khan, A.; Uddin, S.; Xue, Q.Z.; Javed, M.T.; Masood, S. Bacillus pumilus enhances tolerance in rice (Oryza sativa L.) to combined stresses of NaCl and high boron due to limited uptake of Na+. Environ. Exp. Bot. 2016, 124, 120–129. [Google Scholar] [CrossRef]
- Bradford, M.M. A rapid and sensitive method for the quantitation of microgram quantities of protein utilizing the principle of protein-dye binding. Anal. Biochem. 1976, 72, 248–254. [Google Scholar] [CrossRef] [PubMed]
- Blakeney, A.B.; Mutton, L.L. A simple colorimetric method for the determination of sugars in fruit and vegetables. J. Sci. Food Agric. 1980, 31, 889–897. [Google Scholar] [CrossRef]
- Zhang, L.; Chen, F.; Yang, H.; Sun, X.; Hui, L.; Gong, X.; Jiang, C.; Ding, C. Changes in firmness, pectin content and nanostructure of two crisp peach cultivars after storage. LWT Food Sci. Technol. 2010, 43, 26–32. [Google Scholar] [CrossRef]
- Kandeler, E.; Gerber, H. Short-term assay of soil urease activity using colorimetric determination of ammonium. Biol. Fertil. Soils 1988, 6, 68–72. [Google Scholar] [CrossRef]
- Xue, D.; Huang, X. The impact of sewage sludge compost on tree peony growth and soil microbiological, and biochemical properties. Chemosphere 2013, 93, 583–589. [Google Scholar] [CrossRef]
- Ge, G.; Li, Z.; Fan, F.; Chu, G.; Hou, Z.; Liang, Y. Soil biological activity and their seasonal variations in response to long-term application of organic and inorganic fertilizers. Plant Soil 2010, 326, 31–34. [Google Scholar] [CrossRef]
- Bartha, R.; Bordeleau, L. Cell-free peroxidases in soil. Soil Biol. Biochem. 1969, 1, 139–143. [Google Scholar] [CrossRef]
Disclaimer/Publisher’s Note: The statements, opinions and data contained in all publications are solely those of the individual author(s) and contributor(s) and not of MDPI and/or the editor(s). MDPI and/or the editor(s) disclaim responsibility for any injury to people or property resulting from any ideas, methods, instructions or products referred to in the content. |
© 2023 by the authors. Licensee MDPI, Basel, Switzerland. This article is an open access article distributed under the terms and conditions of the Creative Commons Attribution (CC BY) license (https://creativecommons.org/licenses/by/4.0/).