Article

Syzygium cumini (L.) Extract-Derived Green Titanium Dioxide Nanoparticles Induce Caspase-Dependent Apoptosis in Hepatic Cancer Cells

1
Department of Surgery, College of Medicine, Majmaah University, Al Majmaah 11952, Saudi Arabia
2
Department of Clinical Laboratory Sciences, College of Applied Medical Sciences, Jouf University, Sakaka 42421, Saudi Arabia
3
Department of Surgery, King Saud Medical City, Riyadh 12746, Saudi Arabia
4
Department of Surgery, Prince Sultan Military Medical City, As Sulimaniyah 12233, Saudi Arabia
5
Aseer Central Hospital, Abha 62523, Saudi Arabia
6
Iman General Hospital, Riyadh 12211, Saudi Arabia
7
Centre for Materials Engineering and Regenerative Medicine, Bharath Institute of Higher Education and Research, Chennai 600073, India
8
Department of Biomedical Science, Faculty of Medicine & Health Sciences, Universiti Putra Malaysia, UPM, Serdang 43400, Malaysia
*
Author to whom correspondence should be addressed.
Plants 2023, 12(18), 3174; https://doi.org/10.3390/plants12183174
Submission received: 8 March 2023 / Revised: 11 June 2023 / Accepted: 12 June 2023 / Published: 5 September 2023

Abstract

:
An aqueous extract of Syzygium cumini seeds was utilized to green synthesize titanium dioxide nanoparticles (TiO2 NPs). UV-Visible, DLS, FTIR, XRD, FESEM, TEM, SAED, EDAX, and photoluminescence spectroscopy techniques were employed to characterize the prepared TiO2 nanoparticles. The rutile crystal structure of TiO2 NPs was revealed by XRD study. The TEM and FESEM images of the TiO2 NPs revealed an average particle size of 50–100 nm. We employed EDAX to investigate the elemental compositions of TiO2 NPs. The O-Ti-O stretching bands appeared in the FTIR spectrum of TiO2 NPs at wavenumbers of 495 cm−1. The absorption edge peaks of TiO2 NPs were found in the UV-vis spectra at 397 nm. The MTT study revealed that TiO2 NPs effectively inhibited the growth of liver cancer Hep3 and Hep-G2 cells. The results of the corresponding fluorescent staining assays showed that TiO2 NPs significantly increased ROS generation, decreased MMP, and induced apoptosis in both liver cancer Hep3 and Hep-G2 cells. TiO2 nanoparticles lessened SOD, CAT, and GSH levels while augmenting MDA contents in Hep3 and Hep-G2 cells. In both Hep3 and Hep-G2 cells treated with TiO2 NPs, the Bax, CytC, p53, caspase-3, -8, and -9 expressions were remarkably augmented, while Bcl-2 expression was reduced. Overall, these findings revealed that formulated TiO2 NPs treatment considerably inhibited growth and triggered apoptosis in Hep3 and HepG2 cells.

1. Introduction

Green synthetic nanoparticles have been proposed as potential frontiers for the development of nanotechnology due to being less hazardous to humans and ecosystems. Green synthesis increasingly employs the utilization of biological agents, particularly plant extracts, in place of hazardous chemical agents [1]. Green synthesis has many benefits, including low production costs and a simple one-step process [2]. Green synthetic nanoparticles have previously made use of several plant extracts due to their convenience in production [3].
Cancer is a collection of disorders characterized by uncontrolled, unchecked cell proliferation that leads to aberrant tissue growth, collectively known as malignant neoplasm [4]. Liver cancer is the fifth most frequent cancer and the third biggest reason of cancer-related fatalities globally, accounting for over 800,000 deaths annually [5]. If untreated, patients with liver cancer have a median survival time of 1–3 months. The most promising methods for treating liver cancer are surgery, chemotherapy, and radiation therapy. Though, only about 15% of individuals are reportedly suitable for surgery. The other 85% of patients with poor prognoses, metastasis, or abnormal liver function (such as underlying cirrhosis) are directed to alternative treatments [6]. As a result, there has been a rise in the need for novel treatment approaches that are both successful and efficient at resolving these problems.
Multidrug-resistant (MDR) pathogens are a foremost public health problem because they are resistant to currently available drugs, resulting in poor therapy, disease persistence, and transmission [7]. Over the past decade, a huge amount of money has been invested in nanomaterials, with an emphasis on drug delivery systems, because of their precise targeting mechanisms, increased efficacy, and reduced adverse effects [8]. The interaction of metal oxide NPs with microbial cells and other biological systems is significantly influenced by nano-size particles; because of their larger surface-to-volume ratios and surface defects (oxygen), metal oxide (MO) NPs exhibit better antimicrobial activity than bulk particles. Reactive oxygen species (ROS) are significant antimicrobial efficacy parameters. The antimicrobial mechanism of MO NPs is the excessive production of ROS in cells, thereby facilitating cell necrosis. MO NPs (such as TiO2, ZnO, Fe2O3, and MgO) are photocatalytic semiconductors that can generate ROS on their particle surfaces when exposed to light [9].
Titanium dioxide (TiO2) nanoparticles have gained much interest in recent times because of their distinctive properties and potential utilizations in numerous areas, including medicine. In the context of anticancer activity, TiO2 NPs was studied for their capability as a drug delivery system and therapeutic agent [10]. TiO2 nanoparticles can be utilized as carriers for anticancer drugs, and their small size and high surface area that makes them suitable for encapsulating and delivering drugs to tumor sites. Researchers have explored different strategies to load anticancer drugs onto TiO2 nanoparticles, such as physical adsorption, covalent bonding, and electrostatic interactions. By functionalizing the surface of TiO2 NPs, it is able to enhance their targeting efficiency and improve drug release kinetics. This allows for controlled and targeted drug delivery [11].
TiO2 nanoparticles exhibit photocatalytic properties that can be harnessed for photodynamic therapy. In photodynamic therapy (PDT), TiO2 nanoparticles are excited by light of a specified wavelength, resulting in the production of ROS that specifically kill tumor cells. When TiO2 nanoparticles are exposed to light, they produce singlet oxygen and other ROS, which induce cell death through oxidative stress [12]. This approach has shown promise in preclinical studies and is minimally invasive and highly localized. Apart from their drug delivery and PDT applications, TiO2 NPs themselves have demonstrated potential anticancer properties [13].
Works have revealed that TiO2 NPs trigger cytotoxicity and inhibit cancer cell growth through multiple mechanisms. These mechanisms include the generation of ROS, disruption of cellular signaling pathways, interference with DNA repair mechanisms, and induction of apoptosis in tumor cells [14]. However, it is imperative to note that the effectiveness of TiO2 nanoparticles as an anticancer agent may depend on several causes, including nanoparticle size, surface functionalization, and the specific type of cancer being targeted. It is worth mentioning that while TiO2 nanoparticles hold promise for anticancer applications, further study is required to completely comprehend their safety profile, optimize their therapeutic efficacy, and overcome potential challenges associated with their use in clinical settings [15].
The green production of TiO2 NPs has received the curiosity of several researchers because of the high cost of their chemical and physical processes and the extreme reaction conditions. Therefore, plant extracts have been used by researchers in their exploration for novel low-cost routes for NPs synthesis. Syzygium cumini (S. cumini) is a popular medicinal plant that possesses antioxidant and anti-inflammatory properties [16]. In the current exploration, the TiO2 NPs were formulated by a green synthesis process using an S. cumini seed extract. The formulated TiO2 NPs were studied for their structural, morphological, optical, and antimicrobial properties.

2. Results and Discussion

Several previous studies have already highlighted the production of TiO2 NPs using plant extracts, including jasmine flower [17], lemon peel extract [18], citrus limon juice extract [18], Eichhornia crassipes extract [19], Olea europaea extract [20], lemon peel extract [21], cinnamon powder extract [22], orange peel extract [23], Jatropha curcas extract [24], and pomegranate peel extract [25]. In the current work, the TiO2 nanoparticles are synthesized via a green process using Syzygium cumini seed extract to avoid using hazardous (toxic) organic solvents, surfactants, and capping agents often used in chemical synthesis. Among them, plant-based material fabrication is reproducible, and the green synthesized nanomaterials are hydrophilic (strong affinity for water). For example, during the formation of TiO2 NPs, when 0.1 M of aqueous titanium isopropoxide solute was mixed with the Syzygium cumini seed extract solution, the homogenous Ti metal ion’s reaction mixture turned light green with a colorless white precipitate. In addition, the plant extract contains phytocomponents such as amino groups and protein groups that play crucial roles in the reduction of the Ti4+ ions to form the TiO2 NPs.

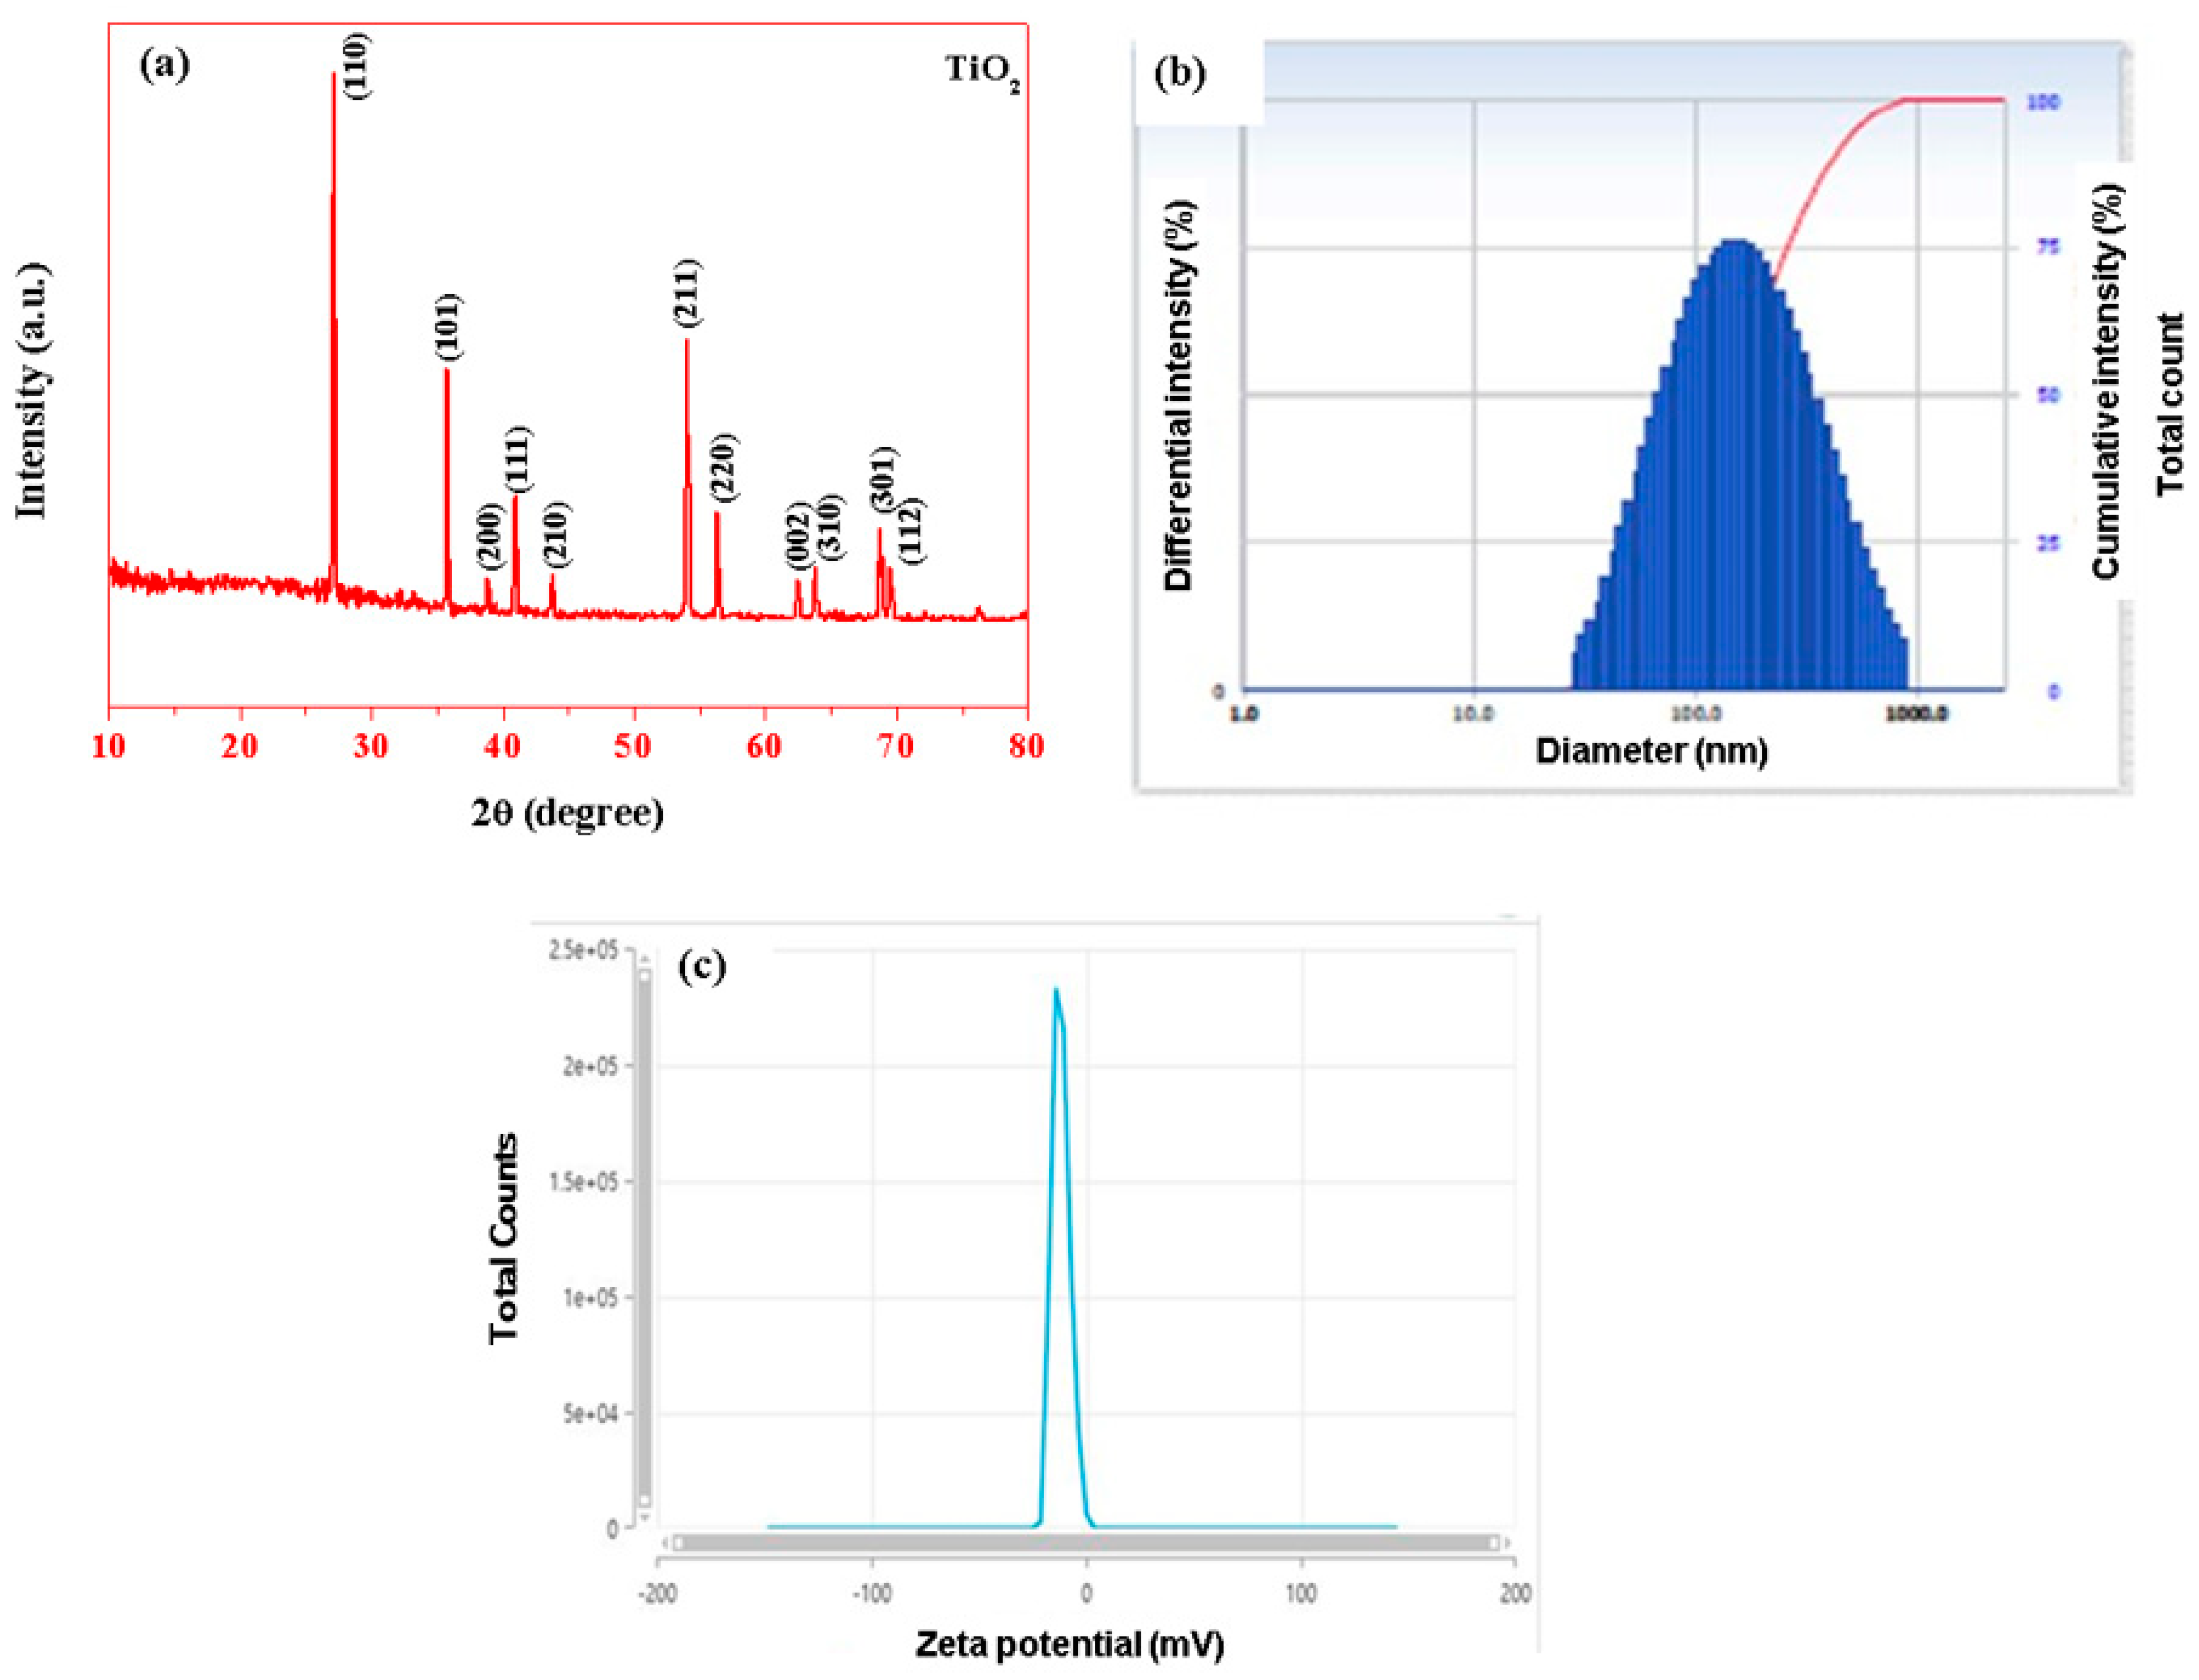
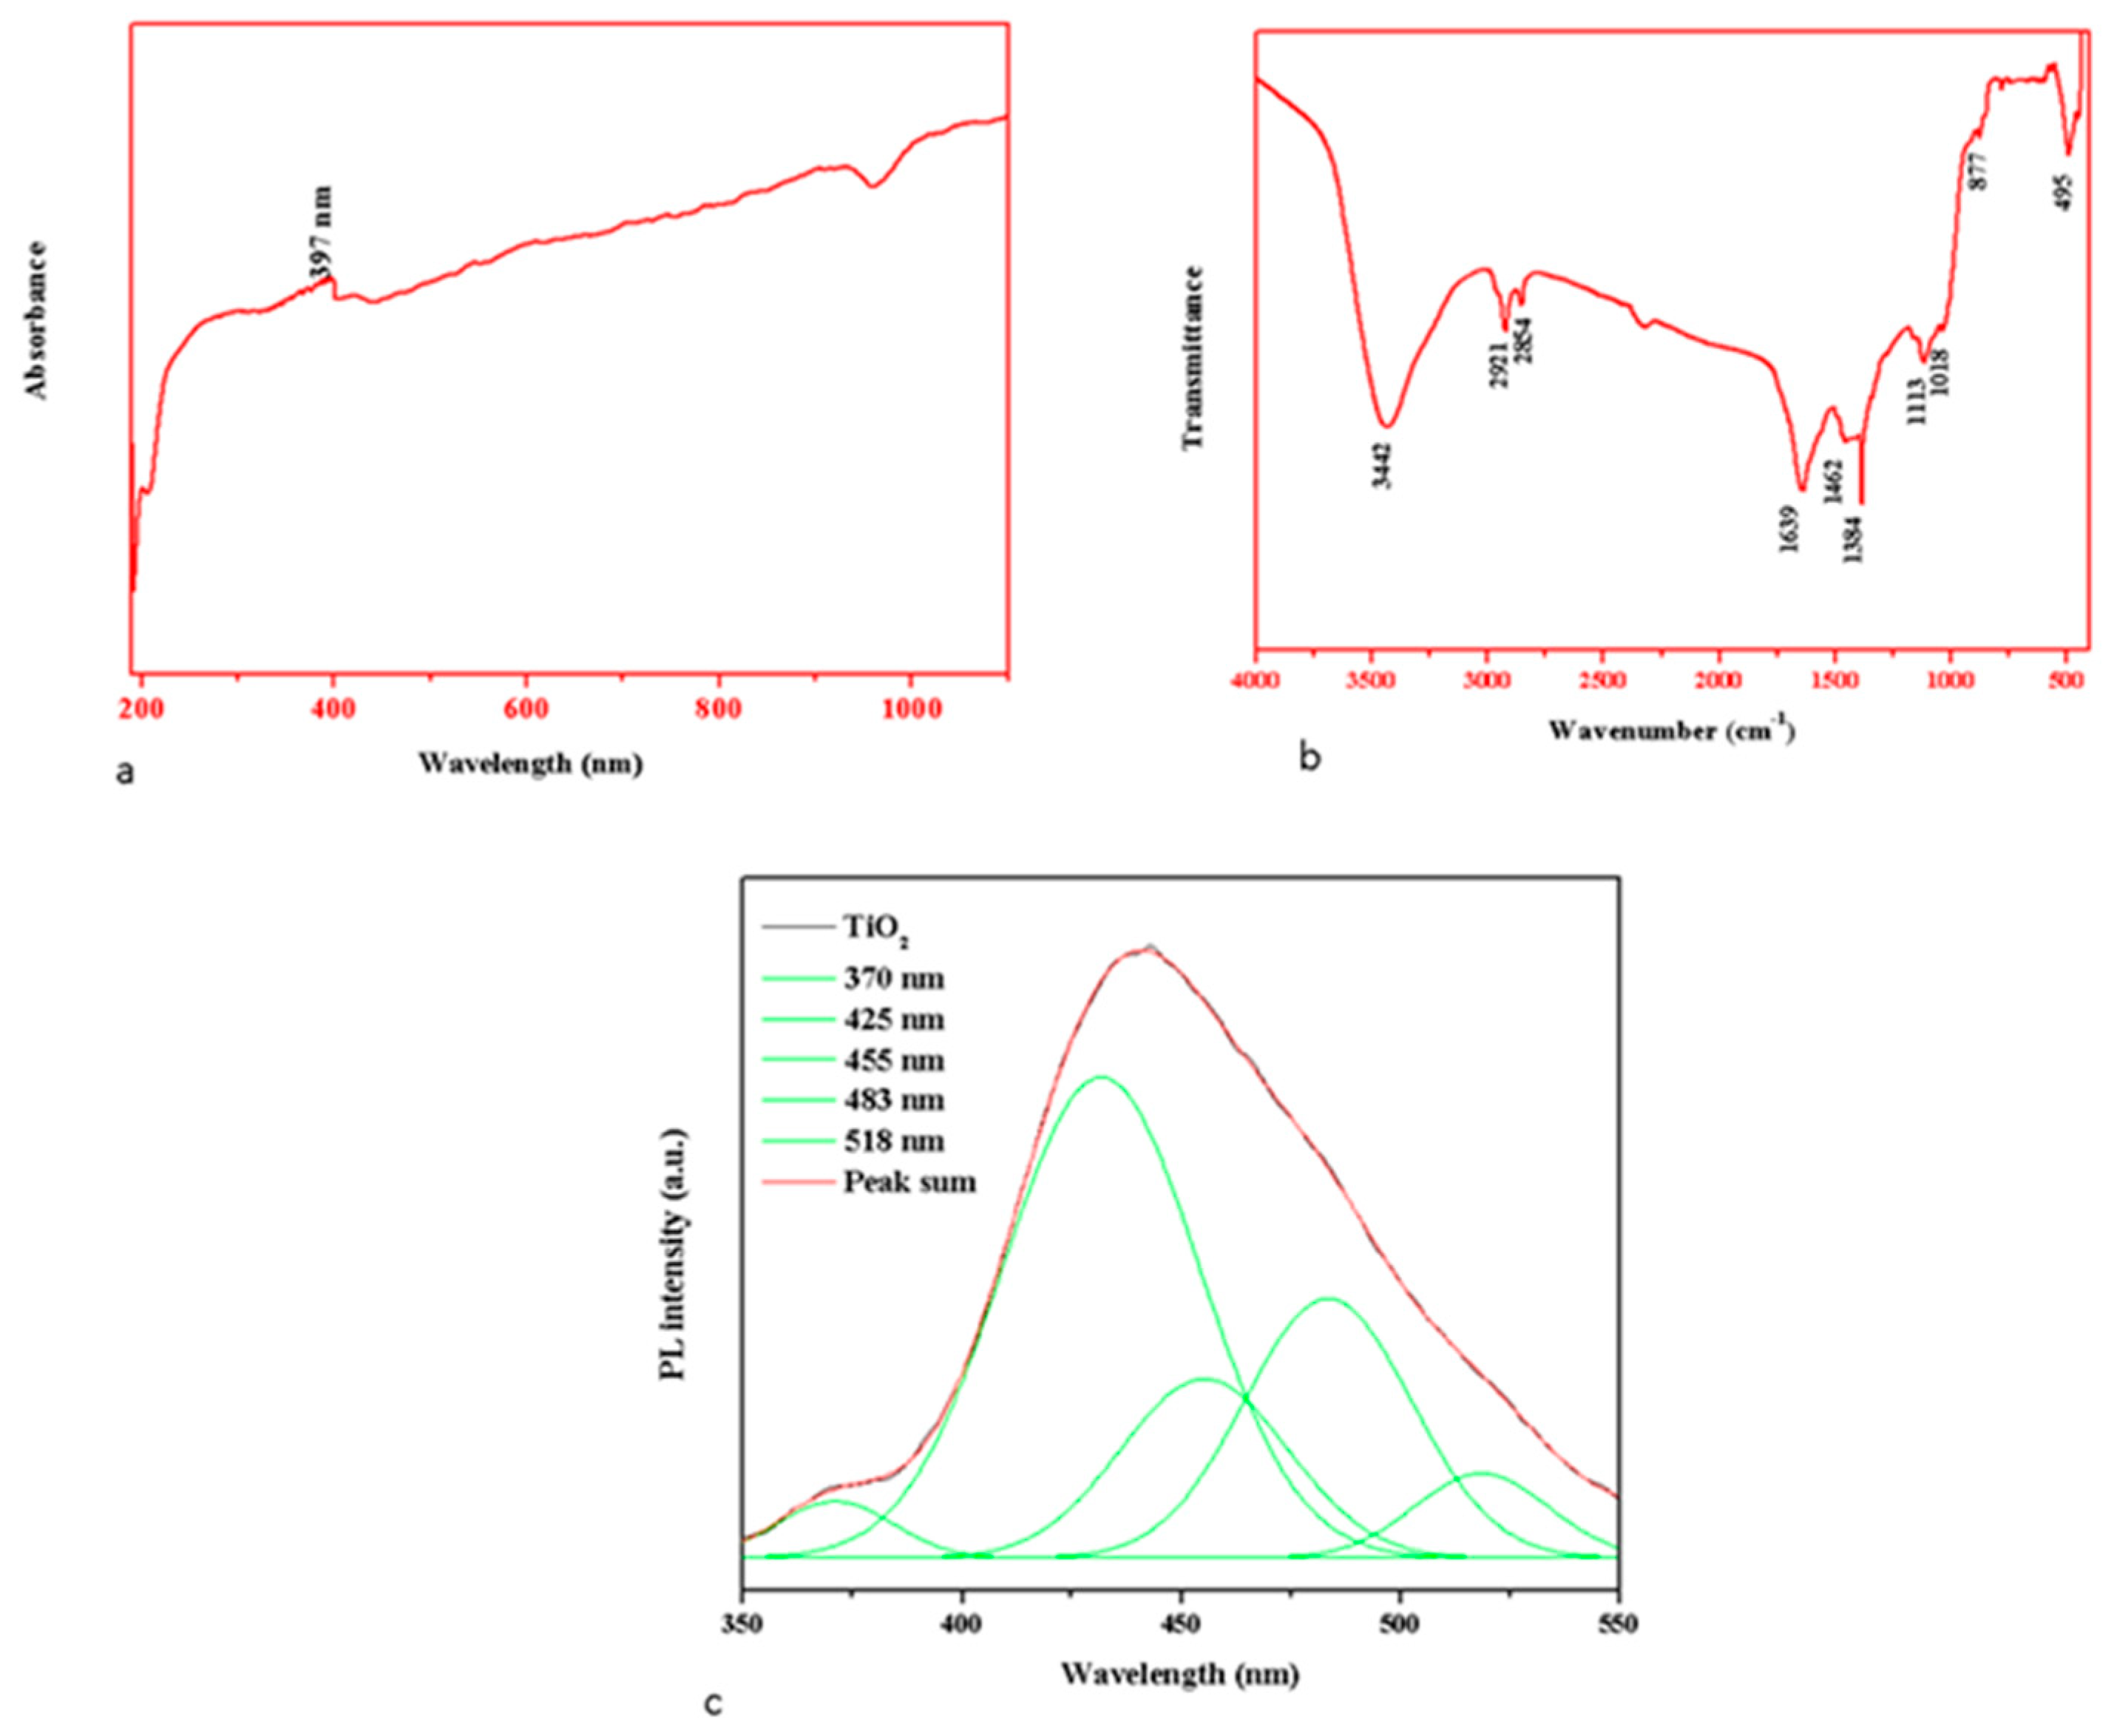
2.1. Characterization of TiO2 NPs

The XRD pattern of the highly crystalline green synthesis of TiO2 NPs is demonstrated in Figure 1a. The TiO2 NPs were found to be well crystalline titanium dioxide rutile phase (JCPDS card No: 21-1276) based on XRD results [26]. The diffraction peaks of TiO2 NPs in the rutile phase of 2θ angle were at 27.16, 35.79, 38.92, 40.97, 43.81, 54.05, 56.35, 62.45, 63.78, 68.72, and 69.50⁰, corresponding diffraction plans (110), (101), (200), (111), (210), (211), (220), (002), (310), (301), and (112), respectively. Pouteria campechiana leaf extract mediated to TiO2 NPs exhibits a rutile phase in the early literature [27]. The average particle size was calculated by the Debye Scherrer equation on the rutile diffraction peaks [28]. The average crystallite size D = k λ β D c o s θ . The average particle size was observed at 55 nm for TiO2 NPs. The hydrodynamic size of TiO2 NPs observed at 120 nm was used to measure the DLS spectrum (Figure 1b,c). The Polydispersity index (PI) was at 0.47 and the Zeta potential at −11.73 mV.

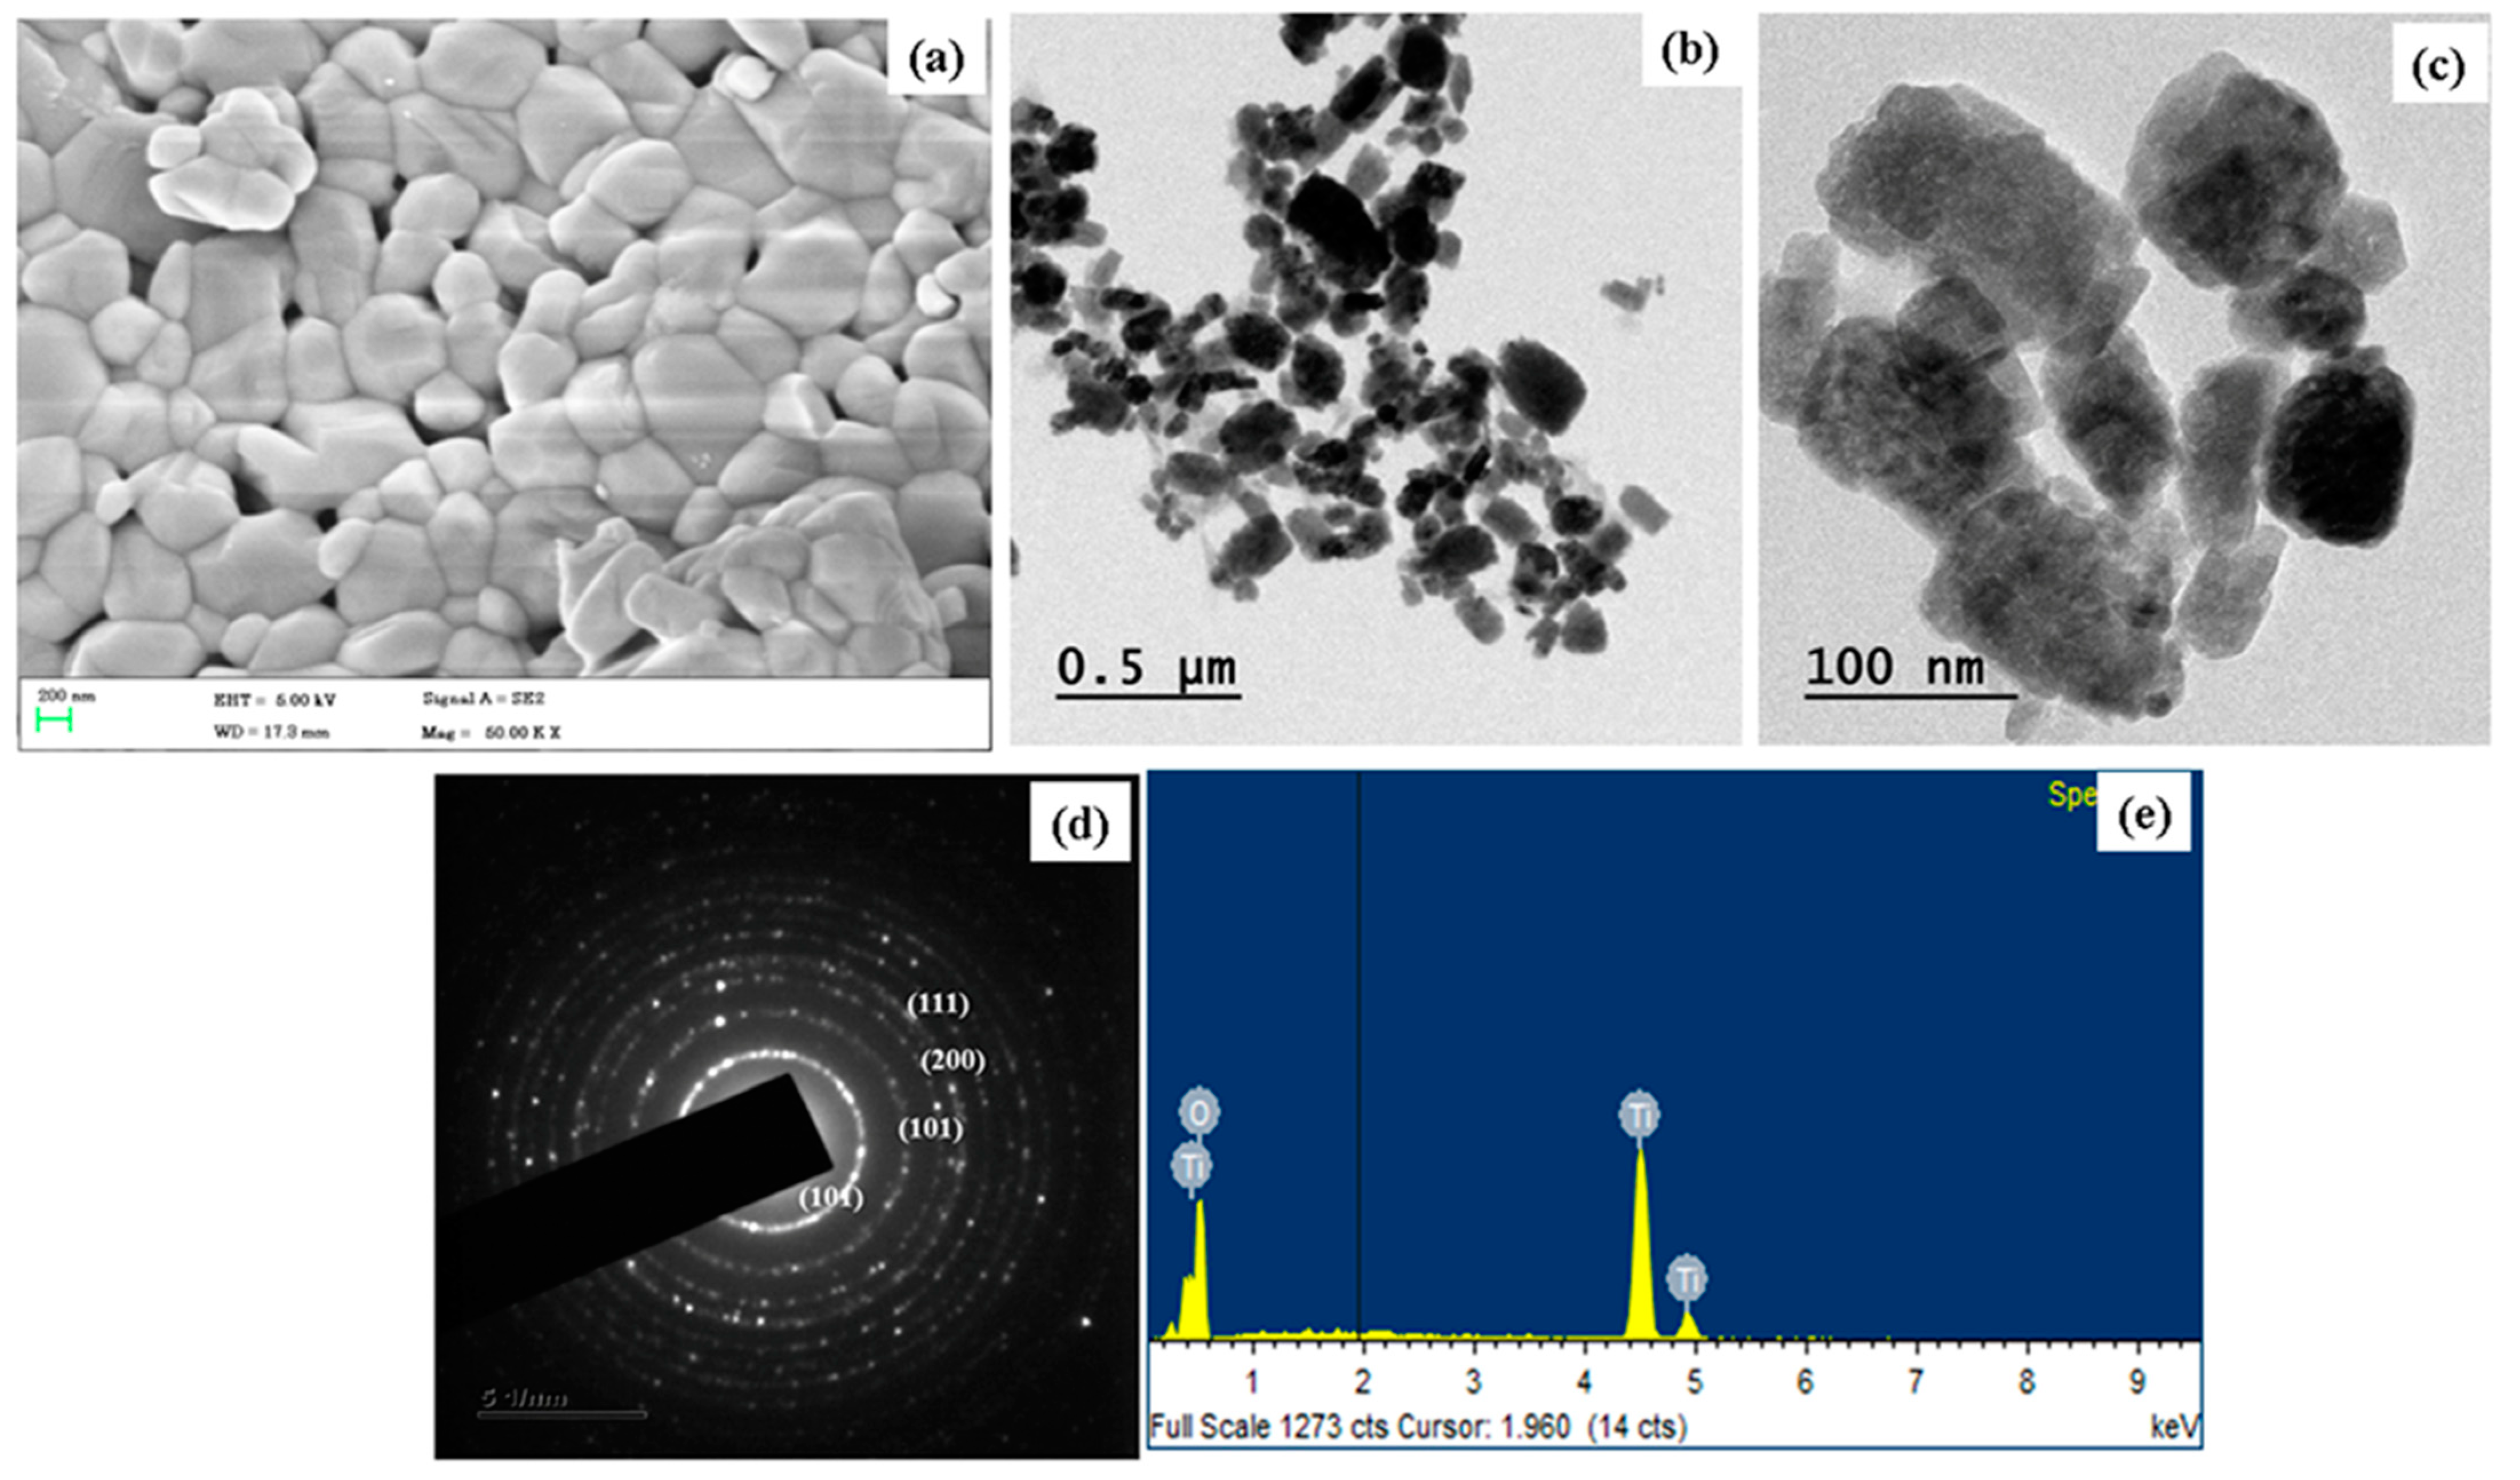
2.2. Morphology Analysis and Chemical Composition

The formulated TiO2 NP’s morphology was studied using FE-SEM and TEM analysis, as revealed in Figure 2a,b. The TiO2 NPs are formed using titanium isopropoxide and S. cumini seed extract. The FE-SEM and TEM microphotographs of the TiO2 NPs showed a river stone-like morphology (polygonal). The average size of the TiO2 NPs was 50–100 nm. The SAED pattern prepared TiO2 NPs (Figure 2c) that can be assigned to the reflections (110), (101), (200), (111), (210), (211), (220), (002), (310), (301), and (112) of the rutile phase of TiO2 NPs. There are no additional rings in the SAED pattern caused by crystalline impurities. The elemental configuration of TiO2 NPs was investigated via an EDAX spectrum. Figure 2d shows the EDAX spectrum of TiO2 NPs. The atomic percentage of TiO2 NPs was Titanium (Ti) at 23.33% and Oxygen (O) at 76.67%, respectively.
The optical properties depend on numerous factors, including the band gap, oxygen deficiency, and surface roughness. The UV-Vis absorbance spectrum of TiO2 NPs is revealed in Figure 3a. During the green synthesis, the colloidal suspension turns from white to yellowish-green, corresponding to the TiO2 NPs development. The UV absorbance peak around the 385–400 nm area confirmed the development of TiO2 NPs [29]. The present work observed the absorbance edge at 397 nm for TiO2 NPs, indicating that the transition of charge coordinated electron between the O 2p and Ti 3d states [30]. The hydrodynamic diameter of green synthesized TiO2 NPs averaged 156 nm; because a water medium surrounded the TiO2 NPs, the particle size was increased (Figure 3b) compared with the XRD outcomes. This is known as hydrodynamic size [31].
The FTIR spectra of formulated TiO2 NPs is revealed in Figure 3b. The biomolecules of S. cumini functional groups, such as polyphenolic group O-H stretching vibrations were detected at 3442 cm−1, asymmetric and symmetric C–H groups located at 2921 to 2854 cm−1, O-H observed at 1462 cm1−1, while the O-Ti-O bond and the metal–oxygen bond (Ti-O) of TiO2 NPs formation peaks were observed at 495 cm−1 [32,33].
The photoluminescence spectrum of TiO2 NPs has an excitation wavelength of 425 nm, as depicted in Figure 3c. The PL emission spectrum of TiO2 NPs was found at 370 nm, 425 nm, 455 nm, 483 nm, and 518 nm, respectively. The UV emissions were noted at 370 nm because of the free exciton–exciton collision’s radiative recombination. The transfer of electron from the surface donor of the tin interstitials (Tii) to the top of the valence band was responsible for the violet emission detected at 425 nm. Singly ionized tin vacancies (VTi) were exhibited by the blue emissions at 455 nm and 483 nm, respectively. The green emission band was centred at 530 nm because of oxygen vacancies (Ov) [34].

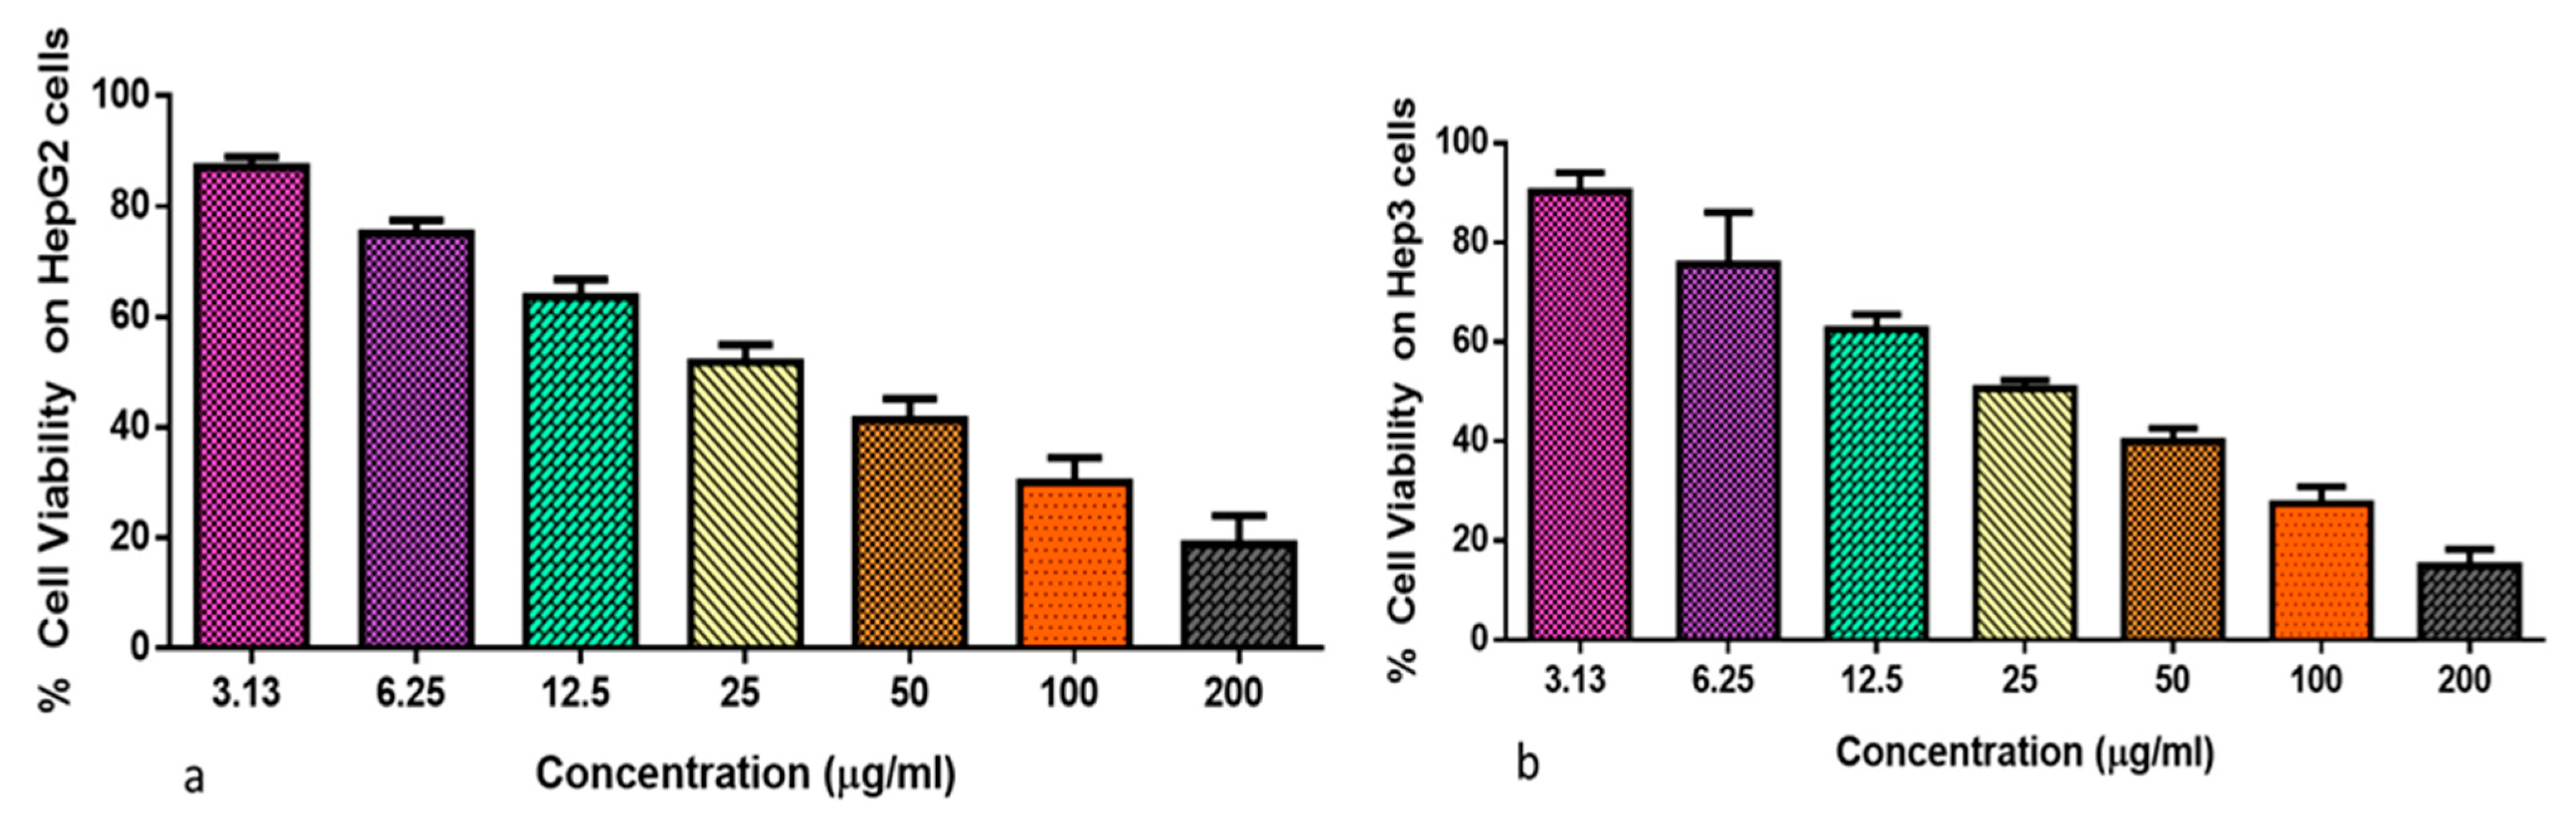
2.3. Cell Viability Assay

Cancer cells have an impressive capacity for self-replication and metastasis. Unchecked and uncontrolled cell growth leads to the formation of malignant tissues, which are prone to metastasizing to other body areas [35]. The main issue with cancer treatments is their low therapeutic index and lower ability to distinguish between malignant cells and normal cells. The efficiency and safety of treatment are limited by anticancer agents with low selectivity, which kill both tumor and non-malignant cells [36]. The life quality of cancer survivors is severely reduced by the numerous negative side effects associated with these strategies. To rectify these problems and improve the efficacy of cancer treatment, novel nanomedicines are being developed [37]. In this work, to prove the anticancer properties of the formulated TiO2 NPs, we used the MTT assay to assess if TiO2 NPs might inhibit the growth of liver cancer Hep3 and Hep-G2 cells.
Figure 4a,b displays the results of an analysis into the cytotoxicity of formulated TiO2 NPs on both Hep3 and Hep-G2 cells. Our outcomes revealed that the growth of Hep3 and Hep-G2 cells was drastically lowered upon treatment with TiO2 NPs at varying concentrations (3.13–200 µg). These findings show that TiO2 NPs are cytotoxic to liver cancer cells (Figure 4b). Given that 29.43 and 27.11 µg/mL of TiO2 NPs was shown to inhibit 50% of the viability in HepG2 and Hep3 cells, respectively, hence 29.43 and 27.11 µg/mL were selected as the IC50 (high dose) and 14.7 and 13.5 µg/mL were selected as the IC25 (Low dose) for the remaining assays.

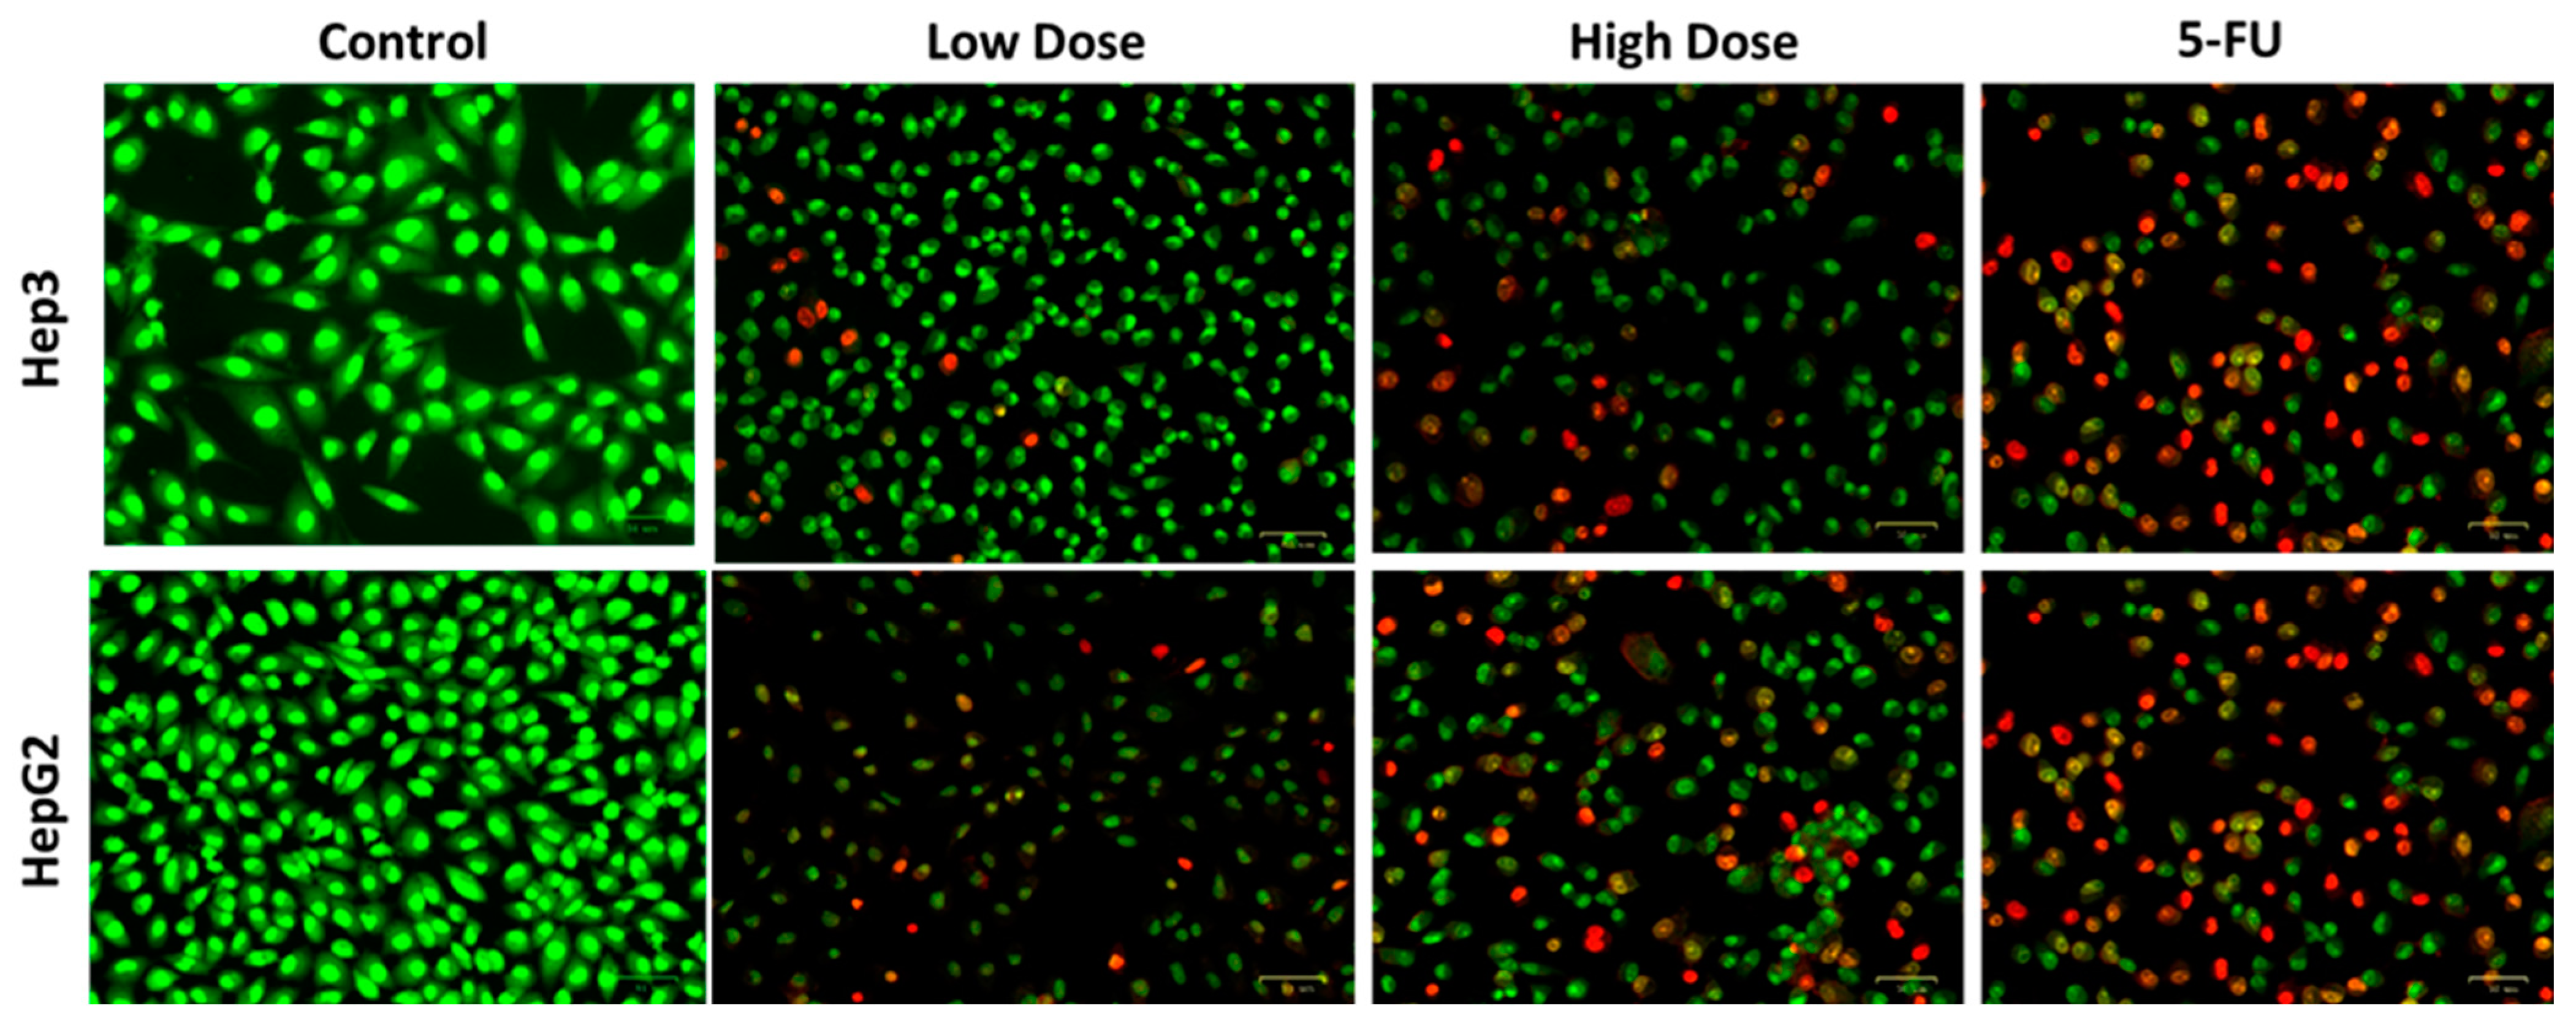
2.4. Apoptosis Analysis by Dual Staining

Defective apoptosis, in addition to unchecked cell proliferation, is a significant contributor to tumor formation. Apoptosis serves as a protective mechanism against the growth of malignancies. When neoplastic cells develop a resistance to apoptosis due to genetic and epigenetic alterations, the phenomenon is known as oncogenic transformation. Defective apoptosis regulation in carcinogenesis results in extended tumor cell survival, stress-induced proliferation, and metastasis. Additionally, it increases the tumor cell’s resistance to therapy [38]. Therefore, the examination of the ability of novel anticancer candidates to trigger apoptosis in cancer cells is necessary.
Figure 5 shows the results of dual staining on the TiO2 NP’s impact on apoptosis in Hep3 and Hep-G2 cells. In comparison to control cells, Hep3 and Hep-G2 cells that were subjected to IC50 concentration of TiO2 NPs exhibited a strong orange/yellow fluorescence along with altered cell shape, rounding, and nuclear damage, which was also seen in the 5-FU treated cells. Therefore, it was clear that TiO2 NPs administration promoted early and late apoptosis in the Hep3 and Hep-G2 cells.

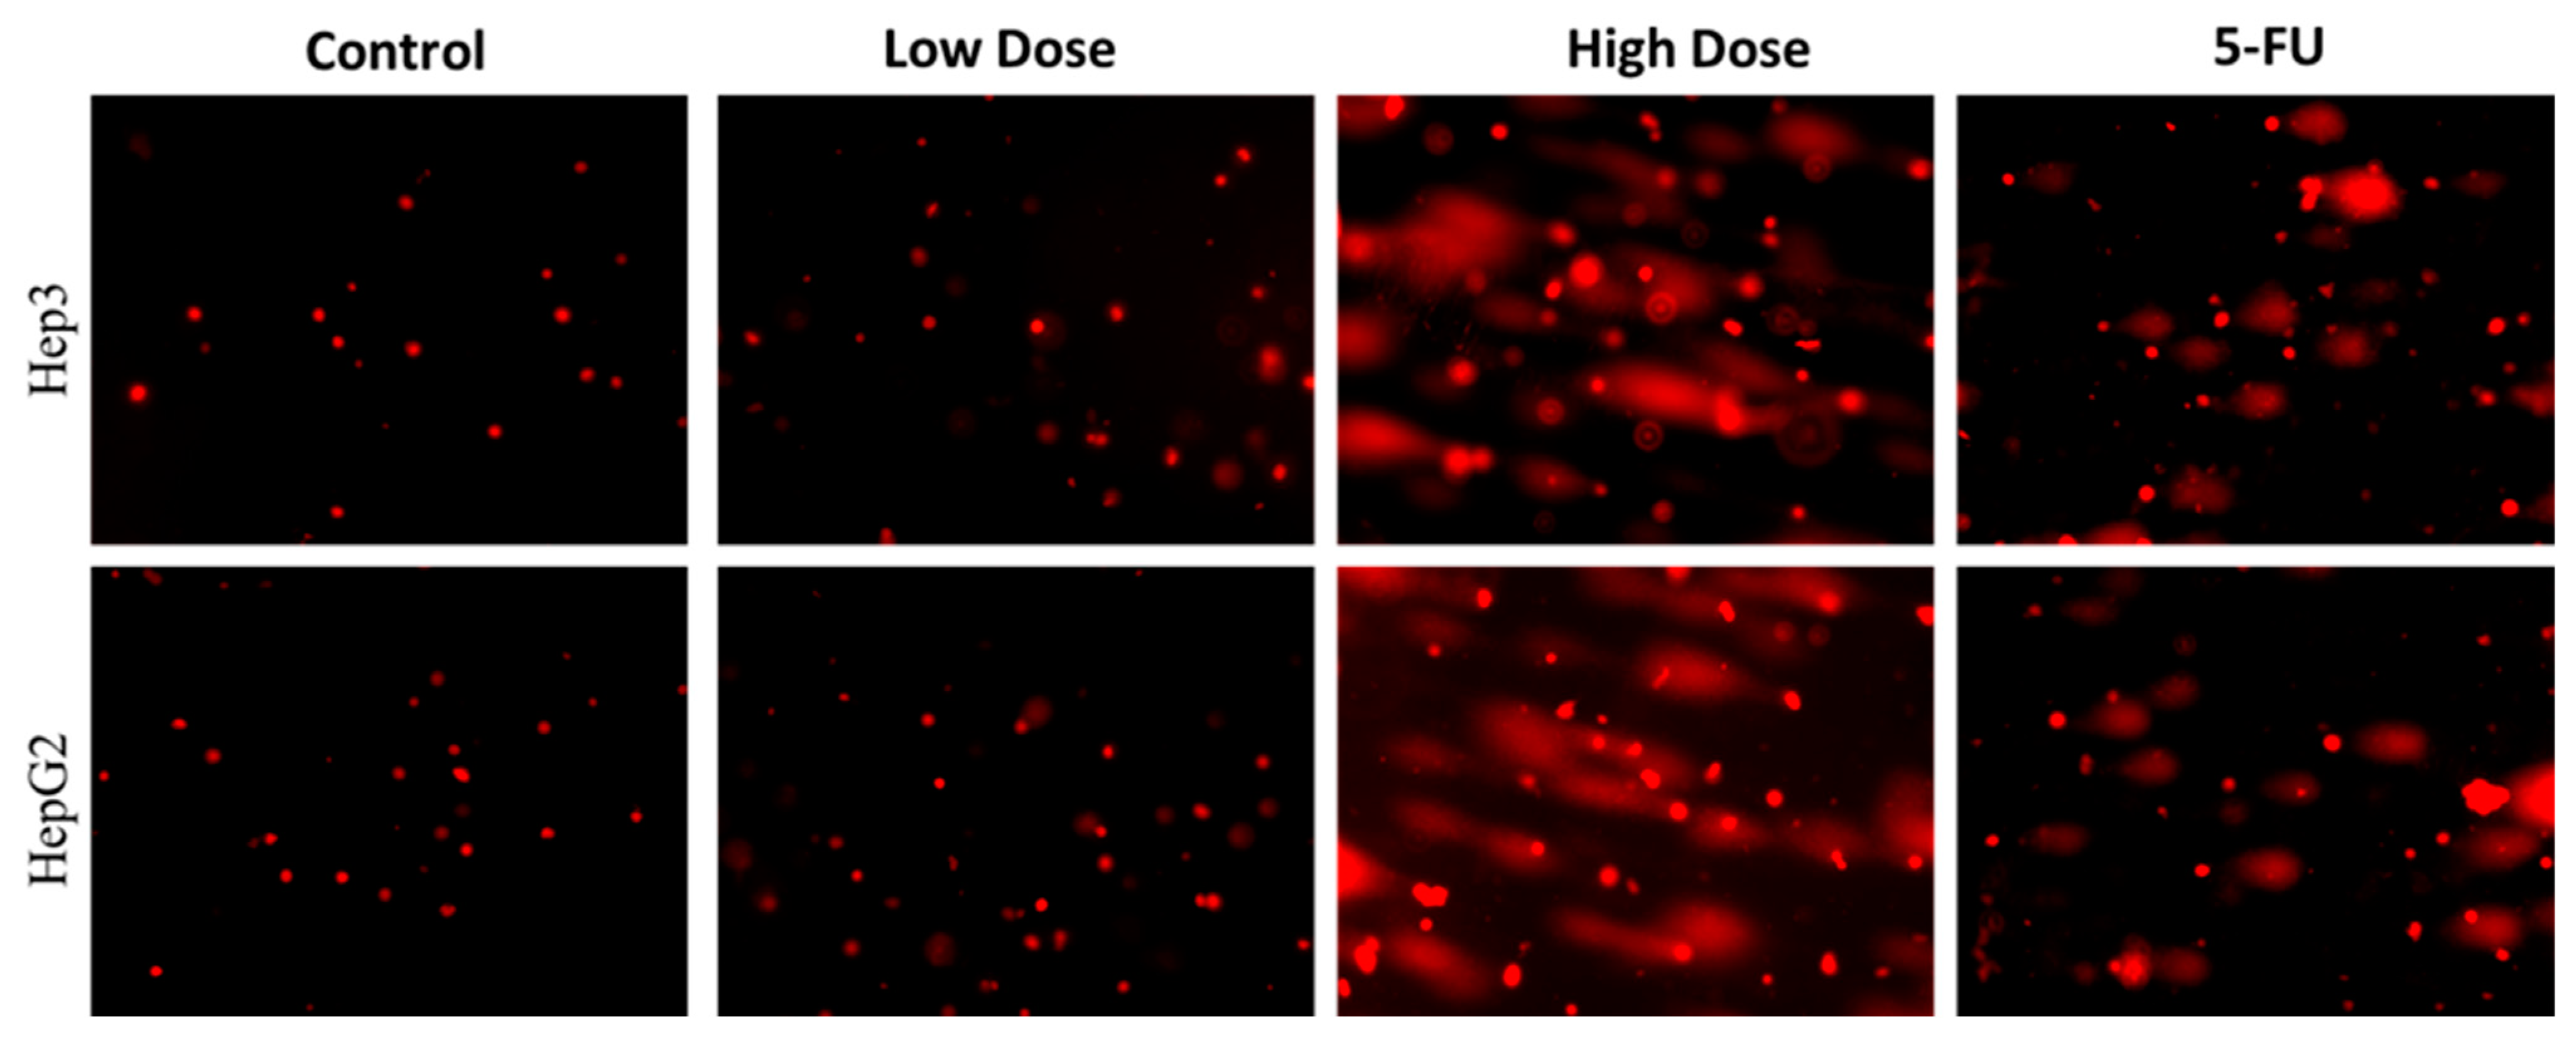
2.5. Analysis of Nuclear Damage by Comet Assay

Apoptosis has a complex pathophysiology that includes both intrinsic and extrinsic signal transmission [39]. Numerous mechanisms, such as the overexpression of anti-apoptotic genes, are produced by cancer cells to inhibit apoptotic cell death. DNA damage in tumor can lead to apoptosis, which kills possibly dangerous cells and stops the growth of tumors. On the other hand, apoptotic malfunction can result in unchecked cell proliferation, tumor development, and therapy-resistant tumors [40]. In order to stop the growth of tumors, it is thought that inducing apoptosis in cancer cells is the most effective method.
The apoptotic cell nuclear damage in the cells were assessed by the comet assay. Figure 6 reveals that the control cells did not develop tails, indicating that they do not have nuclear damage. Contrarily, Hep3 and Hep-G2 cells subjected to IC50 concentration of formulated TiO2 NPs show a clear tail development, suggesting that the TiO2 NPs enhanced nuclear damage in the Hep3 and Hep-G2 cells. The 5-FU treated cells also developed a tail formation, which proves the nuclear damage.

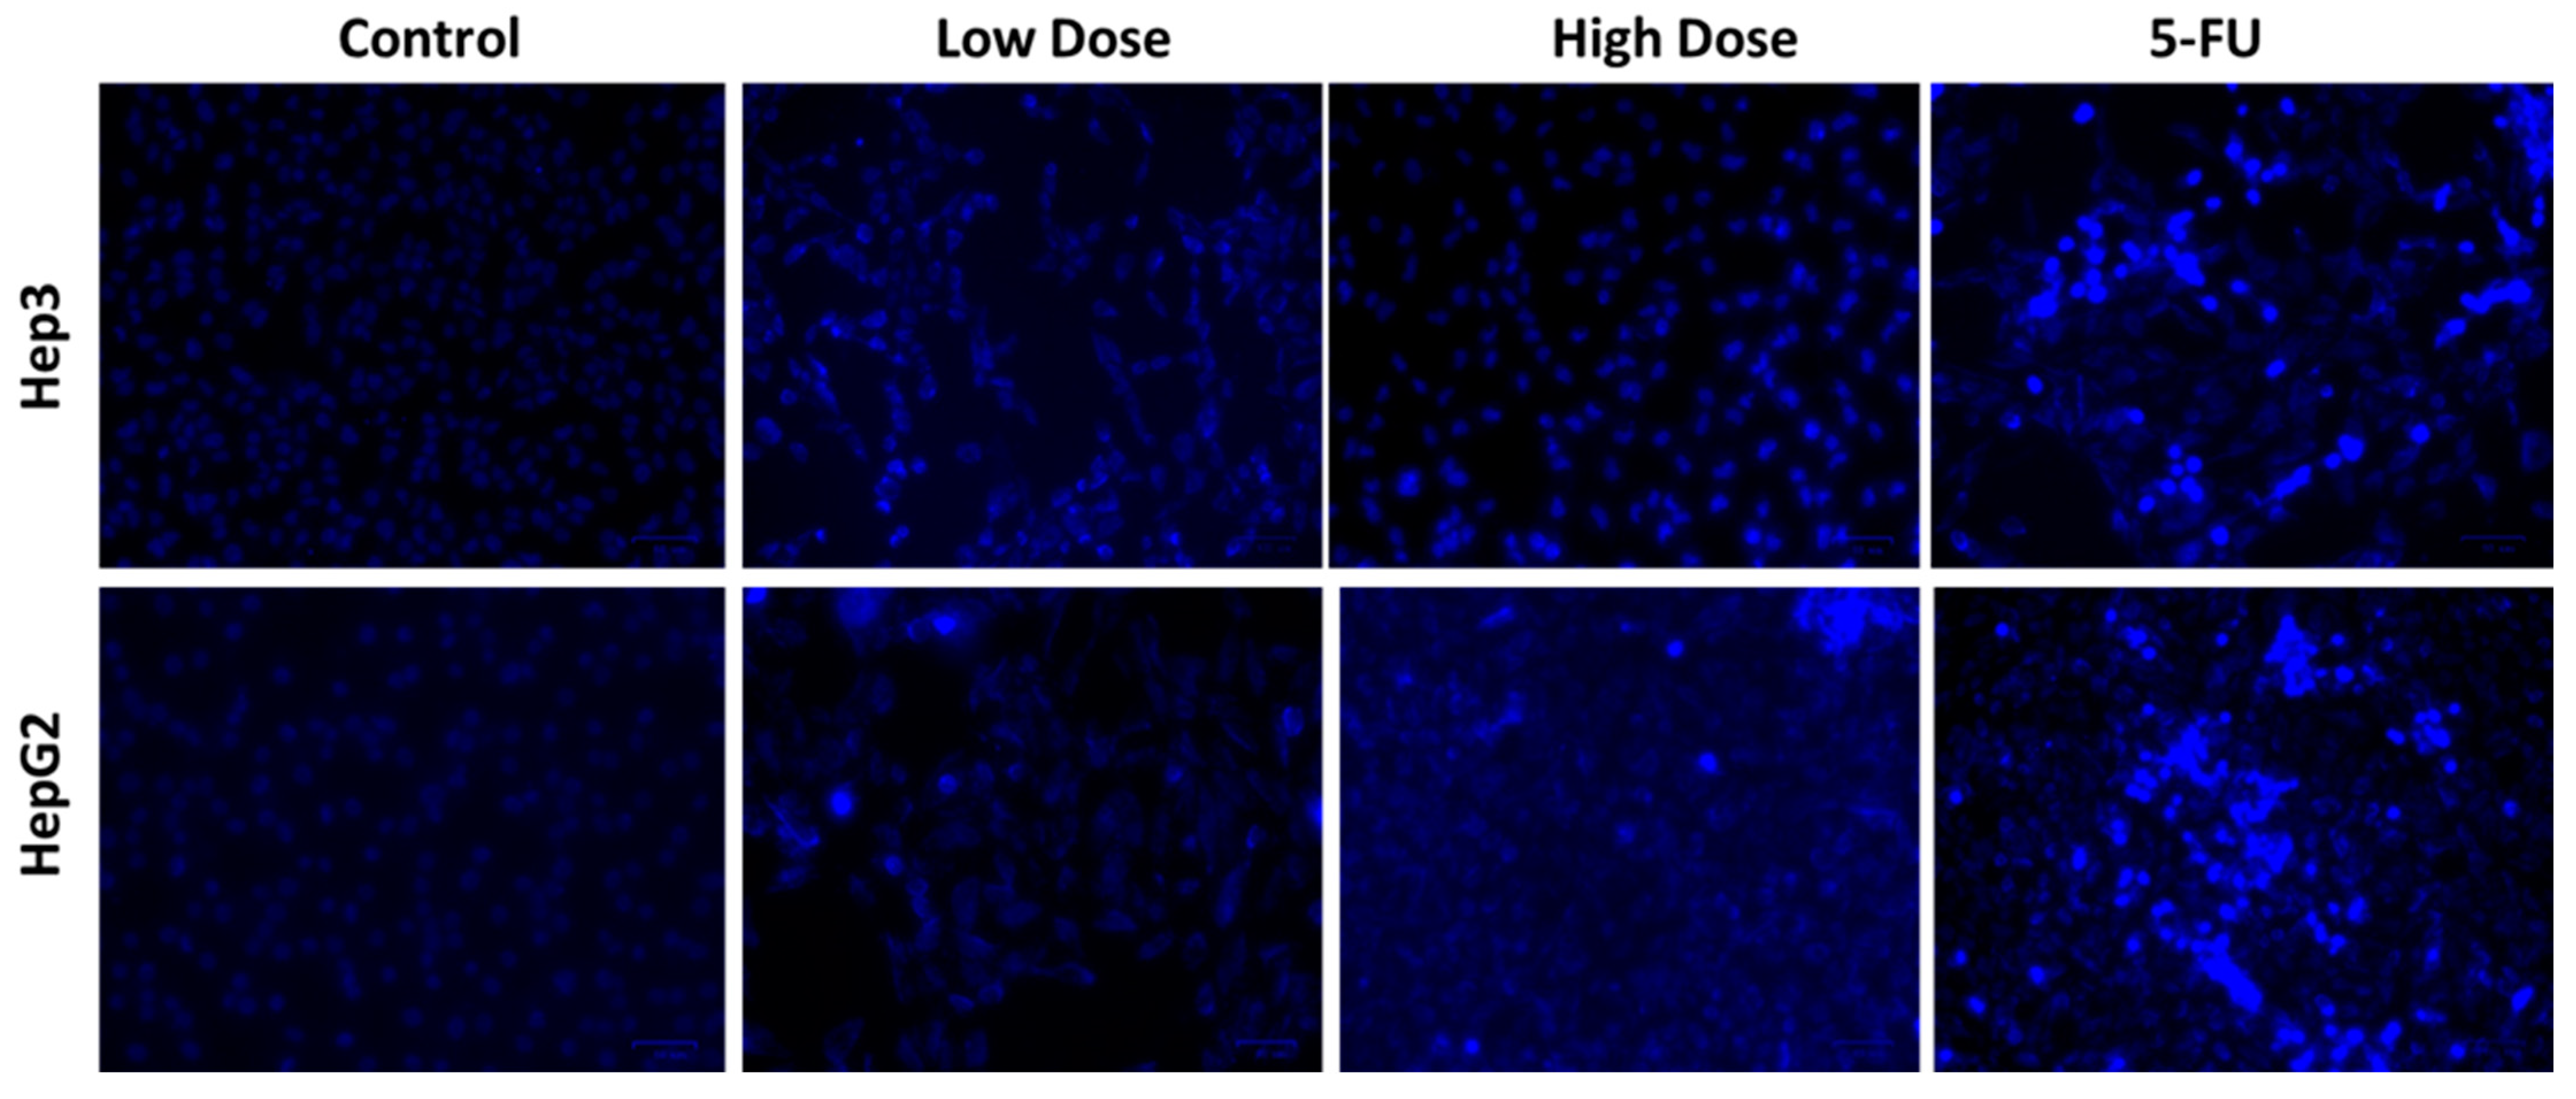
2.6. Apoptosis Analysis by DAPI Staining

Apoptosis is characterized by morphological changes, some of which can serve as early signs of impending cell death. Overall, apoptosis begins with chromatin condensation, fragmentation of nucleus, and the development of apoptotic bodies [40]. Resistance to apoptosis commonly occurs when cell death or pro-survival signaling is dysregulated during tumor development [41].
Figure 7 shows the results of DAPI staining to assess the impacts of TiO2 NPs on the nuclear morphology of apoptotic cells in Hep3 and Hep-G2 cells. DAPI staining results exhibited that TiO2 NPs treatment increased apoptosis in Hep3 and Hep-G2 cells, as the cells exposed to IC50 of TiO2 NPs exhibited clear alterations in nuclear morphology, including condensation, shrinkage and the development of apoptotic bodies (Figure 7).

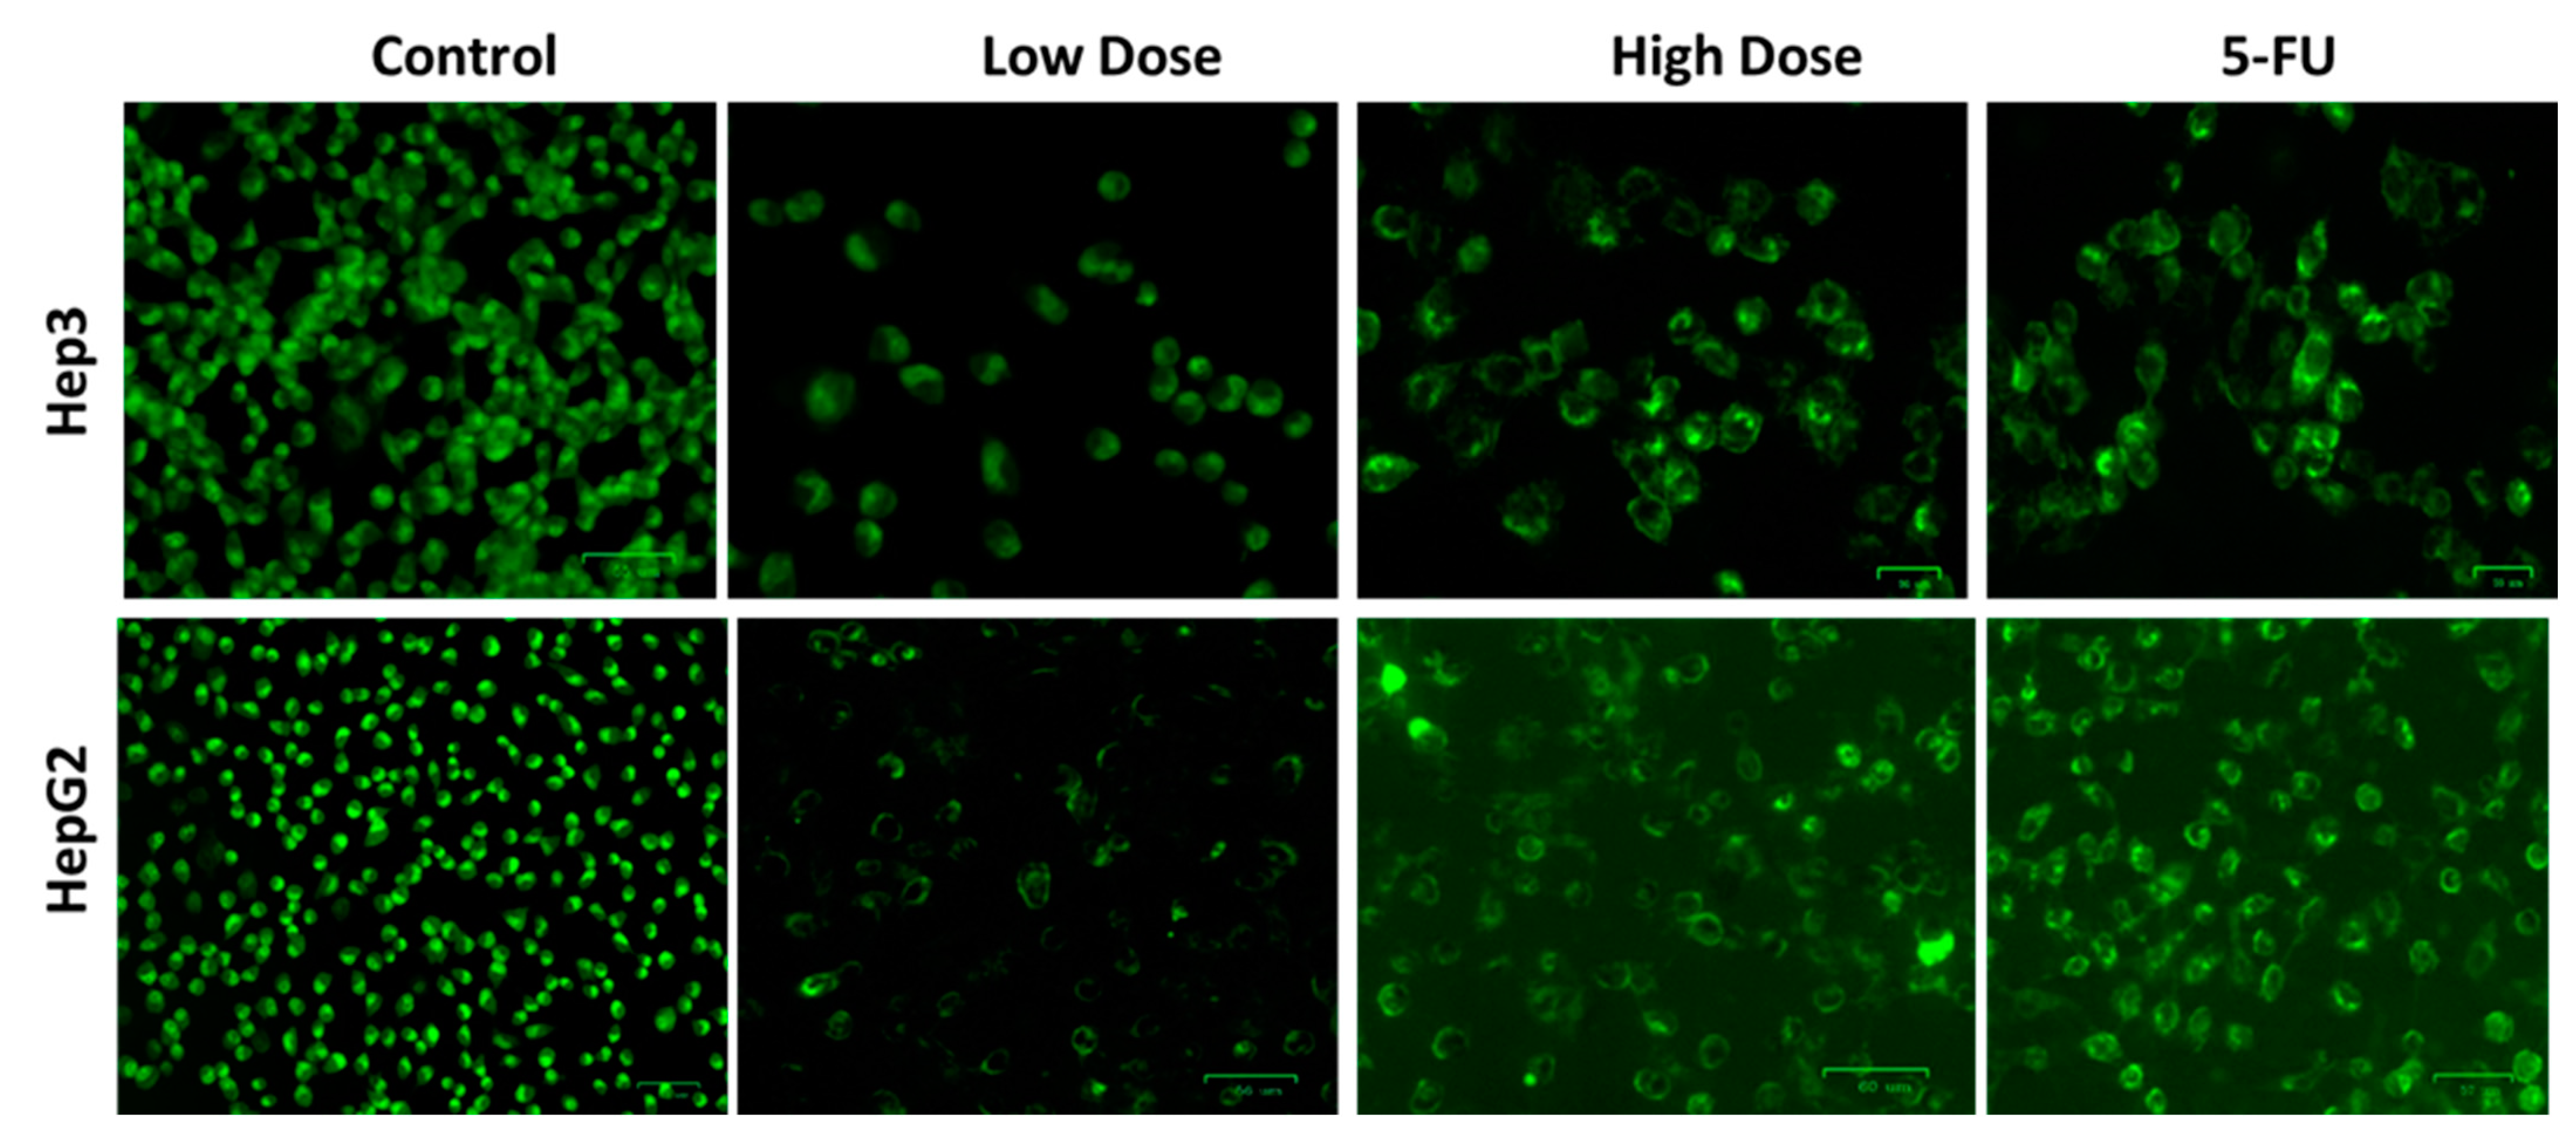
2.7. MMP Analysis by Rh-123 Staining

An earlier report by He et al. [42] revealed that the depletion of the MMP is a pivotal cause of inducing apoptosis. Figure 8 displays the MMP level of untreated and TiO2 NPs treated liver cancer cells, analyzed by Rh-123 staining. The control cells demonstrated unchanged and intact MMP, as seen by the intense green fluorescence. However, low green fluorescence indicated that MMP status was decreased in Hep3 and Hep-G2 cells exposed to the IC50 level of TiO2 NPs (Figure 8). The standard drug 5-FU treatment also revealed decreased green fluorescence, which proves the reduction in MMP level.

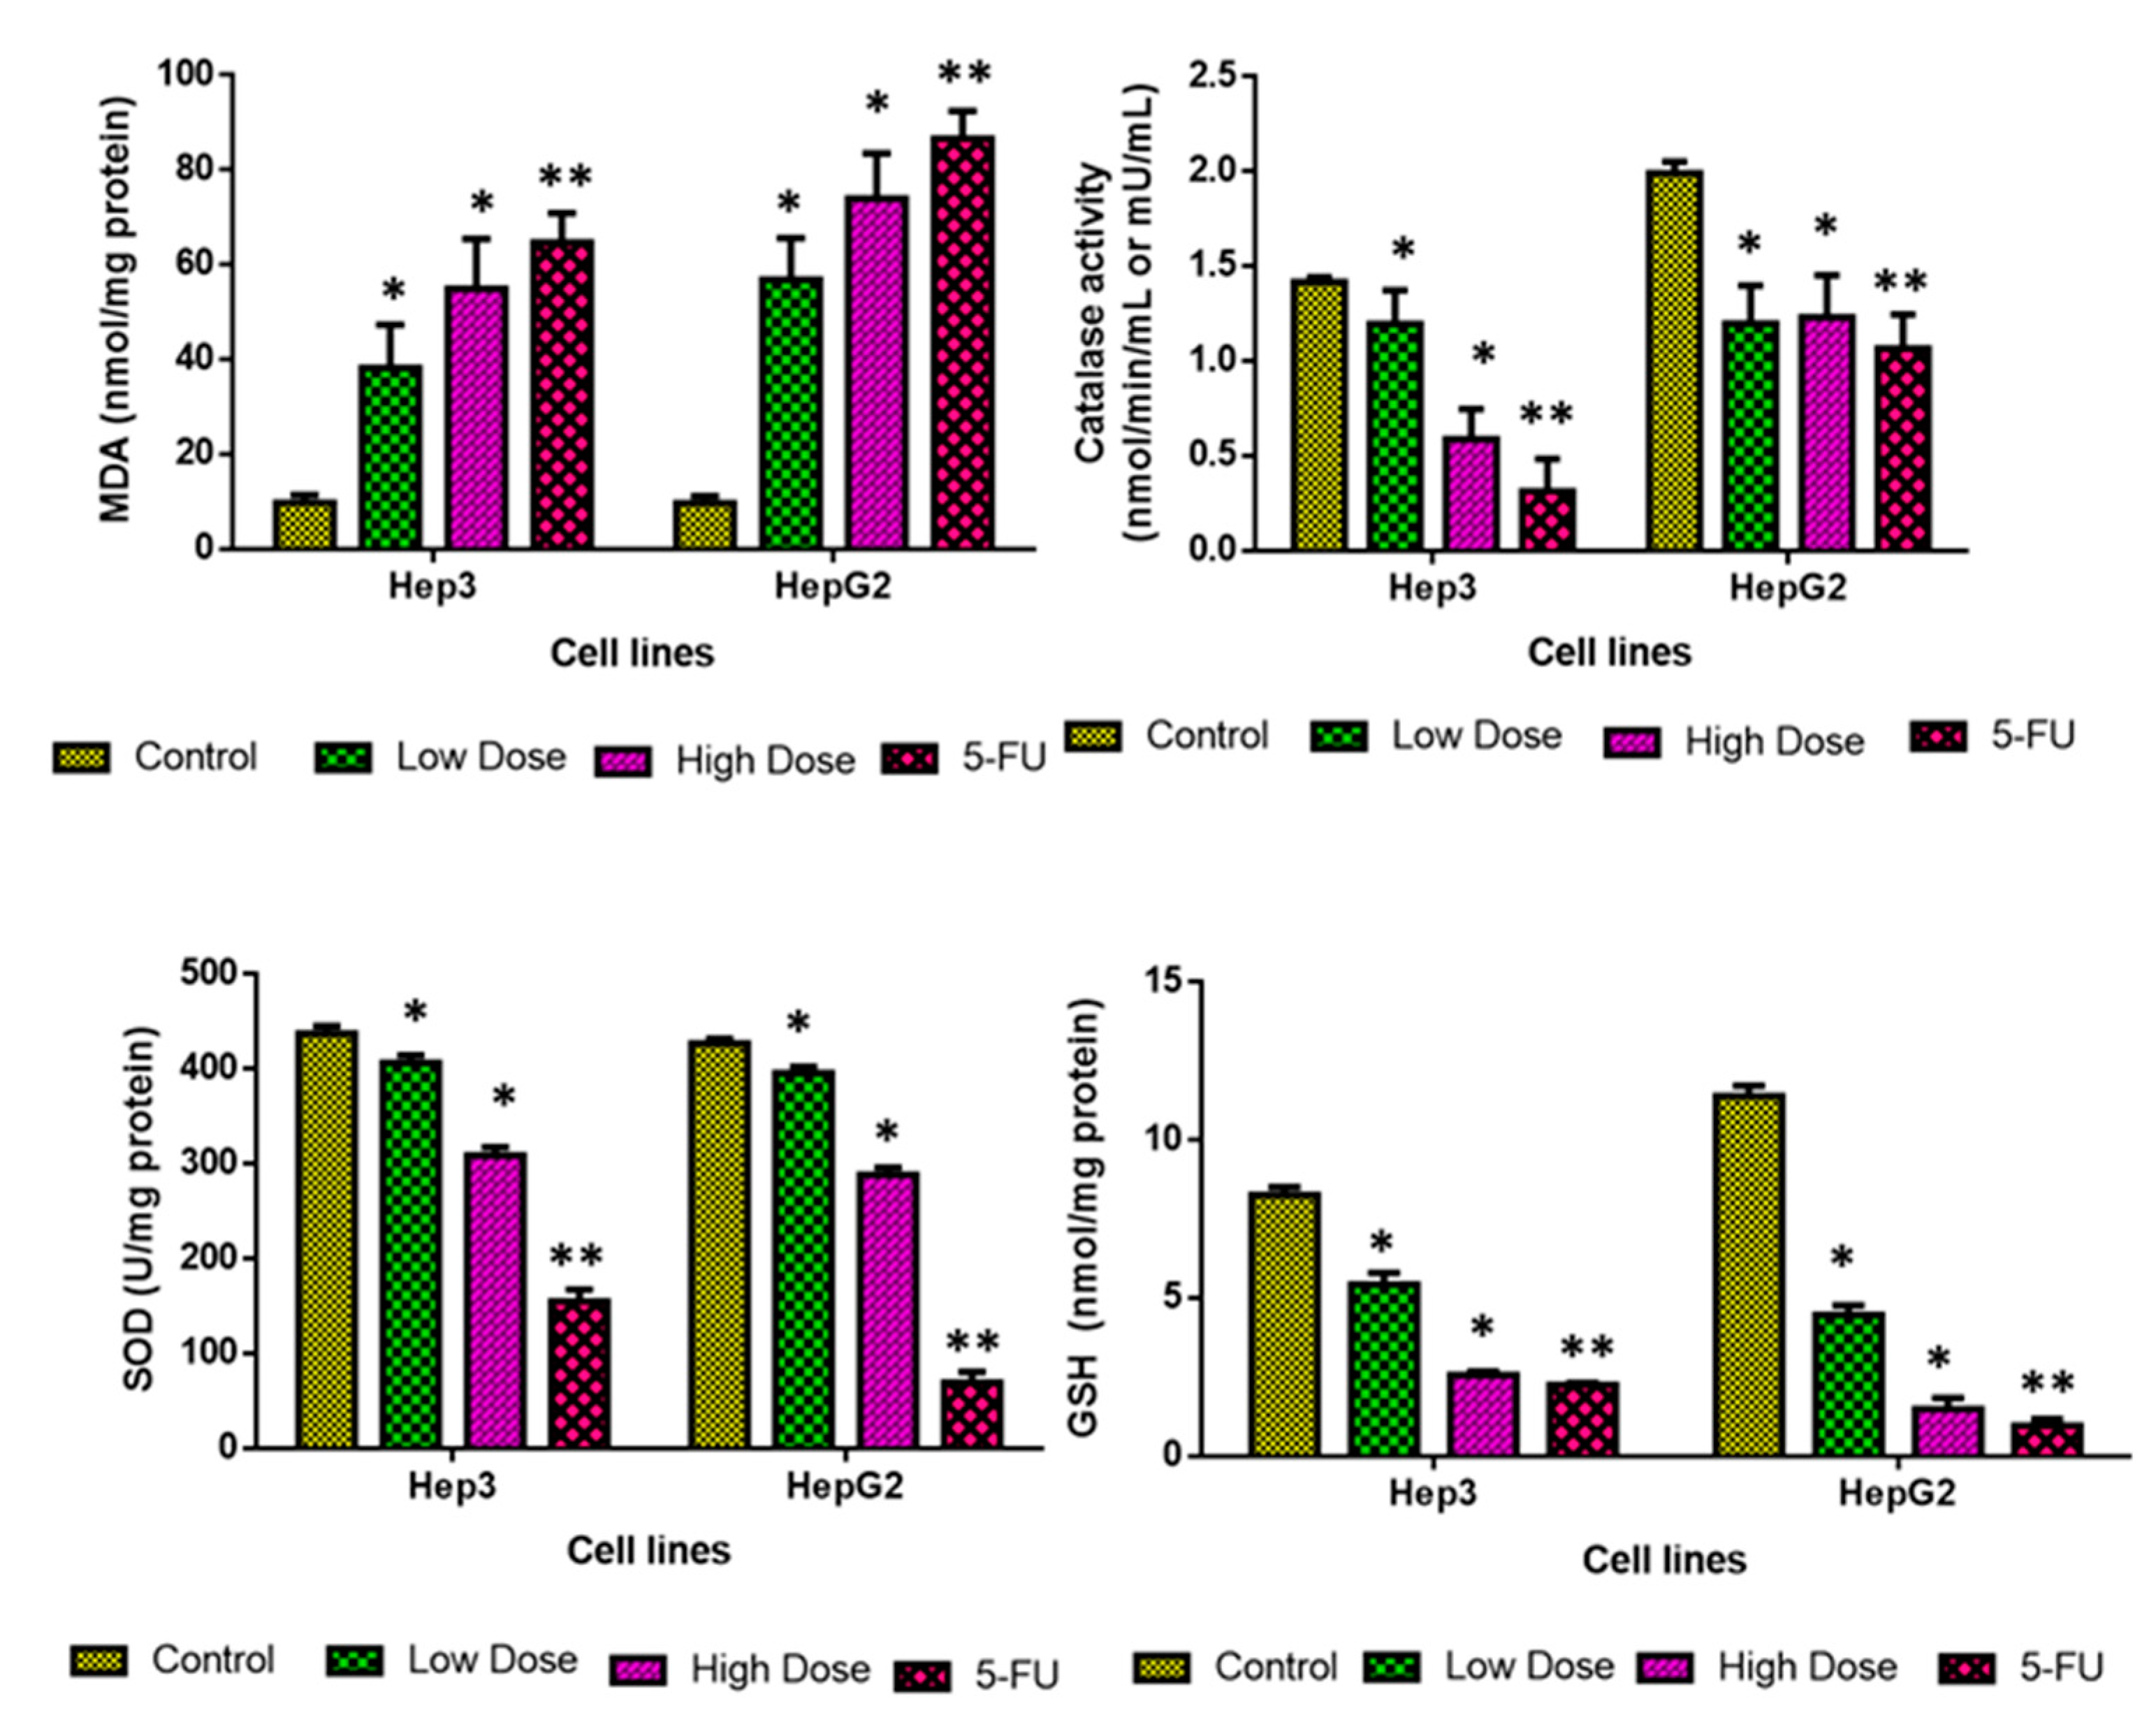
2.8. Analysis of Oxidative Stress Markers

In healthy cells, redox balance is maintained by tight control over free radical production and antioxidant defense. The GSH, SOD, and CAT protect cells from damage caused by ROS and other free radicals. Antioxidant enzymes such as SOD and CAT are essential for protecting cells from free radical damage. When it comes to preventing lipid peroxidation, GSH is essential [43]. Cancer cells’ ability to create antioxidants can assist in removing excessive ROS, which in turn allows them to avoid apoptosis and increase their chances of survival. Conversely, increased oxidative stress in cancer cells might activate anti-tumorigenic signaling cascades, leading to tumor cell necrosis [44].
The influence of TiO2 NPs treatment on the MDA, CAT, GSH, and SOD levels in the Hep3 and Hep-G2 cells are depicted in Figure 9. The level of MDA considerably increased in both Hep3 and Hep-G2 cells, which were treated with the IC25 concentration of TiO2 NPs. Furthermore, the GSH, CAT, and SOD levels were effectively decreased by the IC50 Concentration of TiO2 NPs. The 5-FU treatment also increased the MDA level while decreasing the CAT, SOD, and GSH levels in the Hep3 and Hep-G2 cells, which supports the activity of TiO2 NPs (Figure 9). These findings proved that TiO2 NPs treatment decreases antioxidants while elevating the MDA level, thereby facilitating oxidative stress-regulated cell death in Hep3 and Hep-G2 cells.

2.9. Analysis of Apoptotic Protein Levels

Cancer cells frequently undergo a complex series of molecular processes to escape apoptosis and acquire resistance to apoptosis. Apoptosis is highly controlled by Bcl-2 family protein members, including pro- and anti-apoptotic genes [45]. In order to suppress Bax expression and avoid apoptosis, tumor cells commonly increase Bcl-2 protein expression.
Figure 10 shows the results of an analysis of the Bcl-2, Bax, CytC, p53, and caspase-3, -8, and -9 expressions in the control and treated cells. Treatment of both Hep3 and Hep-G2 cells with an IC50 concentration of TiO2 NPs resulted in the augmented expression of Bax, CytC, p53, and caspase-3, -8, and -9. Contrarily, treatment with TiO2 NPs reduced Bcl-2 expression in both Hep3 and Hep-G2 cells, indicating that TiO2 NPs treatment enhances apoptotic protein expressions in the liver cancer cells (Figure 10). The 5-FU treatment also increases the apoptotic protein expressions in the liver cancer cells, which corroborates the TiO2 NPs activity.
In more resistant malignancies, inactivation or downregulation of pro-apoptotic genes contributes to the tumor’s resistance to treatment [46]. Bax was showed to block Bcl-2 expression, leading to a change in MMP. According to the literature, Bcl-2 inhibits apoptotic cascade activation, which suggests it may be a useful therapeutic target for cancer treatment [47]. By modulating the pro- and anti-apoptotic protein expressions, caspase activation is a major cause of apoptosis [48]. Overall, our findings demonstrated that TiO2 NPs treatment considerably boosted the Bax, CytC, p53, and caspase-3, -8, and -9 expressions, thereby facilitating the apoptosis in Hep3 and Hep-G2 cells.
As a result, this study demonstrates that titanium dioxide nanoparticles derived from Syzygium cumini (L.) seed extract can induce caspase-dependent apoptosis of hepatic cancer cells, which is promising for the treatment of this disease. There is a need for further research into these issues, including clinical data, bioavailability, and in vivo studies, so that these findings can be translated into effective therapies for humans.

3. Materials and Methods

3.1. Syzygium Cumini Seed Extract Preparation

The fruit pericarp was taken out from the seeds after collecting S. cumini fruits from the Gandhi market in Tiruchirappalli, Tamil Nadu, India. The separated seeds were washed several times in deionized water to discard the fruit fleshes. S. cumini seeds were then cut into pieces and dehydrated for one month at 37 °C. The dehydrated samples were powdered using a mechanical grinder. In a 250 mL beaker, 10 g of Syzygium cumini seed powder was boiled with 100 mL of deionized water and agitated with a magnetic stirrer for about an hour at 80 °C. The aqueous solution’s color changed from watery to a light yellowish brown. The solution was cooled to 37 °C, filtered and stored at −4 °C until future use.
At room temperature (RT), 100 mL of S. cumini seed aqueous extract was mixed with 0.1 M titanium isopropoxide solute. The homogenous reaction mixture was heated at 80 °C for 4 h. The resulting suspension was permitted to cool at 37 °C and centrifuged for 15 min at 8000 rpm. The nanopowder was dehydrated at 120 °C for 2 h. The obtained TiO2 NPs were calcined at 800 °C in the atmosphere for 2 h and were used for further characterization. The formation of TiO2 NPs flow chart is given in Figure 11.

3.2. Characterization Techniques

The XRD analysis was undertaken using an X-ray meter (X’PERT PRO Analytical). The diffraction patterns for TiO2 NPs were recorded in the 20–80° range using a monochromatic wavelength of 1.54 Å. The FE-SEM (Carl Zeiss Ultra-55 FESEM, Carl Zeiss AG, Oberkochen, Germany) with EDX (model: Inca) was utilized to study the TiO2 NPs. The appearance of the TiO2 NPs were studied using the TEM (Tecnai-F20, FEI Company, Hillsboro, OR, USA) operated at an accelerating voltage of 200 kV. The size of the particles was detected by the DLS using the Nano-Plus machine. The FT-IR spectrum was studied using a Perkin-Elmer machine at 400–4000 cm−1. At 37 °C, a luminescence spectrophotometer (Perkin-Elmer LS-5513, PerkinElmer, Hong Kong) and a xenon lamp was employed to detect photoluminescence.

3.3. TiO2 NPs Dispersion

TiO2 NPs was dissolved in deionized water (2 mg/mL; pH 4) and spread using a ultrasound (Q-Sonica, Newtown, CT, USA) fixed with a tip (19 mm) [49]. Using a method previously specified, sonication was performed in an ice bath at 32 W of acoustic delivery power for 15 min with 8 s (pulse mode on) and 2 s (pulse mode off) [50].
To avoid particle deagglomeration, Ti particles was dispersed in high glucose DMEM enriched with 10% FBS (Gibco).

3.4. MTT Assay

The impacts of TiO2 NPs on the growth of Hep3 and Hep-G2 cells was measured using the MTT test and the cell lines were obtained from NCCS, Pune, India. Both cells were cultivated separately in a 96-well plate and treated with the TiO2 NPs at various doses (3.13, 6.25, 12.5, 25, 50, 100, and 200 µg/mL) for 24 h. The viability of control and treated Hep3 and Hep-G2 cells were assessed using the previous method [51].

3.5. Dual Staining

TiO2 NPs induced apoptosis in Hep3 and Hep-G2 cells was studied by AO/EtBr staining. Both cells were cultivated separately on a 24-well plate. They were administered with the IC25 (low dose) and IC50 (high dose) concentrations of TiO2 NPs and standard drug 5-Fluorouracil (5-FU, 10 µM) for 24 h. Later, both cells were stained using 100 µg/mL of AO/EtBr for 5 min. Under a fluorescent microscope, the produced fluorescence was examined to detect apoptosis [52].

3.6. Comet Assay

DNA damage was studied using a comet assay, which has been discussed earlier. All tests were conducted at 4 °C in red light. 24 h after seeding, a monolayer of Hep3 and HepG2 cells was employed to collect cells for the assay. Cells were trypsinized at 12 and 24 h after treatment with IC25 and IC50 doses of TiO2 NPs and the reference drug 5-Fluorouracil (5-FU, 10 µM). A 1% solution of normal agarose in PBS was carefully poured over a completely frozen micro slide, sealed with a coverslip, and cooled for about 5 min in an ice bath. Once the gel had solidified, the coverslip was taken. At 37 °C, a 1:3 ratio of cell suspension was added with low melting agarose (1%). After the gel had set, the coating mixture (100 µL) was promptly placed on top, spread evenly around the micro slide, and left to solidify. After letting the gel containing the cell solution settle, a third coating of 100 µL agarose (1%) was added. Once the agarose had set, the coverslips was detached and the slides were placed in a container containing ice-cold lysis buffer (2.5 µM NaCl, 100 mM Na2EDTA, 10 mM Tris, NaOH: pH 10, 0.1% Triton X-100) and cooled at 4 °C for 16 h. To prevent DNA damage, the aforementioned procedures were executed with minimal light. They were taken out of the lysis solution and laid down on the bottom of an electrophoresis tank. Electrophoresis buffer (300 mM NaOH, 1 mM Na2EDTA, pH > 13) was used to fill the reservoirs to the point where the slides could be submerged. After 20 min of incubation in the buffer (to facilitate DNA unwinding), electrophoresis was executed at 0.8 V/cm for 15 min. The slides were withdrawn from the electrophoresis, rinsed thrice in a neutralization buffer (0.4 M Tris, pH 7.5), and then tapped carefully to dry. EtBr (50 µg/mL) was used to stain nuclear DNA in a volume of 20 µL. The Carl Zeiss epifluorescence microscope was used to capture the images. Image analysis software (CASP software) was employed to examine digital images of 200 cells from each treatment. DNA amount of specific nuclei was calculated, and the extent of DNA injury was assessed as a percentage of total DNA in the tail [53] using the photographs.

3.7. DAPI Staining

The apoptotic nuclear morphological changes induced by TiO2 NPs in Hep3 and Hep-G2 cells were analyzed using DAPI staining. After seeding both cells separately into a 24-well plate, cells were exposed to the IC25 (low dose) and IC50 (high dose) doses of TiO2 NPs and standard drug 5-FU (10 µM) for 24 h. Then cells were stained using DAPI (200 µg/mL) for 15 min. Finally, a fluorescence microscope was employed to detect any apoptotic nuclear modifications [54].

3.8. Rhodamine-123 Staining

Rh-123 staining was executed to evaluate the MMP status of control and treated Hep3 and Hep-G2 cells. Briefly, cells were cultivated on a 24-well plate treated with and IC25 (low dose) and IC50 (high dose) concentrations of TiO2 NPs and the standard drug 5-FU (10 µM) for 24 h. Then 10 µg/mL of Rh-123 was loaded, and MMP was analyzed using a fluorescence microscope [55].

3.9. Quantification of Oxidative Stress Markers

The corresponding assay kits (Thermo Fisher Scientific, Waltham, MA, USA) were used to evaluate the antioxidants and oxidative stress markers such as MDA, SOD, CAT, and GSH in control and exposed to IC25 (low dose) and IC50 (high dose) concentrations of TiO2 NPs and standard drug 5-FU (10 µM) in Hep3 and Hep-G2 cells for 48 h. All the tests were performed in triplicate using the corresponding kits [56].

3.10. Measurement of Apoptotic Protein Levels

By using the respective assay kits, the apoptotic proteins (Bax, Bcl-2, CytC, p53, caspase-3, -8, and -9) in control and IC25 (low dose) and IC50 (high dose) doses of TiO2 NPs and standard drug 5-FU (10 µM) treated Hep3 and Hep-G2 cells were assayed using the recommended instructions of the manufacturer (Thermo Fisher, USA) [57].

3.11. Statistical Methods

The mean ± SD are utilized to express the values. One-way ANOVA was executed to examine the values, and Duncan’s multiple range test for post hoc evaluation. For data analysis, SPSS V 17.0 software was used. For all tests, a significance was specified as p < 0.05.

4. Conclusions

In conclusion, TiO2 NPs were produced via a green route using Syzygium cumini seed aqueous extract. The XRD patterns show synthesized TiO2 NPs exhibit a rutile structure and an average crystalline size of 55 nm. The photoluminescence spectra of TiO2 NPs show green emissions at 530 nm. The antimicrobial effect of TiO2 was likewise similar to the standard drug amoxicillin. Furthermore, the formulated TiO2 NPs effectively inhibited the viability of Hep3 and Hep-G2 cells. TiO2 NPs treatment considerably promoted ROS generation, reduced the MMP level, and induced apoptosis in both Hep3 and Hep-G2 cells. The decreased level of antioxidants and increased expressions of apoptotic proteins were also observed in the TiO2 NPs-treated Hep3 and Hep-G2 cells. Therefore, it was clear that TiO2 NPs will be helpful in biomedical applications, including treating infectious diseases as well as liver cancer.

Author Contributions

Conceptualization, A.Y.E. and A.A. (Abdullah Alsrhani); methodology, N.A.N.A., A.A. (Afnan Alsultan) and A.M.A.; validation, B.A.; data curation, B.I. and S.K.S.; writing—review and editing, A.Y.E. and M.R.; supervision, A.Y.E. and P.L.M.; project administration, F.R. and B.I.; funding acquisition, A.A. (Abdullah Alsrhani) and Y.B. All authors have read and agreed to the published version of the manuscript.

Funding

This research was funded by Deanship of Scientific Research at Jouf University for the financial support (DSR-2021-01-0354).

Data Availability Statement

All the data related to this study are available from the corresponding author based upon request.

Acknowledgments

The authors would like to express their deepest gratitude to the corresponding institutions for the technical support for this study. We would like to thank the Jouf University for the financial support (DSR-2021-01-0354).

Conflicts of Interest

The authors declare no conflict of interest.

References

  1. Metwally, A.A.; Abdel-Hady, A.N.A.A.; Haridy, M.A.M.; Ebnalwaled, K.; Saied, A.A.; Soliman, A.S. Wound healing properties of green (using Lawsonia inermis leaf extract) and chemically synthesized ZnO nanoparticles in albino rats. Environ. Sci. Pollut. Res. 2022, 29, 23975–23987. [Google Scholar] [CrossRef]
  2. Vanlalveni, C.; Lallianrawna, S.; Biswas, A.; Selvaraj, M.; Changmai, B.; Rokhum, S.L. Green synthesis of silver nanoparticles using plant extracts and their antimicrobial activities: A review of recent literature. RSC Adv. 2021, 11, 2804–2837. [Google Scholar] [CrossRef]
  3. Jadoun, S.; Arif, R.; Jangid, N.K.; Meena, R.K. Green synthesis of nanoparticles using plant extracts: A review. Environ. Chem. Lett. 2021, 19, 355–374. [Google Scholar] [CrossRef]
  4. Garg, P. Selective Preference of Antibody Mimetics over Antibody, as Binding Molecules, for Diagnostic and Therapeutic Applications in Cancer Therapy. Biointerface Res. Appl. Chem. 2021, 11, 10765–10775. [Google Scholar]
  5. Ikeda, K. Recent advances in medical management of hepatocellular carcinoma. Hepatol. Res. 2019, 49, 14–32. [Google Scholar] [CrossRef]
  6. Bray, F.; Ferlay, J.; Soerjomataram, I.; Siegel, R.L.; Torre, L.A.; Jemal, A. Global cancer statistics 2018: GLOBOCAN estimates of incidence and mortality worldwide for 36 cancers in 185 countries. CA Cancer J. Clin. 2018, 68, 394–424. [Google Scholar] [CrossRef]
  7. Tanwar, J.; Das, S.; Fatima, Z.; Hameed, S. Multidrug resistance: An emerging crisis. Interdiscip. Perspect. Infect. Dis. 2014, 2014, 541340. [Google Scholar] [CrossRef]
  8. Mba, I.E.; Nweze, E.I. Nanoparticles as therapeutic options for treating multidrug-resistant bacteria: Research progress, challenges, and prospects. World. J. Microbio. Biotech. 2021, 37, 108. [Google Scholar] [CrossRef]
  9. Vallet-Regí, M.; González, B.; Izquierdo-Barba, I. Nanomaterials as promising alternative in the infection treatment. Int. J. Mol. Sci. 2019, 20, 3806. [Google Scholar] [CrossRef]
  10. Jafari, S.; Mahyad, B.; Hashemzadeh, H.; Janfaza, S.; Gholikhani, T.; Tayebi, L. Biomedical Applications of TiO2 Nanostructures: Recent Advances. Int. J. Nanomedicine. 2020, 15, 3447–3470. [Google Scholar] [CrossRef]
  11. Ziental, D.; Czarczynska-Goslinska, B.; Mlynarczyk, D.T.; Glowacka-Sobotta, A.; Stanisz, B.; Goslinski, T.; Sobotta, L. Titanium Dioxide Nanoparticles: Prospects and Applications in Medicine. Nanomaterials 2020, 10, 387. [Google Scholar] [CrossRef]
  12. Moosavi, M.A.; Sharifi, M.; Ghafary, S.M.; Mohammadalipour, Z.; Khataee, A.; Rahmati, M.; Hajjaran, S.; Łos, M.J.; Klonisch, T.; Ghavami, S. Photodynamic N-TiO2 Nanoparticle Treatment Induces Controlled ROS-mediated Autophagy and Terminal Differentiation of Leukemia Cells. Sci. Rep. 2016, 6, 34413. [Google Scholar] [CrossRef]
  13. Itoo, A.M.; Paul, M.; Padaga, S.G.; Ghosh, B.; Biswas, S. Nanotherapeutic Intervention in Photodynamic Therapy for Cancer. ACS Omega. 2022, 7, 45882–45909. [Google Scholar] [CrossRef]
  14. Zhu, Y.; Eaton, J.W.; Li, C. Titanium dioxide (TiO2) nanoparticles preferentially induce cell death in transformed cells in a Bak/Bax-independent fashion. PLoS ONE 2012, 7, e50607. [Google Scholar] [CrossRef]
  15. Thevenot, P.; Cho, J.; Wavhal, D.; Timmons, R.B.; Tang, L. Surface chemistry influences cancer killing effect of TiO2 nanoparticles. Nanomedicine 2008, 4, 226–236. [Google Scholar] [CrossRef]
  16. Aravind, M.; Amalanathan, M.; Mary, M. Synthesis of TiO2 nanoparticles by chemical and green synthesis methods and their multifaceted properties. SN. App. Sci. 2021, 3, 409. [Google Scholar] [CrossRef]
  17. Verma, V.; Al-Dossari, M.; Singh, J.; Rawat, M.; Kordy, M.G.; Shaban, M. A Review on Green Synthesis of TiO2 NPs: Photocatalysis and Antimicrobial Applications. Polymers 2022, 14, 1444. [Google Scholar] [CrossRef]
  18. Singh, S.; Maurya, I.C.; Tiwari, A.; Srivastava, P.; Bahadur, L. Green synthesis of TiO2 nanoparticles using Citrus limon juice extract as a bio-capping agent for enhanced performance of dye-sensitized solar cells. Surf. Interfaces 2022, 28, 101652. [Google Scholar] [CrossRef]
  19. Singh, T.; Pal, D.B.; Almalki, A.H.; Althobaiti, Y.S.; Alkhanani, M.F.; Haque, S.; Sharma, S.; Srivastava, N. Green synthesis of TiO2 bionanocomposite using waste leaves of water hyacinth: Application in antibacterial activity of toilet bacteria Serratia marcescens. Material. Lett. 2022, 316, 132012. [Google Scholar] [CrossRef]
  20. Erim, B.; Ciğeroğlu, Z.; Bayramoğlu, M. Green synthesis of TiO2/GO/chitosan by using leaf extract of Olea europaea as a highly efficient photocatalyst for the degradation of cefixime trihydrate under UV-A radiation exposure: An optimization study with D-optimal design. J. Mol. Struct. 2021, 1234, 130194. [Google Scholar] [CrossRef]
  21. Nabi, G.; Ain, Q.-U.; Tahir, M.B.; Riaz, K.N.; Iqbal, T.; Rafique, M.; Hussain, S.; Raza, W.; Aslam, I.; Rizwan, M. Green synthesis of TiO2 nanoparticles using lemon peel extract: Their optical and photocatalytic properties. Int. J. Environ. Anal. Chem. 2022, 102, 434–442. [Google Scholar] [CrossRef]
  22. Nabi, G.; Raza, W.; Tahir, M.B. Green synthesis of TiO2 nanoparticle using cinnamon powder extract and the study of optical properties. J. Inorg. Organomet. Polym. Mater. 2020, 30, 1425–1429. [Google Scholar] [CrossRef]
  23. Amanulla, A.M.; Sundaram, R.J.M.T.P. Green synthesis of TiO2 nanoparticles using orange peel extract for antibacterial, cytotoxicity and humidity sensor applications. Mater. Today Proc. 2019, 8, 323–331. [Google Scholar] [CrossRef]
  24. Goutam, S.P.; Saxena, G.; Singh, V.; Yadav, A.K.; Bharagava, R.N.; Thapa, K.B. Green synthesis of TiO2 nanoparticles using leaf extract of Jatropha curcas L. for photocatalytic degradation of tannery wastewater. Chem. Eng. J. 2018, 336, 386–396. [Google Scholar] [CrossRef]
  25. Abu-Dalo, M.; Jaradat, A.; Albiss, B.A.; Al-Rawashdeh, N.A. Green synthesis of TiO2 NPs/pristine pomegranate peel extract nanocomposite and its antimicrobial activity for water disinfection. J. Environ. Chem. Eng. 2019, 7, 103370. [Google Scholar] [CrossRef]
  26. Vorontsov, A.V.; Altynnikov, A.A.; Savinov, E.N.; Kurkin, E.N. Correlation of TiO2 photocatalytic activity and difuse refectance spectra. J. Photochem. Photobiol. A Chem. 2001, 144, 193–196. [Google Scholar] [CrossRef]
  27. Choudhury, B.; Dey, M.; Choudhury, A. Defect generation, d-d transition, and band gap reduction in Cu-doped TiO2 nanoparticles. Int. Nano. Lett. 2013, 3, 25. [Google Scholar] [CrossRef]
  28. Sivaranjani, V.; Philominathan, P.J.W.M. Synthesize of Titanium dioxide nanoparticles using Moringa oleifera leaves and evaluation of wound healing activity. Wound Med. 2016, 12, 1–5. [Google Scholar] [CrossRef]
  29. Kumar, V.; Yadav, S.K. Characterisation of gold nanoparticles synthesised by leaf and seed extract of Syzygium cumini L. J. Exp. Nanosci. 2012, 7, 440–451. [Google Scholar] [CrossRef]
  30. Ahmad, W.; Jaiswal, K.K.; Soni, S. Green synthesis of titanium dioxide (TiO2) nanoparticles by using Mentha arvensis leaves extract and its antimicrobial properties. Inorg. Nano-Met. Chem. 2020, 50, 1032–1038. [Google Scholar] [CrossRef]
  31. Loan, T.T.; Huong, V.H.; Huyen, N.T.; Van Quyet, L.; Bang, N.A.; Long, N.N. Anatase to rutile phase transformation of iron-doped titanium dioxide nanoparticles: The role of iron content. Optical. Mat. 2021, 111, 110651. [Google Scholar] [CrossRef]
  32. Narayanan, M.; Devi, P.G.; Natarajan, D.; Kandasamy, S.; Devarayan, K.; Alsehli, M.; Elfasakhany, A.; Pugazhendhi, A. Green. synthesis and characterization of titanium dioxide nanoparticles using leaf extract of Pouteria campechiana and lar-vicidal and pupicidal activity on Aedes aegypti. Environ. Res. 2021, 200, 111333. [Google Scholar] [PubMed]
  33. Santhoshkumar, T.; Rahuman, A.A.; Jayaseelan, C.; Rajakumar, G.; Marimuthu, S.; Kirthi, A.V.; Velayutham, K.; Thomas, J.; Venkatesan, J.; Kim, S.K. Green synthesis of titanium dioxide nanoparticles using Psidium guajava extract and its antibacterial and antioxidant properties. Asian Pac. J. Trop. Med. 2014, 7, 968–976. [Google Scholar] [CrossRef] [PubMed]
  34. Singh, M.K.; Mehata, M.S. Phase-dependent optical and photocatalytic performance of synthesized titanium dioxide (TiO2) nanoparticles. Optik 2019, 193, 163011. [Google Scholar] [CrossRef]
  35. Shaikh, S.; Nazam, N.; Rizvi, S.M.D.; Ahmad, K.; Baig, M.H.; Lee, E.J.; Choi, I. Mechanistic Insights into the Antimicrobial Actions of Metallic Nanoparticles and Their Implications for Multidrug Resistance. Int. J. Mol. Sci. 2019, 20, 2468. [Google Scholar] [CrossRef]
  36. Fouad, Y.A.; Aanei, C. Revisiting the hallmarks of cancer. Am. J. Cancer Res. 2017, 7, 1016–1036. [Google Scholar]
  37. Egusa, S.; Ebrahem, Q.; Mahfouz, R.Z.; Saunthararajah, Y. Ligand exchange on gold nanoparticles for drug delivery and enhanced therapeutic index evaluated in acute myeloid leukemia models. Exp. Biol. Med. 2014, 239, 853–861. [Google Scholar] [CrossRef]
  38. Liao, J.; Jia, Y.; Wu, Y.; Shi, K.; Yang, D.; Li, P.; Qian, Z. Physical-, chemical-, and biological responsive nanomedicine for cancer therapy. Wiley Interdiscip. Rev. Nanomed. Nanobiotechnology 2020, 12, e1581. [Google Scholar] [CrossRef]
  39. Hanahan, D.; Weinberg, R.A. Hallmarks of cancer: The next generation. Cell 2011, 144, 646–674. [Google Scholar] [CrossRef]
  40. Wong, R.S. Apoptosis in cancer: From pathogenesis to treatment. J. Exp. Clin. Cancer. Res. 2011, 30, 87. [Google Scholar] [CrossRef]
  41. Valentini, E.; D’Aguanno, S.; Di Martile, M.; Montesano, C.; Ferraresi, V.; Patsilinakos, A.; Sabatino, M.; Antonini, L.; Chiacchiarini, M.; Valente, S.; et al. Targeting the anti-apoptotic Bcl-2 family proteins: Machine learning virtual screening and biological evaluation of new small molecules. Theranostics 2022, 12, 2427–2444. [Google Scholar] [CrossRef]
  42. Li, Y.; Chen, L.; Chan, T.H.; Liu, M.; Kong, K.L.; Qiu, J.L.; Li, Y.; Yuan, Y.F.; Guan, X.Y. SPOCK1 is regulated by CHD1L and blocks apoptosis and promotes HCC cell invasiveness and metastasis in mice. Gastroenterology. 2013, 144, 179–191. [Google Scholar] [CrossRef] [PubMed]
  43. Shaban, N.Z.; El-Kersh, M.A.R.; Bader-Eldin, M.M.; Kato, S.A.; Hamoda, A.F. Effect of Punica granatum (Pomegranate) juice extract on healthy liver and hepatotoxicity induced by diethylnitrosamine and phenobarbital in male rats. J. Med. Food 2014, 17, 339–349. [Google Scholar] [CrossRef] [PubMed]
  44. Moloney, J.N.; Cotter, T.G. ROS signalling in the biology of cancer. Semin. Cell Dev. Biol. 2018, 80, 50–64. [Google Scholar] [CrossRef]
  45. Singh, R.; Letai, A.; Sarosiek, K. Regulation of apoptosis in health and disease: The balancing act of BCL-2 family proteins. Nat. Rev. Mol. Cell Biol. 2019, 20, 175–193. [Google Scholar] [CrossRef] [PubMed]
  46. Brahmbhatt, H.; Oppermann, S.; Osterlund, E.J.; Leber, B.; Andrews, D.W. Molecular pathways: Leveraging the BCL-2 interactome to kill cancer cellsmitochondrial outer membrane permeabilization and beyond. Clin. Cancer Res. 2015, 21, 2671–2676. [Google Scholar] [CrossRef] [PubMed]
  47. Bieging, K.T.; Mello, S.S.; Attardi, L.D. Unravelling mechanisms of p53-mediated tumour suppression. Nat. Rev. Cancer. 2014, 14, 359–370. [Google Scholar] [CrossRef]
  48. McComb, S.; Chan, P.K.; Guinot, A.; Hartmannsdottir, H.; Jenni, S.; Dobay, M.P.; Bourquin, J.P.; Bornhauser, B.C. Efficient apoptosis requires feedback amplification of upstream apoptotic signals by effector caspase-3 or-7. Sci. Adv. 2019, 5, eaau9433. [Google Scholar] [CrossRef]
  49. Souza, W.; Piperni, S.G.; Laviola, P.; Rossi, A.L.; Rossi, M.I.D.; Archanjo, B.S.; Leite, P.E.; Fernandes, M.H.; Rocha, L.A.; Granjeiro, J.M.; et al. The Two Faces of Titanium Dioxide Nanoparticles Bio-Camouflage in 3D Bone Spheroids. Sci. Rep. 2019, 9, 9309. [Google Scholar] [CrossRef]
  50. Ribeiro, A.R.; Gemini-Piperni, S.; Travassos, R.; Lemgruber, L.; Silva, C.R.; Rossi, A.L.; Farina, M.; Anselme, K.; Shokuhfar, T.; Shahbazian-Yassar, R.; et al. Trojan-Like Internalization of Anatase Titanium Dioxide Nanoparticles by Human Osteoblast Cells. Sci. Rep. 2016, 6, 23615. [Google Scholar] [CrossRef]
  51. Liu, K.; Liu, P.C.; Liu, R.; Wu, X. Dual AO/EB staining to detect apoptosis in osteosarcoma cells compared with flow cytometry. Med. Sci. Monit. Basic. Res. 2015, 21, 15–20. [Google Scholar] [CrossRef] [PubMed]
  52. Mosmann, T. Rapid colorimetric assay for cellular growth and survival: Application to proliferation and cytotoxicity assays. J. Immunol. Methods 1983, 65, 55–63. [Google Scholar] [CrossRef] [PubMed]
  53. Elje, E.; Hesler, M.; Rundén-Pran, E.; Mann, P.; Mariussen, E.; Wagner, S.; Dusinska, M.; Kohl, Y. The comet assay applied to HepG2 liver spheroids. Mutat. Res. /Genet. Toxicol. Environ. Mutagen. 2019, 845, 403033. [Google Scholar] [CrossRef]
  54. Bianco, G.; Fontanella, B.; Severino, L.; Quaroni, A.; Autore, G.; Marzocco, S. Nivalenol and deoxynivalenol affect rat intestinal epithelial cells: A concentration related study. PLoS ONE 2012, 7, e52051. [Google Scholar] [CrossRef] [PubMed]
  55. Lu, J.; Wu, L.; Wang, X.; Zhu, J.; Du, J.; Shen, B. Detection of Mitochondria Membrane Potential to Study CLIC4 Knockdown-induced HN4 Cell Apoptosis In Vitro. J. Vis. Exp. 2018, 137, 56317. [Google Scholar] [CrossRef]
  56. Hussein, M.M.A.; Gad, E.; Ahmed, M.M.; Arisha, A.H.; Mahdy, H.F.; Swelum, A.A.; Tukur, H.A.; Saadeldin, I.M. Amelioration of titanium dioxide nanoparticle reprotoxicity by the antioxidants morin and rutin. Environ. Sci. Pollut. Res. 2019, 26, 29074–29084. [Google Scholar] [CrossRef] [PubMed]
  57. Yu, B.W.; Li, J.L.; Guo, B.B.; Fan, H.M.; Zhao, W.M.; Wang, H.Y. Chlorogenic acid analogues from Gynura nepalensis protect H9c2 cardiomyoblasts against H2O2-induced apoptosis. Acta Pharmacol. Sin. 2016, 37, 1413–1422. [Google Scholar] [CrossRef]
Figure 1. XRD analysis (a), DLS spectrum (b), and Zeta potential (c) of TiO2 NPs. The representative images were obtained from the triplicate experiments.
Plants 12 03174 g001
Figure 2. FESEM (a), TEM (b,c), and SAED (d) pattern images of TiO2 NPs and EDAX spectrum (e).
Plants 12 03174 g002
Figure 3. An analysis of TiO2 NPs by UV absorbance (a), FTIR spectrum (b), and PL spectrum (c). The representative images were obtained from the triplicate experiments.
Plants 12 03174 g003
Figure 4. Cytotoxic effects of TiO2 NPs against Hep-G2 (a) and Hep3 (b) cells. The diverse doses (3.13, 6.25, 12.5, 25, 50, 100, and 200 µg/mL) of TiO2 NPs were treated to Hep-G2 (a) and Hep3 (b) cells. Assays were carried out in triplicate to calculate the IC50 dose, which resulted in 50% growth inhibition.
Plants 12 03174 g004
Figure 5. Apoptosis was examined in Hep3 and HepG2 cells by AO/EtBr staining with IC50 of TiO2 NPs after 24 h of treatment. Green colored cells indicate viable cells, cells with yellowish red indicate early apoptosis, and cells with red color indicate late apoptosis. Control cells, cells were treated with low dosage (IC25), high dosage (IC50) of TiO2 NPs, and 5-FU as the positive control drug. Assays were executed in triplicate and microphotographs were captured at 20× magnification.
Plants 12 03174 g005
Figure 6. Comet assay for TiO2 NPs treated Hep3 and HepG2 cells showing detectable comet tails, indicative of DNA damage. Control cells, cells treated with low dosage (IC25), high dosage (IC50) of TiO2 NPs, and 5-FU as positive control drug. Assays were executed in triplicate and microphotographs were captured at 20× magnification.
Plants 12 03174 g006
Figure 7. DAPI staining was employed to measure apoptosis in Hep3 and HepG2 cells after 24 h of exposure to TiO2 NPs. Control cells, cells treated with low dosage (IC25), high dosage (IC50) of TiO2 NPs, and 5-FU as positive control drug. Assays were executed in triplicate and microphotographs were captured at 20× magnification.
Plants 12 03174 g007
Figure 8. In Hep3 and HepG2 cells treated for 24 h with TiO2 NPs, the MMP was measured by Rh-123 staining. Control cells, cells exposed to low dosage (IC25), high dosage (IC50) of TiO2 NPs, and 5-FU as positive control drug. Assays were executed in triplicate and microphotographs were captured at 20× magnification.
Plants 12 03174 g008
Figure 9. Effects of TiO2 NPs on oxidative stress markers in Hep3 and HepG2 cells. CAT activity (one unit) is specified as a level of protein that degrades 1 μmol H2O2/s. SOD activity (one unit) is specified as a protein level needed to inhibit 50% of the SOD activity, where superoxide radicals oxidize hydroxylamine to form nitrite. Values depicted as mean ± SD of the triplicate. Each bar of treatment groups significantly differed at * p < 0.05, ** p < 0.001 when compared to control.
Plants 12 03174 g009
Figure 10. TiO2 NPs inhibits cell proliferation and promotes apoptosis in Hep3 and HepG2 cells. Caspase-3, 8, 9, Bax, Bcl-2, CytC, and p53 in both cells were studied using corresponding ELISA kits. All the assays were carried out in triplicate and the outcomes are depicted as mean ± SD. Multiple T-test were carried out to investigate the data. * p < 0.05, ** p < 0.001 indicates the p value of test when compared to the control.
Plants 12 03174 g010
Figure 11. Formation of the TiO2 NPs from Syzygium cumini seed extract.
Plants 12 03174 g011
Disclaimer/Publisher’s Note: The statements, opinions and data contained in all publications are solely those of the individual author(s) and contributor(s) and not of MDPI and/or the editor(s). MDPI and/or the editor(s) disclaim responsibility for any injury to people or property resulting from any ideas, methods, instructions or products referred to in the content.

