Article

Identification and Expression Analysis of DFR Gene Family in Brassica napus L.

College of Agronomy, Anhui Agricultural University, Hefei 230036, China
*
Author to whom correspondence should be addressed.
These authors contributed equally to this work.
Plants 2023, 12(13), 2583; https://doi.org/10.3390/plants12132583
Submission received: 27 May 2023 / Revised: 27 June 2023 / Accepted: 4 July 2023 / Published: 7 July 2023

Abstract

:
Dihydroflavonol 4-reductase (DFR) is a key enzyme in the flavonoid biosynthetic pathway and is essential for the formation of plants’ color. In this study, 26 BnDFR genes were identified using 6 Arabidopsis DFR genes as reference. The physicochemical properties, subcellular localization, and conserved structure of BnDFR proteins were analyzed; the evolutionary relationship, collinearity analysis, and expression characteristics of BnDFR genes were studied; and the correlation between the expression level of BnDFR genes and anthocyanin content in rape petals were analyzed. The results showed that the 26 BnDFRs were located in chloroplasts, cytoplasm, nuclei, and mitochondria, distributed on 17 chromosomes, and divided into 4 groups; members of the same group have a similar function, which may be related to the environmental response elements and plant hormone response elements. Intraspecific collinearity analysis showed 51 pairs of collinear genes, and interspecific collinearity analysis showed 30 pairs of collinear genes. Analysis of the expression levels of BnDFRs and anthocyanin content in different color rape petals showed that BnDFR6 and BnDFR26 might play an important role in the synthesis of anthocyanins in rape petals. This provides theoretical guidance for further analysis of the anthocyanin anabolism mechanism involved in the DFR gene in Brassica napus.

1. Introduction

Brassica napus L. (AACC, 2n = 38) is one of the most important oil crops in the world, which is widely grown as the first oil source of edible vegetable oil made in China [1]. B. napus originated in the Mediterranean about 7500 years ago and is an allopolyploid species derived from an interspecific cross between two diploid ancestors, B. rapa (AA, 2n = 20) and B. oleracea (CC, 2n = 18). Therefore, there are two sets of subgenomes in B. napus, namely the A subgenome and the C subgenome. In the world, with the continuous improvement in people’s living quality and the rapid development of the recent picnic industry, rape is not only an important source of edible vegetable oil, vegetables, and fodder [2], but also has a high ornamental value. Rape tourism also gradually began to rise, and each region, according to its unique geographical characteristics and cultural advantages, actively developed leisure agriculture and rural tourism in order to create colorful rape flower sea tourism forms [3,4]. The color of rape is the key character that determines its ornamental value. Therefore, it is of great significance to cultivate new varieties of rape with rich colors to promote the multifunctional development and utilization of rape.
Understanding the molecular mechanism of color formation in rape can greatly promote the process of variety cultivation of colorful rape. In recent years, research on the molecular mechanism of flower color and gene mapping has been gradually carried out [5,6]. Zhao et al. found that the flower color of ornamental plants could be affected by CHS (chalcone synthase), CHI (chalcone isomerase), F3H (flavanone-3-ans), DFR, ANS, and UFGT genes associated with anthocyanin metabolism [7]. Zhang et al. mapped the dominant gene of white flowers within 361 kb on chromosome C03 by fine mapping and obtained the candidate gene BnaC03.CDD4 by homologous cloning. BnaC03.CCD4 may use δ-carotene and/or α-carotene as its substrates and break the double bond at positions 9 and 10 preferentially, leading to the release of volatile alpha-ionic ketone and the relatively low accumulation of violet xanthin and other carotenoids, turning yellow flowers into white ones [8]. Additionally, the study found that the rape color is formed by chlorophyll, carotenoid, anthocyanin, and alkaloid [9]. In particular, anthocyanins not only determine the color of rape but also play an important role in the protection of the plant itself and the attraction of pollinators. Anthocyanins are widely used in the prevention and treatment of various diseases due to their antioxidant, anti-inflammatory, and anti-aging properties [10] and have attracted wide attention worldwide. Therefore, it is of great significance to study the genes regulating anthocyanin synthesis and further analyze their molecular mechanism for the color breeding of B. napus.
The dihydroflavonol 4-reductase (DFR) family is a subfamily of the NAD(P)-dependent epimerase/dehydratase family involved in the biosynthesis of anthocyanins, proanthocyanidins, and other flavonoids, widely found in plants, is an important regulatory enzyme that controls the rate of anthocyanin biosynthesis by controlling the direction of carbon flux in the anthocyanin biosynthesis pathway [11]. It has been shown that DFR is associated with anthocyanin accumulation in several horticultural plants (such as kale) [12]. DFR catalyzes dihydrokaempferol, dihydroquercetin, and dihydromyricetin to produce corresponding colorless anthocyanins: leucopelargoridin, leucodelphinidin, and leucodelphinidin, identified as key regulatory sites in anthocyanidin biosynthesis [13]. The DFR gene plays an indispensable role in the process of ornamental plant color formation and has been systematically reported in Arabidopsis [14,15,16,17,18,19], rice [18,19], Ginkgo [13], and other plants. The DFR gene was first isolated from corn and goldfish by O ‘Reilly et al. [20] using the translocon labeling method and later cloned from Petunia [21] and other species (Gerbera [22], Ginkgo [13], Scutellaria [23], etc.). However, the mechanism of DFR in the formation of rape color is still unclear. Genome-wide identification can identify genes with the same domain, which is the functional unit of a protein, and having the same domain often has the same function. Therefore, color-specific genes in rape can be identified by reference to the genes related to color that have been studied.
In order to clarify whether the DFR gene has a regulatory effect on the color formation of rape, we comprehensively analyzed the members of the DFR gene family in B. napus, and a bioinformatics analysis was conducted on the physicochemical properties, subcellular localization, and conserved structure of 26 BnDFR proteins. Then, the evolutionary relationship, collinearity analysis, and expression characteristics of BnDFR genes were studied. Lastly, we analyzed the relationship between the expression level of the DFR genes and the anthocyanin content in flowers, which laid a theoretical foundation for clarifying the mechanism of action of the DFR gene involved in the regulation of flower color in B. napus and provided an important basis for the analysis of the biological function of the DFR gene.

2. Results

2.1. Analysis of BnDFR Family Proteins

To understand the evolution of the DFR family of B. napus, blast analysis is performed using the DFR proteins sequence from Arabidopsis thaliana; as a result, a total of 26 BnDFR genes are selected with an E-value < 1 × 10−50 in the AC genome, among which there are 14 DFR genes in the A subgenome and 12 in the C subgenome, designated as BnDFR1BnDFR26 (Table S1). The analysis of the physicochemical properties and subcellular localization of DFR genes showed that proteins are significantly different (Table 1). The number of amino acids is 223~385, the molecular weight (MW) is 25.08~42.93 kD, and the theoretical isoelectric point (pI) is 4.93~8.79. In addition to BnDFR5 and BnDFR11, all the DFR proteins are acidic proteins. In terms of protein stability, BnDFR5 and BnDFR18 are unstable proteins, and all the others are stable proteins. The grand average of hydrophobicity (GRAVY) of DFR family members is less than 0, indicating that all DFR proteins are hydrophilic proteins. Subcellular localization results showed that DFR proteins are distributed in the nucleus, cytoplasm, chloroplast, and mitochondria. According to the 3D structure prediction website PHYRE2 (http://www.sbg.bio.ic.ac.uk/phyre2/html (accessed on 4 April 2023)) [24], the 3D structure of 26 BnDFR proteins are obtained (Figure 1), and the secondary structure information of the 26 proteins is analyzed by SOPMA (https://npsa-prabi.ibcp.fr (accessed on 4 April 2023)) [25]. The proportion of α-helices in the family is 39.71% (BnDFR4) to 48.19% (BnDFR6), and the proportion of random coils in the family ranges from 29.35% (BnDFR6) to 41.28% (BnDFR11). Except for α-helices and random coils, there are extended strands and β-turns. The proportion of extended strands is 11.95% (BnDFR10)–17.03% (BnDFR6), and the proportion of β-turns is 4.93% (BnDFR5)–7.89% (BnDFR18). This indicates that BnDFR proteins are mainly composed of α-helices and random coils (Table 2).

2.2. Chromosome Localization and Collinearity Analysis of DFR Family

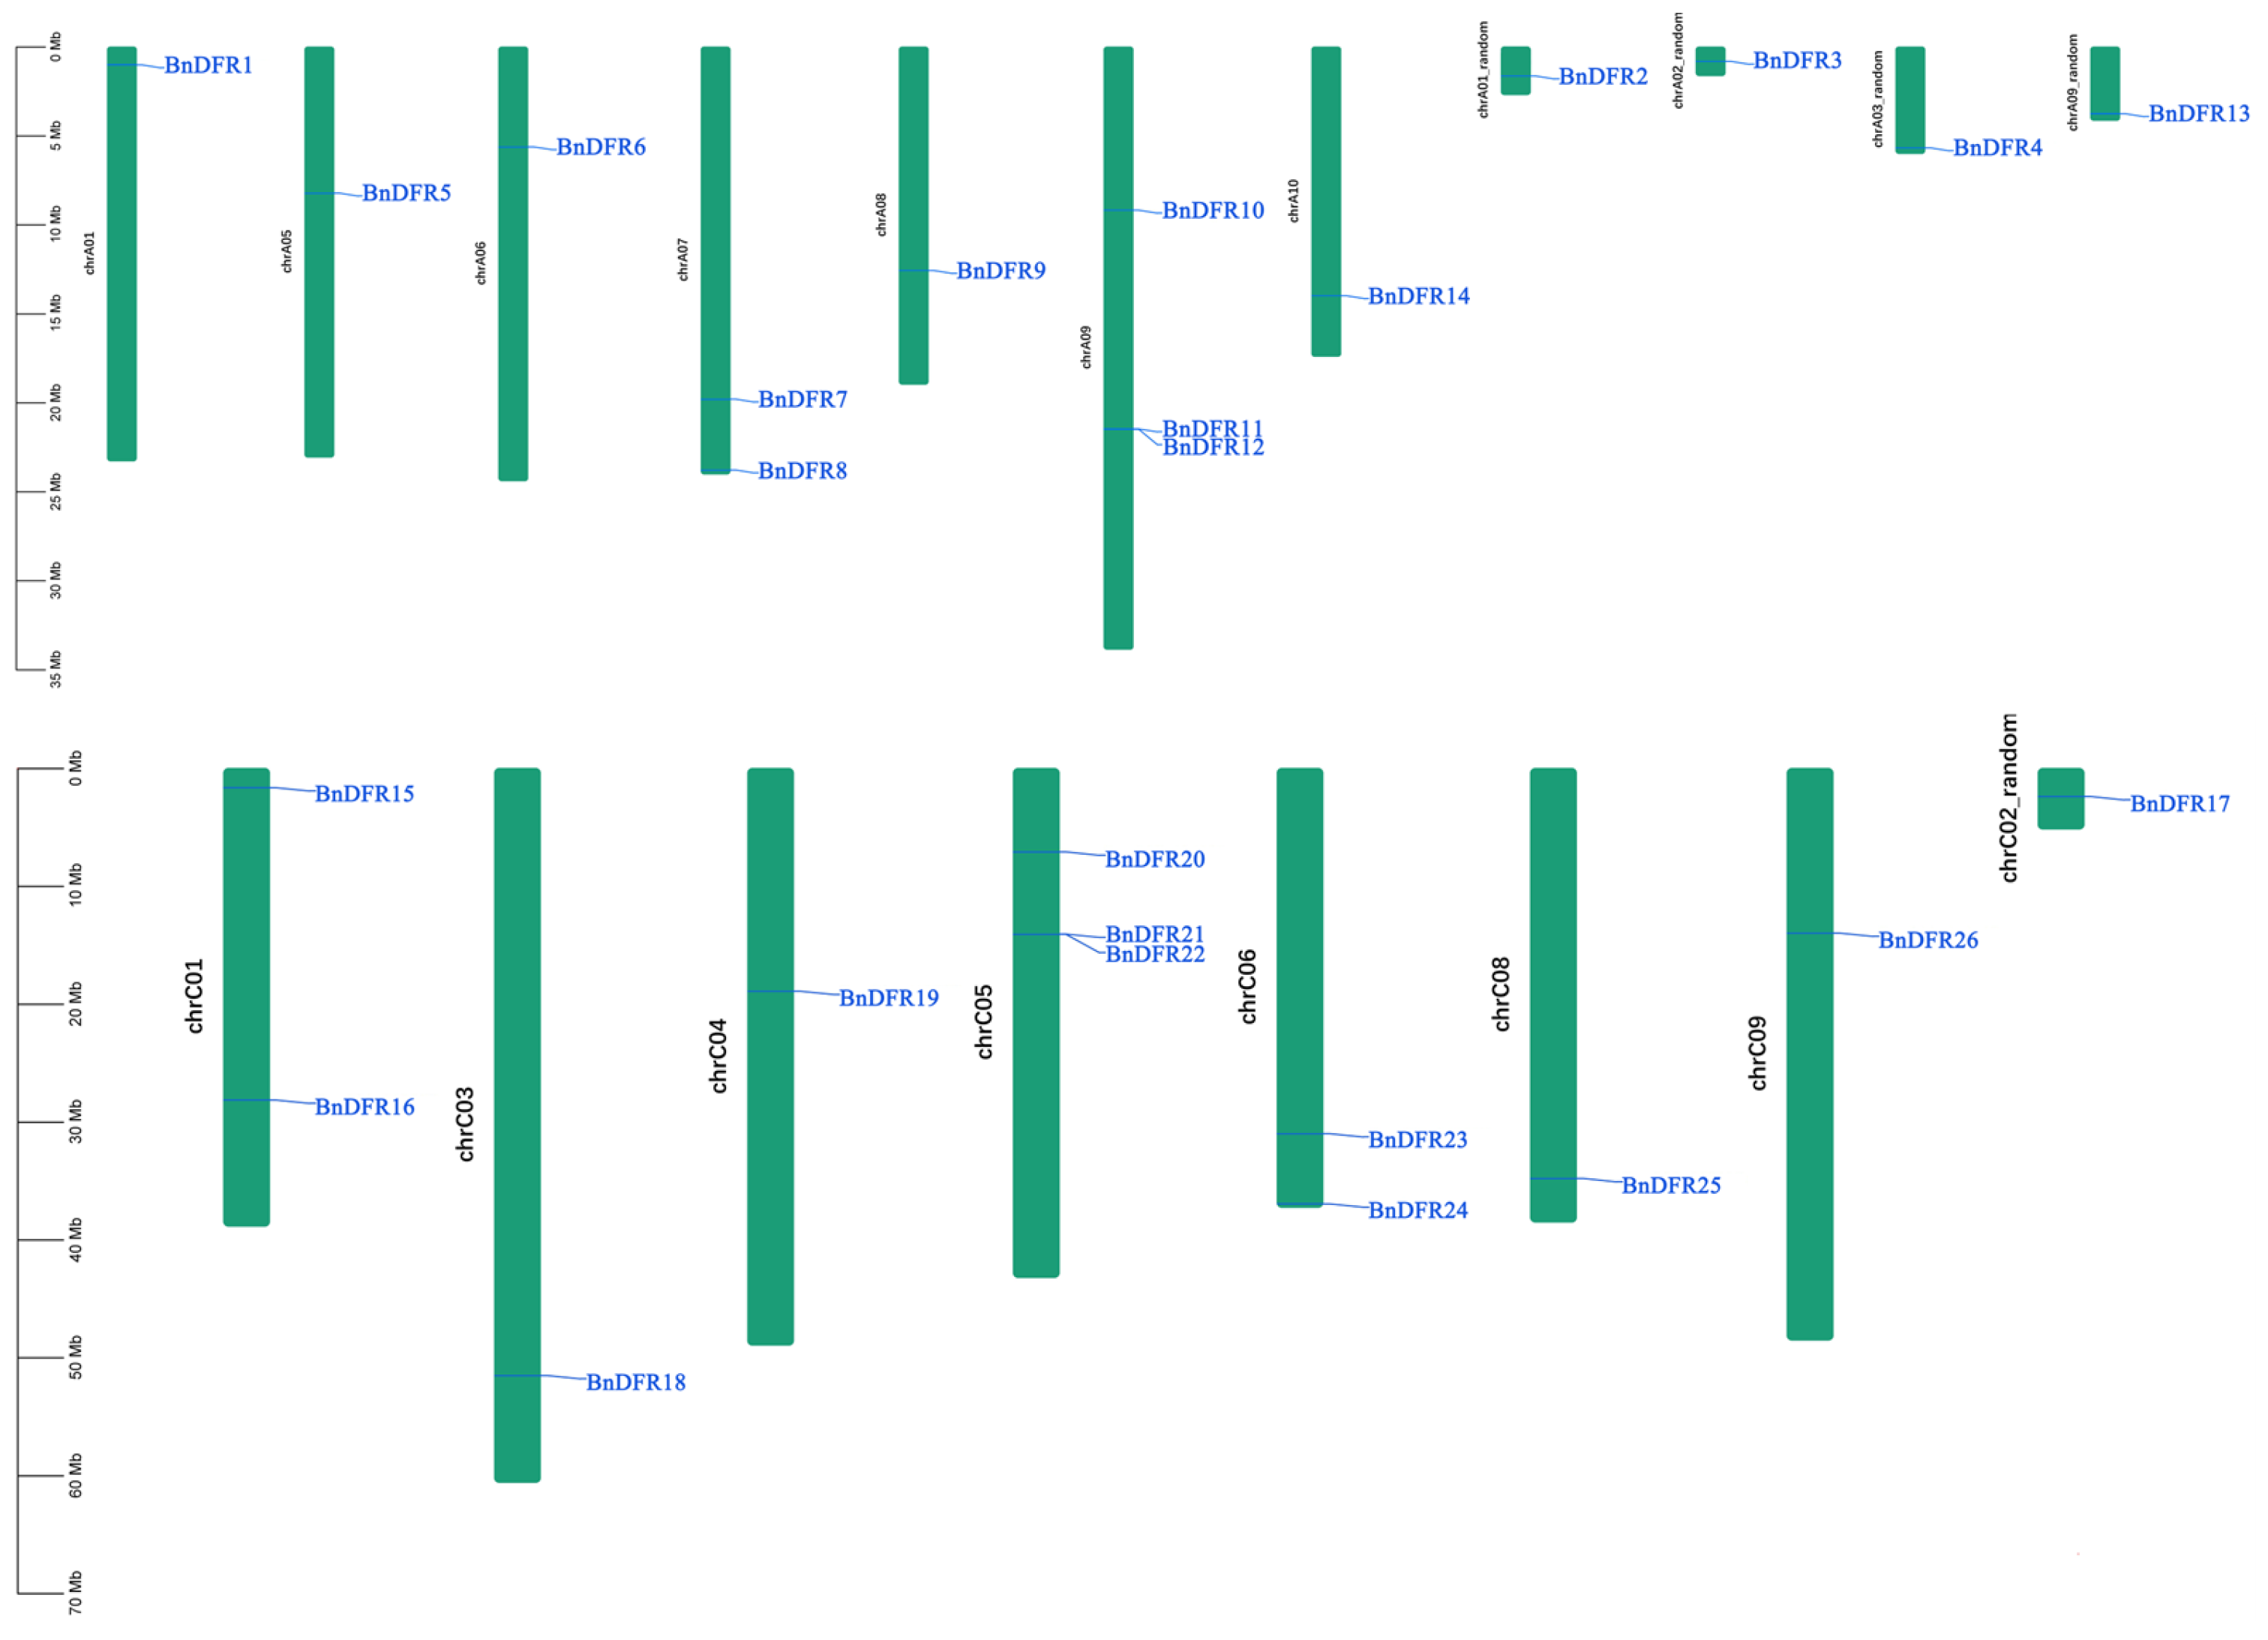
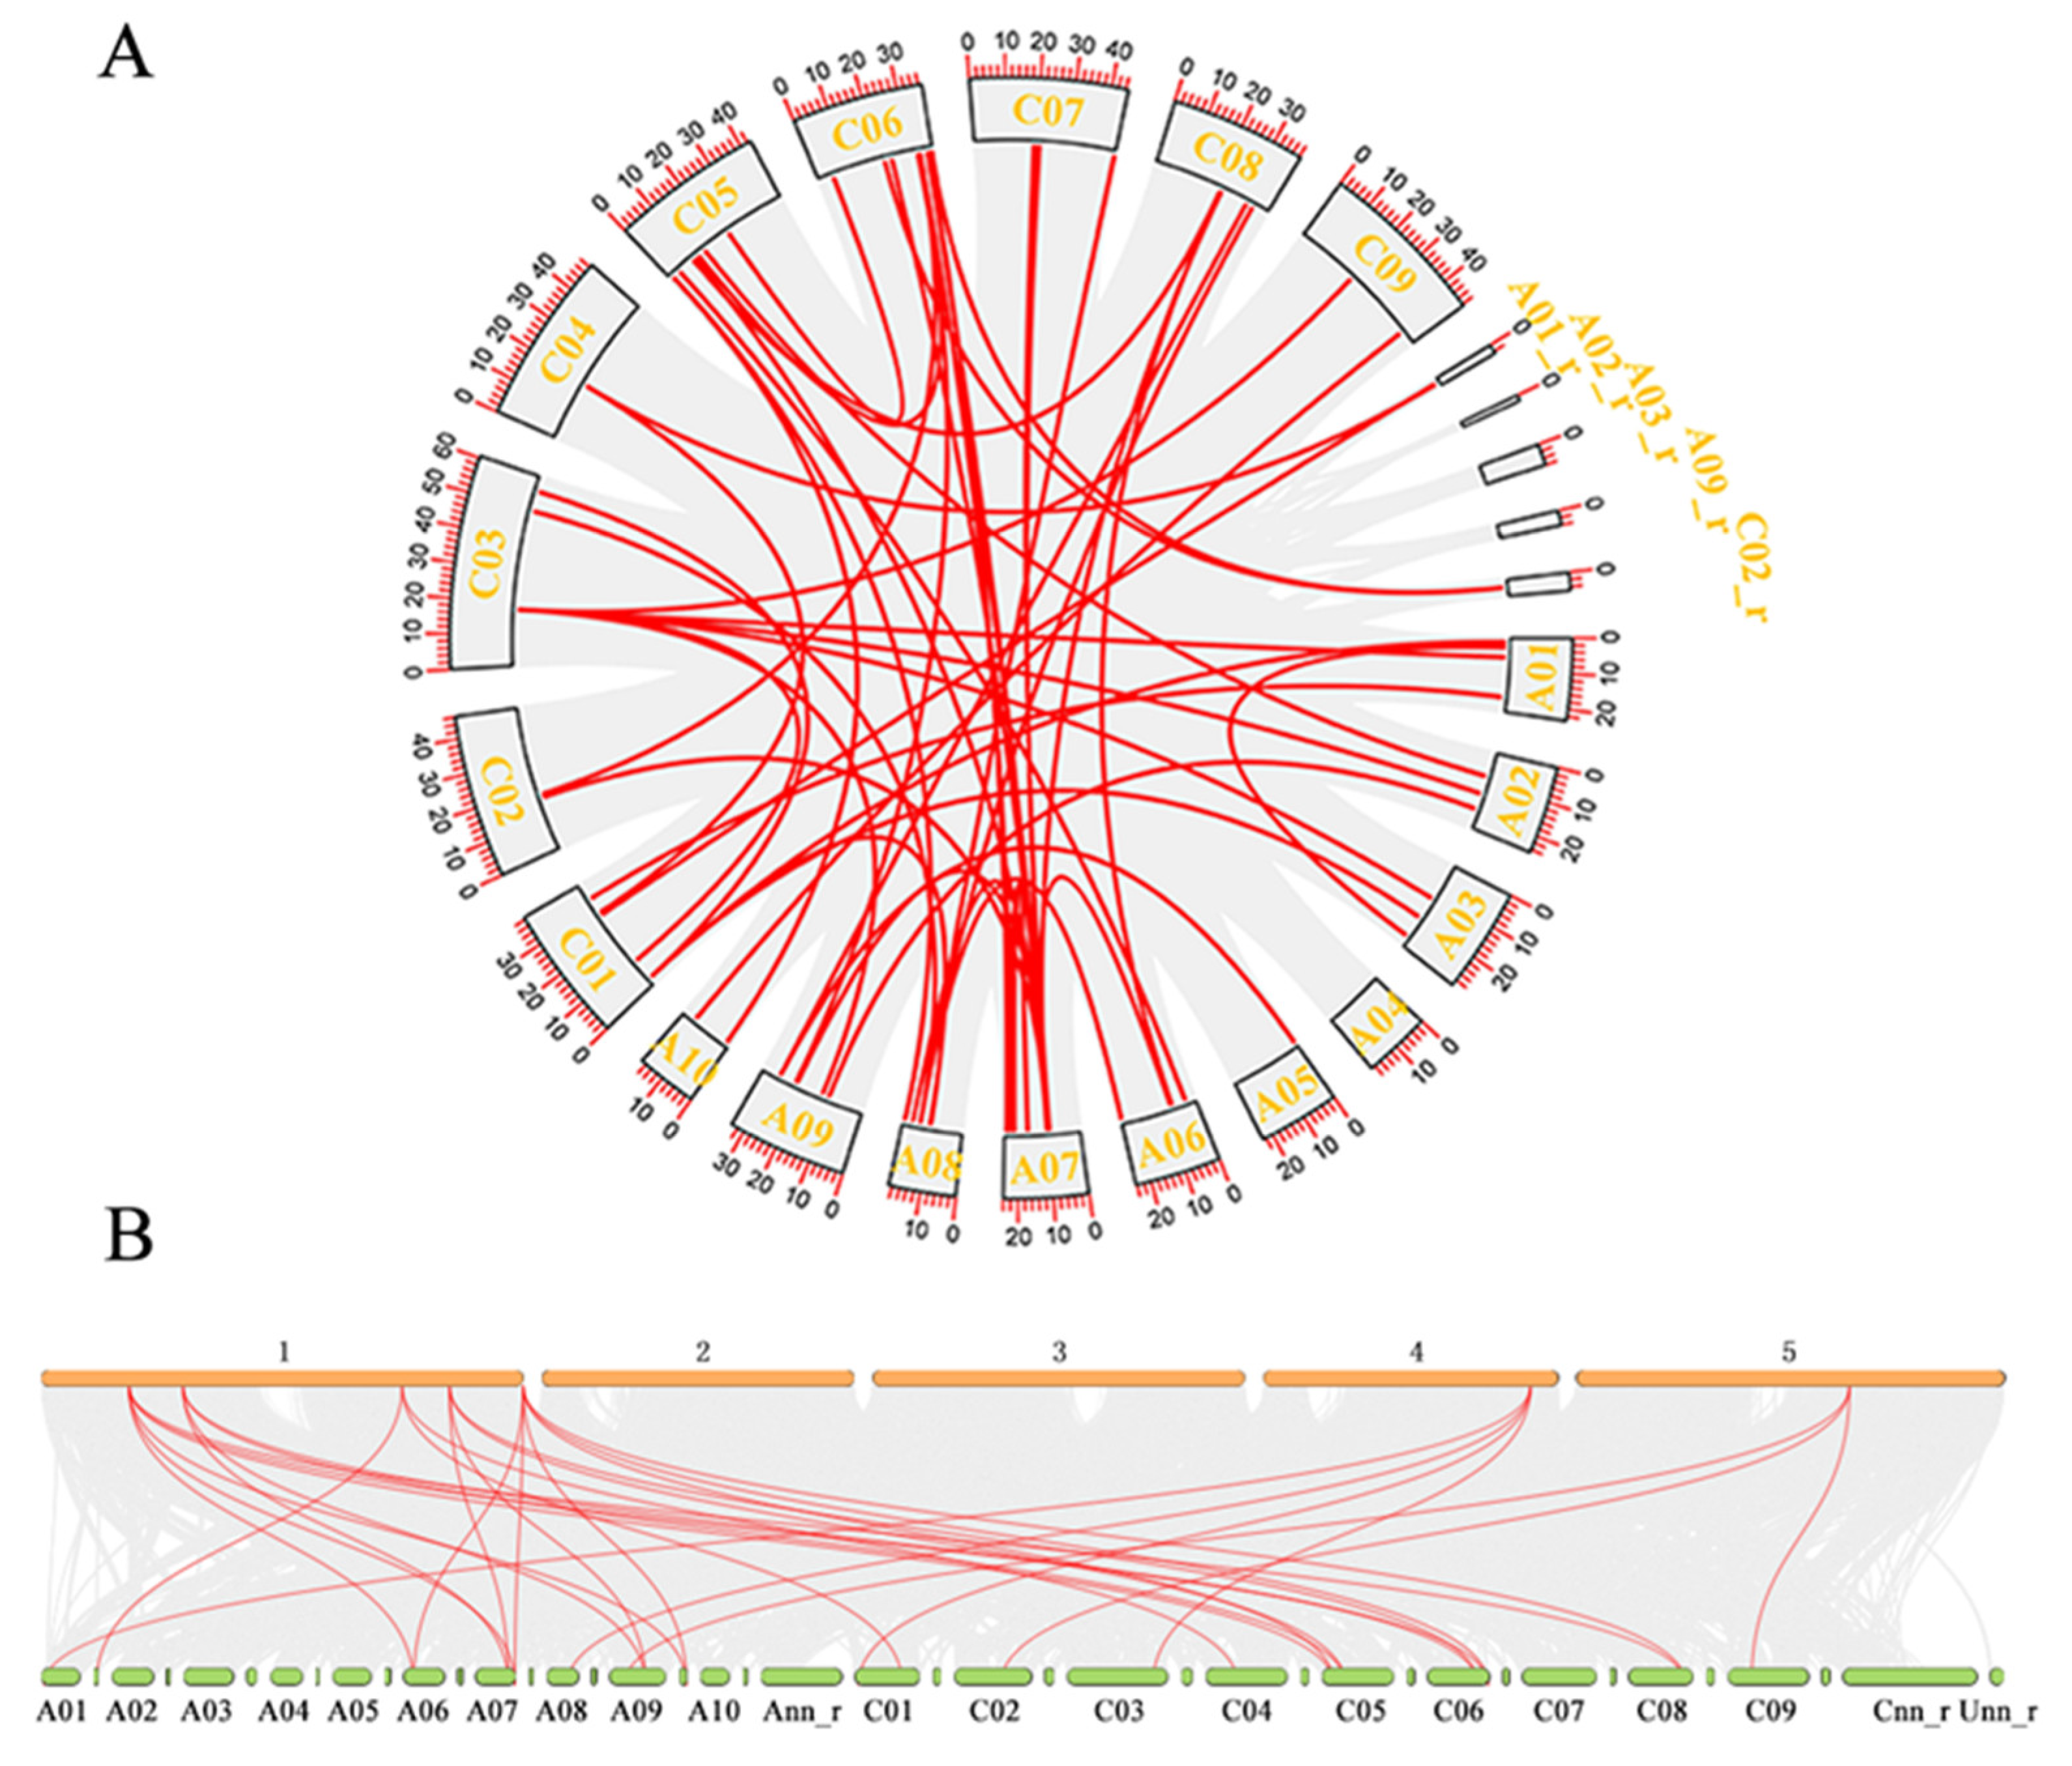
Based on the chromosome annotation information of B. napus, the identified BnDFR genes are mapped (Figure 2). According to the results of gene distribution, 26 BnDFR genes are unequally distributed on 17 chromosomes (9 in the A subgenome and 8 in the C subgenome), and only A04 and C07 are not distributed. In order to explore the evolutionary process of the BnDFR gene family, the intraspecies collinearity (Figure 3A) and interspecies collinearity (Figure 3B) are analyzed. Intraspecies collinearity analysis detected 51 pairs of collinear genes in 20 BnDFR genes, among which the A07 chromosome had the most collinear genes (16 pairs of collinear genes), indicating that gene replication greatly promoted the amplification of the DFR gene in the B. napus genome. Interspecies collinearity analysis showed that there are a large number of directly homologous DFR genes between B. napus and A. thaliana, and 21 BnDFR genes showed 30 pairs of collinearity with A. thaliana, and each AtDFR gene had 2 or more homologous genes in B. napus. The results indicated that BnDFR genes are significantly amplified during gene replication and brassica polyploidy events. In conclusion, most of the BnDFR genes remain intact during evolution.

2.3. Evolutionary Analysis of DFR Gene Family

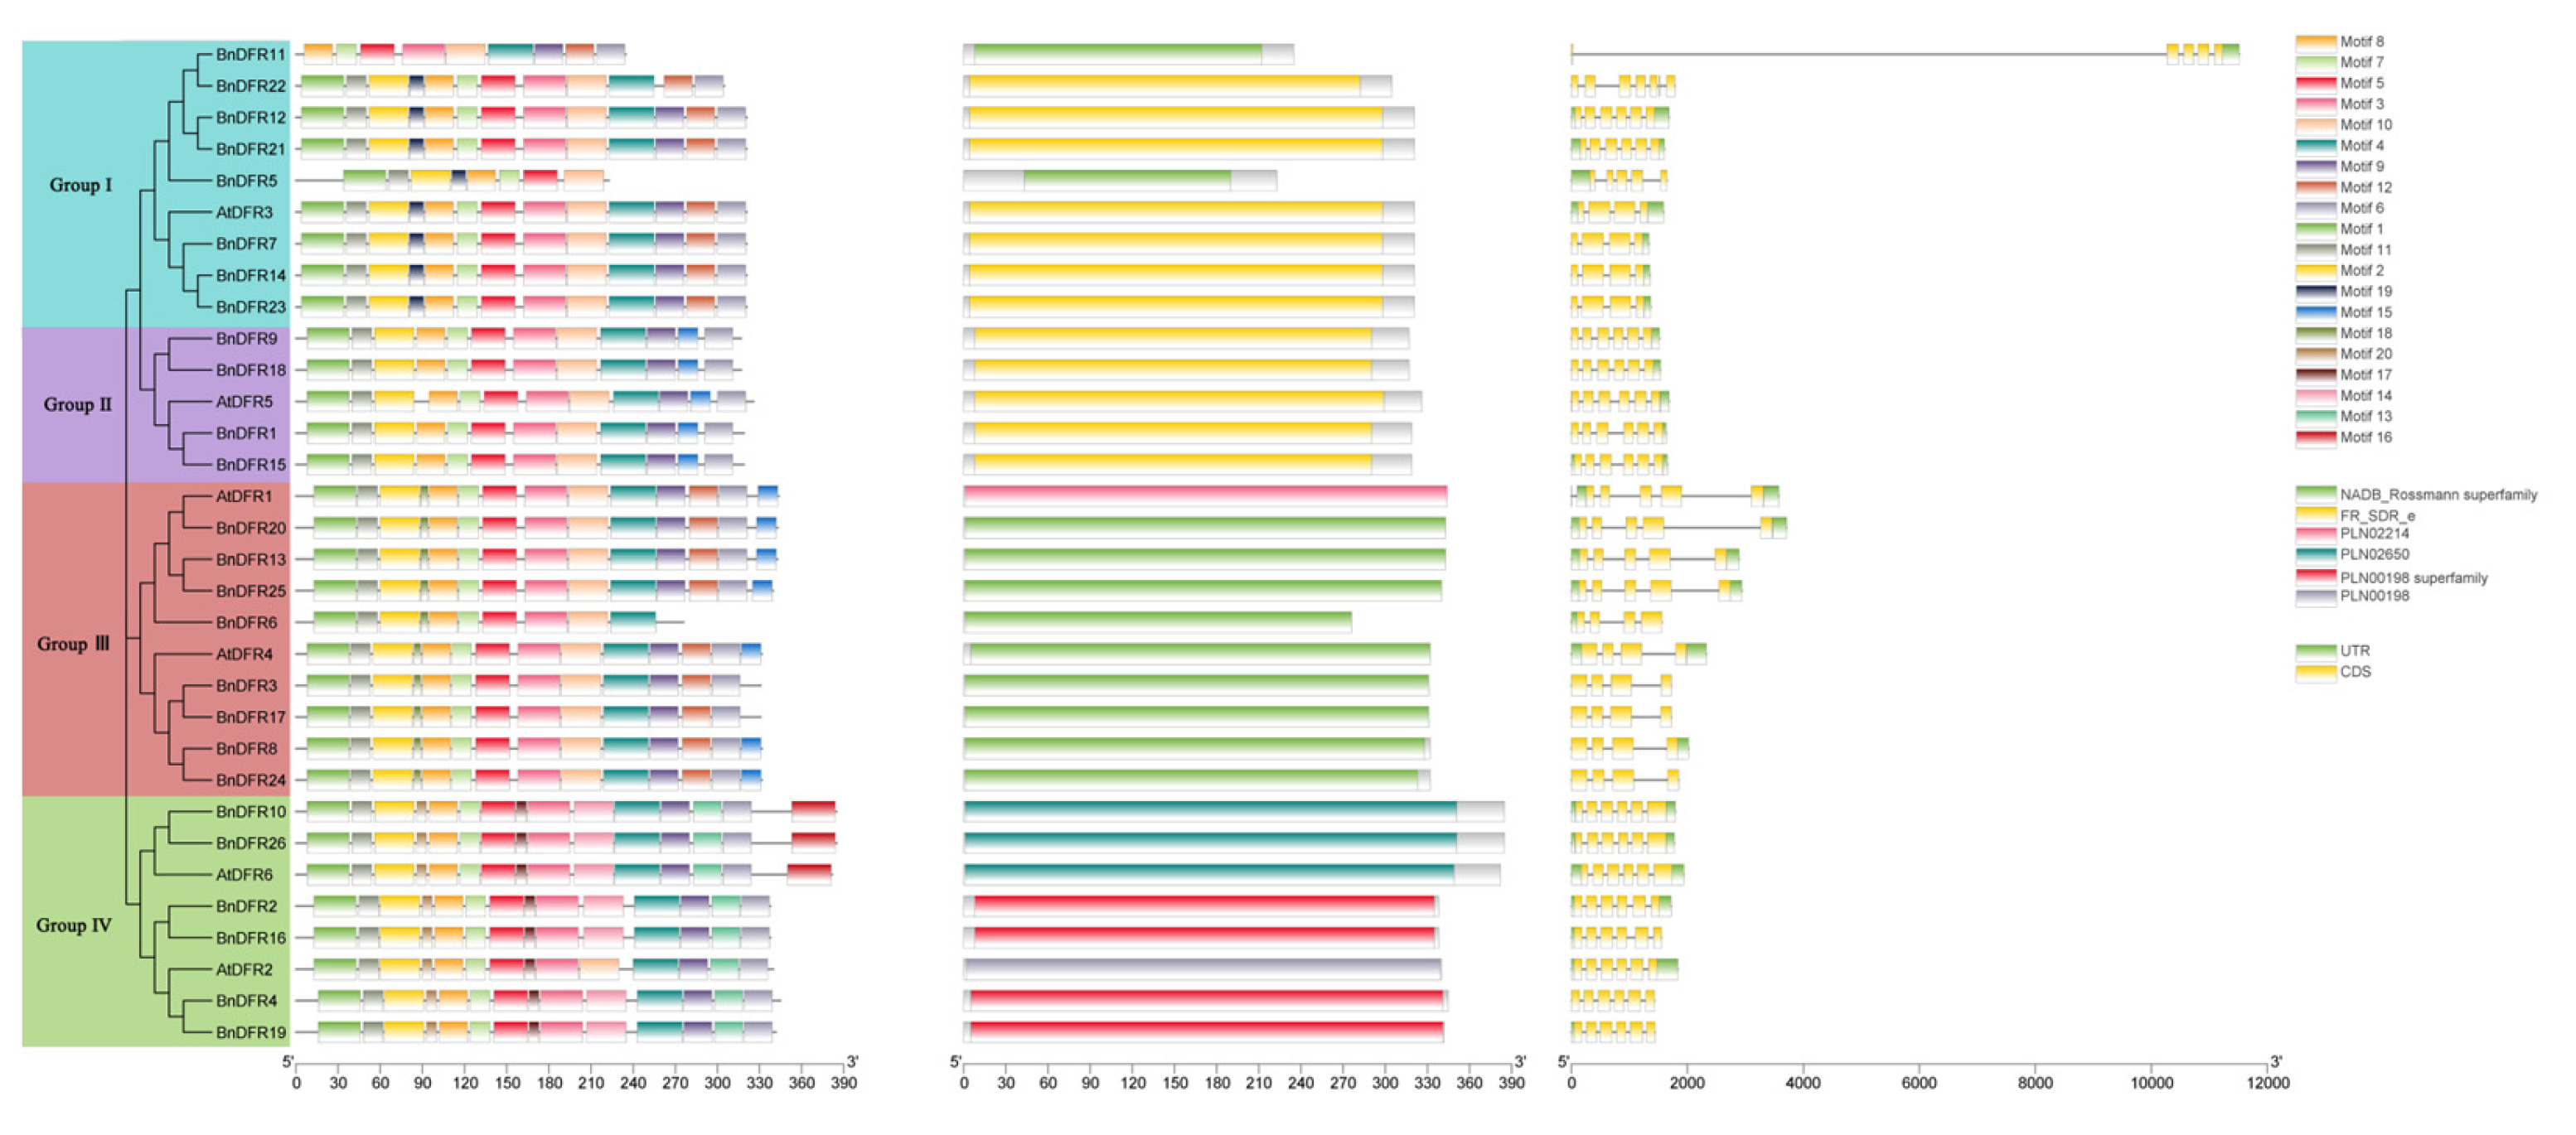
In order to further reveal the evolutionary relationship of the DFR gene family, the gene structure, conserved motif, and conserved domain are predicted and divided into four groups based on the phylogenetic tree (Figure 4). According to the phylogenetic tree, the relationship between the members of the DFR gene family can be seen more directly. There are four copies of AtDFR1, four copies of AtDFR2, three copies of AtDFR3, four copies of AtDFR4, four copies of AtDFR5, and two copies of AtDFR6 in B. napus. The five genes, BnDFR5, BnDFR11, BnDFR12, BnDFR21, and BnDFR22, are homologous to AtDFR3, but their genetic relationship has a distance. It is possible that there are great changes during the formation and evolution of B. napus.
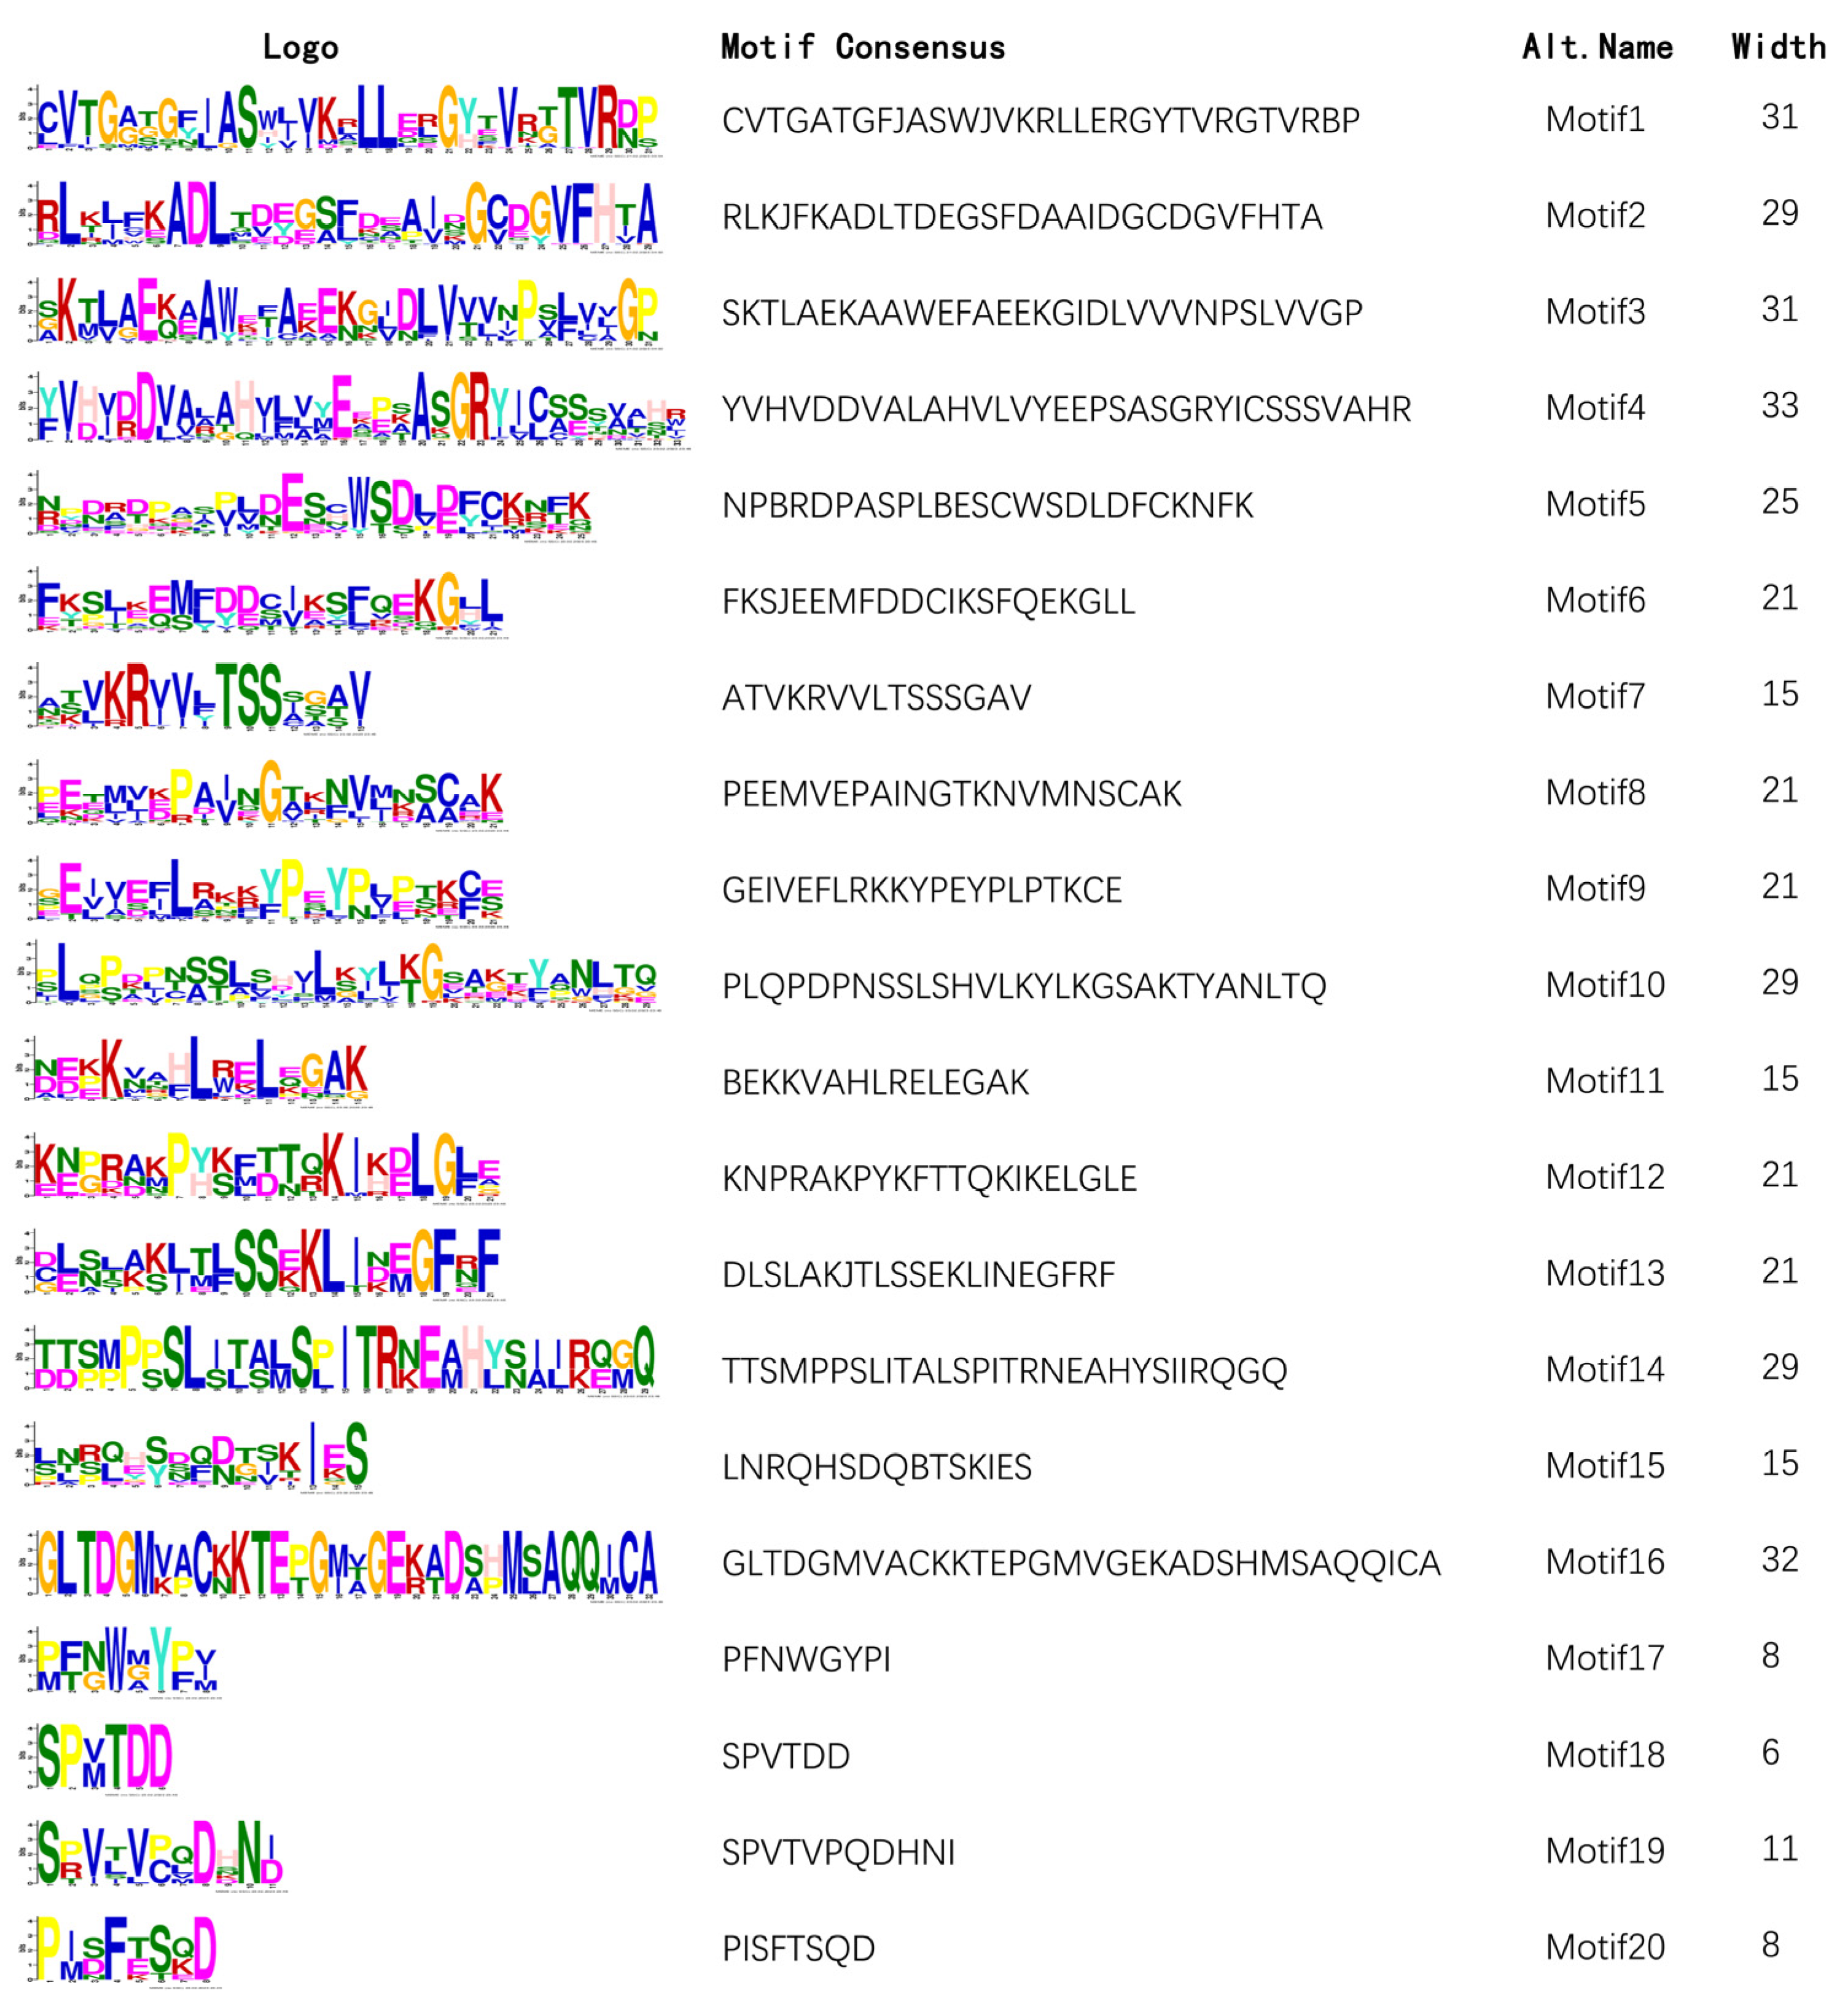
To understand the structural characteristics of DFR genes, the TBtools software is used to analyze the gene structure and intron/exon arrangement of DFRs (Figure 5). The results showed that the number of introns of all DFRs is between three and six, but it varies less within the same group. There are three to six introns in Group I, five introns in Group II, three to five introns in Group III, and five introns in Group IV. The MEME online analysis website and TBtools software are used to analyze the conserved motif of 32 DFR proteins (Figure 5). The results showed that DFRs retained a lot of conserved motifs in the evolutionary process. The figure shows the distribution of 20 highly conserved motifs in 32 DFR protein sequences. It is obvious that the conserved motifs of 32 DFR proteins mainly include motif 1, motif 11, motif 2, motif 8, motif 7, motif 5, motif 3, motif 10, motif 4, motif 9, and motif 6, and the types and amounts of conserved motifs are similar among DFR within the same group. Group I includes motifs 19 and 12; Group II includes motif 15 and motif 18; Group III includes motif 12 and motif 15; and Group IV includes motif 20, motif 17, and motif 13, in which conserved motifs of some DFR proteins are lost, and different conserved motifs may reveal the causes of functional differentiation of different groups. Therefore, we studied the conserved functional domains based on conserved motifs. Domain refers to the independent stable structural region composed of different secondary structures and super secondary structures in proteins, which is also the functional unit of proteins; different domains are often associated with different functions. The FR_SDR_e domain of Group I and Group II indicated that motif 19, motif 12, and motif 15 do not change the function of the DFR protein. The domain of BnDFR5 and BnDFR11 is the NADB_Rossmann superfamily, which is due to the loss of part of the motif, leading to functional changes. The domain of Group III is the NADB_Rossmann superfamily, this result indicated that motif 18 insertion caused changes in protein function, and PLN02214 is a member of the NADB_Rossmann superfamily. Motif 20 and motif 17 are inserted in Group IV, which caused changes in protein function, in which PLN00198 is the only member of the PLN00198 superfamily. Furthermore, the existence of motif 16 leads to further functional differentiation. In conclusion, the functions of genes in the same group of the DFR gene family are similar, and the difference in the type and amount of conserved motif will lead to a change in gene function.

2.4. Analysis of Expression Characteristics of DFR Gene Family

To further analyze the function of the DFR gene family, download the gene expression data of A. thaliana and B. napus from the Weigelworld database and the BrassicaEDB website. Flowers, leaves, roots, silique, and stems are selected to construct a heat map of expression data and combined with phylogenetic trees (Figure 6). It can be clearly seen from the figure that the expression of genes in Group I is basically non-expression or very low; the expression of AtDFR3 in Group II is higher in flowers, and the expression of BnDFRs in silique is higher; and the expression of AtDFR1 of Group III is higher in stems, the expression of AtDFR4 in roots is higher, and the expression of BnDFRs is higher in flowers. The expression level of AtDFRs in Group IV is higher in silique, while the expression level of BnDFRs is higher in roots.
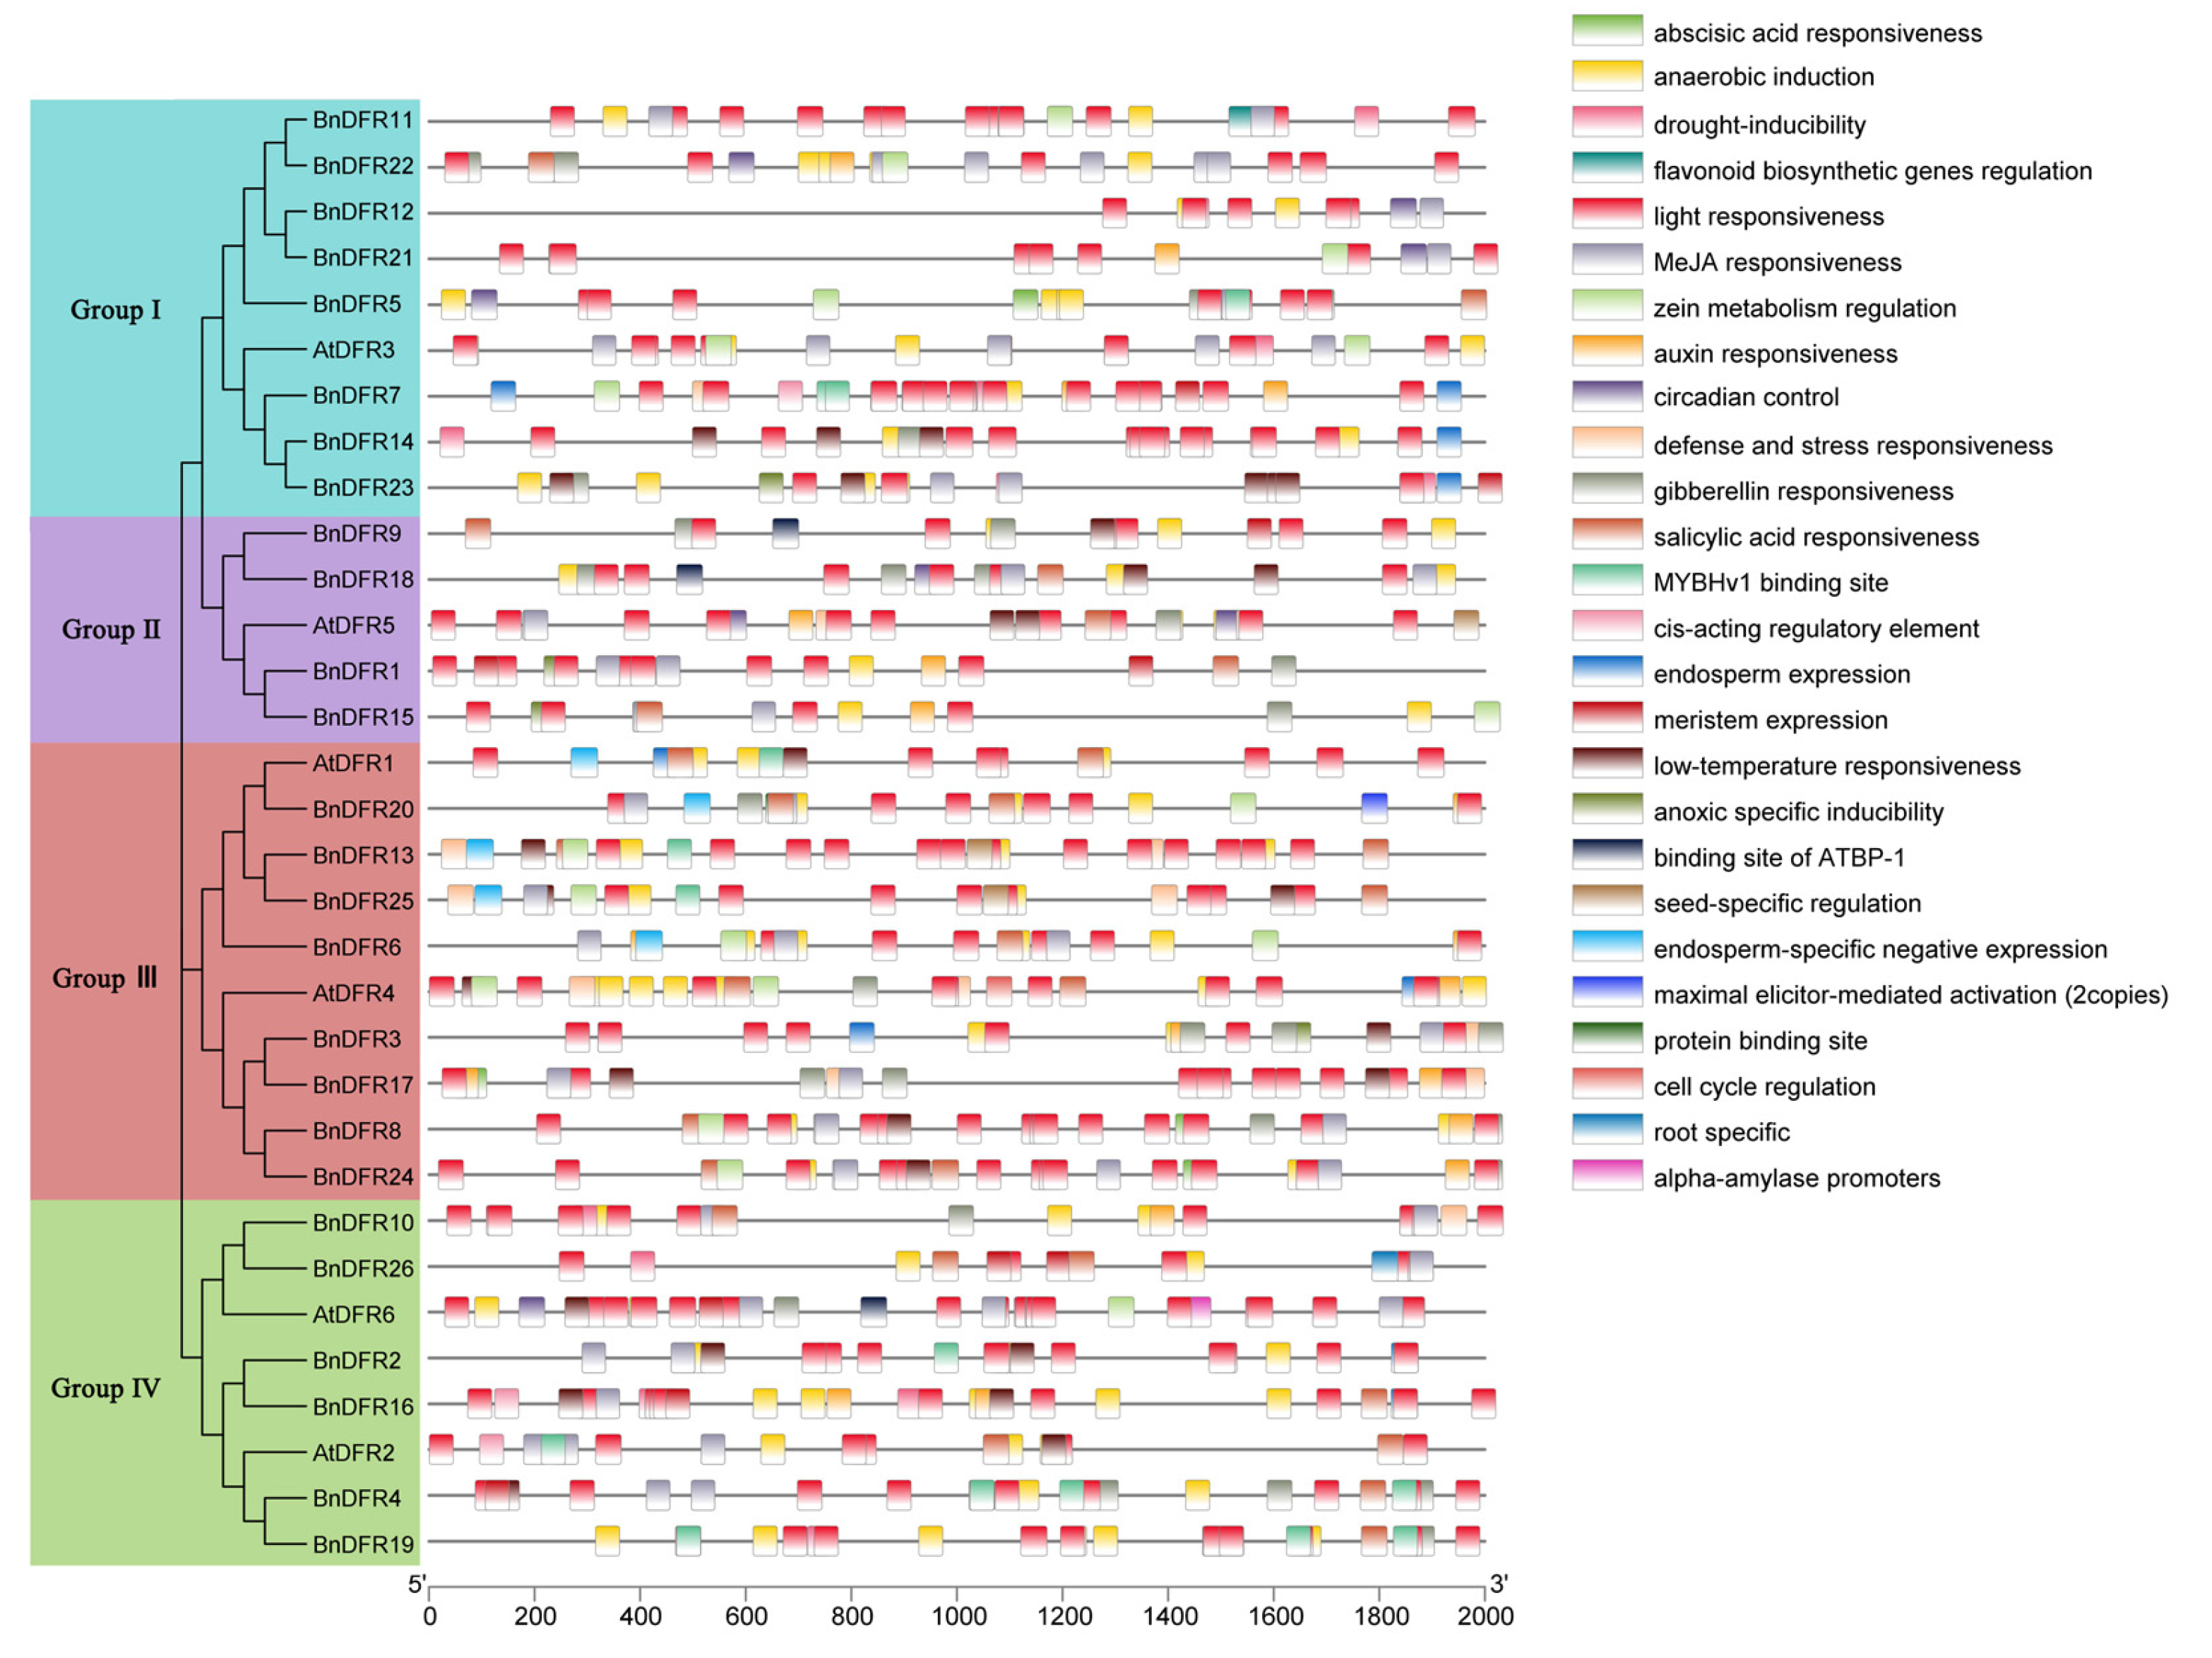
Cis-acting elements are transcription factor binding sites and other regulatory motifs with special functions in genes, which play an important role in the regulation of gene transcription initiation. The online website PlantCare is used to analyze the cis-acting elements within 2000 bp upstream of the DFR gene promoter. The cis-acting elements are drawn after the removal of two essential elements common in eukaryotes, CAAT-BOX and TATA-BOX, as well as some unnamed and uncommented elements (Figure 7). The remaining components contain a large number of elements related to hormone response and environmental stress response, such as abscisic acid responsiveness (ABRE); anaerobic induction (ARE); light-responsive elements, G-BOX, BOX 4, and MRE; and MeJA-responsive elements, CGTCA-motif, TGACG-motif, etc. There are 180 cis-acting elements in A. thaliana, among which the most elements are light-responsive elements at 38.33%, MeJA-responsive elements at 14.44%, anaerobic induction elements at 12.22%, and abscisic acid response elements at 10.56%. Likewise, there are 681 cis-acting elements in B. napus, of which the most are light-responsive elements accounting for 38.62%; MeJA-responsive elements accounting for 12.92%; abscisic acid response elements accounting for 10.43%; and anaerobic induction elements accounting for 10.43%. In addition, all 32 DFR genes contained light-responsive elements; only BnDFR21 does not contain anaerobic induction elements. According to the analysis of cis-acting elements by different group members, it is found that there is no binding site of ATBP-1 element in Group I. The members of Group II do not contain abscisic acid responsiveness, flavonoid biosynthetic genes regulation, and MYBHv1 binding site elements. There is no flavonoid biosynthetic gene regulation and binding site of ATBP-1 in Group III, but the protein binding site element is unique in this group. Group IV contains the largest number of components, which basically contains all components related to anthocyanin biosynthesis in other groups. These results indicate that the expression of the DFR gene is regulated by various signals, and the functions performed by different groups of the DFR gene family are specific, suggesting that the DFR gene plays an important role in normal plant development.

2.5. Determination of Anthocyanin Content and Analysis of BnDFRs Expression in Rape of Different Color

In order to deeper understand the expression of the DFR gene in anthocyanin biosynthesis, solvent extraction is used to determine anthocyanin in the rape petals of five colors. According to the gene expression database, 11 genes with high expression in flowers are screened out for qRT-PCR to detect their expression levels (Figure 8). These 11 genes included 2 BnDFRs in Group I, 1 BnDFR in Group IV, and all BnDFRs in Group III. Additionally, the expression level of BnDFRs in Group III is significantly higher than that of other BnDFRs. As shown in Figure 8, the anthocyanin content of red, pink, and orange is significantly higher than that of yellow and white flowers, but only BnDFR6 and BnDFR26 in qRT-PCR results are consistent with this result, so it is speculated that BnDFR6 and BnDFR26 could promote anthocyanin biosynthesis and accumulation.

3. Discussion

B. napus is the main cultivated variety in China, which is planted in a large area in Hunan, Jiangxi, Anhui, and Zhejiang [26]. In rape festival tourism projects all over the country, colorful rape has been vigorously promoted and achieved remarkable results [27], indicating a broad market prospect and a high demand for colorful rape varieties, while the color of rape is the result of a combination of various factors. At present, research on the composition, biosynthetic pathway, and related genes of anthocyanin has been well understood [7]. With the development of transcriptomics and metabolomics, new research ideas have been provided for the analysis of the formation and regulation of the color of rape. For example, Yin et al. conducted a metabonomics analysis on the petals of four different colors of rape and determined the components and relative contents of flavonoids and anthocyanins in the petals. It was found that the content of anthocyanin in the petals of orange and pink flowers is significantly higher than that of yellow and white flowers, while there is no significant difference in the content of anthocyanin in yellow flowers and white flowers [28], which is consistent with the results of anthocyanin content measurement in this study.
DFR is the first key enzyme in the downstream pathway of anthocyanin biosynthesis, encoded by single or multiple genes. With the help of NADPH, and ANS, UFGT, it selectively catalyzed the formation of dihydroflavonol into pelargonidin, which made the color orange/brick red, catalyzed dihydroquercetin into cyanidin, which made the color magenta/red, and catalyzed dihydromyricone into delphiniside, which made the color blue/purple [29], plays a key role in anthocyanin biosynthesis. In recent years, a number of studies have shown that DFR is closely related to the flower color of many plants. For example, Fan Yan et al. studied two mutant 222-A-3 (near-white flower) and E30-D-1 (light-purple flower) and a near-isogenic line Clark-w4 (near-white flower) soybean. It is found that the DFR gene can regulate the formation of white to purple flowers of soybean [30]. Zhao et al. studied the expression of the DFR gene in different tissues of peonies and found that the highest expression is found in petals with high anthocyanin content [31], and similar reports were also reported in Asian lily [32] and gentian [33]. These results indicated that the DFR gene regulates flower color formation at the transcriptional level. In this study, qRT-PCR results also showed that the expression levels of BnDFR6 and BnDFR26 are consistent with the levels of anthocyanin content.
The model plant A. thaliana has obtained six DFR genes, which are responsible for different functions of anthocyanin biosynthesis. AtDFR3 and AtDFR5 play a role in the reduction in NADP-dependent flavonoids. AtDFR1 and AtDFR4 are responsible for specifically binding substrates and catalyzing specific enzymatic reactions; AtDFR6 catalyzed the formation of colorless anthocyanins; AtDFR2 is related to anthocyanin reduction reaction. The genome of B. napus has been sequenced, so we can systematically study and analyze the DFR family of B. napus. Six known AtDFR genes are used to identify, collate, and analyze the DFR gene family of B. napus. A total of 26 BnDFRs are identified and located on 17 chromosomes (9 in the A subgenome and 8 in the C subgenome) (Figure 2). Using the neighbor-joining (NJ) method, a phylogenetic tree was constructed by 26 members of B. napus and 6 members of A. thaliana (Figure 6). The phylogenetic results showed that except for three copies of AtDFR3 and two copies of AtDFR6 in B. napus, the remaining AtDFRs have four copies in B. napus, but in general, the gene in A. thaliana has six copies in B. napus [34]. In addition, interspecies collinearity analysis showed that there are three to six copies of AtDFR genes in the B. napus genome, indicating that the DFR gene had been lost during the formation and evolution of B. napus, and the remaining BnDFR genes may retain important functions. Although the sequence and molecular weight of BnDFRs vary greatly, the domain and motif composition are conserved.
In each group, most BnDFRs contain highly conserved motifs, and the types and amounts of motifs are different in each group (Figure 4). Therefore, we believe that the difference in motifs is the main cause of the functional differentiation of BnDFRs. In Group I, BnDFR5 and BnDFR11 apparently lost some conserved motifs in the evolutionary process, leading to functional changes. In Group III, functional changes are caused by the insertion of motif 18, and in Group IV, functional changes are also caused by the insertion of motif 17 and motif 20. Moreover, the addition of motif 16 resulted in further functional differentiation. Conserved functional domains are functional units of proteins that reveal the differentiated functions of different subfamilies, among which FR_SDR_e acts in the NADP-dependent reduction in flavonoids, ketone-containing plant secondary metabolites. The NADB_Rossmann superfamily is found in numerous dehydrogenases of metabolic pathways such as glycolysis and many other redox enzymes. PLN02214 is cinnamoyl-CoA reductase as a member of the NADB_Rossmann superfamily. PLN00198 superfamily is considered as anthocyanidin reductase provisionally, and PLN00198 is the only member of the PLN00198 superfamily. PLN02650 is dihydroflavonol-4-reductase. These results indicate that the functions of BnDFRs are differentiated, but they still play a certain role in anthocyanin synthesis.
Gene function is highly correlated with cis-acting elements in its upstream promoter region. Analysis of cis-acting elements in the promoter region of the BnDFR gene family showed that there are a large number of elements related to light response in all BnDFR genes (Figure 7), and it has been found that light can promote the expression of anthocyanin biosynthesis pathway structure genes and regulate genes. For example, strong light promoted the expression of structural genes AtCHS, AtF3H, AtDFR, and regulatory genes AtPAP1 and AtPAP2 for anthocyanin synthesis in A. thaliana, thus promoting the synthesis and accumulation of plant anthocyanins [35]. Strong light promoted the expression of PhCHS, PhCHI, and PhFLS in Petunia, while low light or darkness caused the expression of anthocyanin structural genes in Petunia and Perilla to be down-regulated or even not expressed, resulting in white or light-colored flowers [36,37]. The expression levels of structural genes such as FaCHS, FaCHI, FaF3H, FaDFR, FaANS, and FaUFGT and transcription factors FaMYB10 and FaMYB1 in strawberry decreased with the decrease in light intensity, and weak light weakened the red color of strawberry and reduced the anthocyanin content [38]. Tuberose is purplish red under strong light but will fade under weak light [39], which provides the basis for BnDFR genes to regulate color. There are other elements related to abiotic stress and hormone response, and there is specificity between different groups of elements. According to tissue-specific expression data, BnDFRs highly expressed in flowers are mainly in Group III, which contains protein binding site elements that are different from other groups. Such elements are mainly combined with transcription factors to regulate the expression of target genes [40]. At present, transcription factors affecting flower color include MYB, bHLH, and WD40 [41]. Therefore, it is speculated that BnDFRs containing protein binding site elements can bind transcription factors to promote the expression of the DFR gene, and different groups play different functions, which plays an important role in the growth and development of B. napus.
The subcellular localization of DFR proteins in B. napus is diverse and mainly exists in chloroplasts and the cytoplasm, among which all members of Group II exist in chloroplasts, and all members of Group III exist in the cytoplasm, as well as anthocyanins are synthesized in the cytoplasm and transferred to vacuoles after synthesis [42,43,44] (Table 1). Meanwhile, in tissue-specific expression data, the expression level of Group III in flowers is significantly higher than that of other groups, suggesting that members of Group III may play an important role in anthocyanin biosynthesis. Although studies have shown that DFR can catalyze three substrates in many plants, some DFRs can catalyze only one substrate with substrate specificity, such as in Petunia and Cymbidium, which cannot produce orange flowers based on pelargonium [45]. Johnson et al. [22] showed that the substrate specificity of Gerbera was directly determined by the amino acid residue between positions 134 and 145. According to the amino acid residues at the 134th position, DFR is divided into 3 categories. The first category is aspartamide (Asn)-type DFR. Most plant DFR is of this type, and its amino acid residues are Asn. The second type is aspartic acid (Asp)-type DFR, whose amino acid residue is Asp, which has no catalytic activity for DHK, such as Petunia. The third class is non-Asn/Asp-type DFRs, whose amino acid residues are neither Asn nor Asp. Among the 26 BnDFR in this study, BnDFR6, BnDFR13, BnDFR20, and BnDFR25 are Asp-type DFRs, and all belong to Group III. The remaining DFRs are non-Asn/Asp-type DFRs. In addition, some BnDFR was highly expressed in materials with low anthocyanin content, and others were highly expressed in materials with high anthocyanin content, suggesting that BnDFRs may have substrate specificity (Figure 8). Whether the difference in flower color is affected by the DFR effect of a single gene or the result of the superposition of multiple genes, as well as how to regulate and coordinate the effect, still need to be further studied. The DFR genes play an important role in the development and coloration of B. napus. The exact role of BnDFR gene family members in B. napus has not been clarified. In this study, 26 BnDFR family members in B. napus are identified through bioinformatics analysis. The BnDFR genes are systematically studied from the aspects of evolution, gene location, gene structure, protein physicochemical properties, expression characteristics, and so on, the tissue specificity of the BnDFRs gene was revealed, and the correlation between the expression of BnDFRs and the synthesis of anthocyanins in rape petal was analyzed. Learned that the expression levels of BnDFR6 and BnDFR26 are consistent with the content of anthocyanins, so it is speculated that BnDFR6 and BnDFR26 play an important role in the synthesis and accumulation of anthocyanins in rape petals. However, the specific function and response mechanism still need further study. This study provides a theoretical basis and bioinformatics reference for the function of the DFR gene and its involvement in anthocyanin biosynthesis in B. napus. Moreover, it will be helpful for further research on the evolutionary origin of BnDFRs and the function of BnDFRs candidate genes in rape molecular breeding.

4. Materials and Methods

4.1. Materials and Data Sources

Rape of different colors is planted in the campus experimental field (31.92° N, 117.21° E). The A. thaliana and B. napus protein files and associated annotation files can be downloaded from the Ensembl Plants website (http://plants.ensembl.org/index.html (accessed on 23 November 2022)).

4.2. Analysis of BnDFR Family Proteins

Search and download the dihydroflavonol 4-reductase subfamily protein sequence at UniProt website (https://www.uniprot.org/ (accessed on 23 November 2022)) [46], then BlastP is performed on Ensembl Plants website with B. napus genome database using Arabidopsis DFR gene family, and BnDFR candidate genes are selected according to E-value < 1 × 10−50.
Using the ProtParam tool (https://web.expasy.org/protparam/ (accessed on 27 November 2022)), we analyzed A. thaliana and B. napus DFR proteins [47] of the physicochemical properties. It includes molecular weight (MW), theoretical point of isoelectric (pI), instability index (II), and grand average of hydrophobicity (GRAVY). Moreover, using the Wolf Psort (https://www.genscript.com/wolf-psort.html (accessed on 9 December 2022)) predicts the DFR protein subcellular localization (SL) [48]. The protein homology/analogy recognition engine website PHYRE2 was used to predict BnDFRs 3D protein structure [49]. The α-helices, β-turns, and other information are analyzed by the protein secondary structure prediction website SOPMA; this website is easy to use and has a simple interface that is used in most articles.

4.3. BnDFR Gene Location and Collinearity Analysis

Download the DNA file and annotation file (GTF) of A. thaliana and B. napus on Ensembl Plants website. The interspecies collinearity and intraspecies collinearity analysis diagrams are drawn by using One Step MCScanX and Advance Circos functions of TBtools [50]. Use Gene Location Visualize from GTF/GFF function to map the distribution of the BnDFR gene family on chromosomes.

4.4. Analysis of Gene Structure, Conserved Motifs, and Conserved Domain of DFR Family Proteins

After downloading the gene structure annotation file (GTF file) on Ensembl Plants website. The structure information of the DFR Gene family in A. thaliana and B. napus is visualized by using Gene Structure View (Advanced) function in TBtools software. The conservative analysis of DFR protein sequences is implemented by MEME (https://meme-suite.org/meme/tools/meme (accessed on 4 February 2023)) [51] and the Simple MEME Wrapper function of the TBtools software, set 20 Motifs and the number of motif occurrences on each sequence is not limited. Other parameters are default. Conservative structure domain is analyzed by the CD search function of NCBI (https://www.ncbi.nlm.nih.gov/Structure/cdd/wrpsb.cgi (accessed on 21 February 2023)) [52,53].

4.5. Cis-Acting Element Analysis of DFR Gene Promoter Region

Gtf/Gff3 Sequences Extract in TBtools is used to extract the upstream 2000 bp parameters of CDS and extract the promoter sequence of DFR genes, submitted to PlantCARE database (http://bioinformatics.psb.ugent.be/webtools/plantcare/html/ (accessed on 26 November 2022)) to analyze its promoter region cis-acting element [54], and the resulting file is filtered based on the information in the table and retained for viewing purposes, then visually presented by using the Simple BioSequence Viewer function of TBtools software.

4.6. Evolutionary Analysis and Tissue Expression Specificity Analysis of DFR Gene Family

MEGA11 software is used to construct the phylogenetic tree of DFR genes of A. thaliana and B. napus. Match the full-length sequences of DFR proteins with each other, and the phylogenetic analysis is performed. The neighbor-joining (NJ) tree is constructed with parameters set to bootstrap = 1000, then using the iTOL (https://itol.embl.de/ (accessed on 14 April 2023)), an online mapping website, to beautify the evolutionary tree [55]. The expression data of A. thaliana and B. napus are downloaded from Weigelworld database (https://weigelworld.org/resources.html (accessed on 18 February 2023)) and BrassicaEDB (https://brassica.biodb.org/ (accessed on 18 February 2023)). Five tissues, root, stem, leaf, flower, and silique, are selected [56]. The gene expression data is imported into iTOL website and combined with DFR gene family phylogenetic tree for display.

4.7. Anthocyanin Content Determination, Expression Modeling Analysis of the BnDFRs, and qRT-PCR Analysis

The petals of different color rape are respectively added to 1 mL 1% HCl methanol solution to extract anthocyanin for 18 h and then centrifuged (14,000 r/min). After that, add 0.4 mL supernatant to 0.6 mL 1% HCl methanol solution. Then, measure the light absorption values at 530 nm and 657 nm wavelengths by spectrophotometer and calculate the anthocyanin content according to the formula below [57]. Three biological replicates are taken for each material, and the average value is calculated at last.
Qanthocyanins = (ODA530 − 0.25 × ODA657)/M
Note: Qanthocyanins is the anthocyanins content, ODA530 and ODA657 are absorbance values at 530 nm and 657 nm wavelengths, respectively, and M is the sample mass.
The petals of the same plants with anthocyanin content are taken, and the total RNA of the material is extracted using TaKaRa MiniBEST Plant RNA Extraction Kit, and cDNA is synthesized using PrimeScriptTM RT reagent Kit with gDNA Eraser (Perfect Real Time), both are manufactured by Takaeabio company. The qRT-PCR specific primers are designed by Primer Premier 5 (Table 3), with BnActin chosen as the internal genes; set up three biology repetitive and three technology, using 2−ΔΔCt methods to analyze gene expression [58].

Supplementary Materials

The following supporting information can be downloaded at https://www.mdpi.com/article/10.3390/plants12132583/s1, Table S1: Gene IDs of 0.s and BnDFRs.

Author Contributions

Conceptualization, X.Q., W.Z. and J.H.; methodology, X.Q., W.Z., J.H. and J.M.; software, X.Q., W.Z., J.H. and J.M.; validation, X.Q., W.Z., J.H. and J.M.; formal analysis, X.Q., M.S., Y.L., N.L. and T.C.; investigation, X.Q., W.Z., J.H., J.M., M.S., Y.L., N.L., T.C., M.W., L.W., X.H., Q.C., F.Z. and Z.Z.; resources, X.Q., W.Z. and J.H.; data curation, X.Q, W.Z., J.H., N.L., T.C., F.Z. and Z.Z.; writing—original draft preparation, X.Q., W.Z. and J.H.; writing—review and editing, X.Q., W.Z., J.H., J.M., M.S., F.Z. and Z.Z.; visualization, X.Q., W.Z., J.H., J.M., M.S., Y.L., N.L., T.C., M.W., L.W., X.H., Q.C., F.Z., Z.Y. and Z.Z.; supervision, X.Q., W.Z., J.H., J.M., M.S., Y.L., N.L., T.C., M.W., L.W., X.H., Q.C., F.Z., Z.Y. and Z.Z.; project administration, X.Q., W.Z., J.H., F.Z. and Z.Z.; funding acquisition, X.Q. and Z.Z. All authors have read and agreed to the published version of the manuscript.

Funding

This research was funded by National Agricultural Green Development Pilot Support System Construction project, grant number 21331004 and the Open Project of Key Laboratory of Crop Quality improvement of Anhui Province, grant number 2020ZW003.

Data Availability Statement

Not applicable.

Conflicts of Interest

The authors declare no conflict of interest.

References

  1. Lu, C.; Napier, J.A.; Clemente, T.E.; Cahoon, E.B. New frontiers in oilseed biotechnology: Meeting the global demand for vegetable oils for food, feed, biofuel, and industrial applications. Curr. Opin. Biotechnol. 2011, 22, 252–259. [Google Scholar] [CrossRef]
  2. Kimber, D.; Mcgregor, D.I. Brassica Oilseeds—Production and Utilization; CAB International: Wallington, UK, 1996; Volume 98, p. 321. [Google Scholar] [CrossRef]
  3. Zhu, Z.; Zhou, K.; Zheng, W.; Yu, Y.; Shen, W.; Chen, B.; Xie, G.; Cheng, J. Breeding, promotion and application of New landscape Rapeseed Varieties in International Cultural Tourism Demonstration Zone in southern Anhui. Anhui Agric. Sci. Bull. 2020, 26, 63–65. [Google Scholar]
  4. Zhu, Z.; Zhou, K.; Zheng, W.; Yu, Y.; Shen, W.; Chen, B.; Xie, G.; Cheng, J. Current situation of construction of creative Rapeseed Flower Sea in Southern Anhui International Cultural Tourism Demonstration Zone: Problems and suggestions. Anhui Agric. Sci. 2021, 49, 129–133,143. [Google Scholar]
  5. Liu, W.; Zhang, Z.; Li, Y.; Zhu, L.; Jiang, L. Efficient production of d-tagatose via DNA scaffold mediated oxidoreductases assembly in vivo from whey powder. Food Res. Int. 2023, 166, 112637. [Google Scholar] [CrossRef] [PubMed]
  6. Li, D.; Zaman, W.; Lu, J.; Niu, Q.; Zhang, X.; Ayaz, A.; Saqib, S.; Yang, B.; Zhang, J.; Zhao, H.; et al. Natural lupeol level variation among castor accessions and the upregulation of lupeol synthesis in response to light. Ind. Crops Prod. 2023, 192, 116090. [Google Scholar] [CrossRef]
  7. Zhao, D.; Tao, J. Recent advances on the development and regulation of flower color in ornamental plants. Front. Plant Sci. 2015, 6, 261. [Google Scholar] [CrossRef] [Green Version]
  8. Zhang, B.; Liu, C.; Wang, Y.; Yao, X.; Wang, F.; Wu, J.; King, G.J.; Liu, K. Disruption of a Carotenoid Cleavage Dioxygenase 4 gene converts flower colour from white to yellow in Brassica species. New Phytol. 2015, 206, 1513–1526. [Google Scholar] [CrossRef]
  9. Tanaka, Y.; Sasaki, N.; Ohmiya, A. Biosynthesis of plant pigments: Anthocyanins, betalains and carotenoids. Plant J. 2008, 54, 733–749. [Google Scholar] [CrossRef]
  10. Dharmawansa, K.V.S.; Hoskin, D.W.; Rupasinghe, H.P.V. Chemopreventive Effect of Dietary Anthocyanins against Gastrointestinal Cancers: A Review of Recent Advances and Perspectives. Int. J. Mol. Sci. 2020, 21, 6555. [Google Scholar] [CrossRef]
  11. Miyagawa, N.; Miyahara, T.; Okamoto, M.; Hirose, Y.; Sakaguchi, K.; Hatano, S.; Ozeki, Y. Dihydroflavonol 4-reductase activity is associated with the intensity of flower colors in delphinium. Plant Biotechnol. 2015, 32, 249–255. [Google Scholar] [CrossRef] [Green Version]
  12. Liu, X.; Gao, B.; Han, F.; Fang, Z.; Yang, L.; Zhuang, M.; Lv, H.; Liu, Y.; Li, Z.; Cai, C.; et al. Genetics and fine mapping of a purple leaf gene, BoPr, in ornamental kale (Brassica oleracea L. var. acephala). BMC Genom. 2017, 18, 1–9. [Google Scholar] [CrossRef] [Green Version]
  13. Cheng, H.; Li, L.; Cheng, S.; Cao, F.; Xu, F.; Yuan, H.; Wu, C. Molecular Cloning and Characterization of Three Genes Encoding Dihydroflavonol-4-Reductase from Ginkgo biloba in Anthocyanin Biosynthetic Pathway. PLoS ONE 2013, 8, e72017. [Google Scholar]
  14. Cheng, C.-Y.; Krishnakumar, V.; Chan, A.P.; Schobel, S.; Town, C.D. Araport11: A complete reannotation of the Arabidopsis thaliana reference genome. Plant J. 2016, 89, 789–804. [Google Scholar] [CrossRef] [PubMed] [Green Version]
  15. Devic, M.; Guilleminot, J.; Debeaujon, I.; Bechtold, N.; Bensaude, E.; Koornneef, M.; Pelletier, G.; Delseny, M. The BANYULS gene encodes a DFR-like protein and is a marker of early seed coat development. Plant J. 1999, 19, 387–398. [Google Scholar] [CrossRef]
  16. Saito, K.; Yonekura-Sakakibara, K.; Nakabayashi, R.; Higashi, Y.; Yamazaki, M.; Tohge, T.; Fernie, A.R. The flavonoid biosynthetic pathway in Arabidopsis: Structural and genetic diversity. Plant Physiol. Biochem. 2013, 72, 21–34. [Google Scholar] [CrossRef] [PubMed] [Green Version]
  17. Theologis, A.; Ecker, J.R.; Palm, C.J.; Federspiel, N.A.; Kaul, S.; White, O.; Alonso, J.M.; Altafi, H.; Araujo, R.; Bowman, C.L.; et al. Sequence and analysis of chromosome 1 of the plant Arabidopsis thaliana. Nature 2000, 408, 816–820. [Google Scholar] [CrossRef] [PubMed]
  18. Kawasaki, T.; Koita, H.; Nakatsubo, T.; Hasegawa, K.; Wakabayashi, K.; Takahashi, H.; Umemura, K.; Umezawa, T.; Shimamoto, K. Cinnamoyl-CoA reductase, a key enzyme in lignin biosynthesis, is an effector of small GTPase Rac in defense signaling in rice. Proc. Natl. Acad. Sci. USA 2006, 103, 230–235. [Google Scholar] [CrossRef]
  19. Tanaka, T.; Antonio, B.A.; Kikuchi, S.; Matsumoto, T.; Nagamura, Y.; Numa, H.; Sakai, H.; Wu, J.; Itoh, T.; Sasaki, T.; et al. The Rice Annotation Project Database (RAP-DB): 2008 update. Nucleic Acids Res. 2007, 36, D1028–D1033. [Google Scholar]
  20. O’Reilly, C.; Shepherd, N.S.; Pereira, A.; Schwarz-Sommer, Z.; Bertram, I.; Robertson, D.S.; Peterson, P.; Saedler, H. Molecular cloning of the a1 locus of Zea mays using the transposable elements En and Mu1. EMBO J. 1985, 4, 877–882. [Google Scholar] [CrossRef]
  21. Jeong, J.-C.; Jang, S.W.; Kim, T.H.; Kwon, C.H.; Kim, Y.K. Mulberry Fruit (Moris fructus) Extracts Induce Human Glioma Cell Death In Vitro Through ROS-Dependent Mitochondrial Pathway and Inhibits Glioma Tumor Growth In Vivo. Nutr. Cancer 2010, 62, 402–412. [Google Scholar] [CrossRef]
  22. Johnson, E.T.; Ryu, S.H.; Yi, H.; Shin, B.; Cheong, H.; Choi, G. Alteration of a single amino acid changes the substrate specificity of dihydroflavonol 4-reductase. Plant J. 2001, 25, 325–333. [Google Scholar] [CrossRef] [PubMed]
  23. Wang, J.; Wang, Y.; Wang, S.; Zhang, F.; Niu, Y.; Wang, D. Cloning and temporal-spatial expression analysis of dfr gene from Scutellaria baicalensis with different colors. Chin. J. Biotechnol. 2021, 37, 1312–1323. [Google Scholar]
  24. Kelley, L.A.; Mezulis, S.; Yates, C.M.; Wass, M.N.; Sternberg, M.J.E. The Phyre2 web portal for protein modeling, prediction and analysis. Nat. Protoc. 2015, 10, 845–858. [Google Scholar] [CrossRef] [Green Version]
  25. Geourjon, C.; Deléage, G. SOPMA: Significant improvements in protein secondary structure prediction by consensus prediction from multiple alignments. Comput. Appl. Biosci. CABIOS 1995, 11, 681–684. [Google Scholar] [CrossRef] [PubMed]
  26. Wang, H. Investigation on 2008’low temperature and freeze injure on winter rape along Yangtze River. Chin. J. Oil Crop Sci. 2008, 30, 122. [Google Scholar]
  27. Deng, R.; Zheng, W.; Hua, W.; Ren, R. Rape culture mining in the development of leisure agriculture in China. World Agric. 2016, 6, 64–69. [Google Scholar]
  28. Yin, N.; Wang, S.; Jia, L.; Zhu, M.; Yang, J.; Zhou, B.; Yin, J.; Lu, K.; Wang, R.; Li, J.; et al. Identification and characterization of major constituents in different-colored rapeseed petals by UPLC-HESI-MS/MS. J. Agric. Food Chem. 2019, 67, 11053–11065. [Google Scholar] [CrossRef]
  29. Tanaka, Y. Flower colour and cytochromes P450. Phytochem. Rev. 2006, 5, 283–291. [Google Scholar] [CrossRef]
  30. Yan, F.; Di, S.; Rojas Rodas, F.; Rodriguez Torrico, T.; Murai, Y.; Iwashina, T.; Anai, T.; Takahashi, R. Allelic variation of soybean flower color gene W4 encoding dihydroflavonol 4-reductase 2. BMC Plant Biol. 2014, 14, 58. [Google Scholar] [CrossRef] [Green Version]
  31. Zhao, D.; Tao, J.; Han, C.; Ge, J. Flower color diversity revealed by differential expression of flavonoid biosynthetic genes and flavonoid accumulation in herbaceous peony (Paeonia lactiflora Pall.). Mol. Biol. Rep. 2012, 39, 11263–11275. [Google Scholar] [CrossRef]
  32. Nakatsuka, A.; Izumi, Y.; Yamagishi, M. Spatial and temporal expression of chalcone synthase and dihydroflavonol 4-reductase genes in the Asiatic hybrid lily. Plant Sci. 2003, 165, 759–767. [Google Scholar] [CrossRef]
  33. Nakatsuka, T.; Nishihara, M.; Mishiba, K.-i.; Yamamura, S. Temporal expression of flavonoid biosynthesis-related genes regulates flower pigmentation in gentian plants. Plant Sci. 2005, 168, 1309–1318. [Google Scholar] [CrossRef]
  34. Parkin, I.A.P.; Gulden, S.; Sharpe, A.G.; Lukens, L.; Trick, M.; Osborn, T.C.; Lydiate, D.J. Segmental Structure of the Brassica napus Genome Based on Comparative Analysis With Arabidopsis thaliana. Genetics 2005, 171, 765–781. [Google Scholar] [CrossRef] [PubMed] [Green Version]
  35. Cominelli, E.; Gusmaroli, G.; Allegra, D.; Galbiati, M.; Wade, H.K.; Jenkins, G.I.; Tonelli, C. Expression analysis of anthocyanin regulatory genes in response to different light qualities in Arabidopsis thaliana. J. Plant Physiol. 2008, 165, 886–894. [Google Scholar] [CrossRef] [PubMed]
  36. Albert, N.W.; Lewis, D.H.; Zhang, H.; Irving, L.J.; Jameson, P.E.; Davies, K.M. Light-induced vegetative anthocyanin pigmentation in Petunia. J. Exp. Bot. 2009, 60, 2191–2202. [Google Scholar] [CrossRef] [Green Version]
  37. Quattrocchio, F.M.; Verweij, W.; Kroon, A.I.d.; Spelt, C.E.; Mol, J.N.; Koes, R. PH4 of Petunia Is an R2R3 MYB Protein That Activates Vacuolar Acidification through Interactions with Basic-Helix-Loop-Helix Transcription Factors of the Anthocyanin Pathway. Plant Cell Online 2006, 18, 1274–1291. [Google Scholar] [CrossRef] [Green Version]
  38. Shao, W.L.; Li, Y.L.; Gao, S.; Li, J.M.; Liang, Z.S. Effects of light intensity on the fruit coloration and anthocyanian biosynthesis in Fragaria × ananassa Duch. Bull. Bot. Res. 2018, 38, 661–668. [Google Scholar]
  39. Huang, K.L.; Miyajima, I.; Okubo, H. Effects of temperature and shade treatment on flower colors and characteristics in newly established reddish-purple tuberose (Polianthes). J. Fac. Agric. Kyushu Univ. 2000, 45, 57–63. [Google Scholar] [CrossRef]
  40. Xie, D.; Sharma, S.; Wright, E.C.; Wang, Z.; Dixon, R.A. Metabolic engineering of proanthocyanidins through co-expression of anthocyanidin reductase and the PAP1 MYB transcription factor. Plant J. 2006, 45, 895–907. [Google Scholar] [CrossRef] [Green Version]
  41. Ramsay, N.A.; Glover, B.J. MYB-bHLH-WD40 protein complex and the evolution of cellular diversity. Trends Plant Sci. 2005, 10, 63–70. [Google Scholar] [CrossRef]
  42. Chanoca, A.; Kovinich, N.; Burkel, B.M.; Stecha, S.; Bohorquez-Restrepo, A.; Ueda, T.; Eliceiri, K.W.; Grotewold, E.; Otegui, M.S. Anthocyanin Vacuolar Inclusions Form by a Microautophagy Mechanism. Plant Cell 2015, 27, 2545–2559. [Google Scholar] [CrossRef] [Green Version]
  43. Holton, T.A.; Cornish, E.C. Genetics and Biochemistry of Anthocyanin Biosynthesis. Plant Cell 1995, 7, 1071–1083. [Google Scholar] [CrossRef] [PubMed]
  44. Mol, J.N.; Grotewold, E.; Koes, R. How genes paint flowers and seeds. Trends Plant Sci. 1998, 3, 212–217. [Google Scholar] [CrossRef]
  45. Yoshida, K.; Iwasaka, R.; Shimada, N.; Ayabe, S.-i.; Aoki, T.; Sakuta, M. Transcriptional control of the dihydroflavonol 4-reductase multigene family in Lotus japonicus. J. Plant Res. 2010, 123, 801–805. [Google Scholar] [CrossRef]
  46. Dogan, T. UniProt: A worldwide hub of protein knowledge. Nucleic Acids Res. 2018, 47, D506–D515. [Google Scholar]
  47. Garg, V.K.; Avashthi, H.; Tiwari, A.; Jain, P.A.; Ramkete, P.W.; Kayastha, A.M.; Singh, V.K. MFPPI–Multi FASTA ProtParam Interface. Bioinformation 2016, 12, 74–77. [Google Scholar] [CrossRef] [PubMed]
  48. Horton, P.; Park, K.-J.; Obayashi, T.; Fujita, N.; Harada, H.; Adams-Collier, C.J.; Nakai, K. WoLF PSORT: Protein localization predictor. Nucleic Acids Res. 2007, 35, W585–W587. [Google Scholar] [CrossRef] [Green Version]
  49. Ye, Z.; Yuan, Z.; Xu, H.; Pan, L.; Chen, J.; Gatera, A.; Uzair, M.; Xu, D. Genome-Wide Identification and Expression Analysis of Kinesin Family in Barley (Hordeum vulgare). Genes 2022, 13, 2376. [Google Scholar] [CrossRef] [PubMed]
  50. Chen, C.; Chen, H.; Zhang, Y.; Thomas, H.R.; Frank, M.H.; He, Y.; Xia, R. TBtools-an integrative toolkit developed for interactive analyses of big biological data. Mol. Plant 2020, 13, 1194–1202. [Google Scholar] [CrossRef]
  51. Bailey, T.L.; Johnson, J.; Grant, C.E.; Noble, W.S. The MEME Suite. Nucleic Acids Res. 2015, 43, W39–W49. [Google Scholar] [CrossRef] [Green Version]
  52. Yang, M.; Derbyshire, M.K.; Yamashita, R.A.; Marchler-Bauer, A. NCBI’s Conserved Domain Database and Tools for Protein Domain Analysis. Curr. Protoc. Bioinform. 2019, 69, e90. [Google Scholar] [CrossRef] [PubMed] [Green Version]
  53. Ayaz, A.; Saqib, S.; Huang, H.-j.; Zaman, W.; Lü, S.; Zhao, H. Genome-wide comparative analysis of long-chain acyl-CoA synthetases (LACSs) gene family: A focus on identification, evolution and expression profiling related to lipid synthesis. Plant Physiol. Biochem. 2021, 161, 1–11. [Google Scholar] [CrossRef]
  54. Lescot, M.; Déhais, P.; Thijs, G.; Marchal, K.; Moreau, Y.; Peer, Y.V.d.; Rouzé, P.; Rombauts, S. PlantCARE, a database of plant cis-acting regulatory elements and a portal to tools for in silico analysis of promoter sequences. Nucleic Acids Res. 2002, 30, 325–327. [Google Scholar] [CrossRef] [PubMed]
  55. Letunić, I.; Bork, P. Interactive tree of life (iTOL) v3: An online tool for the display and annotation of phylogenetic and other trees. Nucleic Acids Res. 2016, 44, W242–W245. [Google Scholar] [CrossRef] [PubMed]
  56. Chao, H.; Li, T.; Luo, C.; Huang, H.; Ruan, Y.; Li, X.; Niu, Y.; Fan, Y.; Sun, W.; Zhang, K.; et al. BrassicaEDB: A Gene Expression Database for Brassica Crops. Int. J. Mol. Sci. 2020, 21, 5831. [Google Scholar] [CrossRef]
  57. Mehrtens, F.; Kranz, H.D.; Bednarek, P.; Weisshaar, B. The Arabidopsis Transcription Factor MYB12 Is a Flavonol-Specific Regulator of Phenylpropanoid Biosynthesis1. Plant Physiol. 2005, 138, 1083–1096. [Google Scholar] [CrossRef] [Green Version]
  58. Livak, K.J.; Schmittgen, T.D. Analysis of relative gene expression data using real-time quantitative PCR and the 2(-Delta Delta C(T)) Method. Methods 2001, 25, 402–408. [Google Scholar] [CrossRef]
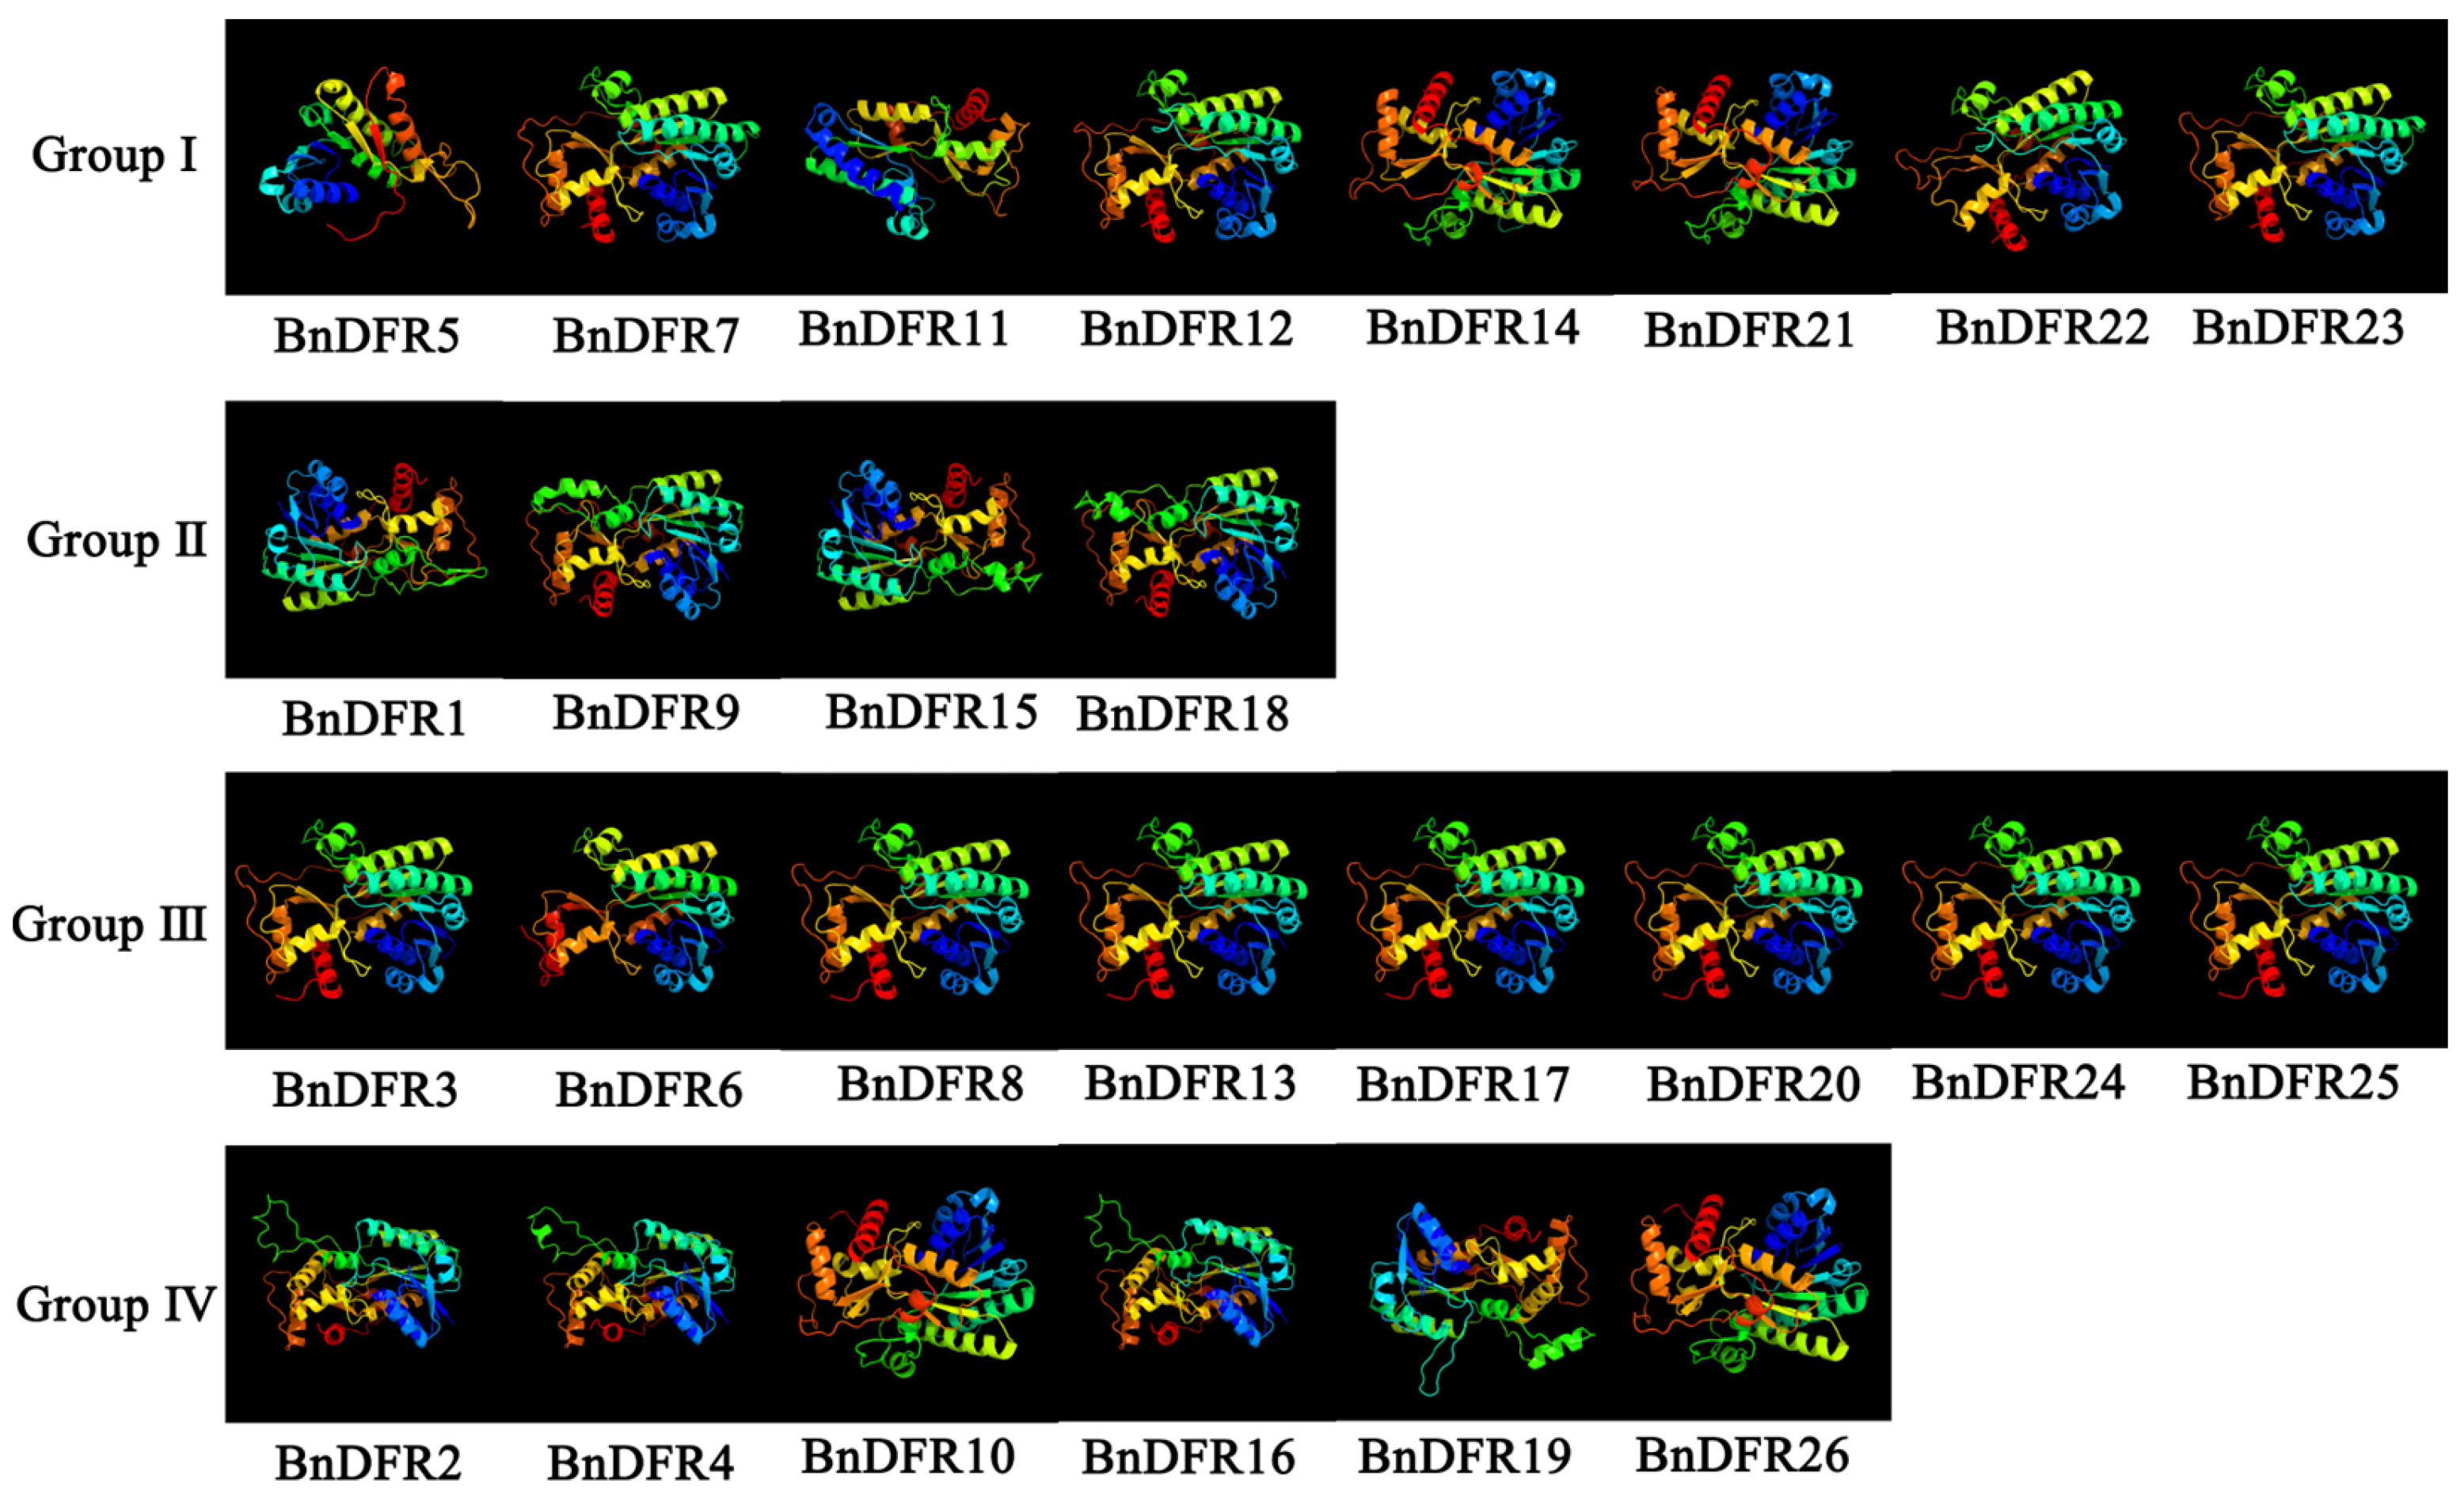
Figure 1. Three-dimensional structures of the BnDFR proteins.
Plants 12 02583 g001
Figure 2. DFR genes distribution on B. napus chromosomes.
Plants 12 02583 g002
Figure 3. Collinearity analysis: intraspecies collinearity analysis (A) and interspecies collinearity analysis (B). Note: The gray background line represents the collinear block in the whole genome, and the highlighted line represents the collinear relationship. In subfigure B, the top 1-5 is the chromosome name of A. thaliana, the bottom A01-Unn_r is the chromosome name of B. napus, and the small chromosome fragment on the right of each chromosome is its corresponding random.
Plants 12 02583 g003
Figure 4. Phylogenetic tree, motif, domain, and gene structures of DFR gene family.
Plants 12 02583 g004
Figure 5. Highly conserved motif patterns of DFR gene family.
Plants 12 02583 g005
Figure 6. Phylogenetic tree and specific expression of DFR gene family.
Plants 12 02583 g006
Figure 7. Cis-acting element structures in promoter regions of DFR family members.
Plants 12 02583 g007
Figure 8. Anthocyanin content (A) and qRT-PCR analysis (B) of some BnDFR genes in B. napus. (A) shows different color rape and its anthocyanin content, (B) shows the gene expression levels of some BnDFRs and normalize it with a row scale.
Plants 12 02583 g008
Table 1. Physicochemical property and subcellular localization of DFR proteins.
GeneLen (aa)MW (kD)pIIIGRSL
AtDFR134437.496.1332.17−0.26Cytoplasm
AtDFR234037.915.8926.2−0.176Nucleus
AtDFR332135.676.0239.55−0.159Nucleus
AtDFR433236.626.425.89−0.166Cytoplasm
AtDFR532636.465.8838.22−0.122Chloroplast
AtDFR638242.775.4336.85−0.225Chloroplast
BnDFR131935.745.9536.76−0.093Chloroplast
BnDFR233837.75.0737.27−0.203Cytoplasm
BnDFR333136.516.7130.04−0.193Cytoplasm
BnDFR434538.265.9634.92−0.171Nucleus
BnDFR522325.088.7641.34−0.526Mitochondrion
BnDFR627630.045.3528.51−0.048Cytoplasm
BnDFR732135.686.5236.34−0.168Nucleus
BnDFR833236.496.1930.6−0.195Cytoplasm
BnDFR931735.546.2735.05−0.14Chloroplast
BnDFR1038542.895.5437.87−0.255Chloroplast
BnDFR1123526.618.7938.4−0.206Nucleus
BnDFR1232135.825.537.27−0.172Chloroplast
BnDFR1334337.515.5333.85−0.271Cytoplasm
BnDFR1432135.736.5237.77−0.162Nucleus
BnDFR1531935.625.9636.23−0.127Chloroplast
BnDFR1633837.684.9337.03−0.164Cytoplasm
BnDFR1733136.426.6632.36−0.182Cytoplasm
BnDFR1831735.465.5543.06−0.138Chloroplast
BnDFR1934237.875.834.06−0.156Nucleus
BnDFR2034337.565.7934.7−0.29Cytoplasm
BnDFR2132135.855.536.64−0.171Chloroplast
BnDFR2230534.15.4734.04−0.125Cytoplasm
BnDFR2332135.796.5237.84−0.219Nucleus
BnDFR2433236.576.2631.35−0.202Cytoplasm
BnDFR2534037.225.5332.91−0.254Cytoplasm
BnDFR2638542.935.6437.07−0.256Chloroplast
Note: Len—protein sequence length; MW—molecular weight; pI—theoretical isoelectric point; II—instability index, unstable proteins are marked in red; GR—grand average of hydrophobicity; SL—subcellular localization.
Table 2. Results and validity of secondary structures and 3D structures of BnDFR proteins.
Secondary Structures3D Structures
Geneα-HelixExtended Strandβ-TurnRandom CoilConfidenceCoverage
BnDFR140.4415.327.5236.68100.0%95.0%
BnDFR242.914.797.434.91100.0%92.0%
BnDFR344.1115.416.6533.84100.0%96.0%
BnDFR439.7115.947.2537.1100.0%90.0%
BnDFR546.1912.114.9336.7799.8%81.0%
BnDFR648.1917.035.4329.35100.0%97.0%
BnDFR742.0613.085.9238.94100.0%97.0%
BnDFR845.7815.365.7233.13100.0%96.0%
BnDFR943.2215.777.8933.12100.0%96.0%
BnDFR1040.5211.957.5340100.0%83.0%
BnDFR1140.8512.775.1141.2899.9%97.0%
BnDFR1241.7414.957.1736.14100.0%97.0%
BnDFR1342.2714.295.2538.19100.0%92.0%
BnDFR1439.8814.646.5438.94100.0%95.0%
BnDFR1542.6314.737.8434.8100.0%95.0%
BnDFR1642.614.27.136.09100.0%92.0%
BnDFR1745.9215.715.4432.93100.0%96.0%
BnDFR1841.0116.727.8934.38100.0%96.0%
BnDFR1941.5214.337.3136.84100.0%91.0%
BnDFR2043.7313.125.2537.9100.0%92.0%
BnDFR2141.7415.265.9239.07100.0%97.0%
BnDFR2241.3116.077.2135.41100.0%97.0%
BnDFR2343.314.956.8534.89100.0%97.0%
BnDFR2445.7815.966.0232.23100.0%95.0%
BnDFR254512.94537.06100.0%94.0%
BnDFR2642.613.256.2337.92100.0%83.0%
Table 3. Primer sequence.
Gene NameForward Primer SequenceReverse Primer Sequence
BnActin7AACCTTCTCTCAAGTCTCTGTGCCAGAATCATCACAAAGCATCC
BnDFR3GTGCTGATCTTCTCGACTATGATCACGGTTAGGGTTCATGTAAA
BnDFR6ATATACTTTCGACCGCTGGAAATCCAAGAAGCTATGTATCCACC
BnDFR8CGATAAGAATCCAAGGGCAAAGTGATGGTCGTATCGTGTTCTAG
BnDFR12CATTTGAGACCAAGTGCAGTAGGCCAAGTTCACGTATCTTTGTT
BnDFR13AATTGGTGCAGTTTACATGGACGGTGTTTTTGCAGAACTCAAGA
BnDFR17AGTATCCGCTTCCTATCAAGTGGCTCTTGACAGATTCGTAGAGA
BnDFR20GTTAAGAGCTTGCAAGAGAAGGATCGCTGAGGATGATACTTCAG
BnDFR21GCTAAAGATTTTCGAAGCCGATTTCTCCAGATCATTGTTGTCCA
BnDFR24TTTACATGAACCCTAACCGTCATAAGGTTAGCATAGGTCTTGGC
BnDFR25CAGGACTACGATGCTCTTAAGTAATTACAAACTTGGCTCCGTTC
BnDFR26CTGCCAAGGGACGTTATATTTGCAAACGTTGAAGGCACGTTATA
Disclaimer/Publisher’s Note: The statements, opinions and data contained in all publications are solely those of the individual author(s) and contributor(s) and not of MDPI and/or the editor(s). MDPI and/or the editor(s) disclaim responsibility for any injury to people or property resulting from any ideas, methods, instructions or products referred to in the content.