Article

Variation in Vegetation Phenology and Its Response to Climate Change in Marshes of Inner Mongolian

1
Northeast Institute of Geography and Agroecology, Chinese Academy of Sciences, Changchun 130102, China
2
University of Chinese Academy of Sciences, Beijing 100049, China
*
Author to whom correspondence should be addressed.
Plants 2023, 12(11), 2072; https://doi.org/10.3390/plants12112072
Submission received: 4 May 2023 / Revised: 17 May 2023 / Accepted: 18 May 2023 / Published: 23 May 2023
(This article belongs to the Section Plant Ecology)

Abstract

:
Inner Mongolia has a large area of marsh wetland in China, and the marsh in this region is important for maintaining ecological balance. Understanding variations in vegetation phenology of marsh ecosystems and their responses to climatic change is crucial for vegetation conservation of marsh wetlands in Inner Mongolia. Using the climate and NDVI data during 2001–2020, we explored the spatiotemporal changes in the start (SOS), end (EOS), and length (LOS) of vegetation growing season and analyzed the effects of climate change on vegetation phenology in the Inner Mongolia marshes. Results showed that SOS significantly (p < 0.05) advanced by 0.50 days/year, EOS significantly delayed by 0.38 days/year, and thus LOS considerably increased by 0.88 days/year during 2001–2020 in marshes of Inner Mongolia. Warming temperatures in winter and spring could significantly (p < 0.05) advance the SOS, and increased summer and autumn temperatures could delay EOS in Inner Mongolia marshes. We found for the first time that daytime maximum temperature (Tmax) and night minimum temperature (Tmin) had asymmetric effects on marsh vegetation phenology. Increasing Tmax had a stronger advancing effect on SOS than increasing Tmin from December to April. The increase of Tmin in August could obviously delayed EOS, while increasing Tmax in August had no significant effect on EOS. This study highlights that the asymmetric influences of nighttime and daytime temperatures should be taken into account in simulating marsh vegetation phenology in temperate arid and semi-arid regions worldwide, particularly in the context of global asymmetric diurnal warming.

1. Introduction

As an important type of wetland ecosystem, marsh can significantly affect the global ecological environment and carbon cycle [1,2,3,4,5,6,7,8,9]. Vegetation is a crucial component of marshes and has a significant impact on ecosystem functions [10,11,12,13,14,15,16]. The vegetation phenology of marshes is sensitive to climate change [17,18,19]. In the context of climate change, the phenology of marsh vegetation has significantly changed [19,20,21,22]. Understanding the variations in vegetation phenology of marshes and their responses to climate change is vital for predicting regional ecosystem carbon exchange [18,23,24].
Inner Mongolia has a large area of marshes in China, and the marshes in this region significantly affect the biogeochemical cycle and biodiversity [25]. Previous researchers have studied the changes in vegetation phenology and their responses to climate variations in Inner Mongolia [26,27,28,29]. For example, Qiao and Wang [30] investigated the influence of climate change on the phenology of Inner Mongolia’s grasslands and discovered that increasing temperature and precipitation advanced the start date (SOS) of the vegetation growing season from 1982 to 2015. Sha et al. [31] studied the spatiotemporal variations in phenology and found that the increase of precipitation in the preseason remarkably advanced the SOS of grassland in Inner Mongolia during 1998–2012. Ren et al. [32] investigated the effects of climate change on grassland vegetation phenology. They found that the end date (EOS) of vegetation growing season for desert steppe was affected by preseason precipitation, while the EOS of meadows and temperate steppes was affected by the preseason air temperature in Inner Mongolia from 2000 to 2016 [32]. Wang et al. [28] analyzed the climatic influence on grassland phenology and suggested that increasing annual precipitation lengthened the length (LOS) of vegetation growing season for grassland in Inner Mongolia from 1982–2012. However, previous research mostly focused on grasslands, and studies on the vegetation phenology of marshes in Inner Mongolia are less. Compared with grassland ecosystems, marsh wetland ecosystems have distinctive environmental conditions, and the phenology of vegetation in marsh wetland ecosystems may respond differently to climate change [19,24,33]. To reveal the climate impact on marsh vegetation, analyzing the variations of vegetation phenology and their correlations with climate change in the marshes of Inner Mongolia is necessary. In addition, Shen et al. [34] suggested that nighttime and daytime warming had asymmetric influences on the SOS of temperate grasslands. The increase in daytime maximum temperature (Tmax) had a stronger advancing effect on SOS than increasing nighttime minimum temperature (Tmin) [34]. This may be because that Tmin is more likely to be below the threshold temperature than Tmax before the green-up of vegetation, so it contributes less to achieving the thermal requirement for green-up [34]. Marshes are wetter than grasslands [35]. Whether the impacts of diurnal temperatures on marsh vegetation phenology in Inner Mongolia are asymmetric is unclear. Given the background of asymmetric warming during the nighttime and daytime, it is necessary to explore the separate influence of Tmin and Tmax on vegetation phenology in the marshes of Inner Mongolia.
Using the climate and NDVI data during 2001–2020, we studied the spatiotemporal changes of SOS, EOS, and LOS in the marshes of Inner Mongolia. This study proposed two hypotheses: (1) Temperature may be the main factor affecting vegetation phenology in marsh wetlands of Inner Mongolia; (2) Daytime and nighttime temperatures may have different impacts on vegetation phenology in marsh wetlands of this region. Our aims were to explore the spatio-temporal variations of vegetation phenology and investigate the effects of climatic change, especially diurnal warming, on the vegetation phenology of marshes in Inner Mongolia. The results may provide important scientific references for predicting vegetation dynamics and carrying out adaptive management of marsh vegetation in this region.

2. Results

2.1. Changes in the Phenology of Marshes in Inner Mongolia from 2001 to 2020

From 2001 to 2020, the average vegetation SOS in the marsh of Inner Mongolia was approximately 122 days per year (DOY; May 2 or 3 for leap or non-leap years). The average EOS was approximately 280 DOY (October 7 or 8), and the average LOS was approximately 157 days. Spatially, the SOS was earlier in northeastern and later in southeastern and middle of Inner Mongolia (Figure 1a). The EOS in northeastern Inner Mongolia was later, while the earlier EOS was situated in southeastern Inner Mongolia (Figure 1c). The LOS was longer and shorter in the northeastern and southeastern regions, respectively (Figure 1e).
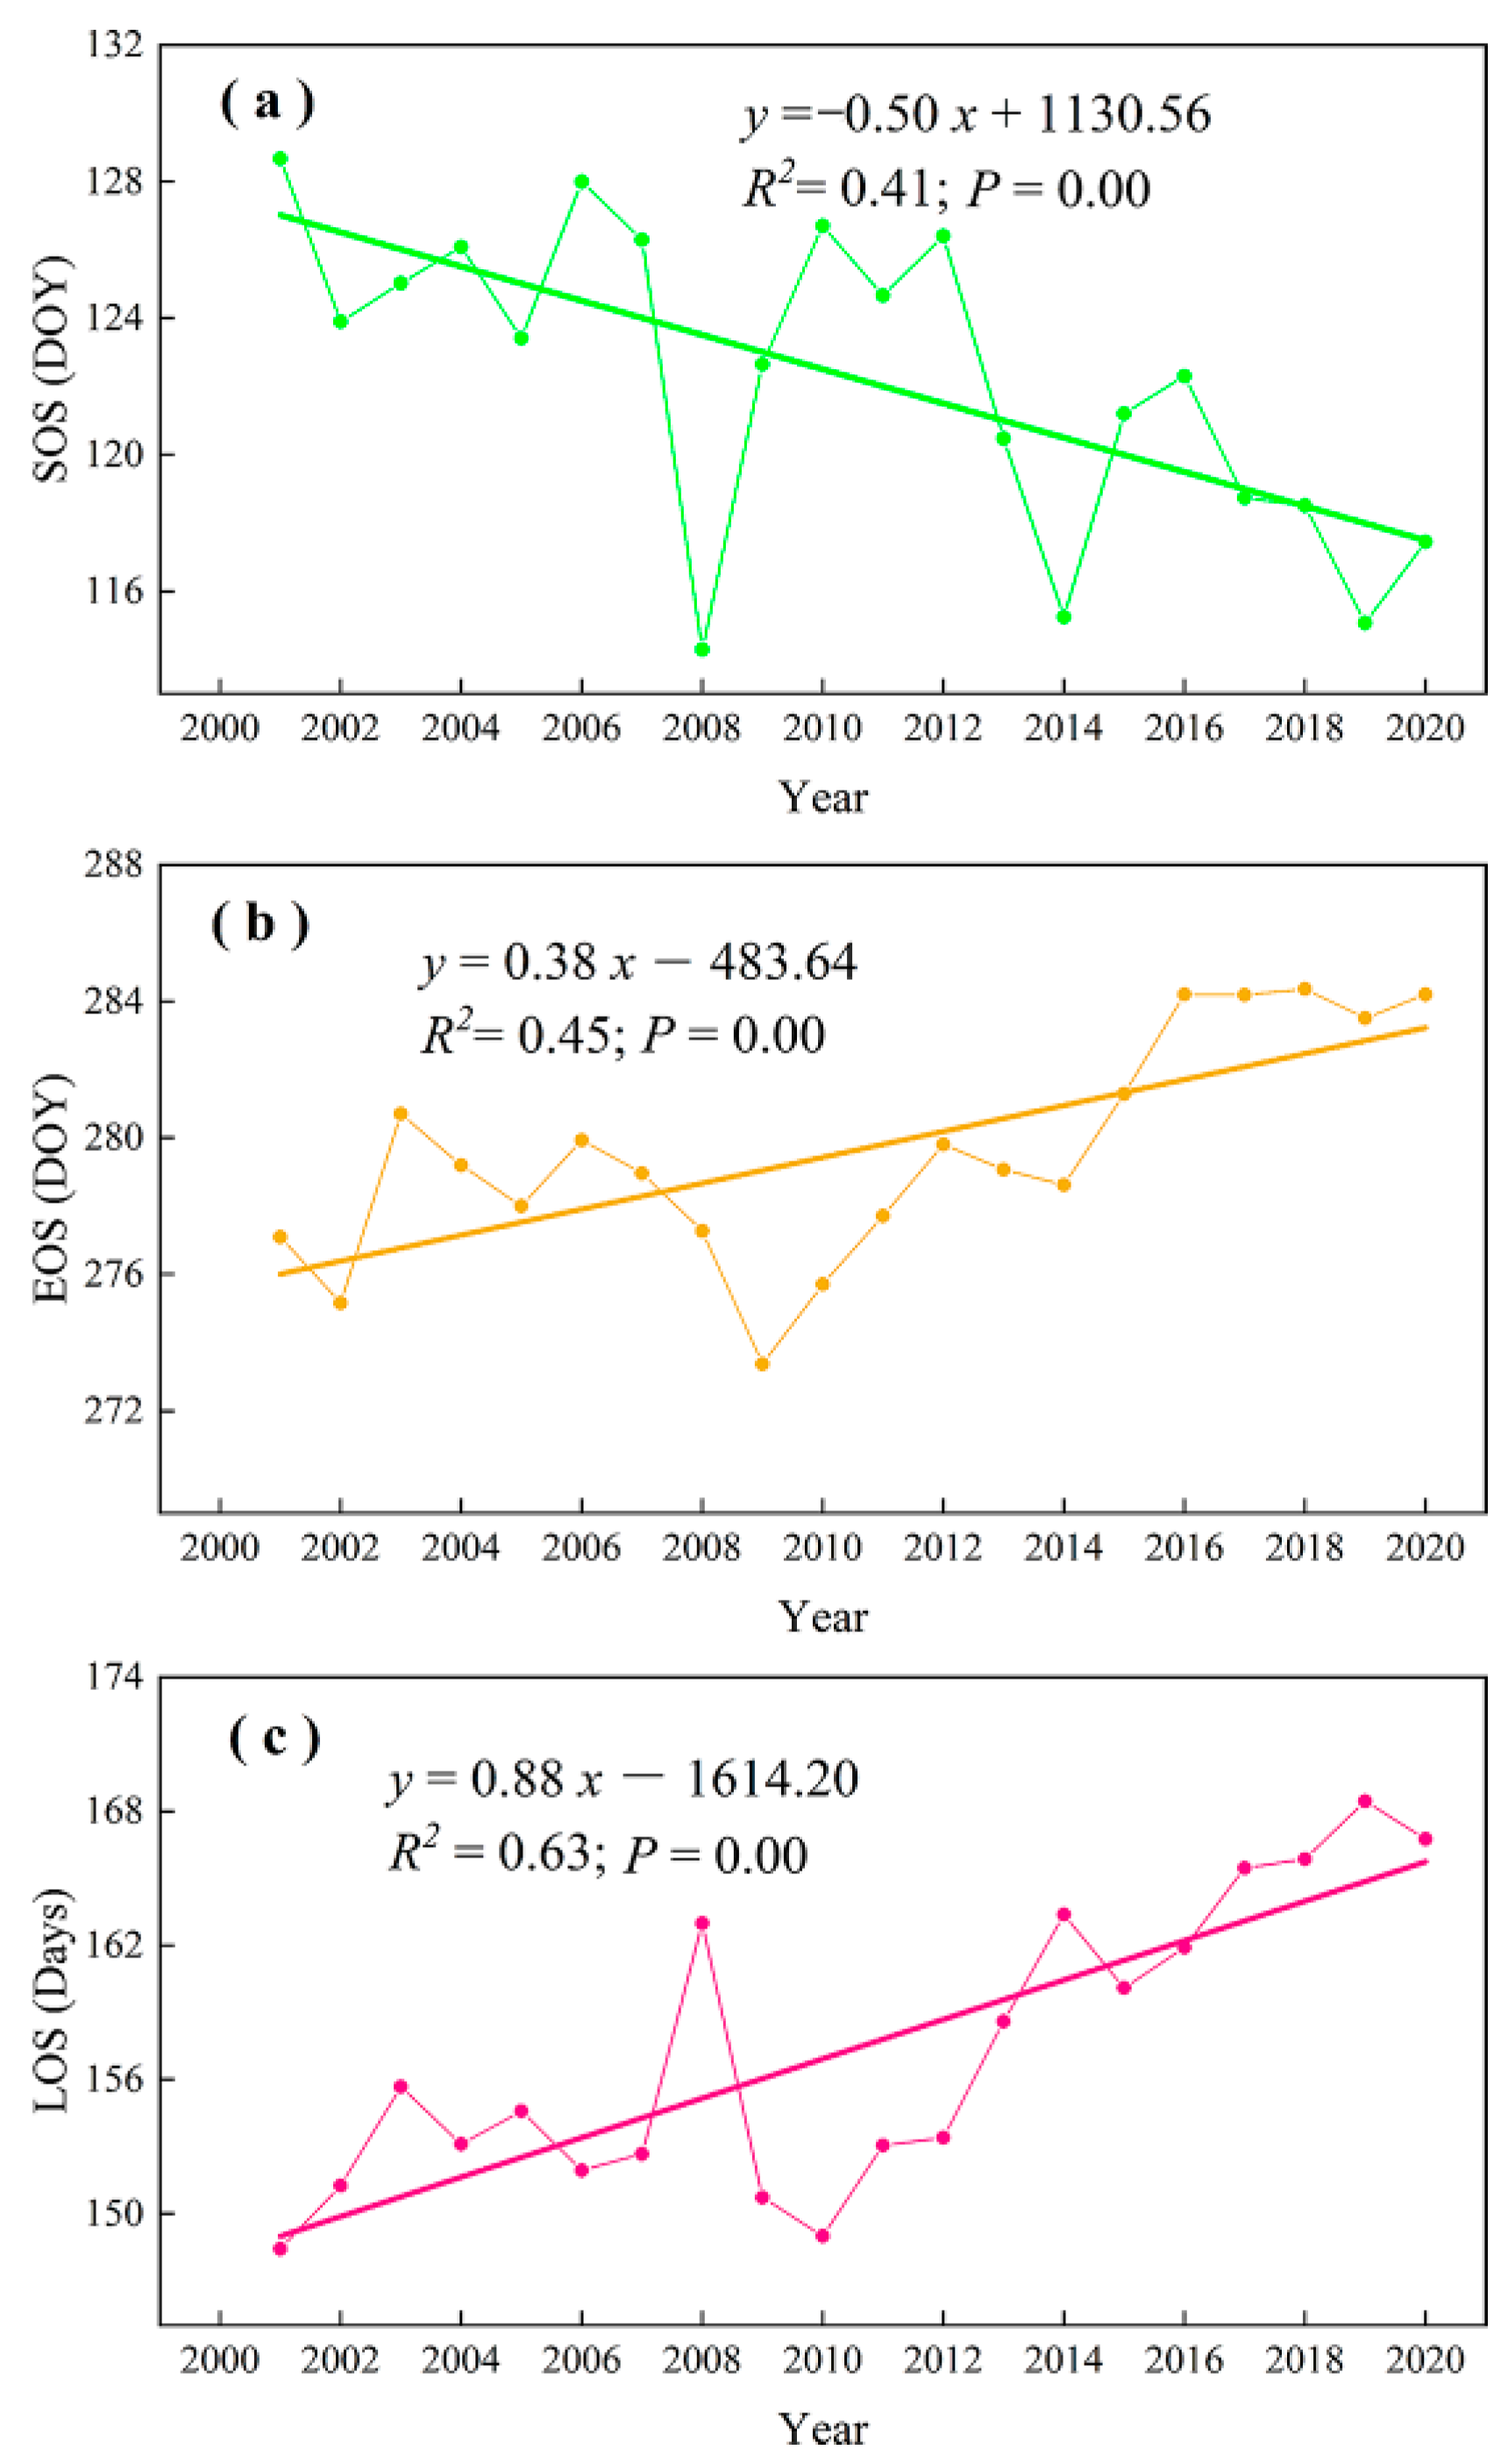
For the variations of vegetation phenology, SOS advanced significantly (p < 0.05) by 0.50 days/year, EOS delayed significantly by 0.38 days/year, and LOS increased remarkably by 0.88 days/year (Figure 2) in marshes of Inner Mongolia during 2001–2020. The larger advancing SOS trends mainly occurred in the east of the study region and the largest delaying trends were mainly situated in the middle regions (Figure 1b). The largest delaying and advancing trends of EOS were mainly distributed in the east and northeast regions, respectively (Figure 1d). In addition, the largest increasing and decreasing trends of LOS mainly occurred in the eastern and central regions, respectively (Figure 1f).

2.2. Correlations between Climatic Factors and Phenology in Marshes of Inner Mongolia from 2001 to 2020

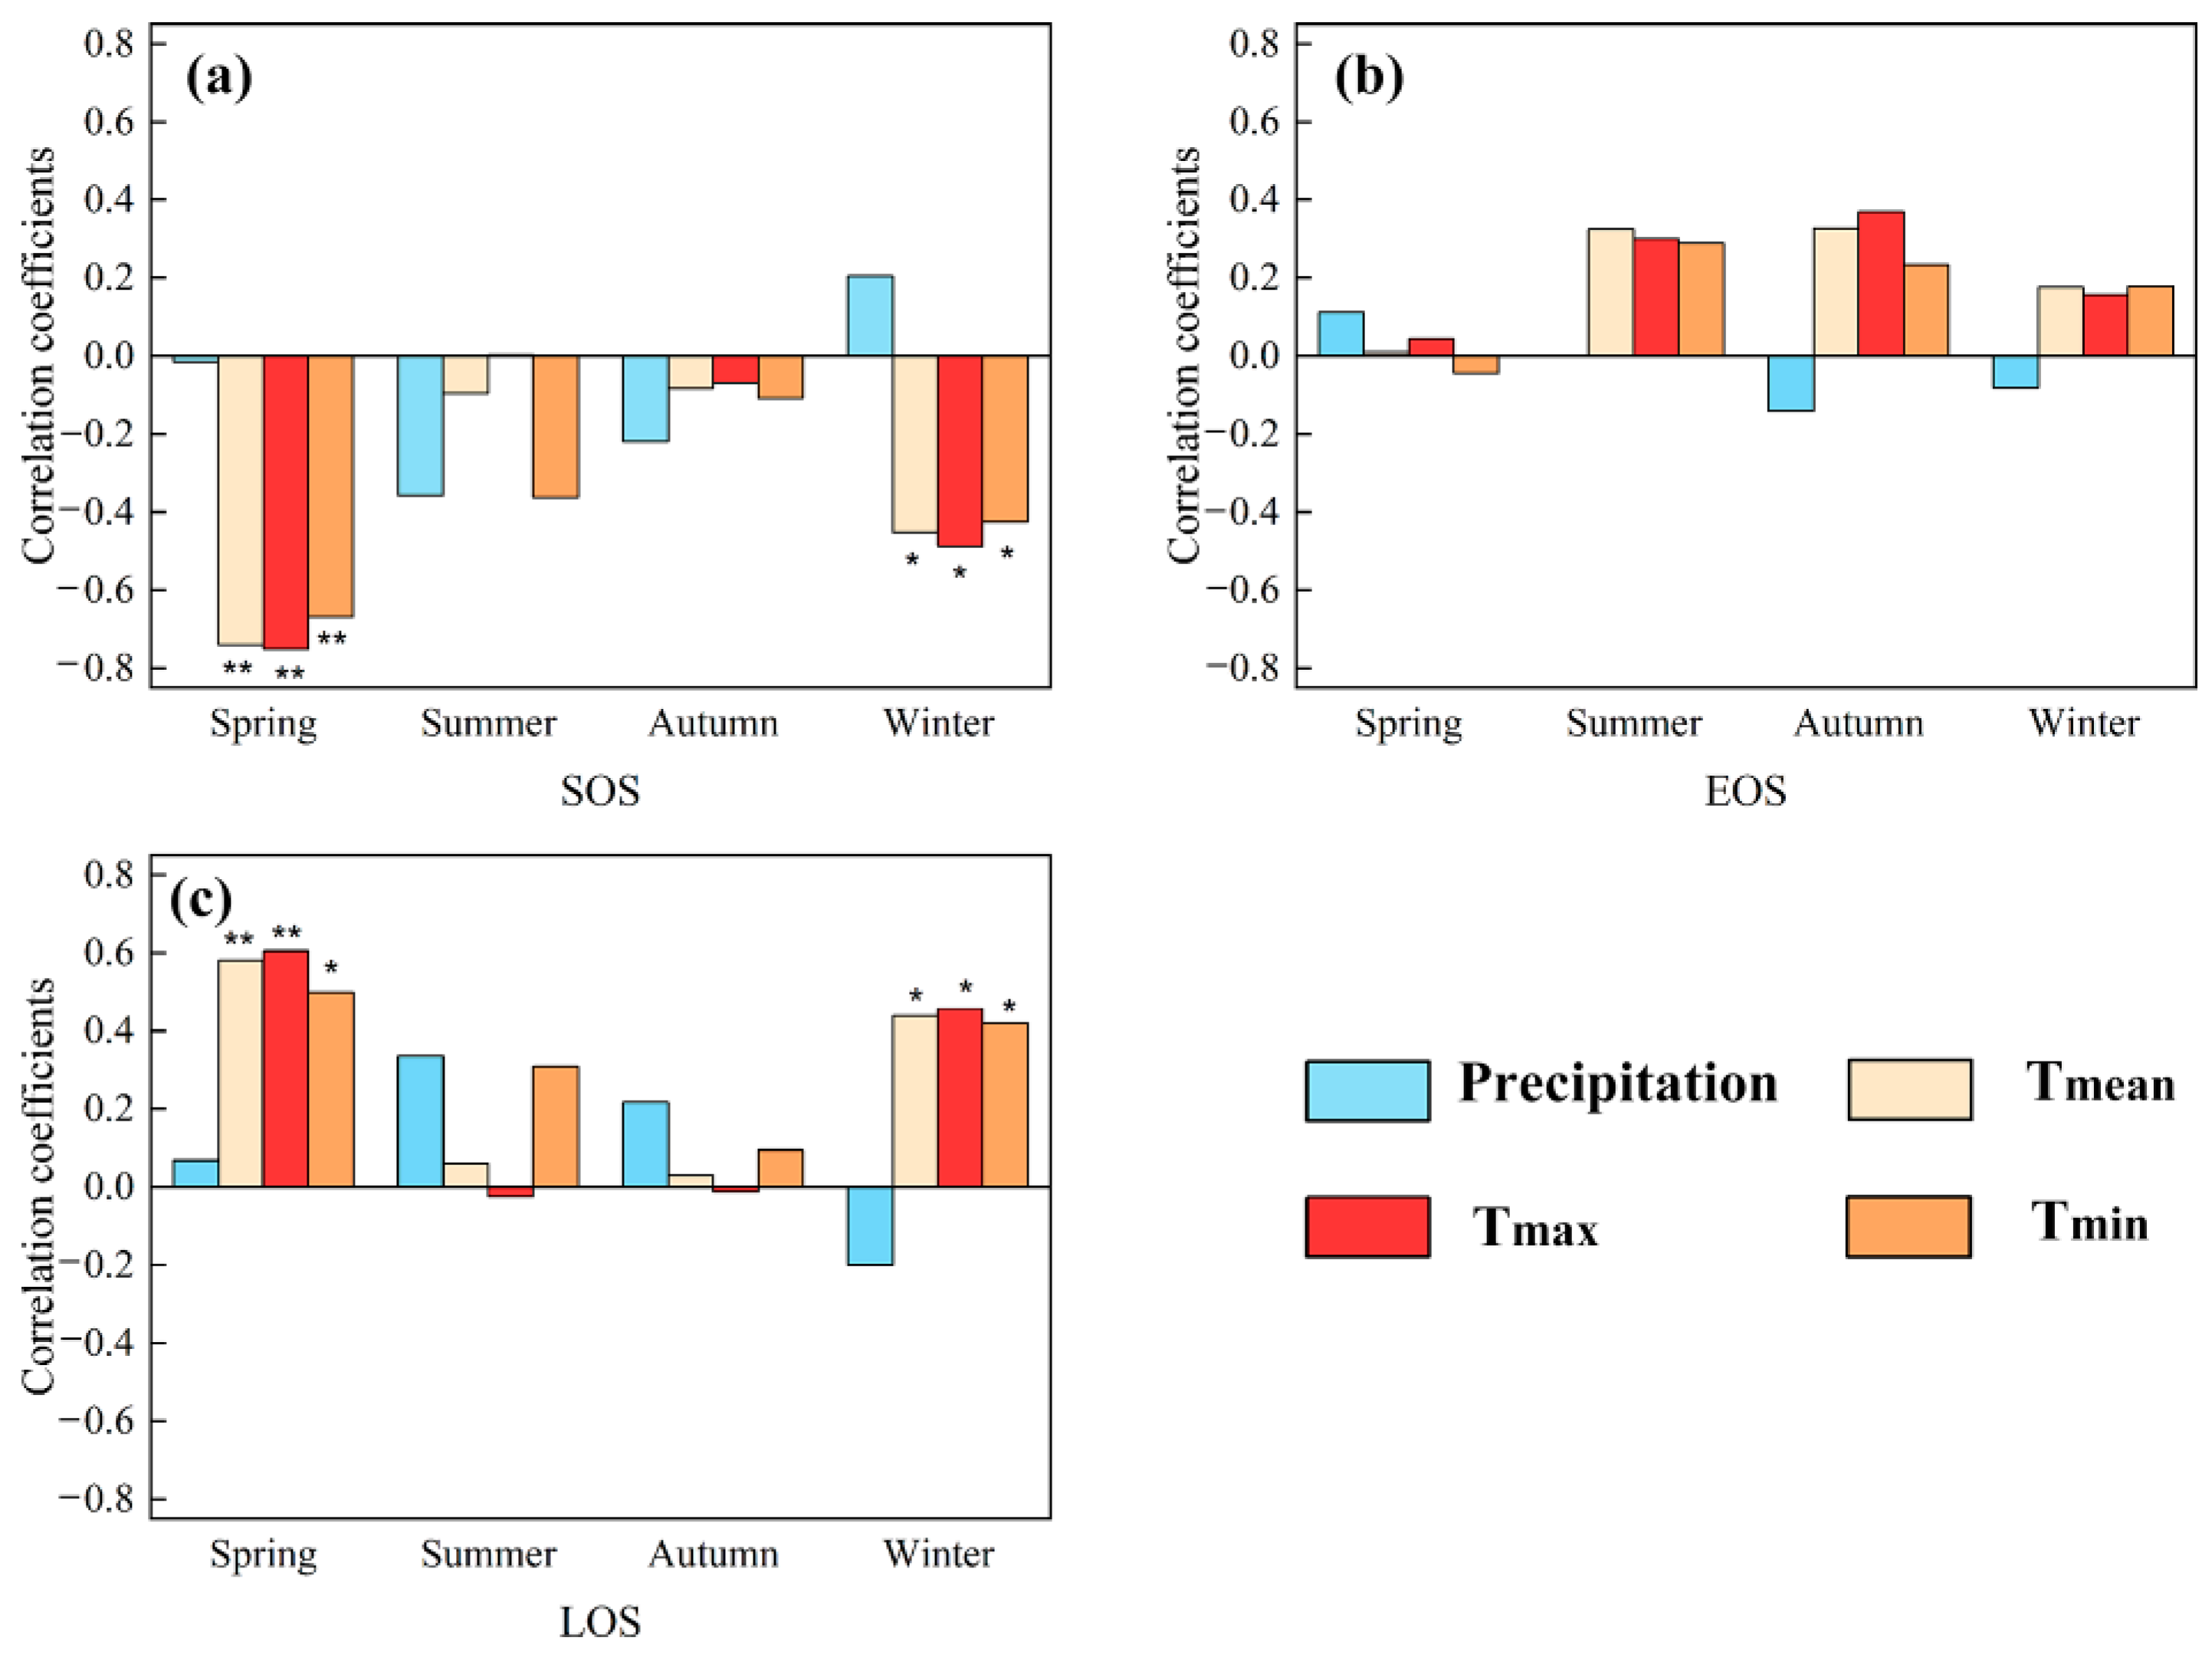
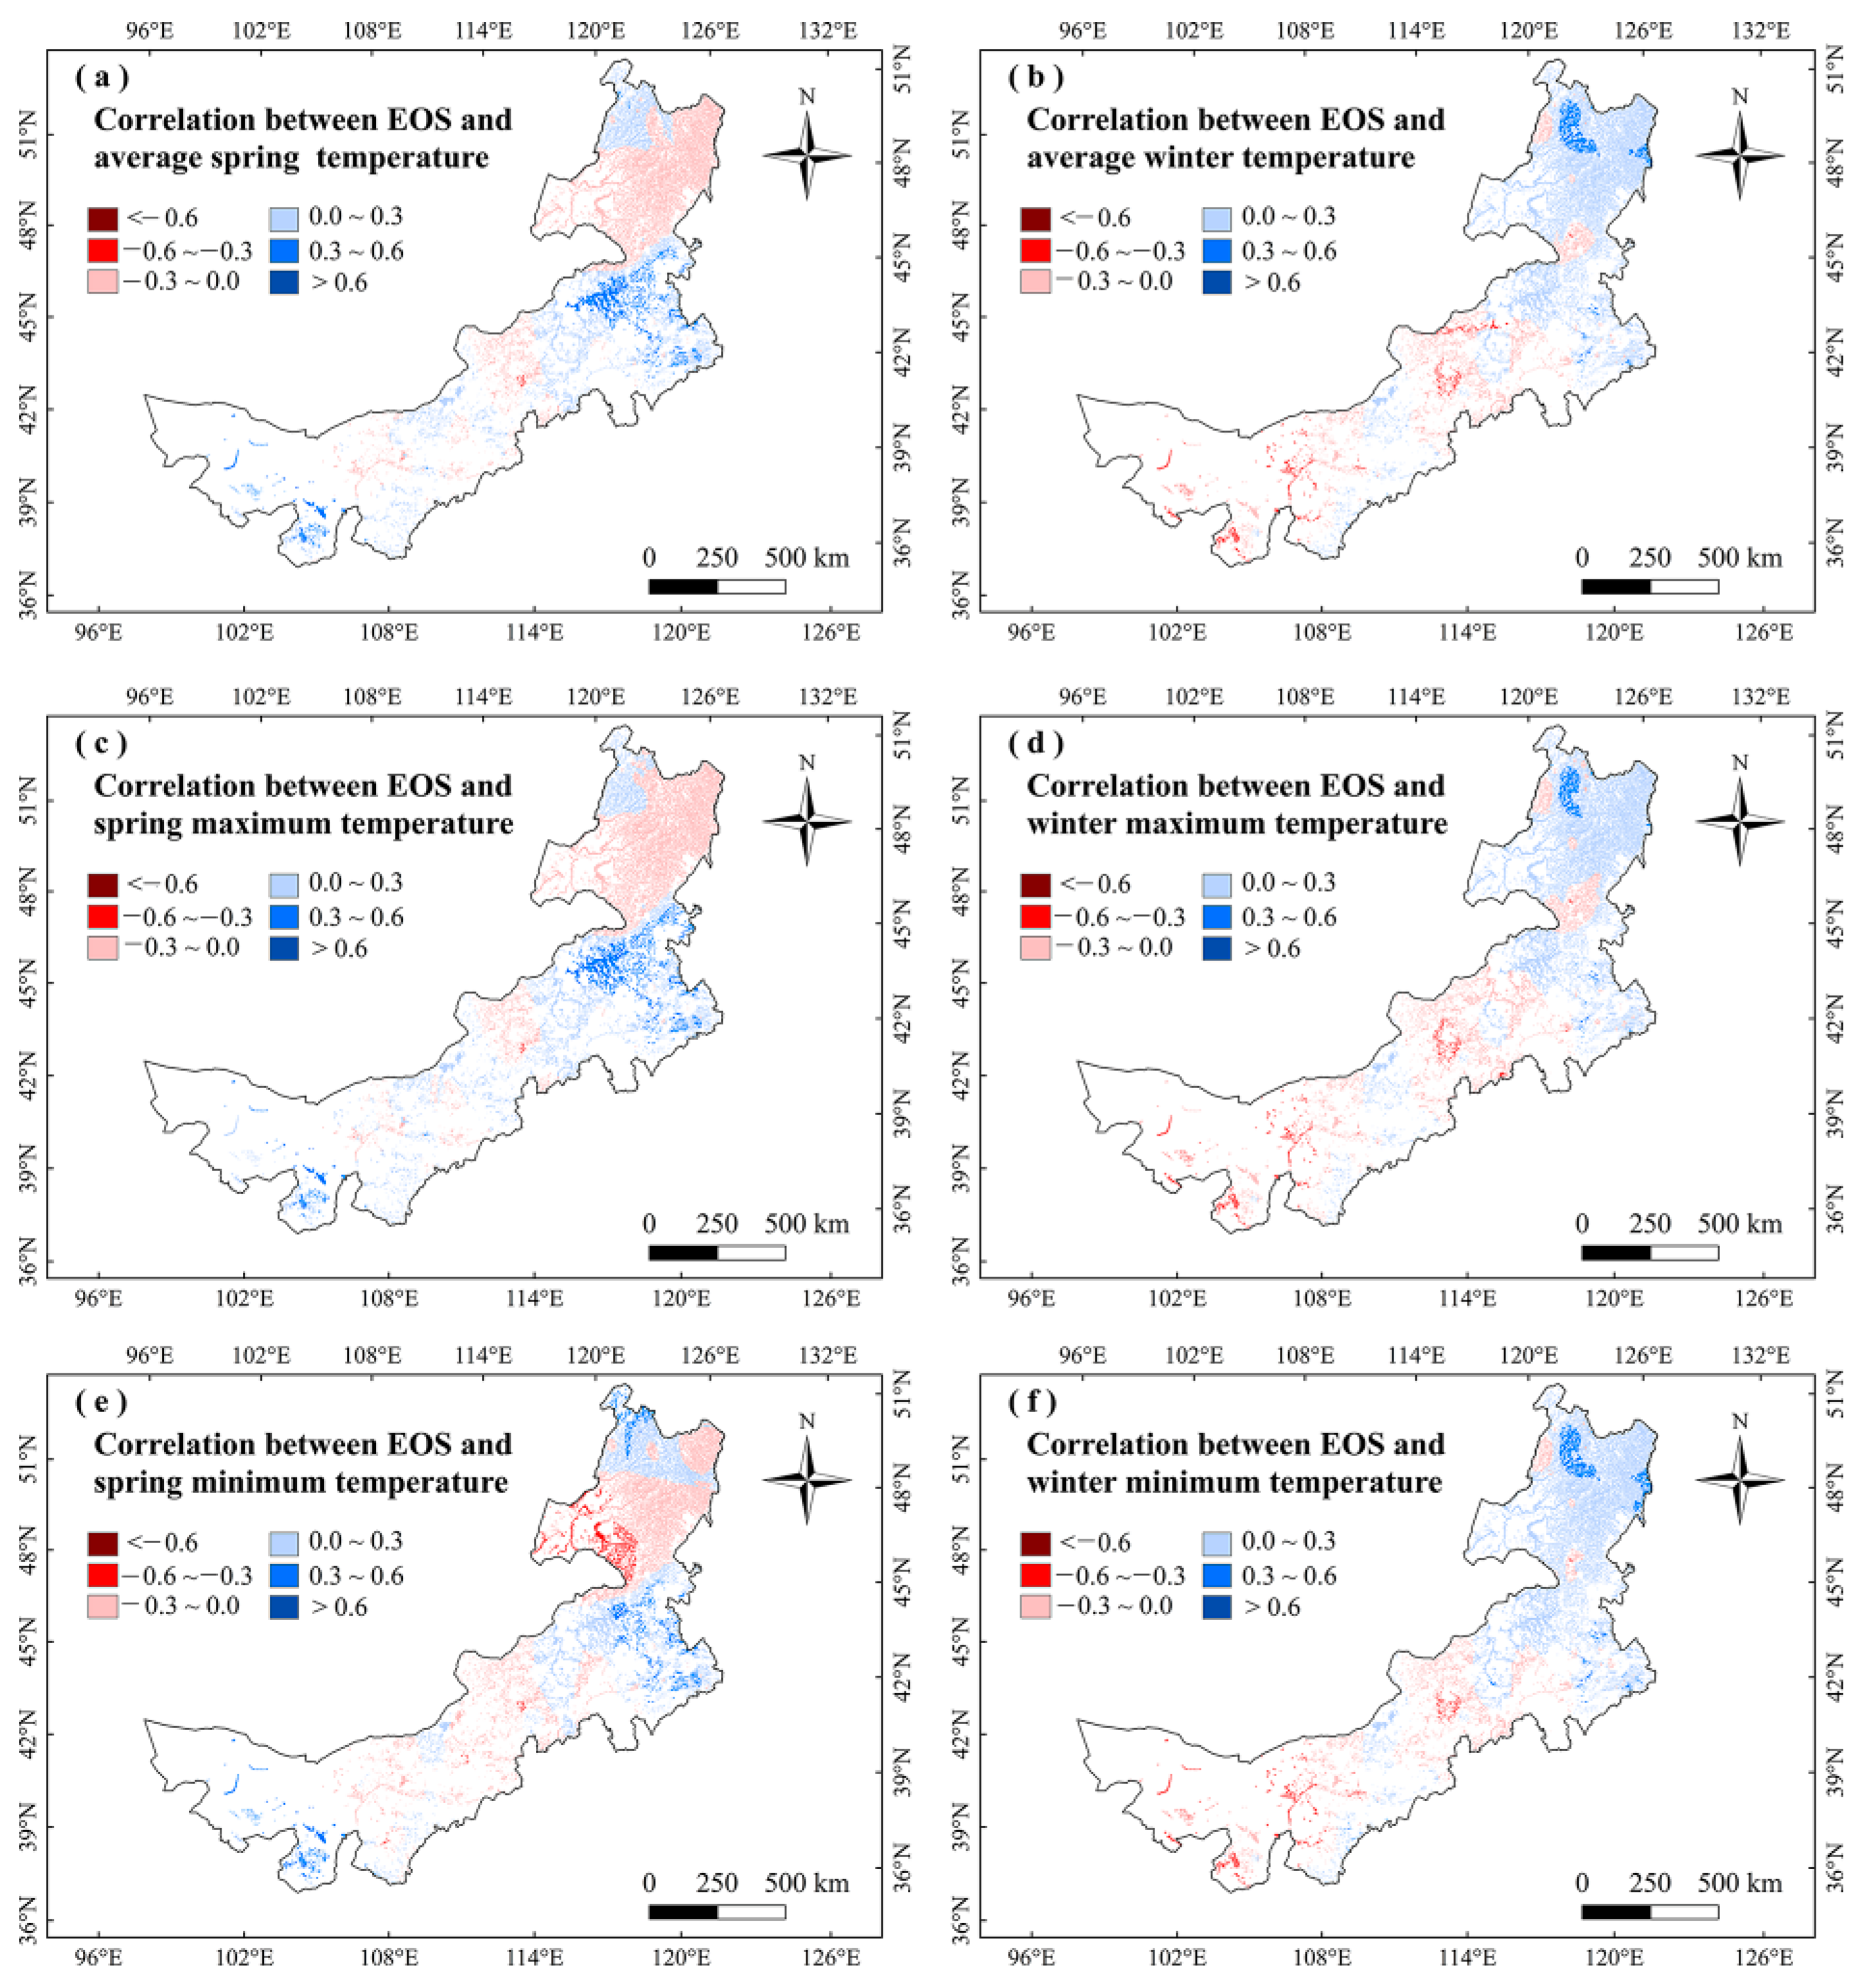
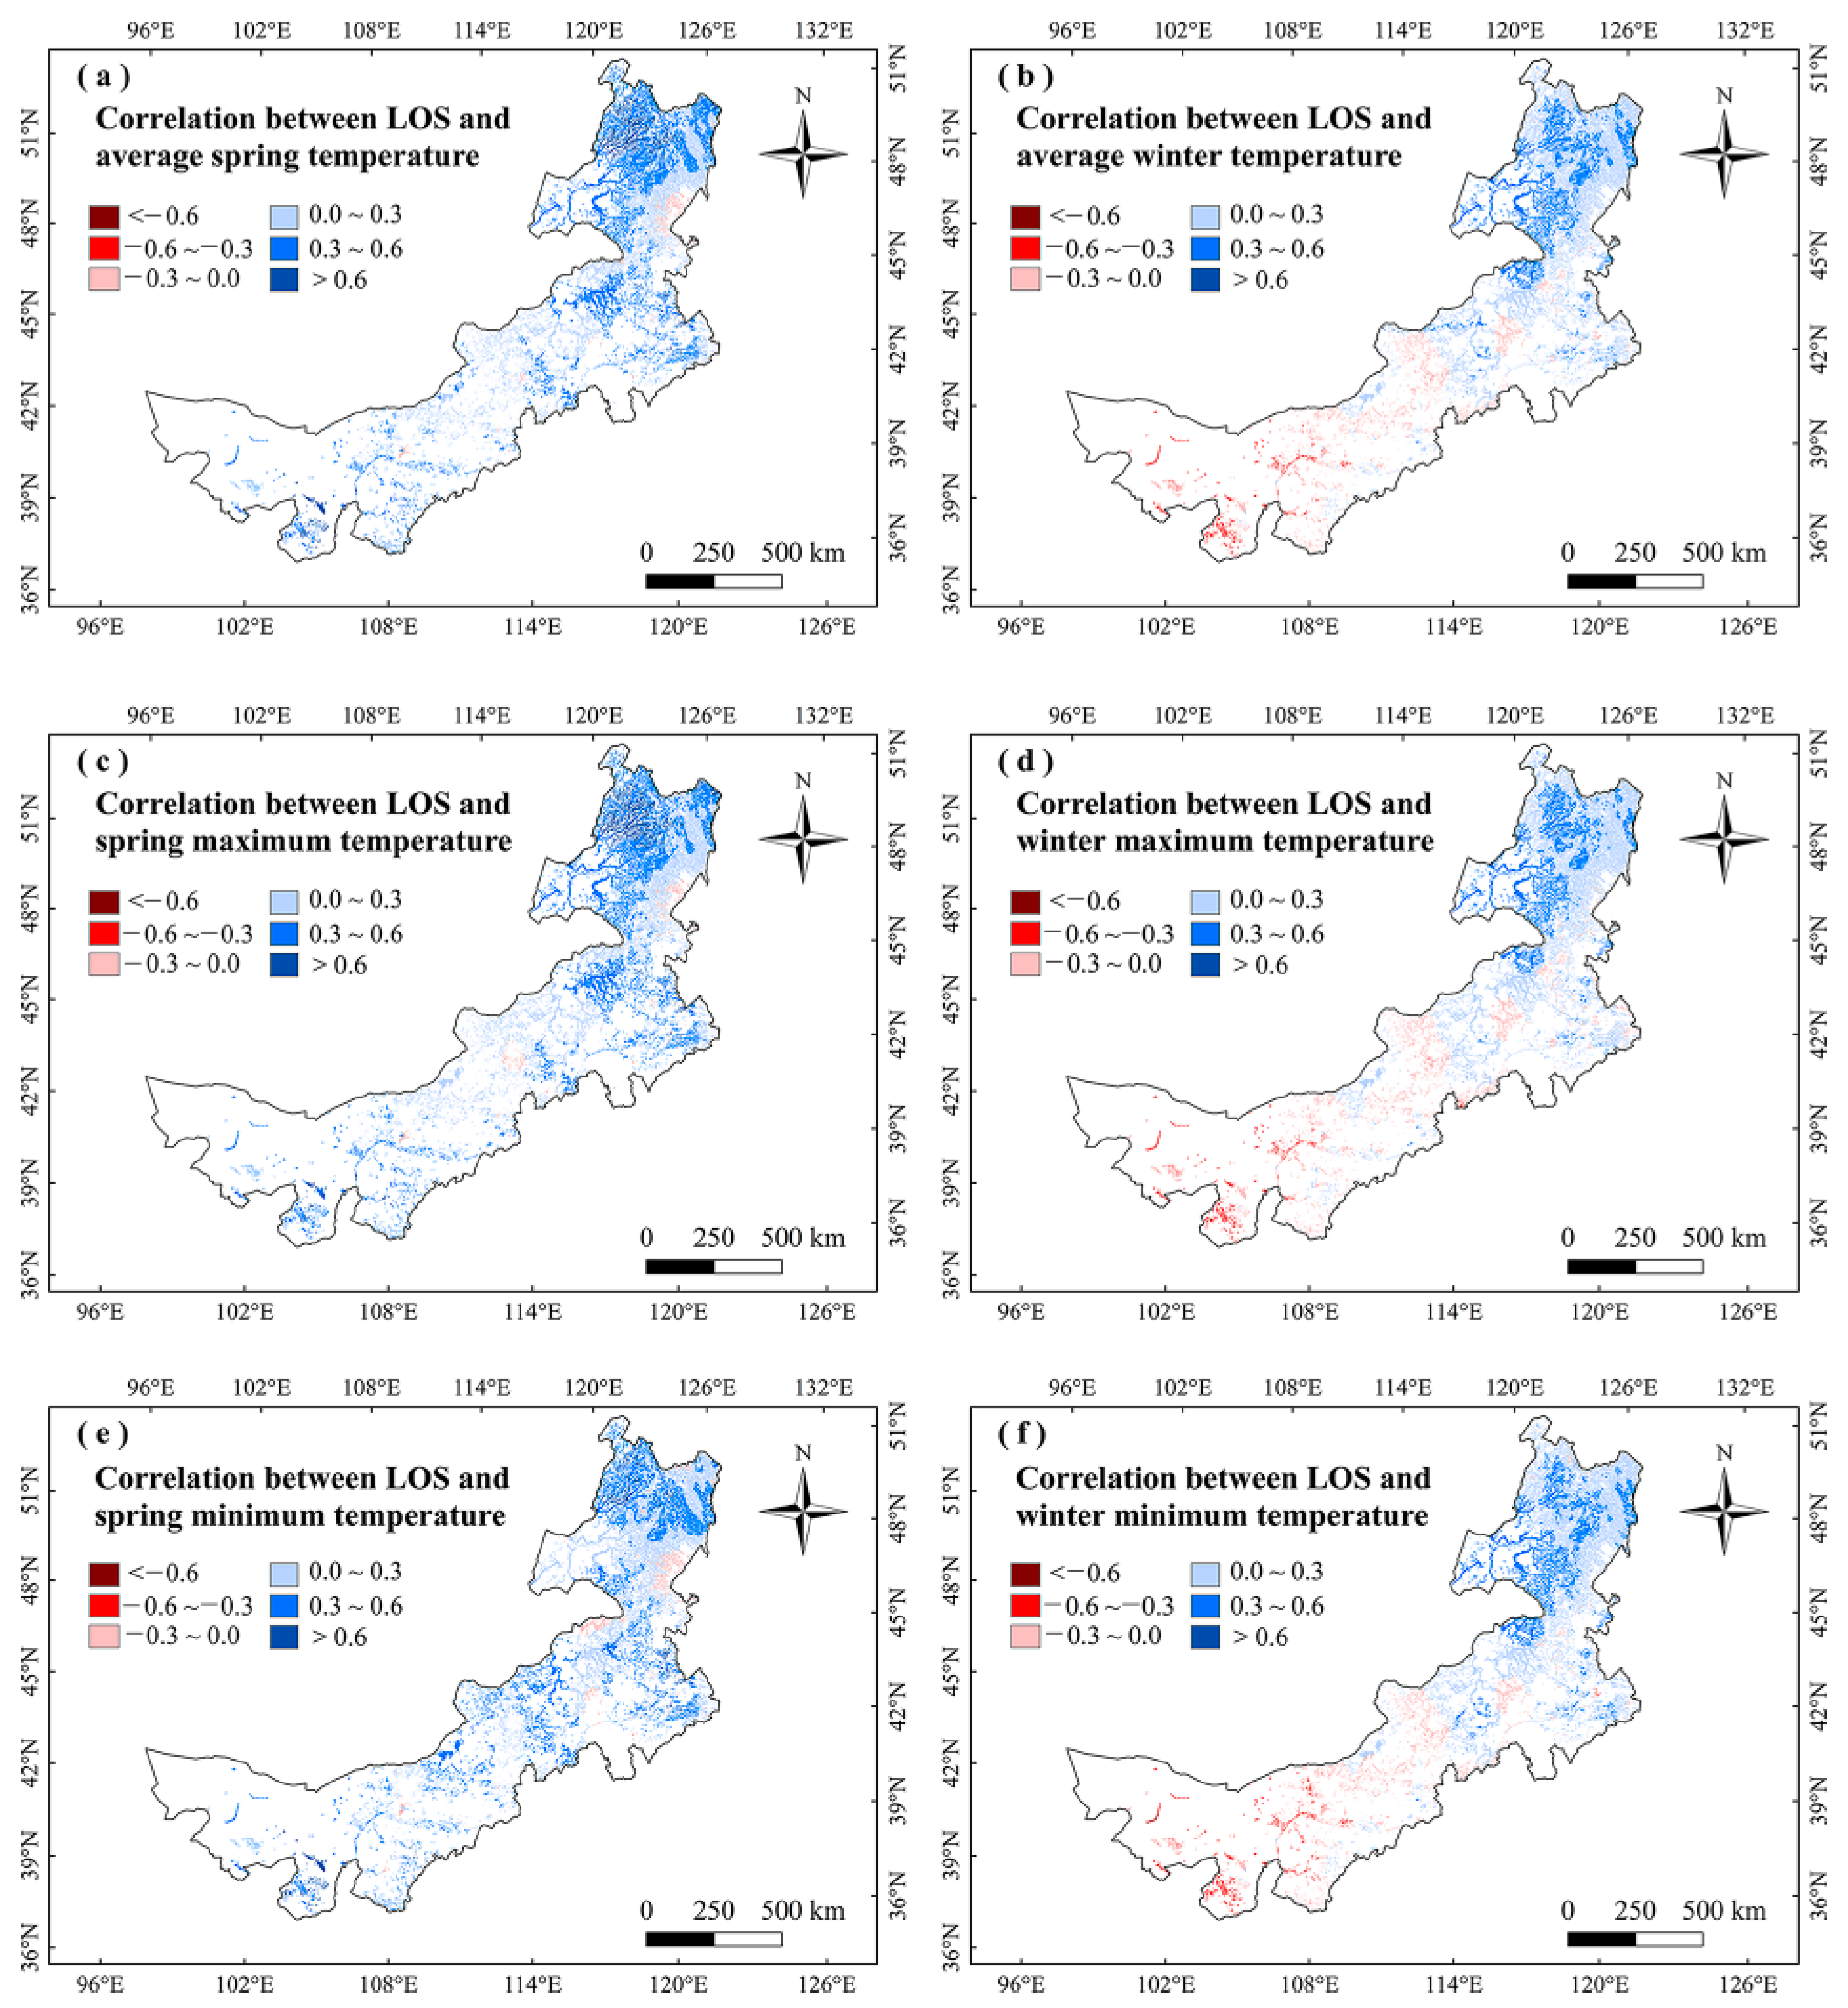
For analyzing the climatic effects on marsh phenology, we explored the correlations between climate factors and vegetation phenology in Inner Mongolia marshes during 2001–2020. It showed no significant correlation between marsh phenology and precipitation in any season (Figure 3). The SOS had significant (p < 0.05) negative correlations with temperatures in winter and spring, and the largest negative correlations were mainly found in northeastern Inner Mongolia (Figure 3 and Figure 4). The correlations between EOS and temperature in autumn and summer were moderately positive, and the correlations between LOS and temperatures in winter and spring were significantly positive (Figure 3 and Figure 5). The LOS had the largest positive relationships with temperatures in winter and spring in northeastern Inner Mongolia, and the largest negative correlations were mostly situated in central and southwestern Inner Mongolia (Figure 6). The SOS and EOS had no significant correlations with precipitation in different months, whereas the correlation between LOS and precipitation in August was significantly positive (Table 1). The SOS was significantly negatively correlated with Tmean from December to April. The relationships between LOS and Tmean from January to March were significantly positive (Table 1). In terms of the influences of daytime and nighttime temperature on marsh vegetation phenology, SOS showed negative correlations with Tmax and Tmin from December to April, and the negative correlation with Tmax was stronger than that with Tmin in those months (Table 1). The relationship between EOS and Tmin in August was significantly positive, while the relationship with Tmax in this month was weakly positive (Table 1). The LOS had positive correlations with Tmin and Tmax from December to April, and the positive correlations with Tmax in those months were stronger (Table 1). Moreover, the correlation between the LOS and Tmin in August was obviously (p < 0.05) positive, while the correlation with Tmax in August was negative (Table 1).

3. Discussion

3.1. Spatiotemporal Changes in Phenology in Marshes of Inner Mongolia during 2001–2020

We found that the vegetation SOS was earlier (Figure 1a), EOS was later (Figure 1c), and LOS was longer (Figure 1e) in marshes of eastern Inner Mongolia. Inner Mongolia has a monsoon climate, and the hydrothermal condition in the east was better than in the west [36], which possibly explains the later EOS, earlier SOS, and longer LOS in eastern Inner Mongolia. We found that the regional average SOS advanced, EOS delayed, and thus LOS increased during 2001–2020 in marshes of Inner Mongolia. This result was similar to Cui and Shi [37] who found that SOS advanced, EOS delayed, and LOS increased in most regions of Inner Mongolia. In northeastern Inner Mongolia, EOS and SOS advanced, while LOS increased in this region. It indicates that the advanced SOS may explain increased LOS in northeastern Inner Mongolia.

3.2. Correlations between Climate Factors and Marsh Vegetation Phenology

We found that the marsh vegetation phenology had no significant correlations with precipitation in any season (Figure 3). It indicates that seasonal precipitation may be not the major factor influencing the vegetation phenology in the marshes of Inner Mongolia. This finding is different from the results of Wang et al. [28] and Gong et al. [38], who found that precipitation was the main reason affecting phenology in the grasslands of Inner Mongolia. Grasslands are relatively dry and may need more water to maintain plant growth [39]. Therefore, precipitation is a major factor influencing grassland phenology [38]. Different from the grassland ecosystem, the marsh ecosystem has relatively humid and wetter than grasslands [40]. The water condition of marshes in this region is relatively sufficient. Therefore, precipitation in different seasons may not be the main factor affecting the phenology of marshes vegetation in this region.
For the impacts of climate change in different months on phenology, the relationships of SOS with Tmean from December to April were significant (Table 1). This suggests that increasing temperatures in winter and spring can advance SOS. The reason may be that the increase of temperatures in winter and spring can reduce frost [33], and promote heat accumulation to initiate green-up [41,42]. For climatic effects on EOS, our results showed that increasing temperatures in autumn and summer can delay EOS to a certain extent. This may be because increasing temperatures in summer and autumn promote photosynthetic enzyme activities and slow chlorophyll degradation during leaf senescence [43,44], thus delaying EOS.
For the responses of LOS to climate change, LOS has significant positive correlations with winter and spring temperatures (Figure 3). We thus conclude that increasing temperatures in spring and winter advanced SOS, thereby increasing LOS. In addition, LOS has an obvious (p < 0.05) positive correlation with precipitation in August, suggesting that increasing precipitation in August could increase the LOS (Table 1). In August, the climate is relatively dry (high temperature and strong evaporation) [45]. The vegetation in Inner Mongolia grows vigorously in August [46]. Increasing precipitation in August may alleviate water stress and promote the growth of marsh vegetation [43,47]. This may partly explain the increasing inprecipitation in August and the LOS increases in the marsh of Inner Mongolia.
In terms of the influences of Tmin and Tmax on marsh vegetation phenology, there was an asymmetric impact of Tmin and Tmax on vegetation phenology in marshes of Inner Mongolia. The increases of Tmin and Tmax in winter and spring advanced SOS, while increases of Tmax in winter and spring had a stronger advancing effect on the SOS than Tmin (Figure 3). This is because the climate in Inner Mongolia is cold in winter and spring [36], and vegetation needs heat accumulation to start growing [48,49]. Increasing Tmax and Tmin in winter and spring may promote heat accumulation and reduce frost damage [19,41,50]. Before the green-up of vegetation, the Tmin is more likely to be below the threshold of heat accumulation, thus Tmin may have a weaker influence on the green-up of plants than Tmax [34,50]. This may explain why the increase of Tmax in winter and spring had a stronger advancing effect on the SOS than Tmin in the marshes of Inner Mongolia.
We found that the correlation between the EOS and Tmin in August was obviously positive, while the correlation with Tmax in August was weakly positive (Table 1). This implied that the increases of Tmin and Tmax in August delayed the marshes EOS in Inner Mongolia, but increasing Tmin had a stronger delaying effect on the EOS than that in Tmax. The delaying effect of warming Tmax on EOS may be due to the fact that the increase in Tmax can improve the activities of photosynthetic enzymes and promote photosynthesis [51]. By contrast, although the increase of Tmin can cause more organic matter consumption, increasing Tmin can also cause a compensation effect for marsh vegetation [52]. The compensation effect is the phenomenon where the increases in vegetation respiration and organic matter consumption due to warming temperature at night are compensated by enhanced photosynthesis the next day [35,53,54]. The compensation effect is stronger in regions with suitable hydrothermal conditions, and can even result in overcompensation [55,56,57]. This compensation effect may produce a state in which photosynthesis restores or exceeds respiration [58]. In our study, the water and nutrient status of marshes in Inner Mongolia was conducive to the overcompensation effect in the vegetation. The most suitable water and nutrient conditions occurred in August, and August is the best time to cause an overcompensation effect in the vegetation [59]. Therefore, the increased Tmin in August may cause an overcompensation effect for marsh vegetation, which explains stronger delaying effects on EOS than Tmax in marshes of Inner Mongolia.
Our results showed that LOS had a stronger positive correlation with Tmax than with Tmin from December to April (Table 1). It indicates that the increases in Tmin and Tmax in winter and spring increase LOS, and rising Tmax in winter and spring had stronger effects on LOS than Tmin in marshes of Inner Mongolia. On one hand, increasing Tmax and Tmin in winter and spring may promote heat accumulation and reduce frost damage [41,50]. On the other hand, the Tmin is more likely to be below the threshold of heat accumulation before the green-up of vegetation, thus Tmin may have a weaker influence on the green-up of plants than Tmax [50]. The increases of Tmin and Tmax in winter and spring might advance SOS, thereby increasing the vegetation n LOS in marshes of Inner Mongolia. In addition, LOS was significantly positively correlated with Tmin in August (Table 1), confirming that warming Tmin in August can delay EOS and thus increase LOS. It owing to the fact that August is the best time to occur an overcompensation effect in the vegetation [60]. Therefore, the increased Tmin in August may cause an overcompensation effect for marsh vegetation. This may explain the delayed EOS and thus increased LOS.
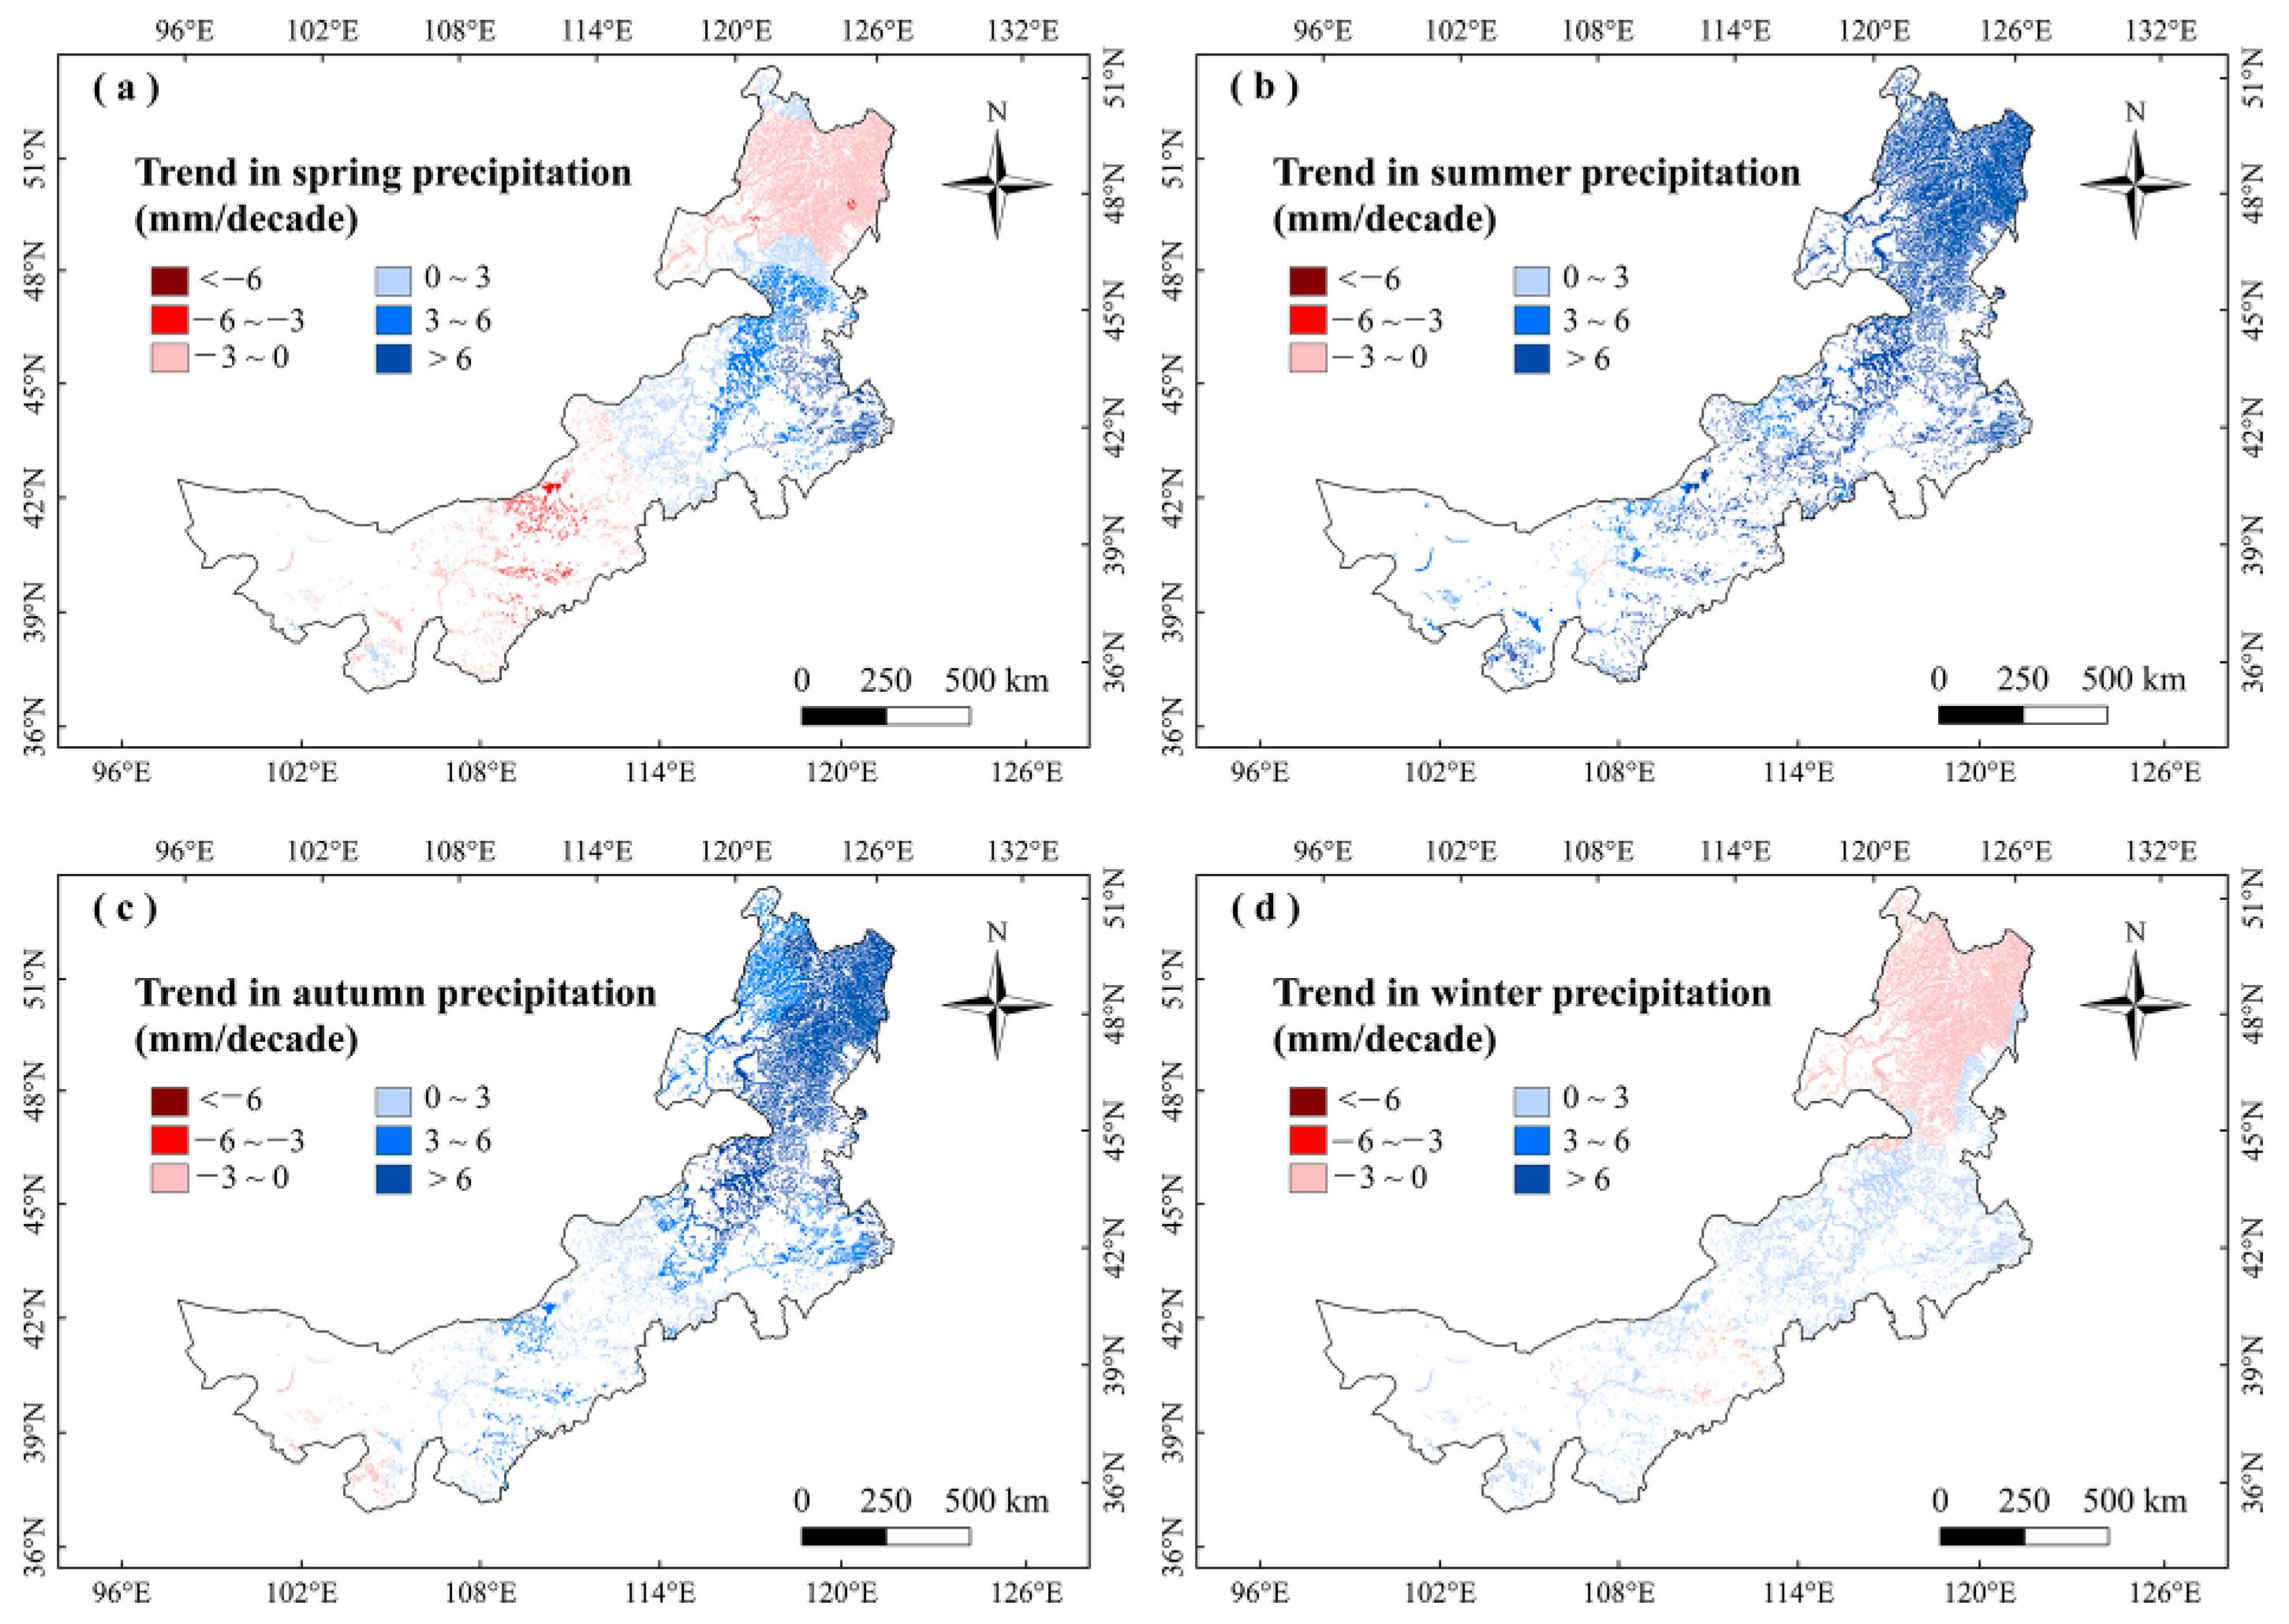
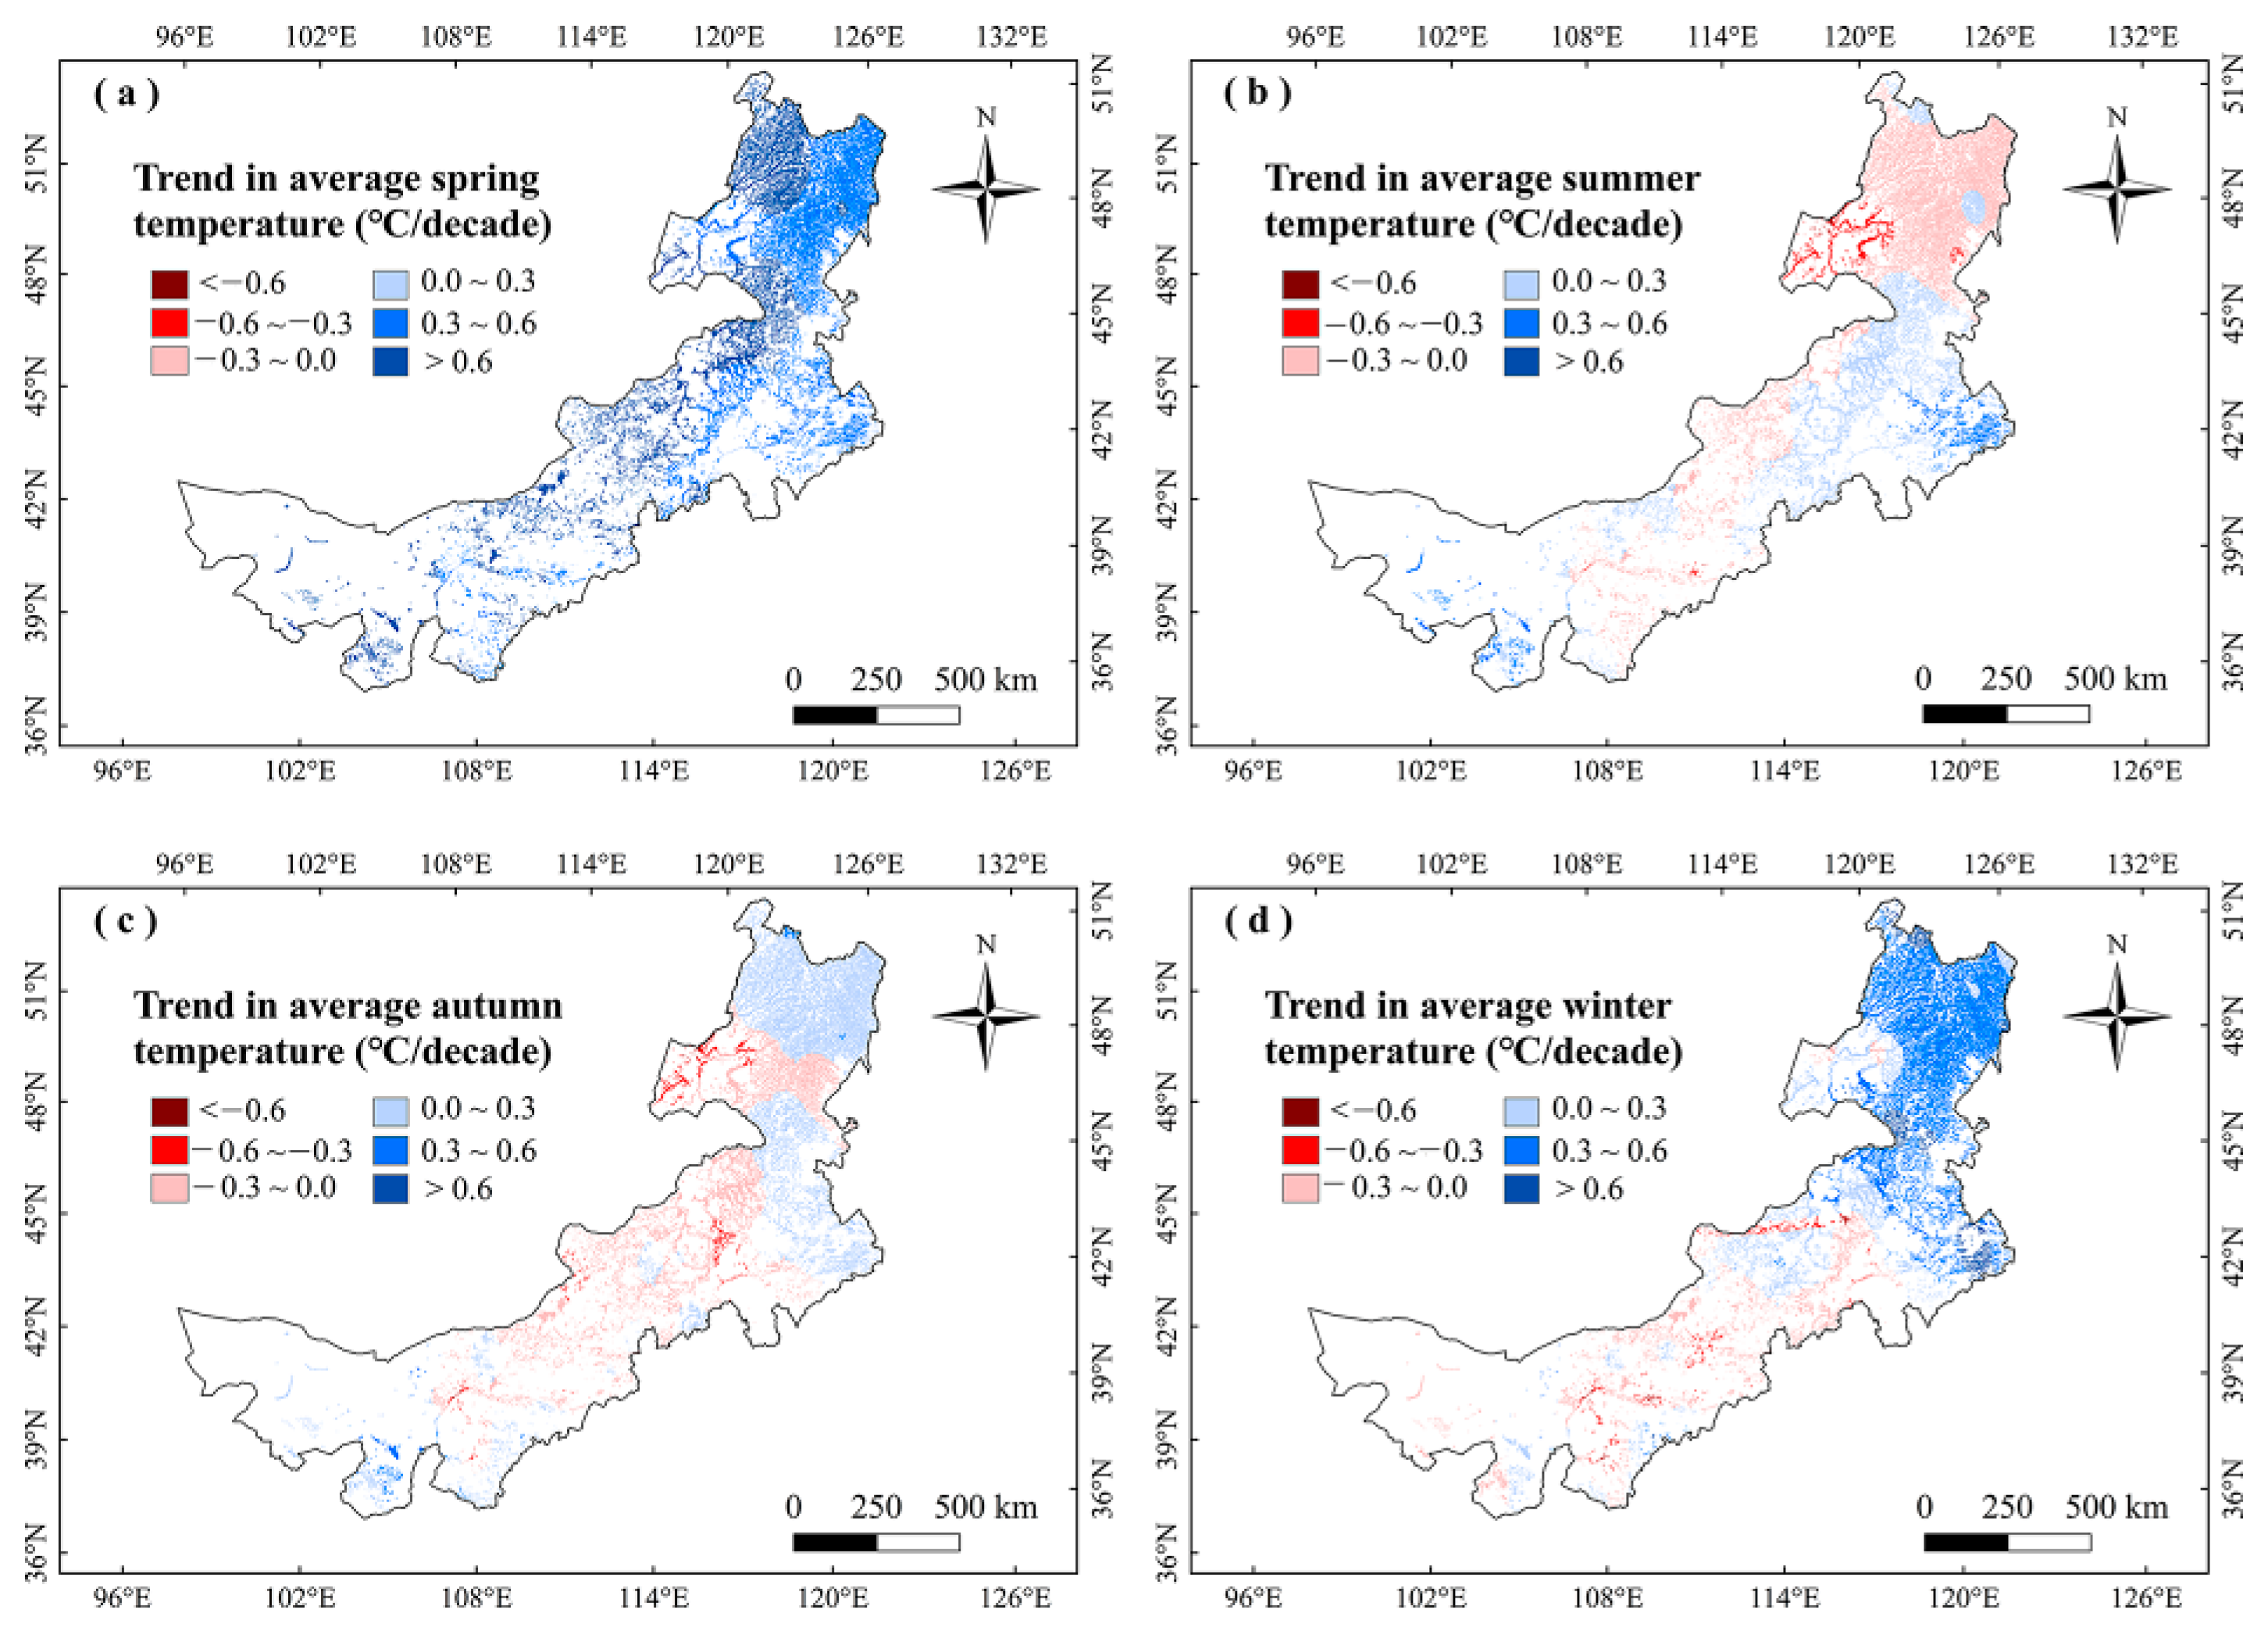
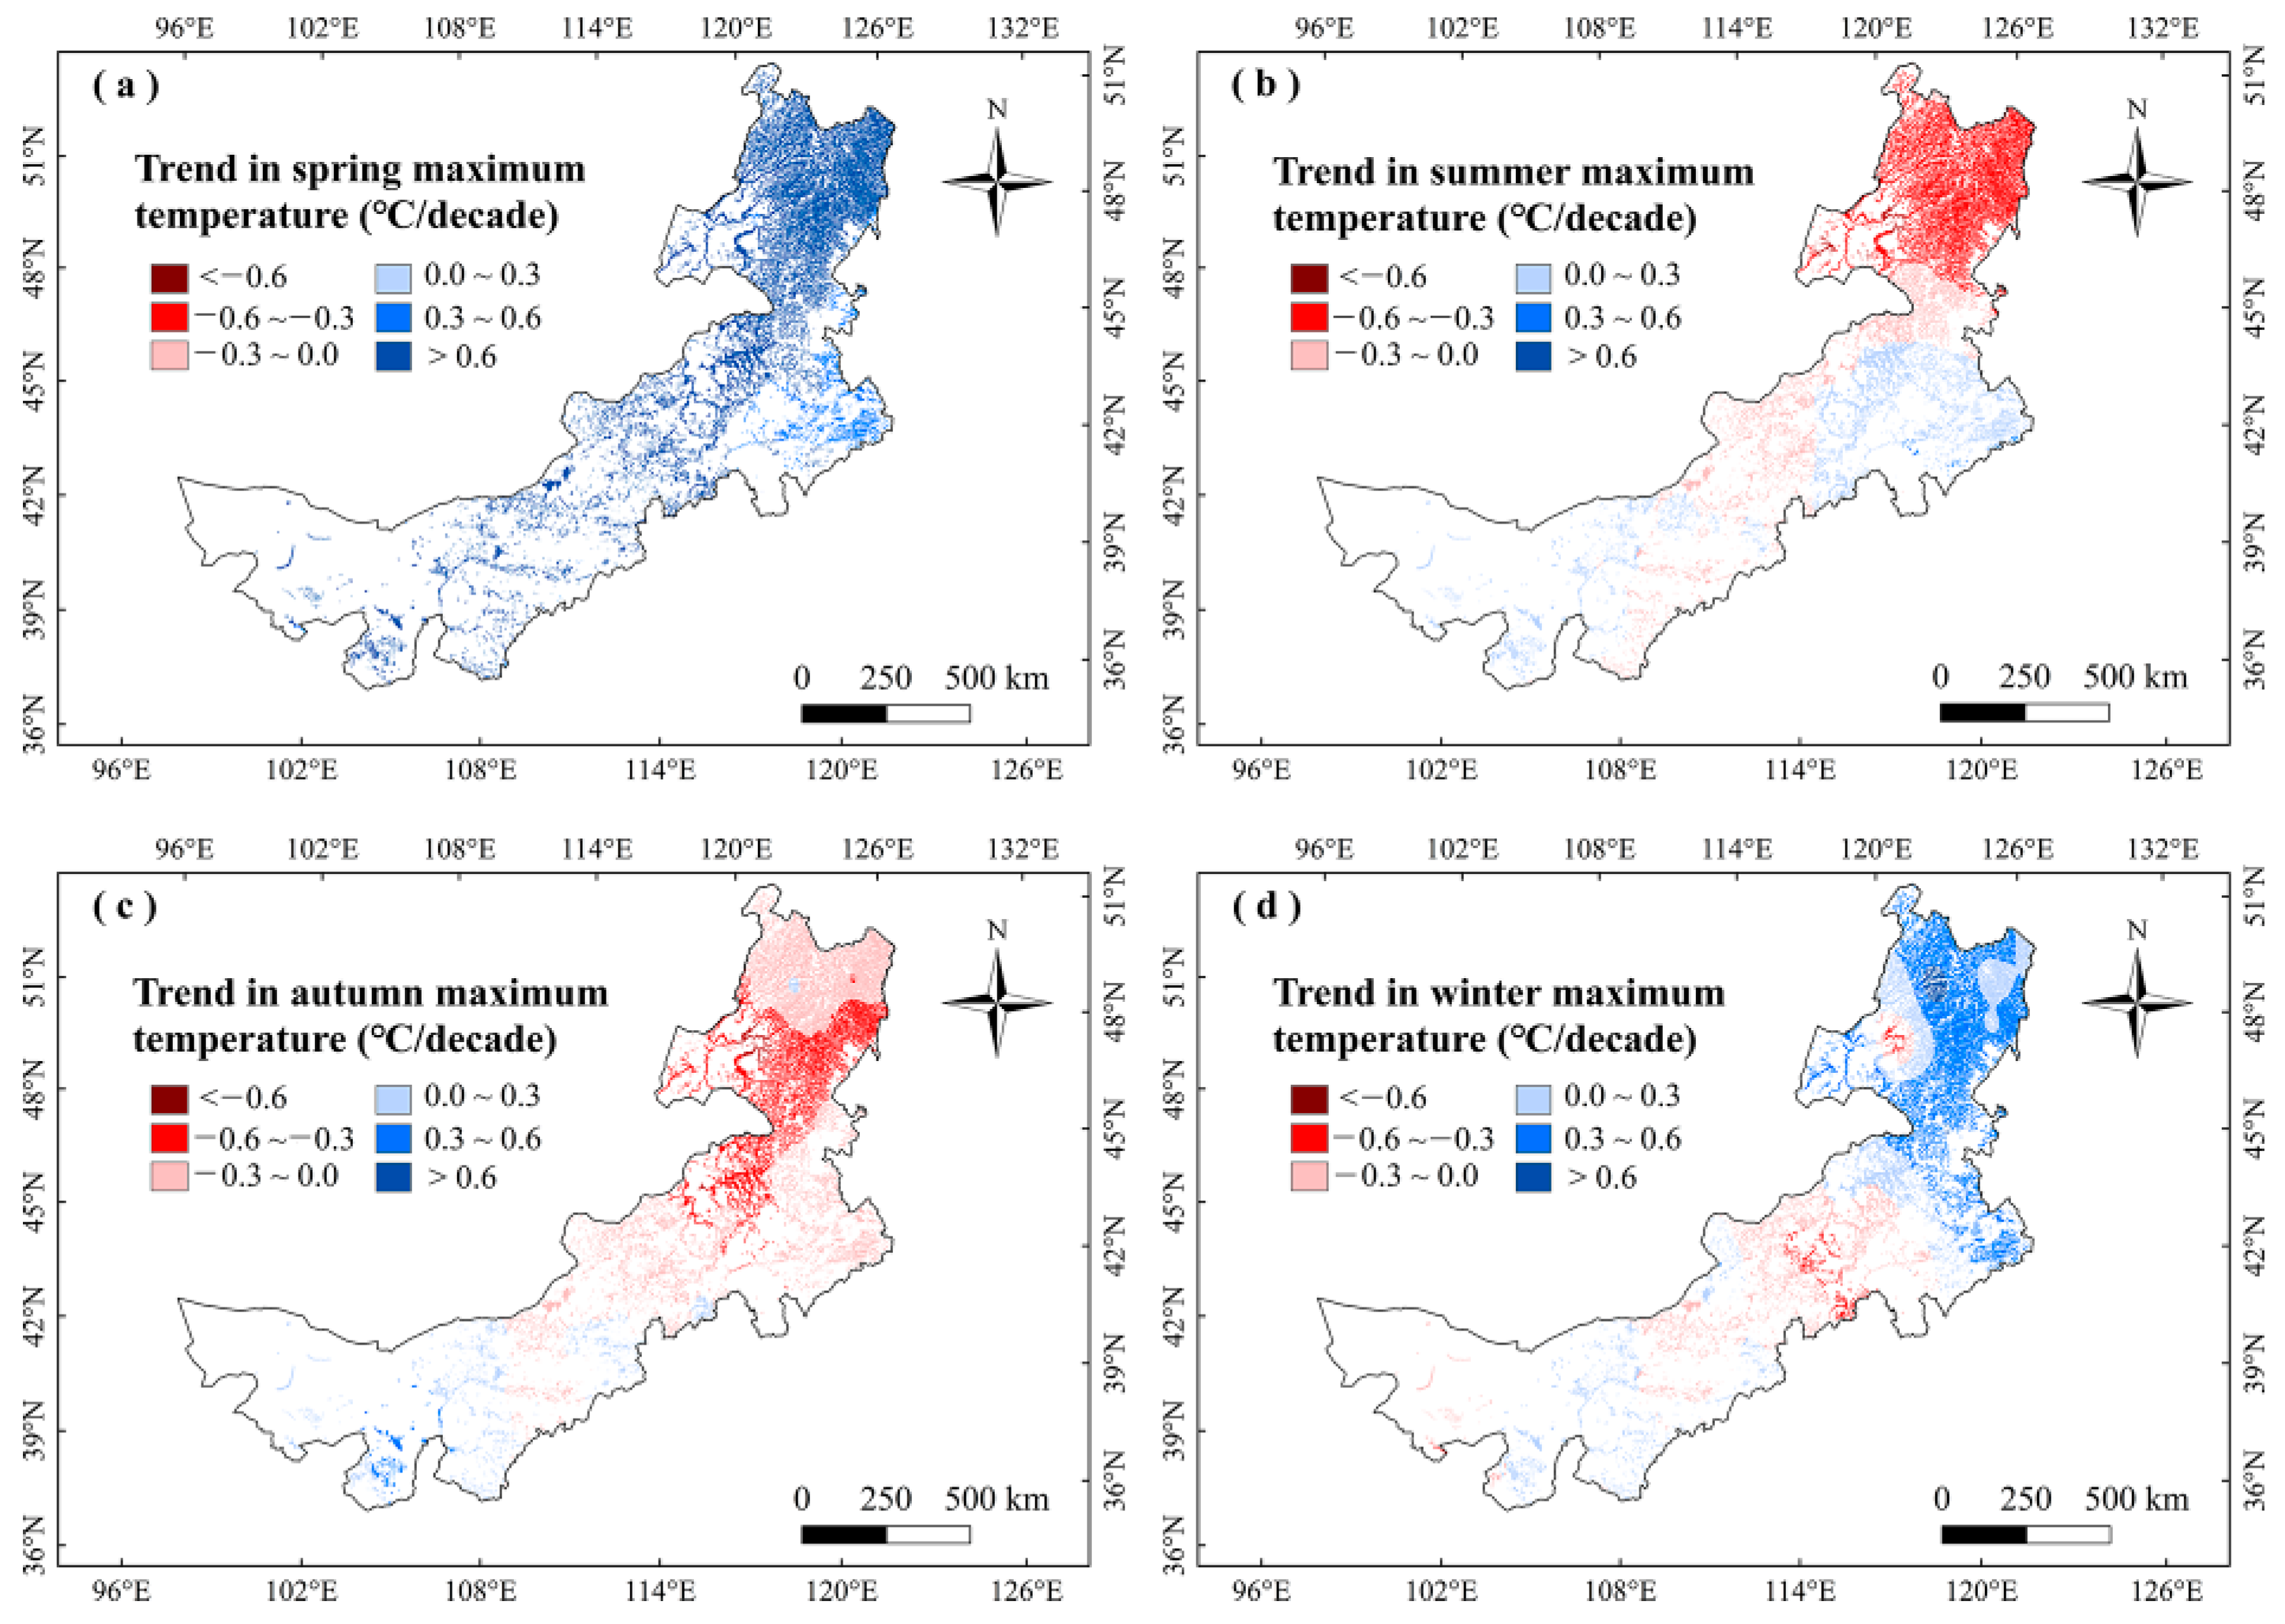
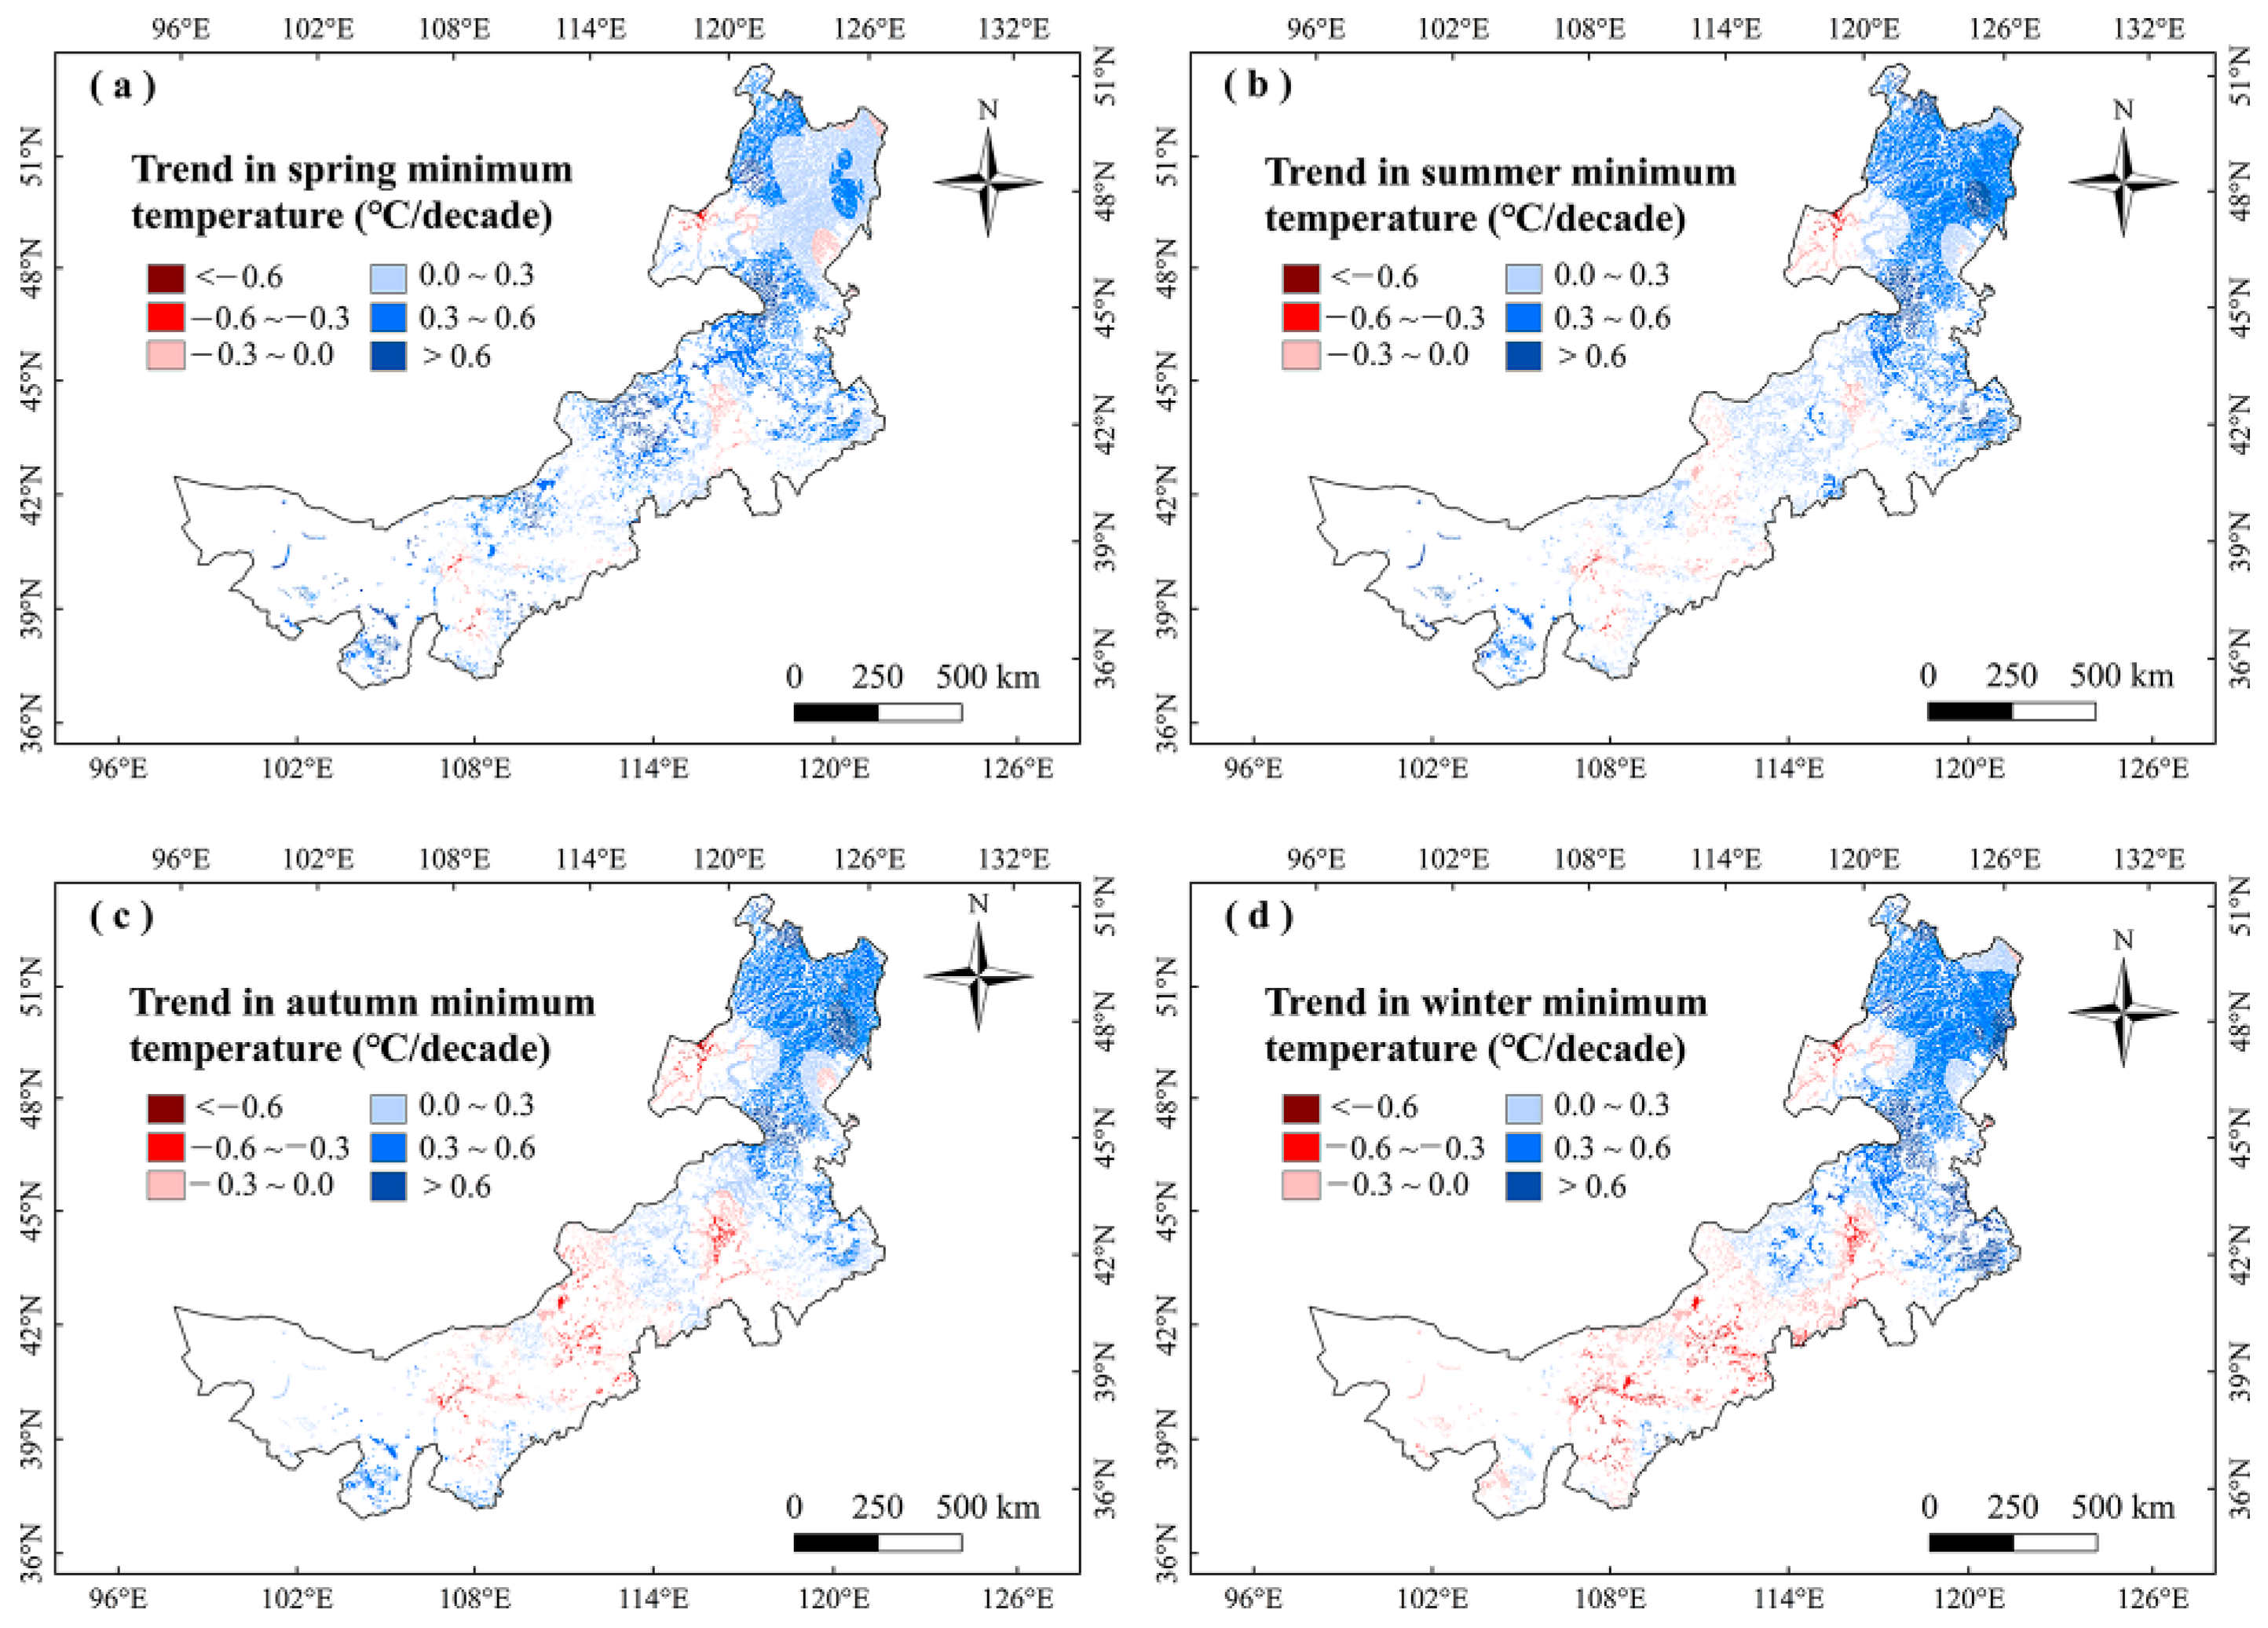
To further explain the climate impacts on vegetation phenology, we explored the changes in climate factors in Inner Mongolia marshes during 2001–2020 (Figure 7, Figure 8, Figure 9 and Figure 10). We found that precipitation in summer and autumn significantly increased, while it showed weak variations in spring and winter during this period (Table 2). The temperatures increased in different seasons. The Tmax increased in spring and winter, while it decreased in summer and autumn. The Tmin moderately increased in different seasons (Table 2). The correlations between LOS and precipitation in summer and autumn were moderately positive in this region (Figure 3), indicating that increasing precipitation in summer and autumn may explain the increase in LOS of marsh vegetation to some extent. Considering that SOS (LOS) showed a negative (positive) relationship with temperatures in winter and spring (Figure 3), we conclude that the increases in temperatures in winter and spring could explain the advanced SOS and increased LOS of Inner Mongolia marshes. In different months, the precipitation and Tmin in August showed a significant increasing trend. Because LOS was significantly positively correlated with precipitation and Tmin in August (Table 1), the increases in precipitation and Tmin in August could explain the increase of LOS in the marsh of Inner Mongolia. Spatially, we found that the largest increasing trends in temperatures in winter and spring occurred in northeast Inner Mongolia (Figure 8a,d). The SOS (LOS) showed negative (positive) relationships with temperatures in winter and spring in this region (Figure 4 and Figure 6). Therefore, we inferred that increasing temperatures in spring and winter could explain the advanced SOS and increased LOS in northeastern Inner Mongolia.

3.3. Limitations

We should note that the study may have some uncertainties and limitations. Firstly, the NDVI data used in this work may have some uncertainties due to the influences of solar altitude angle and clouds. Secondly, we extracted unchanged marsh vegetation as the research area, but it cannot completely exclude the impacts of human activities. Therefore, in future research, it is necessary to further investigate the impacts of human activities on marsh vegetation in this region. Thirdly, the number of weather stations was limited in the study area, which perhaps affects the results. More accurate climate and vegetation index data are still needed to further confirm our results. Moreover, the current study only investigated the responses of vegetation phenology to temperature and precipitation. Human activities and other climatic factors can also influence the marshes vegetation in Inner Mongolia. As such, further research needs to explore the influences of other environmental and climatic variables on the vegetation phenology of marshes in Inner Mongolia.

4. Materials and Methods

4.1. Study Area

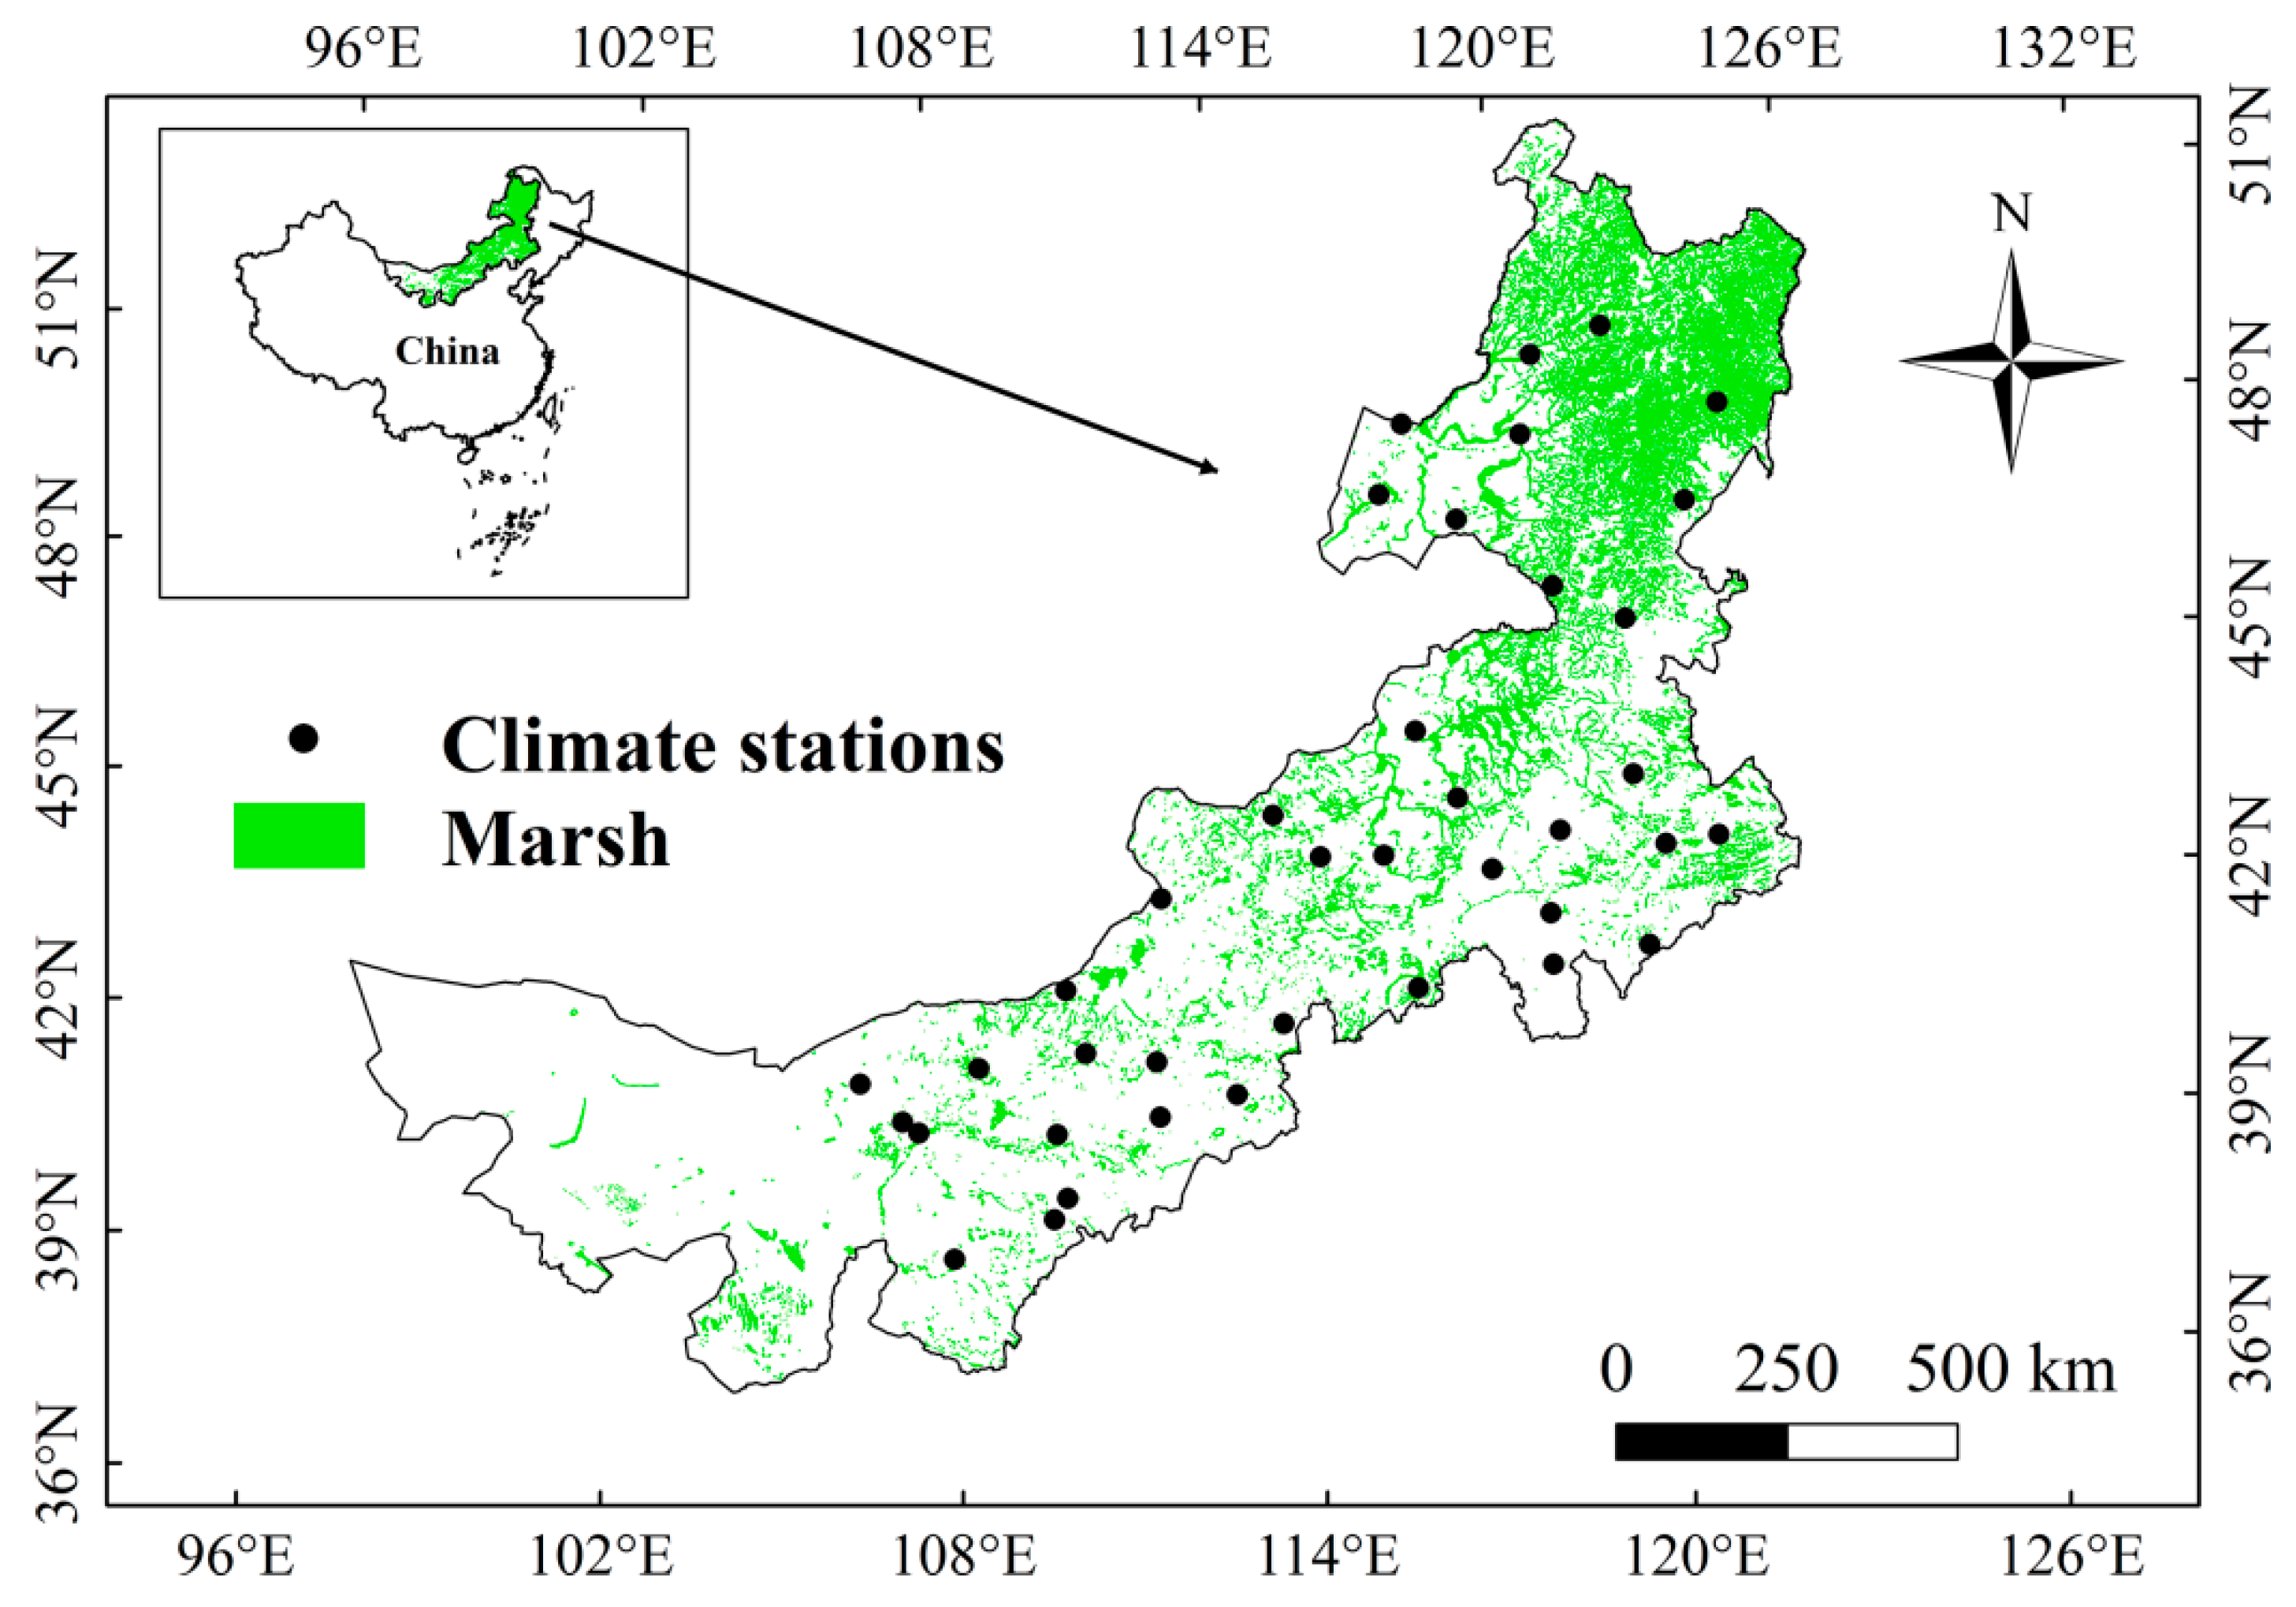
Inner Mongolia is situated in the north of China (Figure 11). This region has a monsoon climate: dry and cold in winter, and wet and warm in summer [36,61,62,63]. Inner Mongolia is an important marsh distribution region in China, and the marsh in this region is important for the biogeochemical cycle and biodiversity conservation [25]. The marsh vegetation in Inner Mongolia mainly includes Carex lasiocarpa, Carex pseudocuraica, and Betula fruticosa [19].

4.2. Data

We used monthly precipitation, minimum, maximum, and average temperatures (Tmean) data from 39 weather stations in Inner Mongolia during 2001–2020 in this study (Figure 1). The climate data were provided by China Meteorological Center, and they have been subjected to strict quality assurance [33]. This study also used the MOD13Q1 NDVI dataset from 2001 to 2020, obtained from NASA. The spatial-temporal resolutions of NDVI data were 250 m and 16 days, respectively [52]. The distribution data of marshes in 2015 and 2000 covering Inner Mongolia were provided by the Earth System Science Data Center of China and passed through strict quality control and verifications [64]. The spatial resolution of marsh distribution data was 30 m [64].

4.3. Method

To avoid the possible impacts of land use change on phenological results, we extracted the unchanged marshes (marshes in both marsh distribution maps) as the study region. To calculate the SOS and EOS in marshes of Inner Mongolia, we used the Polyfit-Maximum approach, which is widely applied in previous research because of its good performance [19,24,34,65,66,67]. Firstly, we calculated the changes in NDVI by the following formula:
N D V I r a t e ( t ) = N D V I ( t + 1 ) N D V I ( t ) N D V I ( t )
NDVI(t) refers to NDVI change, and t is the Julian date (DOY). This method set the largest decrease (increase) date of NDVI to the corresponding end (start) date of the growing season. We used the EOS and SOS to calculate the LOS of marsh vegetation in Inner Mongolia.
Then, this study applied the 6-degree polynomial function to better fit the NDVI time series [60]. Its formula is as follows:
NDVI = a0 + a1d + a2d2 + … + a6d6
where a1, …a6 refer to the fitting coefficients of the least square regression.
This study adopted the ordinary Kriging approach to interpolate climate data into the distribution of Inner Mongolia marshes and then unified the climate and NDVI dataset to the same spatial resolution [19,48]. We used monthly climate data to calculate the average values of precipitation and temperature in spring (March–May), summer (June–August), autumn (September–November), and winter (previous December–February). The average value of all pixels for each variable was used to calculate the regional average value of marshes in this region. In addition, we calculated the variation trends in the variables by linear regression analysis as follows [40]:
θ s l o p e = n × i = 1 n i × M i i = 1 n i × i = 1 n M i n × i = 1 n i 2 i = 1 n i 2
Mi is the climatic factors (or phenology) value in the i th year; i is the serial year number; n represents the study period; θslope is the change slope in climatic factors (or phenology) of each pixel, θslope < 0 represents that the variable reduced, otherwise it increased.
Using Pearson correlation analysis, we explored the correlation between phenology and climatic factors in different months [52].
R a b = i = 1 n a i a ¯ b i b ¯ i = 1 n a i a ¯ 2 i = 1 n b i b ¯ 2
n represents the length of the period; Rab refers to the correlation coefficient; ai and bi are the average climatic variables and phenology in year i; a and b refer to the average climate and phenology variables from 2001–2020.

5. Conclusions

From 2001 to 2020, the SOS advanced significantly (p < 0.05) by 0.50 days/year, the EOS significantly by 0.38 days/year, and the LOS increased obviously by 0.88 days/year in the marshes of Inner Mongolia. The increases in temperature in winter and spring could significantly advance the SOS, thus increasing the LOS in Inner Mongolia marshes. Increasing temperatures in autumn and summer delayed the EOS to a certain extent. In different months, increasing precipitation in August could obviously increase the LOS, and increased temperatures from December to April could advance SOS. Furthermore, we found for the first time that Tmax and night Tmin had asymmetric effects on phenology. Increasing Tmax had a stronger advancing effect on SOS than increasing Tmin from December to April. The increase of Tmin in August obviously delayed EOS, while increasing Tmax in August had no significant effect on EOS. This study highlights the diverse impacts of monthly precipitation and temperature changes on marsh vegetation phenology and implies that the asymmetric influences of nighttime and daytime temperatures should be taken into account when simulating marsh vegetation phenology in temperate arid and semi-arid regions worldwide, particularly in the context of global asymmetric diurnal warming. The results of this study can contribute to predicting vegetation dynamics of marshes and provide an important scientific basis for the conservation of marsh vegetation in Inner Mongolia.

Author Contributions

Y.L., Data curation, Writing-Original draft; X.S., Methodology, Writing—Reviewing and Editing; J.Z., Y.W., L.W. and R.M., Writing—Reviewing and Editing; X.L. and M.J., Supervision. All authors have read and agreed to the published version of the manuscript.

Funding

This research was funded by the National Natural Science Foundation of China (41971065), Natural Science Foundation of Jilin Province (20210101104JC), Key Research Program of Frontier Sciences, CAS (ZDBS-LY-7019), and Youth Innovation Promotion Association, CAS (2019235).

Data Availability Statement

The data used in this article can be requested by the author.

Conflicts of Interest

The authors declare no conflict of interest.

References

  1. Yang, P.; Zhang, L.; Lai, D.Y.; Yang, H.; Tan, L.; Luo, L.; Tong, C.; Hong, Y.; Zhu, W.; Tang, K.W. Landscape Change Affects Soil Organic Carbon Mineralization and Greenhouse Gas Production in Coastal Wetlands. Glob. Biogeochem. Cycles 2022, 36, e2022GB007469. [Google Scholar] [CrossRef]
  2. Smith, A.; Kirwan, M. Sea level-driven marsh migration results in rapid net loss of carbon. Geophys. Res. Lett. 2021, 48, e2021GL092420. [Google Scholar] [CrossRef]
  3. Keppeler, F.; Olin, J.; López-Duarte, P.; Polito, M.; Hooper-Bùi, L.; Taylor, S.; Rabalais, N.; Fodrie, F.; Roberts, B.; Turner, R.; et al. Body size, trophic position, and the coupling of different energy pathways across a saltmarsh landscape. Limnol. Oceanogr. Lett. 2021, 6, 360–368. [Google Scholar] [CrossRef]
  4. Ribeiro, K.; Pacheco, F.; Ferreira, J.; de Sousa-Neto, E.; Hastie, A.; Krieger Filho, G.; Alvalá, P.; Forti, M.; Ometto, J. Tropical peatlands and their contribution to the global carbon cycle and climate change. Glob. Chang. Biol. 2021, 27, 489–505. [Google Scholar] [CrossRef]
  5. Coleman, D.; Schuerch, M.; Temmerman, S.; Guntenspergen, G.; Smith, C.; Kirwan, M. Reconciling models and measurements of marsh vulnerability to sea level rise. Limnol. Oceanogr. Lett. 2022, 7, 140–149. [Google Scholar] [CrossRef]
  6. Molino, G.; Carr, J.; Ganju, N.; Kirwan, M. Variability in marsh migration potential determined by topographic rather than anthropogenic constraints in the Chesapeake Bay region. Limnol. Oceanogr. Lett. 2022, 7, 321–331. [Google Scholar] [CrossRef]
  7. Cai, X.; Qin, Q.; Shen, J.; Zhang, Y.J. Bifurcate responses of tidal range to sea-level rise in estuaries with marsh evolution. Limnol. Oceanogr. Lett. 2022, 7, 210–217. [Google Scholar] [CrossRef]
  8. Hu, Z.; Borsje, B.; van Belzen, J.; Willemsen, P.W.J.M.; Wang, H.; Peng, Y.; Yuan, L.; De Dominicis, M.; Wolf, J.; Temmerman, S.; et al. Mechanistic modeling of marsh seedling establishment provides a positive outlook for coastal wetland restoration under global climate change. Geophys. Res. Lett. 2021, 48, e2021GL095596. [Google Scholar] [CrossRef]
  9. Pasut, C.; Tang, F.; Hamilton, D.; Riley, W.J.; Maggi, F. Spatiotemporal assessment of GHG emissions and nutrient sequestration linked to agronutrient runoff in global wetlands. Glob. Biogeochem. Cycles 2021, 35, e2020GB006816. [Google Scholar] [CrossRef]
  10. Rietl, A.; Megonigal, J.; Herbert, E.; Kirwan, M. Vegetation type and decomposition priming mediate brackish marsh carbon accumulation under interacting facets of global change. Geophys. Res. Lett. 2021, 48, e2020GL092051. [Google Scholar] [CrossRef]
  11. Shen, X.; Jiang, M.; Lu, X.; Liu, X.; Liu, B.; Zhang, J.; Wang, X.; Tong, S.; Lei, G.; Wang, S.; et al. Aboveground biomass and its spatial distribution pattern of herbaceous marsh vegetation in China. Sci. China Earth Sci. 2021, 64, 1115–1125. [Google Scholar] [CrossRef]
  12. Shen, X.; Liu, B.; Jiang, M.; Lu, X. Marshland loss warms local land surface temperature in China. Geophys. Res. Lett. 2020, 47, e2020GL087648. [Google Scholar] [CrossRef]
  13. Hirota, M.; Tang, Y.; Hu, Q.; Hirata, S.; Kato, T.; Mo, W.; Cao, G.; Mariko, S. Carbon dioxide dynamics and controls in a deep-water wetland on the Qinghai-Tibetan Plateau. Ecosystems 2006, 9, 673–688. [Google Scholar] [CrossRef]
  14. Byomkesh, T.; Nakagoshi, N.; Md Shahedur, R. State and management of wetlands in Bangladesh. Landsc. Ecol. Eng. 2009, 5, 81–90. [Google Scholar] [CrossRef]
  15. Adam, E.; Mutanga, O.; Rugege, D. Multispectral and hyperspectral remote sensing for identification and mapping of wetland vegetation: A review. Wetl. Ecol. Manag. 2010, 18, 281–296. [Google Scholar] [CrossRef]
  16. Grünzweig, J.; De Boeck, H.; Rey, A.; Santos, M.; Adam, O.; Bahn, M.; Belnap, J.; Deckmyn, G.; Dekker, S.C.; Flores, O.; et al. Dryland mechanisms could widely control ecosystem functioning in a drier and warmer world. Nat. Ecol. Evol. 2022, 6, 1064–1076. [Google Scholar] [CrossRef]
  17. Workie, T.G.; Debella, H.J. Climate change and its effects on vegetation phenology across ecoregions of Ethiopia. Glob. Ecol. Conserv. 2018, 13, e00366. [Google Scholar] [CrossRef]
  18. Fu, B.; Lan, F.; Yao, H.; Qin, J.; He, H.; Liu, L.; Huang, L.; Fan, D.; Gao, E. Spatio-temporal monitoring of marsh vegetation phenology and its response to hydro-meteorological factors using CCDC algorithm with optical and SAR images: In case of Honghe National Nature Reserve, China. Sci. Total Environ. 2022, 843, 156990. [Google Scholar] [CrossRef]
  19. Shen, X.; Liu, B.; Xue, Z.; Jiang, M.; Lu, X.; Zhang, Q. Spatiotemporal variation in vegetation spring phenology and its response to climate change in freshwater marshes of Northeast China. Sci. Total Environ. 2019, 666, 1169–1177. [Google Scholar] [CrossRef]
  20. Hughes, L. Climate change and Australia: Trends, projections and impacts. Austral Ecol. 2003, 28, 423–443. [Google Scholar] [CrossRef]
  21. Piao, S.; Liu, Q.; Chen, A.; Janssens, I.A.; Fu, Y.; Dai, J.; Liu, L.; Lian, X.; Shen, M.; Zhu, X. Plant phenology and global climate change: Current progresses and challenges. Glob. Chang. Biol. 2019, 25, 1922–1940. [Google Scholar] [CrossRef] [PubMed]
  22. Bandoc, G.; Piticar, A.; Patriche, C.; Roșca, B.; Dragomir, E. Climate Warming-Induced Changes in Plant Phenology in the Most Important Agricultural Region of Romania. Sustainability 2022, 14, 2776. [Google Scholar] [CrossRef]
  23. Peichl, M.; Gažovič, M.; Vermeij, I.; Goede, E.; Sonnentag, O.; Limpens, J.; Mats, B. Peatland vegetation composition and phenology drive the seasonal trajectory of maximum gross primary production. Sci. Rep. 2018, 8, 8012. [Google Scholar] [CrossRef] [PubMed]
  24. Shen, X.; Jiang, M.; Lu, X. Diverse impacts of day and night temperature on spring phenology in freshwater marshes of the Tibetan Plateau. Limnol. Oceanogr. Lett. 2023, 8, 323–329. [Google Scholar] [CrossRef]
  25. Zheng, Y.; Liu, H.; Zhuo, Y.; Li, Z.; Liang, C.; Wang, L. Dynamic changes and driving factors of wetlands in Inner Mongolia Plateau, China. PLoS ONE 2019, 14, e0221177. [Google Scholar] [CrossRef]
  26. Lee, R.; Yu, F.; Price, K.P.; Ellis, J.; Shi, P. Evaluating vegetation phenological patterns in Inner Mongolia using NDVI time-series analysis. Int. J. Remote Sens. 2002, 23, 2505–2512. [Google Scholar] [CrossRef]
  27. Li, Q.; Xu, L.; Pan, X.; Zhang, L.; Li, C.; Yang, N.; Qi, J. Modeling phenological responses of Inner Mongolia grassland species to regional climate change. Environ. Res. Lett. 2016, 11, 015002. [Google Scholar] [CrossRef]
  28. Wang, G.; Huang, Y.; Wei, Y.; Zhang, W.; Li, T.; Zhang, Q. Inner Mongolian grassland plant phenological changes and their climatic drivers. Sci. Total Environ. 2019, 683, 1–8. [Google Scholar] [CrossRef]
  29. Ma, X.; Leng, P.; Liao, Q.; Geng, Y.; Zhang, X.; Shang, G.; Song, X.; Song, Q.; Li, Z.L. Prediction of vegetation phenology with atmospheric reanalysis over semiarid grasslands in Inner Mongolia. Sci. Total Environ. 2022, 812, 152462. [Google Scholar] [CrossRef]
  30. Qiao, D.; Wang, N. Relationship between winter snow cover dynamics, climate and spring grassland vegetation phenology in inner Mongolia, China. ISPRS Int. J. Geo-Inf. 2019, 8, 42. [Google Scholar] [CrossRef]
  31. Sha, Z.; Zhong, J.; Bai, Y.; Tan, X.; Li, J. Spatio-temporal patterns of satellite-derived grassland vegetation phenology from 1998 to 2012 in Inner Mongolia, China. J. Arid Land 2016, 8, 462–477. [Google Scholar] [CrossRef]
  32. Ren, S.; Yi, S.; Peichl, M.; Wang, X. Diverse responses of vegetation phenology to climate change in different grasslands in Inner Mongolia during 2000–2016. Remote Sens. 2017, 10, 17. [Google Scholar] [CrossRef]
  33. Liu, Y.; Shen, X.; Wang, Y.; Zhang, J.; Ma, R.; Lu, X.; Jiang, M. Spatiotemporal variation in aboveground biomass and its response to climate change in the marsh of Sanjiang Plain. Front. Plant Sci. 2022, 13, 1973. [Google Scholar] [CrossRef]
  34. Shen, X.; Liu, B.; Henderson, M.; Wang, L.; Wu, Z.; Wu, H.; Jiang, M.; Lu, X. Asymmetric effects of daytime and nighttime warming on spring phenology in the temperate grasslands of China. Agric. For. Meteorol. 2018, 259, 240–249. [Google Scholar] [CrossRef]
  35. Shen, X.; Liu, Y.; Zhang, J.; Wang, Y.; Ma, R.; Liu, B.; Lu, X.; Jiang, M. Asymmetric impacts of diurnal warming on vegetation carbon sequestration of marshes in the Qinghai Tibet Plateau. Glob. Biogeochem. Cycles 2022, 36, e2022GB007396. [Google Scholar] [CrossRef]
  36. Hu, Q.; Pan, F.; Pan, X.; Zhang, D.; Li, Q.; Pan, Z.; Wei, Y. Spatial analysis of climate change in Inner Mongolia during 1961–2012, China. Appl. Geogr. 2015, 60, 254–260. [Google Scholar] [CrossRef]
  37. Cui, L.; Shi, J. Evaluation and comparison of growing season metrics in arid and semi-arid areas of northern China under climate change. Ecol. Indic. 2021, 121, 107055. [Google Scholar] [CrossRef]
  38. Gong, Z.; Kawamura, K.; Ishikawa, N.; Goto, M.; Wulan, T.; Alateng, D.; Yin, T.; Ito, Y. MODIS normalized difference vegetation index (NDVI) and vegetation phenology dynamics in the Inner Mongolia grassland. Solid Earth 2015, 6, 1185–1194. [Google Scholar] [CrossRef]
  39. Deutsch, E.; Bork, E.; Willms, W. Separation of grassland litter and ecosite influences on seasonal soil moisture and plant growth dynamics. Plant Ecol. 2010, 209, 135–145. [Google Scholar] [CrossRef]
  40. Shen, X.; Xue, Z.; Jiang, M.; Lu, X. Spatiotemporal change of vegetation coverage and its relationship with climate change in freshwater marshes of Northeast China. Wetland 2019, 39, 429–439. [Google Scholar] [CrossRef]
  41. Li, X.; Guo, W.; Chen, J.; Ni, X.; Wei, X. Responses of vegetation green-up date to temperature variation in alpine grassland on the Tibetan Plateau. Ecol. Indic. 2019, 104, 390–397. [Google Scholar] [CrossRef]
  42. Post, A.; Hufkens, K.; Richardson, A. Predicting spring green-up across diverse North American grasslands. Agric. For. Meteorol. 2022, 327, 109204. [Google Scholar] [CrossRef]
  43. Liu, Q.; Fu, Y.H.; Zeng, Z.; Huang, M.; Li, X.; Piao, S. Temperature, precipitation, and insolation effects on autumn vegetation phenology in temperate China. Glob. Chang. Biol. 2016, 22, 644–655. [Google Scholar] [CrossRef] [PubMed]
  44. Ma, R.; Shen, X.; Zhang, J.; Xia, C.; Liu, Y.; Wu, L.; Wang, Y.; Jiang, M.; Lu, X. Variation of vegetation autumn phenology and its climatic drivers in temperate grasslands of China. Int. J. Appl. Earth Obs. 2022, 114, 103064. [Google Scholar] [CrossRef]
  45. Chen, K.; Ge, G.; Bao, G.; Bai, L.; Tong, S.; Bao, Y.; Chao, L. Impact of Extreme Climate on the NDVI of Different Steppe Areas in Inner Mongolia, China. Remote Sens. 2022, 14, 1530. [Google Scholar] [CrossRef]
  46. Ma, W.; Liu, Z.; Wang, Z.; Wang, W.; Liang, C.; Tang, Y.; He, J.; Fang, J. Climate change alters interannual variation of grassland aboveground productivity: Evidence from a 22-year measurement series in the Inner Mongolian grassland. J. Plant Res. 2010, 123, 509–517. [Google Scholar] [CrossRef]
  47. Wu, Z.; Dijkstra, P.; Koch, G.W.; Peñuelas, J.; Hungate, B.A. Responses of terrestrial ecosystems to temperature and precipitation change: A meta-analysis of experimental manipulation. Glob. Chang. Biol. 2011, 17, 927–942. [Google Scholar] [CrossRef]
  48. Shen, M.; Tang, Y.; Chen, J.; Zhu, X.; Zheng, Y. Influences of temperature and precipitation before the growing season on spring phenology in grasslands of the central and eastern Qinghai-Tibetan Plateau. Agric. For. Meteorol. 2011, 151, 1711–1722. [Google Scholar] [CrossRef]
  49. Pertille, R.; Citadin, I.; de Oliveira, L.; de Camargo, B.; Kvitschal, M.; Araujo, L. The influence of temperature on the phenology of apple trees grown in mild winter regions of Brazil, based on long-term records. Sci. Hortic. 2022, 305, 111354. [Google Scholar] [CrossRef]
  50. Piao, S.; Tan, J.; Chen, A.; Fu, Y.H.; Ciais, P.; Liu, Q.; Janssens, I.; Vicca, S.; Zeng, Z.; Jeong, S.; et al. Leaf onset in the northern hemisphere triggered by daytime temperature. Nat. Commun. 2015, 6, 6911. [Google Scholar] [CrossRef]
  51. Rina, W.; Bao, G.; Tong, S.; Bao, Y.; Shan, Y.; Huang, X.; Ying, H.; Du, L. Multi-Climate Factors and the Preceding Growth Stage of Vegetation Co-Regulated the Variation of the End of Growing Season in Northeast Inner Mongolia, China. IEEE Access 2020, 8, 221525–221538. [Google Scholar] [CrossRef]
  52. Shen, X.; Liu, B.; Jiang, M.; Wang, Y.; Wang, L.; Zhang, J.; Lu, X. Spatiotemporal change of marsh vegetation and its response to climate change in China from 2000 to 2019. J. Geophys. Res. Biogeosci. 2021, 126, e2020JG006154. [Google Scholar] [CrossRef]
  53. Trumble, J.; Kolodny-Hirsch, D.; Ting, I. Plant compensation for arthropod herbivory. Annu. Rev. Entomol. 1993, 38, 93–119. [Google Scholar] [CrossRef]
  54. Board, J. Light interception efficiency and light quality affect yield compensation of soybean at low plant populations. Crop Sci. 2000, 40, 1285–1294. [Google Scholar] [CrossRef]
  55. Belsky, A. Does herbivory benefit plants? A review of the evidence. Am. Nat. 1986, 127, 870–892. [Google Scholar] [CrossRef]
  56. Hawkes, C.V.; Sullivan, J.J. The impact of herbivory on plants in different resource conditions: A meta-analysis. Ecology 2001, 82, 2045–2058. [Google Scholar] [CrossRef]
  57. Wan, S.; Xia, J.; Liu, W.; Niu, S. Photosynthetic overcompensation under nocturnal warming enhances grassland carbon sequestration. Ecology 2009, 90, 2700–2710. [Google Scholar] [CrossRef]
  58. Yang, L.; Kirby, J.E.; Sunwoo, H.; Lee, J.T. Female mice lacking Xist RNA show partial dosage compensation and survive to term. Genes Dev. 2016, 30, 1747–1760. [Google Scholar] [CrossRef]
  59. Pei, Z.; Fang, S.; Yang, W.; Wang, L.; Wu, M.; Zhang, Q.; Han, W.; Khoi, D. The relationship between NDVI and climate factors at different monthly time scales: A case study of grasslands in inner Mongolia, China (1982–2015). Sustainability 2019, 11, 7243. [Google Scholar] [CrossRef]
  60. Piao, S.; Fang, J.; Zhou, L.; Ciais, P.; Zhu, B. Variations in satellite-derived phenology in China’s temperate vegetation. Glob. Chang. Biol. 2006, 12, 672–685. [Google Scholar] [CrossRef]
  61. Huang, W.; Ge, Q.; Wang, H.; Dai, J. Effects of multiple climate change factors on the spring phenology of herbaceous plants in Inner Mongolia, China: Evidence from ground observation and controlled experiments. Int. J. Climatol. 2019, 39, 5140–5153. [Google Scholar] [CrossRef]
  62. Tong, S.; Li, X.; Zhang, J.; Bao, Y.; Bao, Y.; Na, L.; Si, A. Spatial and temporal variability in extreme temperature and precipitation events in Inner Mongolia (China) during 1960–2017. Sci. Total Environ. 2019, 649, 75–89. [Google Scholar] [CrossRef] [PubMed]
  63. Fang, X.; Wu, J.; He, C. Assessing human-environment system sustainability based on Regional Safe and Just Operating Space: The case of the Inner Mongolia Grassland. Environ. Sci. Policy 2021, 116, 276–286. [Google Scholar] [CrossRef]
  64. Mao, D.; Wang, Z.; Du, B.; Li, L.; Tian, Y.; Jia, M.; Zeng, Y.; Song, K.; Jiang, M.; Wang, Y. National wetland mapping in China: A new product resulting from object based and hierarchical classification of Landsat 8 OLI images. ISPRS J. Photogramm. 2020, 164, 11–25. [Google Scholar] [CrossRef]
  65. Yang, Y.; Guan, H.; Shen, M.; Liang, W.; Jiang, L. Changes in autumn vegetation dormancy onset date and the climate controls across temperate ecosystems in China from 1982 to 2010. Glob. Chang. Biol. 2015, 21, 652–665. [Google Scholar] [CrossRef]
  66. Zhou, X.; Geng, X.; Yin, G.; Hänninen, H.; Hao, F.; Zhang, X.; Fu, Y.H. Legacy effect of spring phenology on vegetation growth in temperate China. Agric. For. Meteorol. 2020, 281, 107845. [Google Scholar] [CrossRef]
  67. Fan, J.; Min, J.; Yang, Q.; Na, J.; Wang, X. Spatial-Temporal Relationship Analysis of Vegetation Phenology and Meteorological Parameters in an Agro-Pasture Ecotone in China. Remote Sens. 2022, 14, 5417. [Google Scholar] [CrossRef]
Figure 1. Distributions of the long-term mean (a,c,e) and change trends (b,d,f) of marsh vegetation SOS, EOS, and LOS in Inner Mongolia during 2001–2020.
Plants 12 02072 g001
Figure 2. Temporal variations in SOS (a), EOS (b), and LOS (c) of marshes in Inner Mongolia during 2001–2020.
Plants 12 02072 g002
Figure 3. Correlations between vegetation SOS (a), EOS (b), LOS (c) and seasonal climate factors (precipitation, Tmean, Tmax, and Tmin) in marshes of Inner Mongolia during 2001–2020. ** and * mean significant at p < 0.01 and 0.05, respectively.
Plants 12 02072 g003
Figure 4. Relationships between SOS and temperatures (Tmean, Tmax, and Tmin) in winter and spring in the marshes of Inner Mongolia during 2001–2020.
Plants 12 02072 g004
Figure 5. Relationships between EOS and temperatures (Tmean, Tmax, and Tmin) in winter and spring in marshes of Inner Mongolia during 2001–2020.
Plants 12 02072 g005
Figure 6. Relationships between LOS and temperatures (Tmean, Tmax, and Tmin) in winter and spring in marshes of Inner Mongolia during 2001–2020.
Plants 12 02072 g006
Figure 7. Change trends of precipitation (mm/decade) in different seasons in marshes of Inner Mongolia during 2001–2020.
Plants 12 02072 g007
Figure 8. Change trends of average temperatures (°C/decade) in different seasons in marshes of Inner Mongolia during 2001–2020.
Plants 12 02072 g008
Figure 9. Change trends of maximum temperatures (°C/decade) in different seasons in the marshes of Inner Mongolia during 2001–2020.
Plants 12 02072 g009
Figure 10. Change trends of minimum temperatures (°C/decade) in different seasons in marshes of Inner Mongolia during 2001–2020.
Plants 12 02072 g010
Figure 11. Spatial distributions of marshes and climate stations in Inner Mongolia.
Plants 12 02072 g011
Table 1. Correlation coefficients between vegetation phenology and climate variables (precipitation, Tmean, Tmax, and Tmin) in marshes of Inner Mongolia during 2001–2020.
SOSEOSLOS
PrecipitationTmeanTmaxTminPrecipitationTmeanTmaxTminPrecipitationTmeanTmaxTmin
January−0.029−0.422 *−0.443 *−0.387−0.0210.2590.2380.2760.0120.458 *0.464 *0.439 *
February−0.083−0.272−0.328−0.2510.0530.1330.1050.1400.0910.2780.3070.265
March0.338−0.691 **−0.734 **−0.618 **−0.1210.1390.1520.100−0.3230.606 **0.646 **0.530 *
April0.202−0.530 *−0.567 **−0.363−0.192−0.050−0.025−0.134−0.2530.3870.428 *0.215
May−0.207−0.081−0.072−0.1410.247−0.187−0.099−0.2060.285−0.0310.0060.006
June−0.1850.1130.149−0.070−0.3130.2170.284−0.046−0.017−0.039−0.006−0.118
July−0.190−0.308−0.333−0.1470.0040.2720.2750.1410.0100.3240.3270.226
August−0.332−0.1340.068−0.3050.2180.1970.0360.454 *0.566 **−0.097−0.3280.486 *
September−0.277−0.0650.056−0.183−0.0560.4080.2980.3000.2200.2120.0380.321
October−0.1680.1920.1090.224−0.2030.2450.3170.0930.290−0.058−0.058−0.068
November0.310−0.220−0.235−0.1790.136−0.104−0.088−0.118−0.1730.1190.1380.080
December0.332−0.459 *−0.483*−0.446 *−0.1200.0110.025−0.013−0.3180.3620.3880.340
** and * mean significant at p < 0.01 and 0.05, respectively.
Table 2. Change trends of seasonal and monthly precipitation (mm/year), Tmean (°C/year), Tmax (°C/year), and Tmin (°C/year) in marshes of Inner Mongolia during 2001–2020.
PrecipitationTmeanTmaxTmin
Spring0.0580.0600.0830.030
Summer1.527 *0.047−0.0240.034
Autumn0.788 *0.002−0.0230.027
Winter−0.0010.0310.0320.028
January−0.0550.0380.0460.032
February0.0890.0060.0050.006
March−0.1510.0980.1230.066
April−0.4340.0390.075−0.018
May0.7570.0420.0510.042
June0.750−0.040−0.059−0.009
July0.5900.0420.0540.035
August3.240 **−0.010−0.0670.078 **
September1.990 *0.011−0.0380.072 *
October0.266−0.017−0.018−0.013
November0.1090.012−0.0120.023
December−0.0930.0110.0120.008
** and * mean significant at p < 0.01 and 0.05, respectively.
Disclaimer/Publisher’s Note: The statements, opinions and data contained in all publications are solely those of the individual author(s) and contributor(s) and not of MDPI and/or the editor(s). MDPI and/or the editor(s) disclaim responsibility for any injury to people or property resulting from any ideas, methods, instructions or products referred to in the content.